Embed Size (px)
Citation preview

Chapter 2
Fourier Series & Fourier Transform Updated:2/11/15

Outline • Systems and frequency domain representation • Fourier Series and different representation of FS • Fourier Transform and Spectra • Power Spectral Density and Autocorrelation Function • Orthogonal Series Representation of Signals and Noise • Linear Systems • Bandlimited Signals and Noise • Discrete Fourier Transform

A System View • System Classification
– Stable (BIBO) – Causal (independent of future) – Linear (superposition principle) – Memory-less (no dependency on past or future) – Time Invariant (time shift in inputà similar time shift in output)
• We are primarily interested in LTI system

Frequency Representation • Systems are modeled in time domain • Often it is easier to learn about certain characteristics of a system when signals
are expressed in frequency domain

Frequency Domain • One way to represent a signal in frequency main is to use
Fourier representation – Fourier Series – Periodic waveforms – Fourier Transform – Aperiodic waveform with finite energy (periodic
signal with infinite period)
• Fourier Series can be expressed – Exponential FS – Trigonometric FS
• Expressing signals in frequency domain involves – magnitude & Phase

Exponential Fourier Series (Periodic Signals)
(Avg Pwr)
Notes: • Cn is the FS coefficients
• W(t) is periodic: = ….+C-1e+jnwot+C0+C+1e-jnwot+…..
• Cn is pahsor form of Spectral components
• Cn (phasor) has phase and magnitude |Cn| & |_ Cn

Fundamental Freq. & Other Harmonics • We can represent all periodic signals as harmonic series of
the form – Cn are the Fourier Series Coefficients & n is real – n=0 à Cn=o which is the DC signal component – n=+/-1 yields the fundamental frequency or the first harmonic ω0 – |n|>=2 harmonics
FOR PERIODIC SINUSOIDAL SIGNALS:

Fourier Series and Frequency Spectra
• We can plot the frequency spectrum or line spectrum of a signal – In Fourier Series n represent harmonics – Frequency spectrum is a graph that shows the amplitudes and/or
phases of the Fourier Series coefficients Cn. • Phase spectrum φn • The lines |Cn| are called line spectra because we indicate the
values by lines
|Cn|
n

Exponential Fourier Series (Properties)

Fourier Series (Average Power for xp(t))
Remember: Pav = <V(t)2/R>
Using Pareseval’s Theorem:

Different Forms of Fourier Series • Fourier Series representation has different forms:
Quadrature Form
Polar Form
What is the relationship between them?à Finding the coefficients!
Note that n=k

Fourier Series in Quadrature & Polar Forms
Slightly different notations! Note that n=k
Also Known as Trigonometric Form Also Known as Combined Trigonometric Form

Important Relationships • Euler’s Relationship
– Review Euler formulas

Examples of FS (A) • Find Fourier Series
Coefficients for
• Find Fourier Series Coefficients for
Remember:

Example of FS (B) (Line Spectrum of a Rectangular Pulse Train)
See next slide
jπnfoτ jπnfoττ/2
-τ/2

Example of FS (B-Cont.)
n=4
Note: If τ=To/4=1/4fo
Ck =τTosinc(πnfoτ ) =
τTosinc(πn / 4)
Notes: sinc (infinity) à 0 Max value of sinc(0)=1 sinc (n.pi) = 0; n is integer>0 |Picks| occurs at sinc[n(2pi+pi/2)]
Envelope Ck =
τTosinc(πn / 4)
Phase Representation- 0, 180 deg. Change!
180 Deg. Phase change
It is possible to show the Mathematical representation Of the frequency spectra as the following:
Magnitude Two-Sided Spectrum
Applet to plot sinc function: http://mathworld.wolfram.com/SincFunction.html

Example of FS (B2) Note that in this case there is no time-shift:

PSD of a Periodic Square Waveform
Make sure you know the difference between Frequency Spectrum, Magnitude Frequency Spectrum, and Power Spectral Density
Using Example of FS (B2)

Example of FS (C) – A different Approach • Note that here we are using quadrature form of amplitude
shifted version of v(t):
Note that N=n; T=To
Even function
Odd function
vsqr _bipolar _ even (t) = 2V sinc(Nπ / 2)N=odd
∞
∑ cos(Nωt)
Do it!

A Closer Look at the Quadrature Form of FS • Consider the following quadrature FS representation of an
odd square waveform with no offset:
Thus: Cn = 4V/Nπ
N=1 freq=f=1/T
3 3f
5 5f
7 7f
4V/π
4V/3π
4V/5π
4V/7π Magnitude Frequency Spectrum W(f)=FS[v(t)] N represents the Harmonic NUMBER
Nà fà
So 3f represents the third harmonic number

Generating an Square Wave
Frequency Components of Square Wave
N=1,3,5 N=1,3,5, 7
N=1,3,5, 7, 9, ….. Fourier Expansion
This is how the time-domain waveform of the first 7 harmonics looks like!

What Is the FS of A Pulse Signal?
Note that the width of the pulse can change!
Magnitude Line Spectra of the pulse signal – note that the envelope is a sinc ( ) function!
What happens to the envelope as the pulse gets smaller?
10=1/τ 20=2/τ 30=3/τ
0.25=τ/Τ
v(t) = 2VτTo
sinc(N2π foTo
)N=1
∞
∑ cos(Nπ t)

Bandlimiting Effects on Signals • All communication systems have
some finite bandwidth • Sufficient BW must be
guaranteed to reserve the signal integrity
1 KHz Square Wave
1 KHz Square Wave – band-limited to 8KHz
1 KHz Square Wave – band-limited to 6KHz
1 KHz Square Wave – band-limited to 4KHz
1 KHz Square Wave – band-limited to 2KHz
First Harmonic
First & 3rd Harmonics
1st, 3rd, & 5th Harmonics
v(t) = V sinc(Nπ / 2)N=odd
∞
∑ cos(Nωt)
A waveform w(t) is said to be (absolutely) bandlimited to B hertz if W(f) = F[w(t)] = 0, for |fo| >or = B
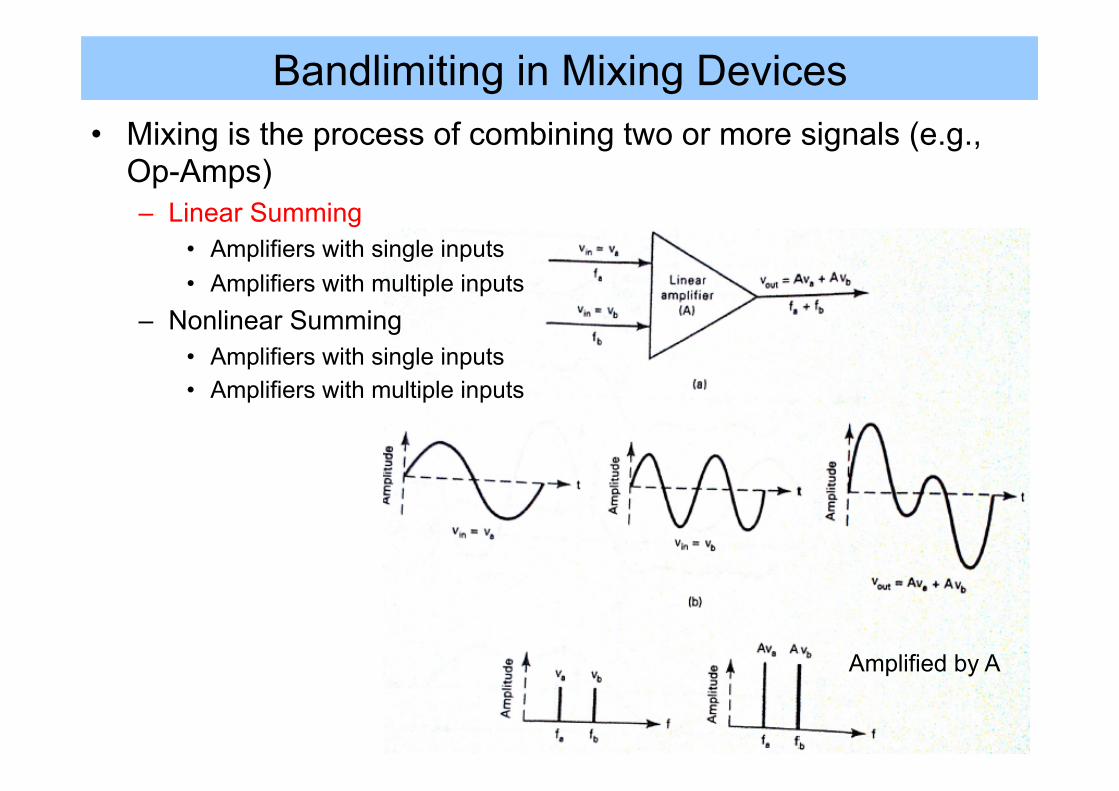
Bandlimiting in Mixing Devices • Mixing is the process of combining two or more signals (e.g.,
Op-Amps) – Linear Summing
• Amplifiers with single inputs • Amplifiers with multiple inputs
– Nonlinear Summing • Amplifiers with single inputs • Amplifiers with multiple inputs
Amplified by A

Bandlimiting in Mixing Devices • Mixing is the process of combining two or more signals (e.g.,
Op-Amps) – Linear Summing
• Amplifiers with single inputs • Amplifiers with multiple inputs
– Nonlinear Summing • Amplifiers with single inputs • Amplifiers with multiple inputs
vout = Avin +Bvin2 +Cvin
3
vin =Va sin(2π fat)+Vb sin(2π fbt)−− > vout = A(Va sin(2π fat)+Vb sin(2π fbt))+B(Va sin(2π fat)+Vb sin(2π fbt))
2
+C(Va sin(2π fat)+Vb sin(2π fbt))3
For nonlinear case an infinite number of harmonic frequencies are produced! If these cross-products are undesired à we call them intermodulation distortion! If these cross-products are desired à we call them modulation!
Cross-Products = m.fa +/- n.fb
Cross-Products

Example • Assume we have a nonlinear system receiving two tones
with frequencies of 5KHz and 7 KHz. Plot the output frequency spectrum for the first three harmonics (assume m & n can each be 1 & 2).
– Fundamental frequencies (first harmonic): 5KHz & 7KHz – Harmonics:
• Second harmonic: 10KHz & 14KHz • Third harmonic: 15KHz & 21KHz
– Cross-Products = m.fa +/- n.fb • n=1 & m=1 à 5+/-7=12KHz & 2KHz • n=1 & m=2 à 5+/-14=9KHz & 19KHz • n=2 & m=1 à 10+/-7=3KHz & 17KHz • n=2 & m=2 à 10+/-14=24KHz & 4KHz
All together there are 14 frequencies on the frequency spectrum!

Exercises Related to FS • Review Schaum’s Outline Chapter 1

Fourier Transform (1) • How can we represent a waveform?
– Time domain – Frequency domain à rate of occurrences
• Fourier Transform (FT) is a mechanism that can find the frequencies w(t):
• W(f) is the two-sided spectrum of w(t) à positive/neg. freq. • W(f) is a complex function:
• Time waveform can be obtained from spectrum using Inverse FT
Quadrature Components
Phasor Components
Remember: Fourier Series:

Fourier Transform (2) • Thus, Fourier Transfer Pair: w(t) ßà W(f) • W(t) is Fourier transformable if it satisfies the Dirichlet
conditions (sufficient conditions): – Over a finite time interval w(t), is single valued with a finite number of Max & Min, & discontinuities.
* dir-i-kley

Dirac Delta and Unit Step Functions
Shifting Property of Delta Function
u(t)
Note that
* dih-rak
(Unit impulse)

FT of Signum Functions

FT of Unit Step

FT Examples (1)
NEXTà See Appendix A of the Textbook!
Note that in general:
In our case, to = 0 and f(to) =1
Pay attention!

FT Example (2)
Magnitude-Phase Form:
Note: Pay attention to how the equations are setup!

Phase Difference & Time Delay What does time delay have to do with phase angle?

Other FT Properties
Find FT of w(t)sin(wct)!
w(t)sin(wct) = w(t)*(cos(wct-90)) = ½ [e^-90] W(f-fc) + [e^+90] W(f+fc]=½ [-j] W(f-fc) +[ j] W(f+fc]

Spectrum of A Sinusoid • Given v(t) = Asin(wot) the following function plot the
magnitude spectrum and phase Spectrum of v(t): |v(f)| & θ(f)
v(t)
Note that V(f) is purely imaginary à When f>0, then θ(f)= -π/2 à When f<0, then θ(f)= +π/2
Similar to FT for DC waveform Example

Other Fourier Transform Pairs (1)
Sa stands for Sampling Function
Note: sinc (0) à 1 & Max value of sinc(x)à1/x

Other Fourier Transform Pairs (2)
Using Duality Property
Note:

Other Fourier Transform Pairs (3)

Examples
For 8sin(6πt), we have:
Using time delay property
Note: 2πfo=2π(3)
For what freq. W(f) has its max?
See the Gaussian Exponential One-sided Property! (T=1/2)

Plotting Magnitude and Phase Spectrum

Spectrum of Rectangular Pulses
What is w(t)?

Spectrum of Rectangular Pulses

Spectrum of a Switched Sinusoid
Waveform of a switch sinusoid can be represented as follow:
The frequency domain representation of w(t) will be:
Note that the spectrum of w(t) is imaginary!
Magnitude Spectrum of w(t)
As TàINF, 1/Tà 0, then Sa waveform converges to a double-sided delta waveform

Alternative Tools
arg(1/(1+ix)); -100<x<100 magnitude(1/(1+ix));
http://www.wolframalpha.com/input/?i=magnitude%281%2F%281%2Bix%29%29%3B+
• Try the following:
http://home.fuse.net/clymer/graphs/fourier.html
• Another very interesting tool to demonstrate FT:
Try the following: - sin(10*x)+sin(100*x) - sin(10*x)+sin(100*x) - exp(0.05*x)*sin(100*x)
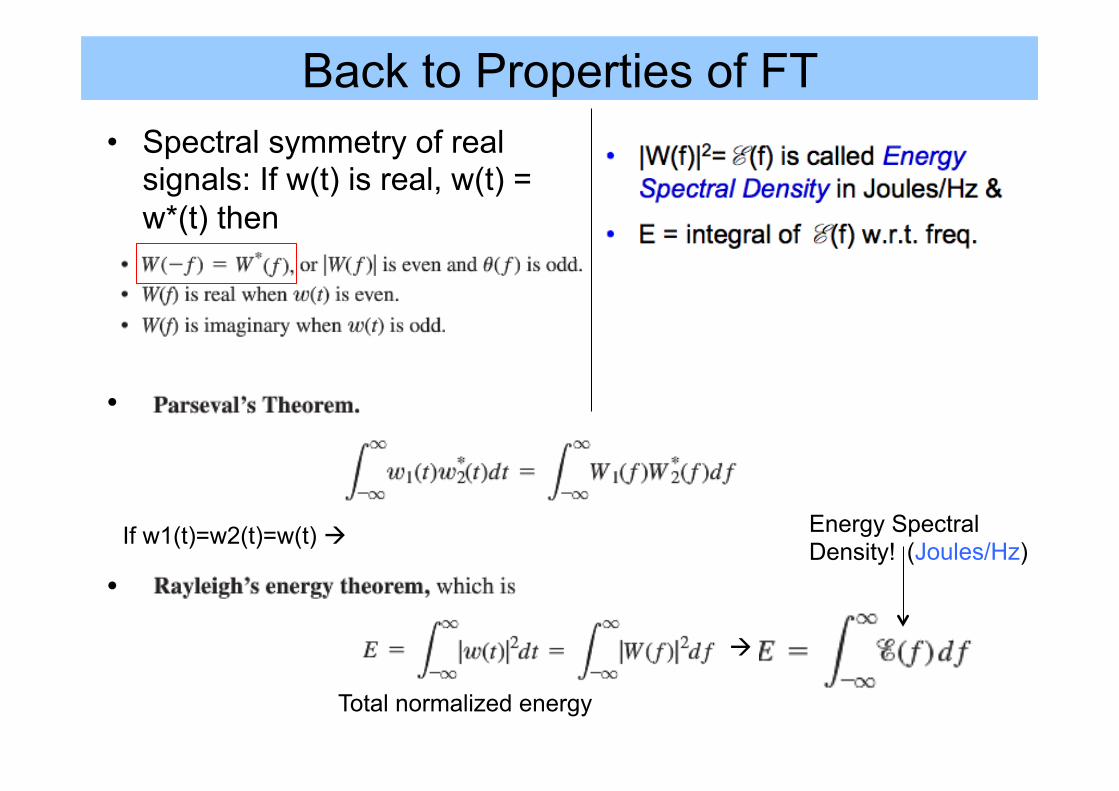
Back to Properties of FT • Spectral symmetry of real
signals: If w(t) is real, w(t) = w*(t) then
• Svcv
• dfdf
If w1(t)=w2(t)=w(t) à
à
Energy Spectral Density! (Joules/Hz)
Total normalized energy

Power Spectral Density • How the power content of signals and noise is distributed over different
frequencies • Useful in describing how the power content of signal with noise is affected by
filters & other devices • Important properties:
– PSD is always a real nonnegative function of frequency – PSD is not sensitive to the phase spectrum of w(t) – due to absolute value operation – If the PSD is plotted in dB units, the plot of the PSD is identical to the plot of the
Magnitude Spectrum in dB units – PSD has the unit of watts/Hz (or, equivalently, V2/Hz or A2/Hz)
• WT(t) is the truncated version of the signal:
Direct Method!
Any other way we can find PSD?à
=Wrms2

Autocorrelation Function
avg PSD
Direct Method!
Indirect Method!

Example: Power Spectrum of a Sinusoid Find the PSD of
Method 2: using the indirect method (finding the autocorrelation):
• We can verify this by

Orthogonal & Orthonormal Functions
& Kn = 1
Note that if Kn is any constant other than unity, then the functions are not orthonormal!
Over some interval a & b Orthogonal functions are independent, in disagreement, unlikely!

Example
Can you show this?
Seems like two functions are always orthogonal!!!!

Orthogonal Series
Note that an and φn(t) are orthogonal
w(t) à orthogonal series à

Example • Are sets of complex exponential functions ( ) over the
interval a<t<b=a+To, wo=2π/To orthogonal? Are they orthonormal?

References • Leon W. Couch II, Digital and Analog Communication
Systems, 8th edition, Pearson / Prentice, Chapter 1 • M. Farooque Mesiya, Contemporary Communication
Systems, 2012 – Chapter 2 • Electronic Communications System: Fundamentals Through
Advanced, Fifth Edition by Wayne Tomasi – Chapter 2 (https://www.goodreads.com/book/show/209442.Electronic_Communications_System)