Embed Size (px)
DESCRIPTION
Section 1. Chapter 2. Standards of Measurements. Standard Exact quantity that people agree to use SI System International System of Units & Measurements AKA Metric System Improved version of the metric system Base 10 number system - PowerPoint PPT Presentation
Citation preview

Chapter 2Section 1
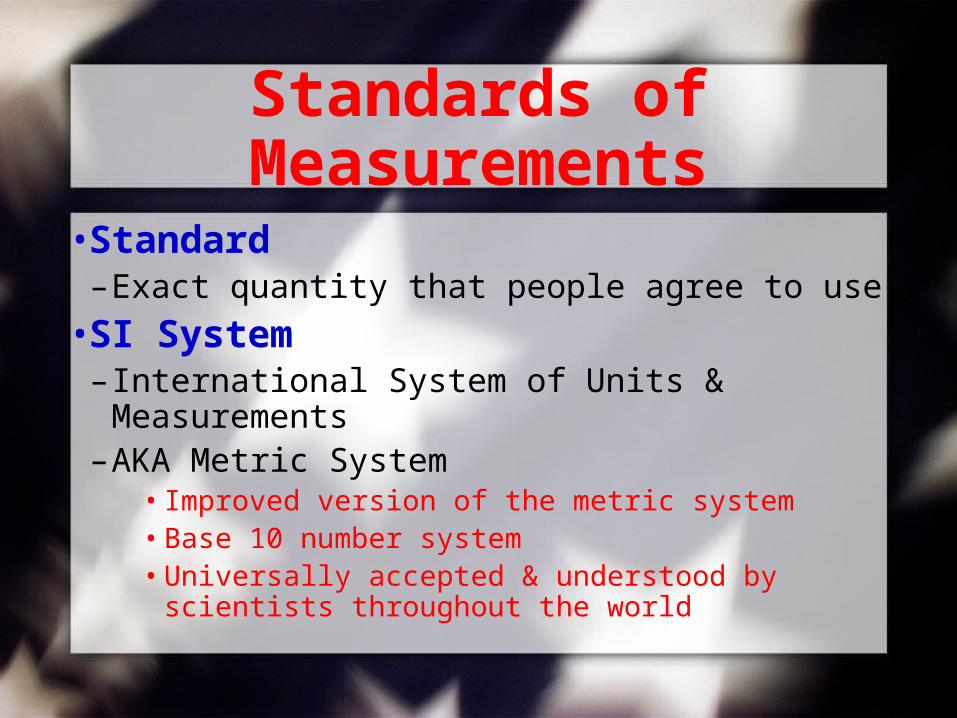
Standards of Measurements
•Standard–Exact quantity that people agree to use
•SI System–International System of Units & Measurements–AKA Metric System
• Improved version of the metric system• Base 10 number system• Universally accepted & understood by scientists
throughout the world
Types of Units
• Base Units–Units from which ALL other
units are made (derived)
• Derived units–Combinations of base units
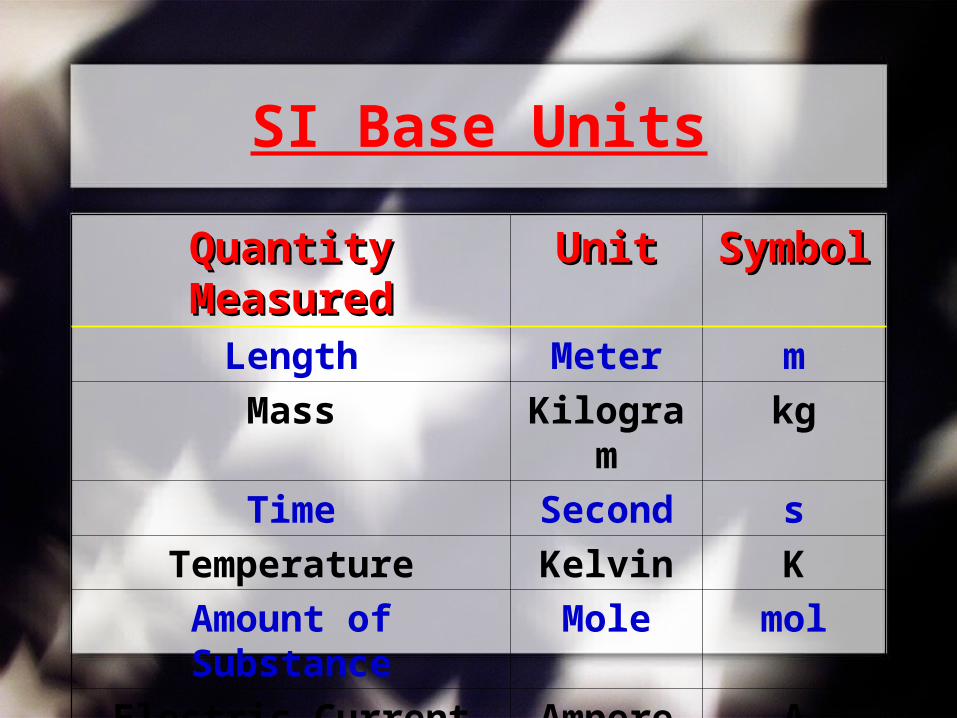
SI Base Units
Quantity MeasuredQuantity Measured UnitUnit SymbolSymbolLength Meter m
Mass Kilogram kg
Time Second s
Temperature Kelvin K
Amount of Substance Mole mol
Electric Current Ampere A
Intensity of Light Candela cd
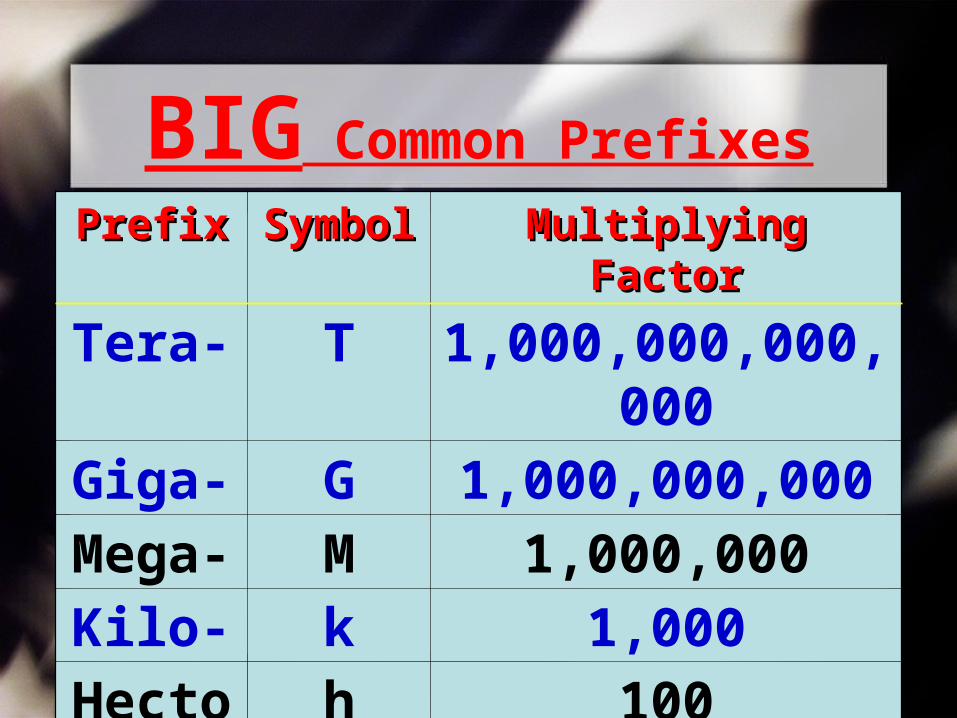
BIG Common Prefixes
PrefixPrefix SymbolSymbol Multiplying FactorMultiplying Factor
Tera- T 1,000,000,000,000Giga- G 1,000,000,000Mega- M 1,000,000Kilo- k 1,000
Hecto- h 100Deka dk 10
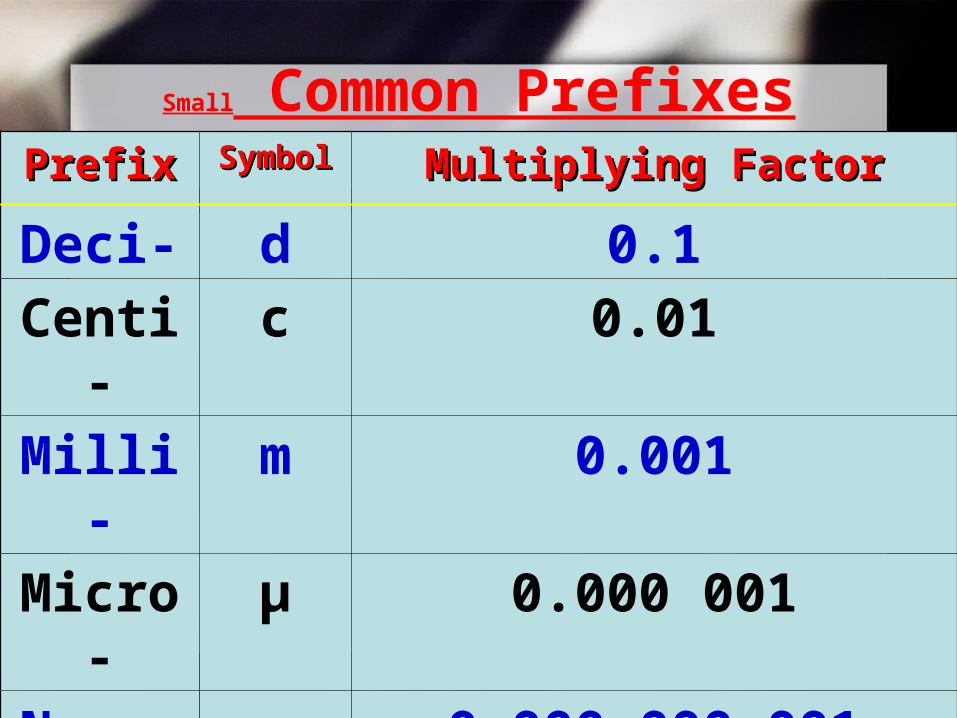
Small Common PrefixesPrefixPrefix SymbolSymbol Multiplying FactorMultiplying Factor
Deci- d 0.1Centi- c 0.01Milli- m 0.001
Micro- μ 0.000 001Nano- n 0.000 000 001Pico- p 0.000 000 000 001
Femto- f 0.000 000 000 000 001
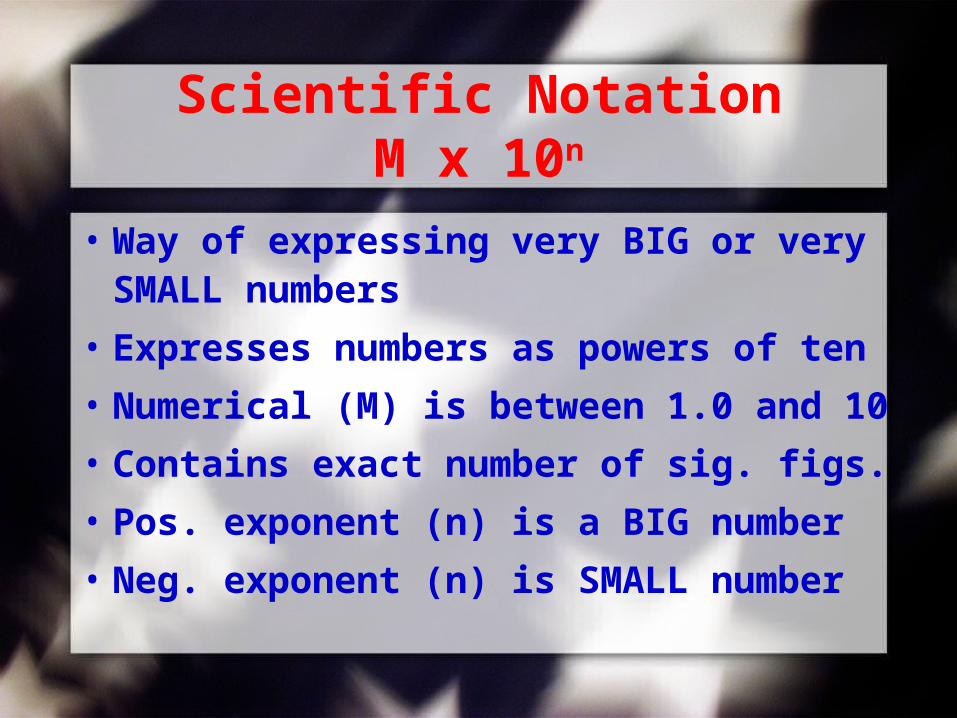
Scientific NotationM x 10n
• Way of expressing very BIG or very SMALL numbers
• Expresses numbers as powers of ten
• Numerical (M) is between 1.0 and 10
• Contains exact number of sig. figs.
• Pos. exponent (n) is a BIG number
• Neg. exponent (n) is SMALL number
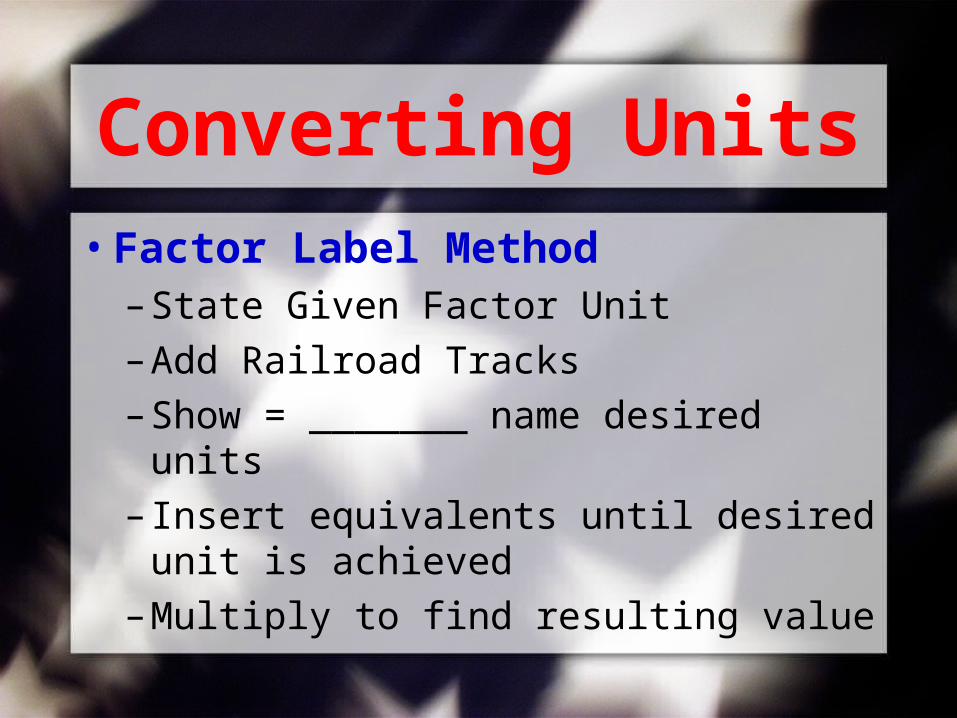
Converting Units• Factor Label Method
– State Given Factor Unit
– Add Railroad Tracks
– Show = _______ name desired units
– Insert equivalents until desired unit is achieved
– Multiply to find resulting value
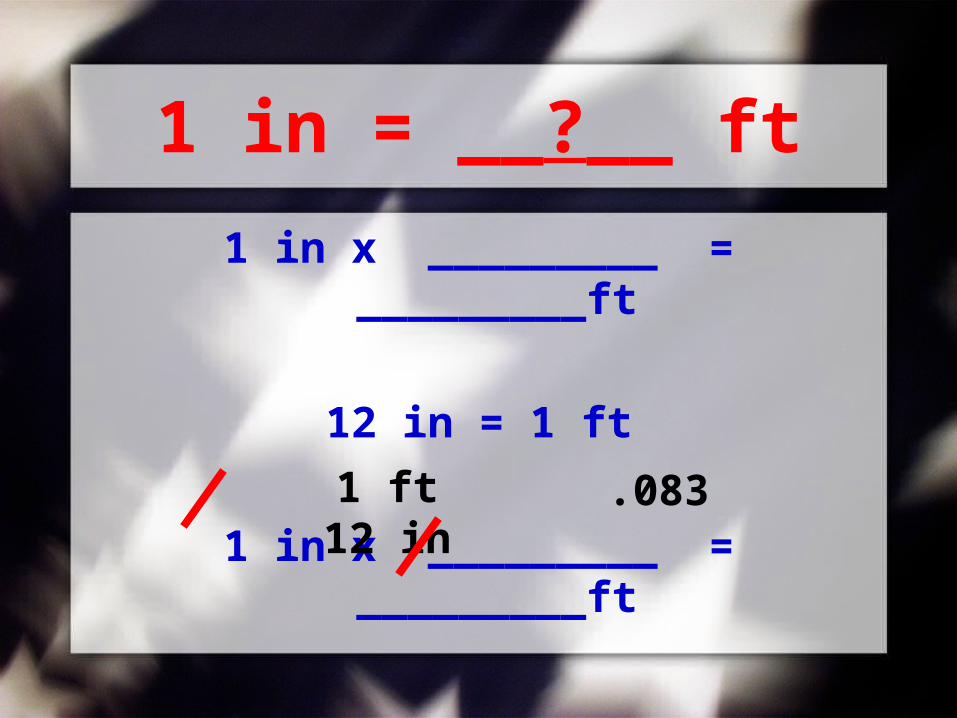
1 in = __?__ ft
1 in x _________ = _________ft
12 in = 1 ft
1 in x _________ = _________ft1 ft12 in
.083

Chapter 2Section 2
Precision vs. Accuracy
• Precision– Describes the degree of exactness of a
measure
• Accuracy– Describes how well the results of an
experiment agree with the standard value
• Parallax–The apparent shift in the position of an object when it is viewed from different angles.
Sig Figs• Nonzero digits are always significant• Zeros between 2 other sig figs are
always significant (sandwich rule)• After a decimal point, the LAST or
FINAL digit is significant (little piggy)
• Zeros that are placeholders are NOT significant
• When adding with sig figs– In the FINAL answer…Use same number
of decimal places as the least precise item being added
• When multiplying with sig figs– In the FINAL answer…Use the same
number of sig figs as the least of the items being multiplied

Chapter 2Section 3
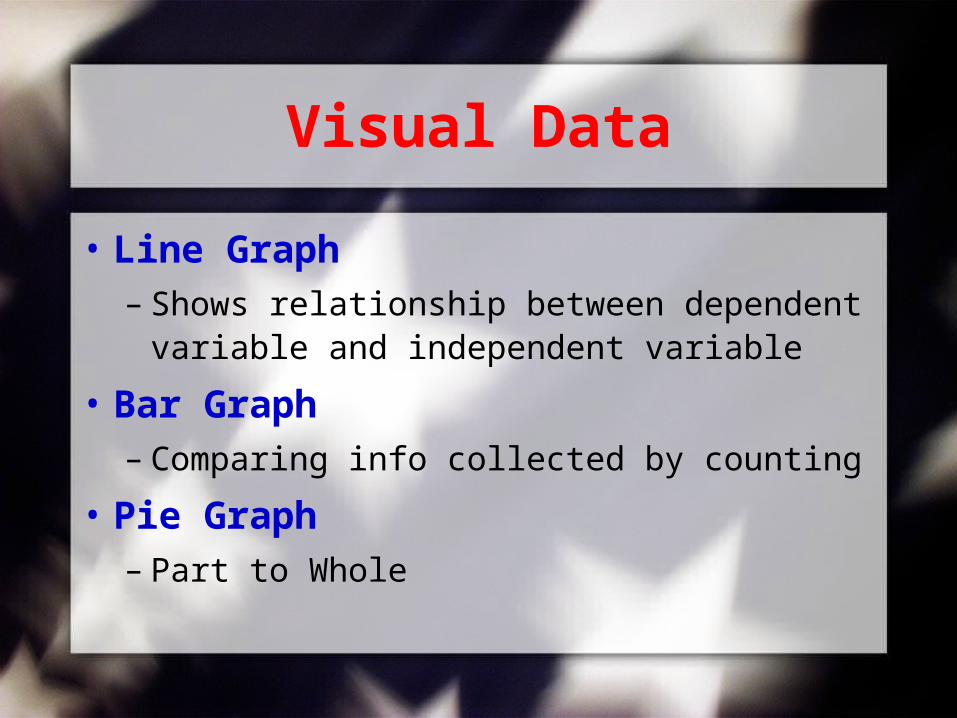
Visual Data
• Line Graph– Shows relationship between dependent
variable and independent variable
• Bar Graph– Comparing info collected by counting
• Pie Graph– Part to Whole
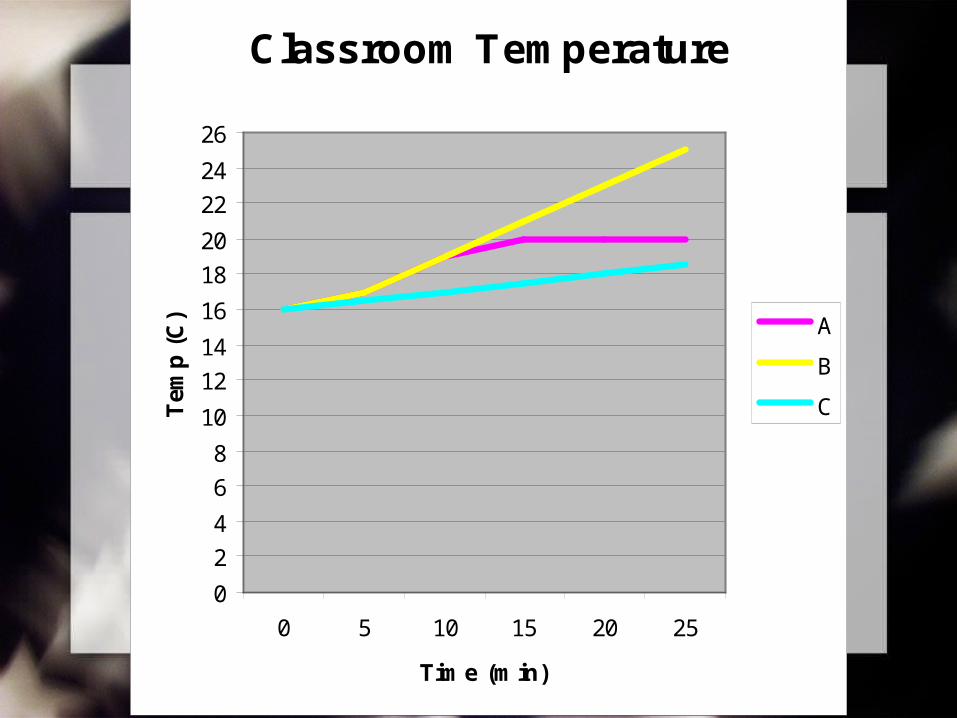
Classroom Temperature
0
2
4
6
8
10
12
14
16
18
20
22
24
26
0 5 10 15 20 25
Time (min)
Tem
p (
C) A
B
C
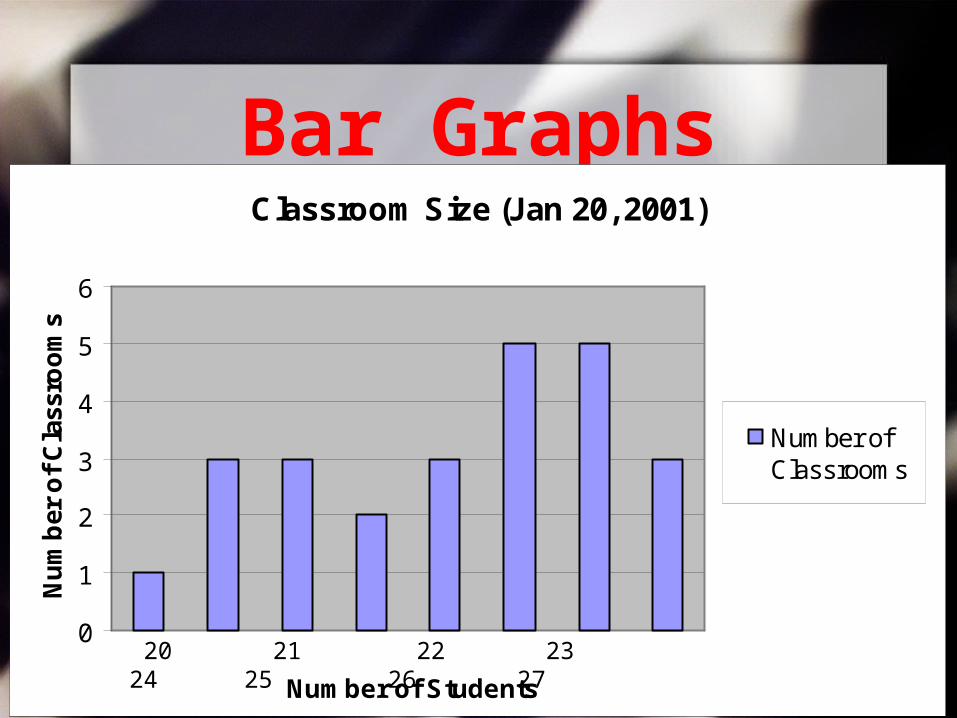
Bar GraphsClassroom Size (Jan 20, 2001)
0
1
2
3
4
5
6
Number of Students
Nu
mb
er o
f C
lass
roo
ms
Number ofClassrooms
20 21 22 23 24 25 26 27
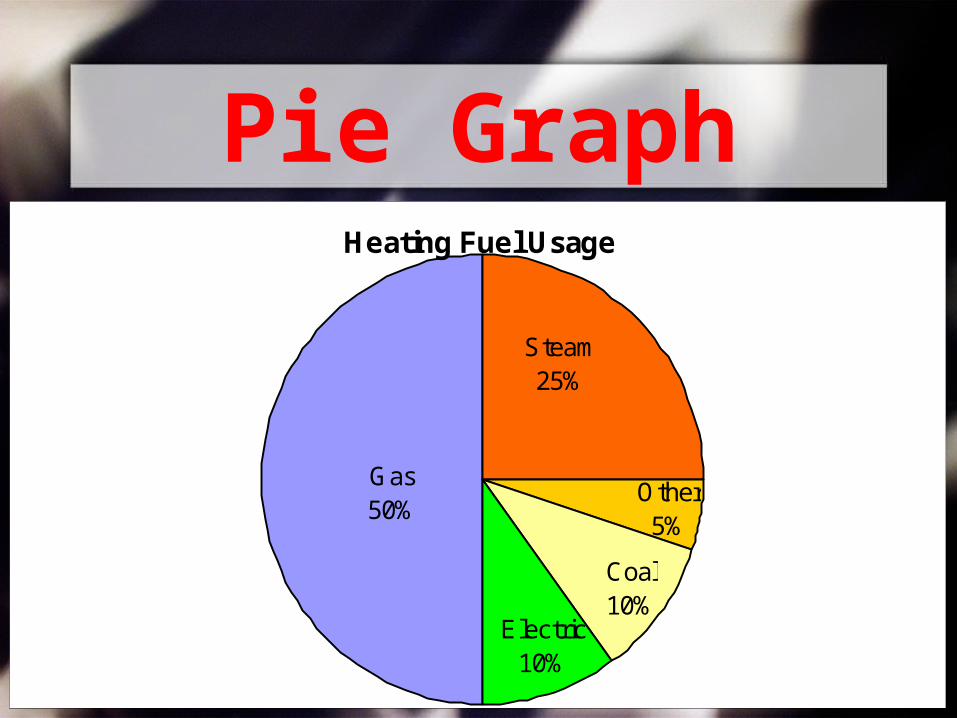
Pie GraphHeating Fuel Usage
Electric10%
Coal10%
Other5%
Steam25%
Gas50%

Plotting Line Graphs
• See steps to follow on pg 31
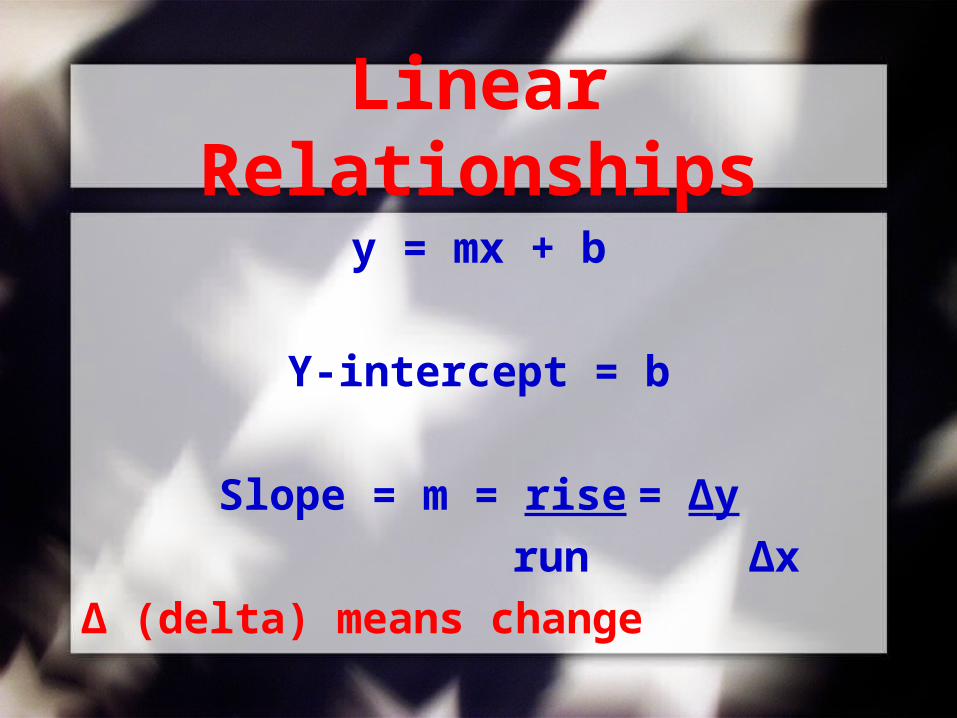
Linear Relationships
y = mx + b
Y-intercept = b
Slope = m = rise = Δy
run Δx
Δ (delta) means change
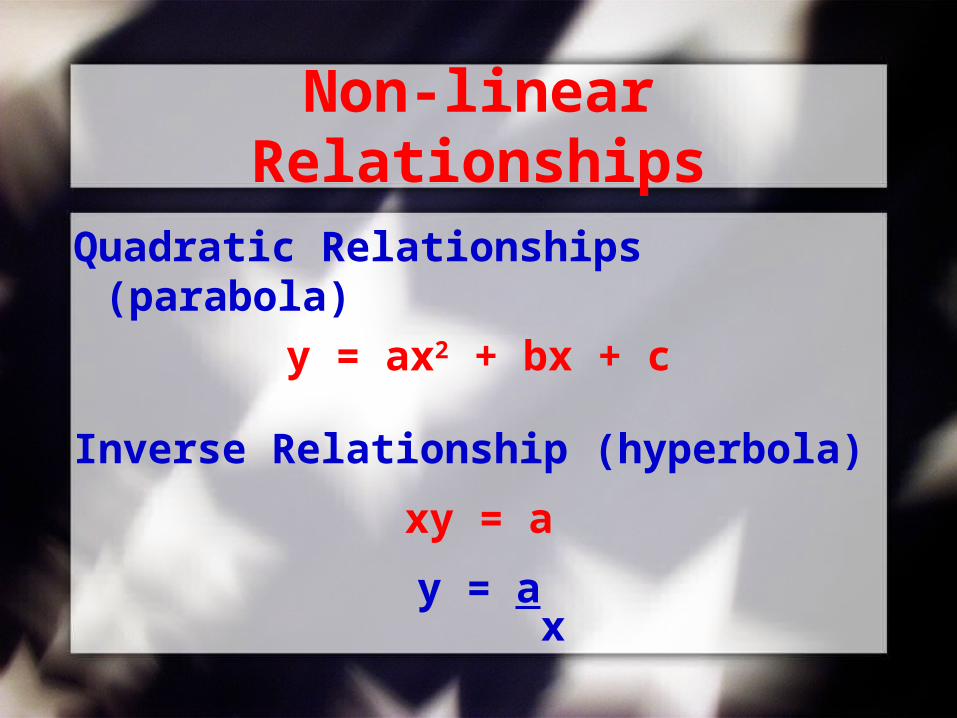
Non-linear Relationships
Quadratic Relationships (parabola)
y = ax2 + bx + c
Inverse Relationship (hyperbola)
xy = a
y = a x