Embed Size (px)
Citation preview
1utdallas.edu/~metin
Managing Transpor tation in a Supply Chain
Chapter 14Sections 4.3, 4.4 and 4.5
2utdallas.edu/~metin
Outline
�Key modes of transpor t and major issues�Transpor tation System Design�Tradeoffs in transpor tation design
– Transpor tation and service
�Vehicle Routing
3utdallas.edu/~metin
Parties Involved in Transportation
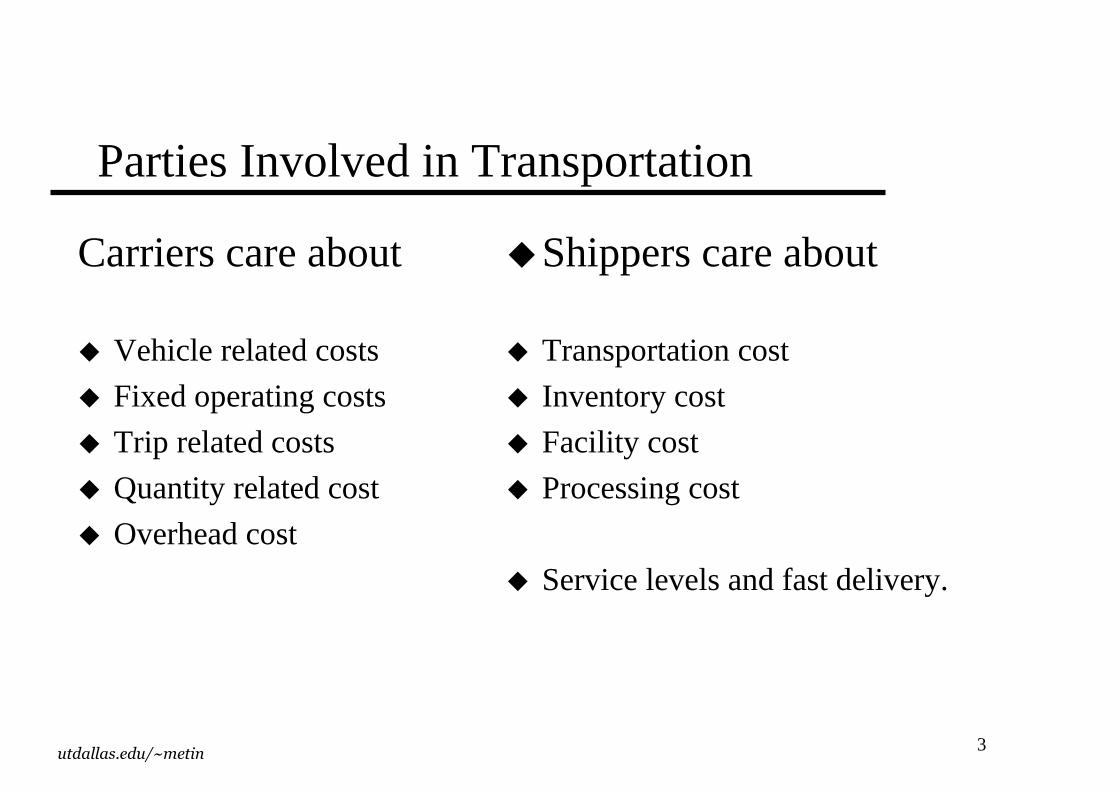
Carriers care about
� Vehicle related costs
� Fixed operating costs
� Trip related costs
� Quantity related cost
� Overhead cost
�Shippers care about
� Transportation cost
� Inventory cost
� Facility cost
� Processing cost
� Service levels and fast delivery.
4utdallas.edu/~metin
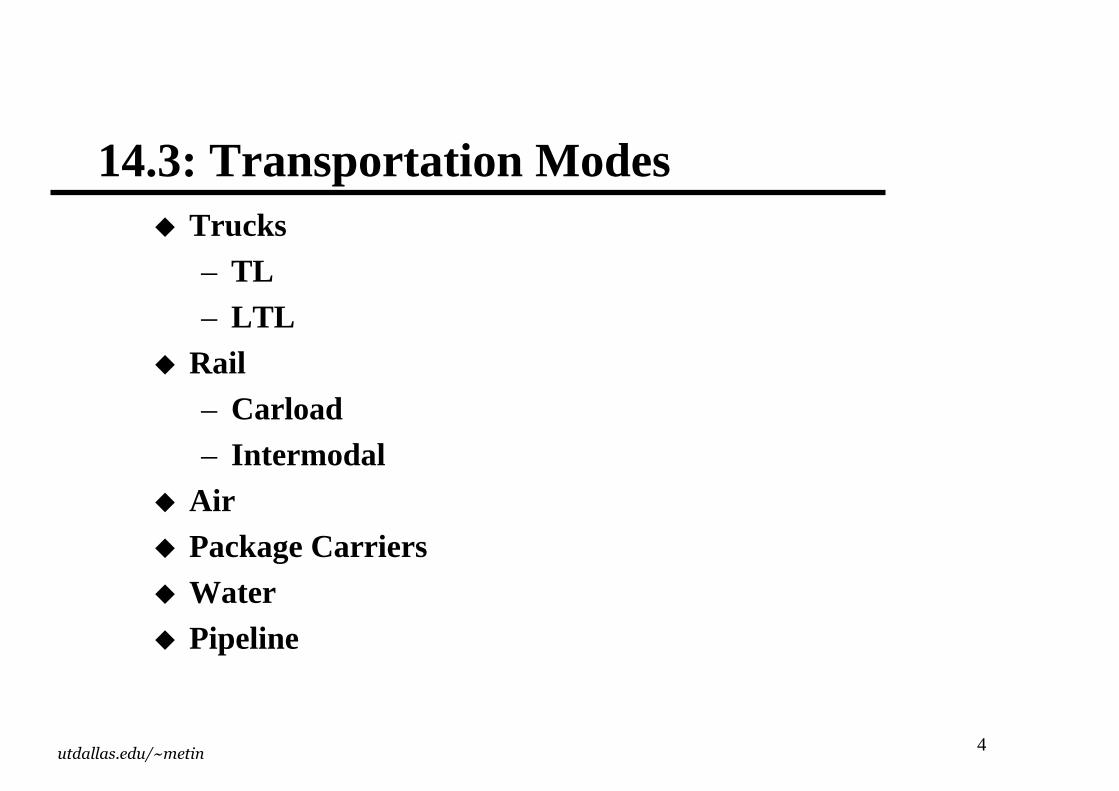
14.3: Transpor tation Modes� Trucks
– TL– LTL� Rail
– Car load– Intermodal� Air� Package Carr iers� Water� Pipeline
5utdallas.edu/~metin
Truckload (TL)
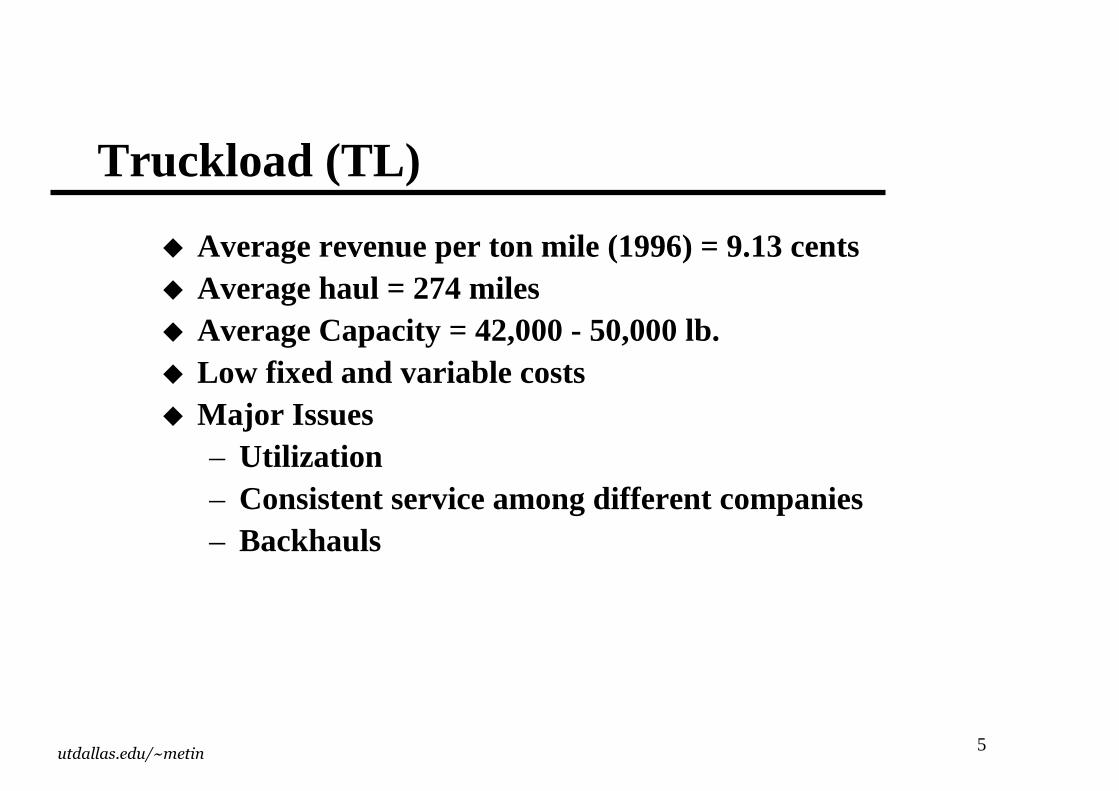
� Average revenue per ton mile (1996) = 9.13 cents� Average haul = 274 miles� Average Capacity = 42,000 - 50,000 lb.� Low fixed and var iable costs� Major Issues
– Utilization– Consistent service among different companies– Backhauls
6utdallas.edu/~metin
Less Than Truckload (LTL)
� Average revenue per ton-mile (1996) = 25.08 cents� Average haul = 646 miles� Higher fixed costs (terminals) and low var iable costs� Major Issues
– Location of consolidation facilities– Utilization– Vehicle routing– Customer service
7utdallas.edu/~metin
Rail
� Average revenue / ton-mile (1996) = 2.5 cents� Average haul = 720 miles� Average load = 80 tons� Key Issues
– Scheduling to minimize delays / improve service– Off track delays (at pick up and delivery end) – Yard operations– Var iability of delivery times
8utdallas.edu/~metin
Air� Key Issues for Passenger Air lines, $250 B /year
– Location/Number of hubs– Location of fleet bases / crew bases– Schedule optimization– Fleet assignment– Crew scheduling, leg based– Yield management� Cargo Air lines, $40 B /year
– Shape, weight, volume of the cargo– Cargo shippers, consolidators
� Service supply chains deal heavily with air line issues
9utdallas.edu/~metin
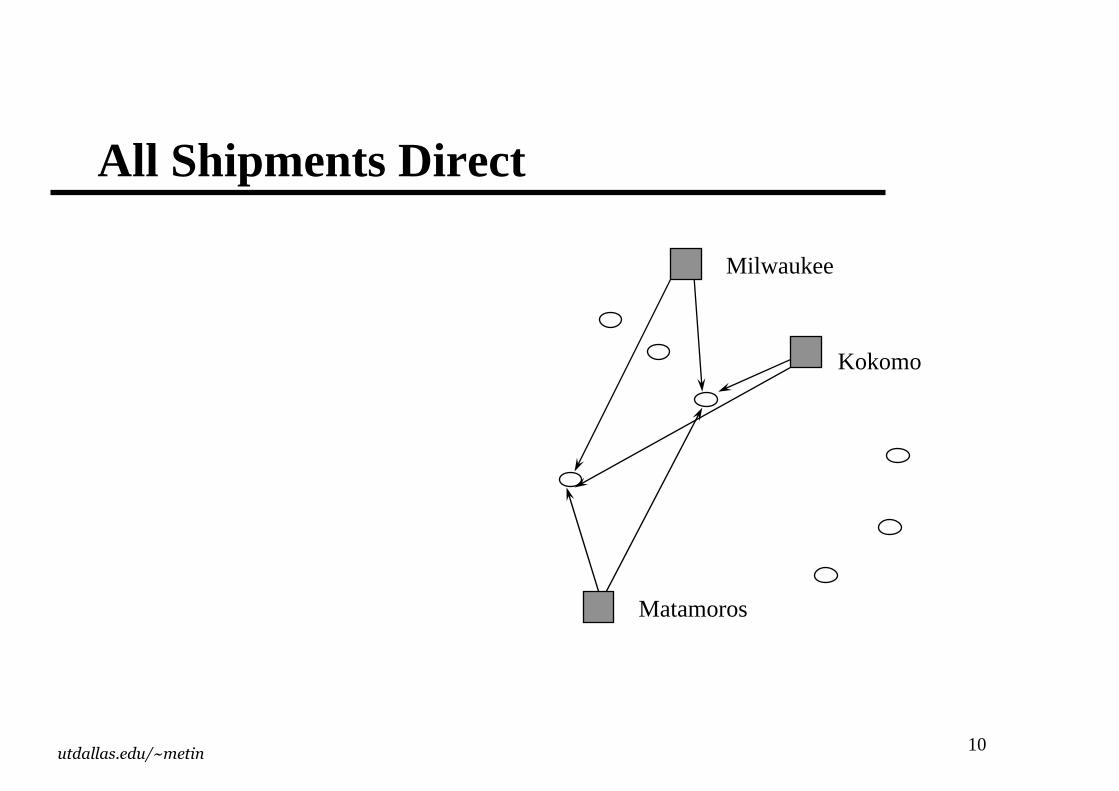
14.4: Transpor tation System Design
� AC Delco: Very high value low volume par ts– Three plants: Milwaukee(Wisc), Kokomo(Ind),
Matamoros(Mex)– 21 assembly plants (customers for above plants)� ACs, batter ies, hoses, brakes, belts, etc.� What are the distr ibution options? Which one to select?
On what basis?
10utdallas.edu/~metin
All Shipments Direct
Milwaukee
Kokomo
Matamoros
11utdallas.edu/~metin
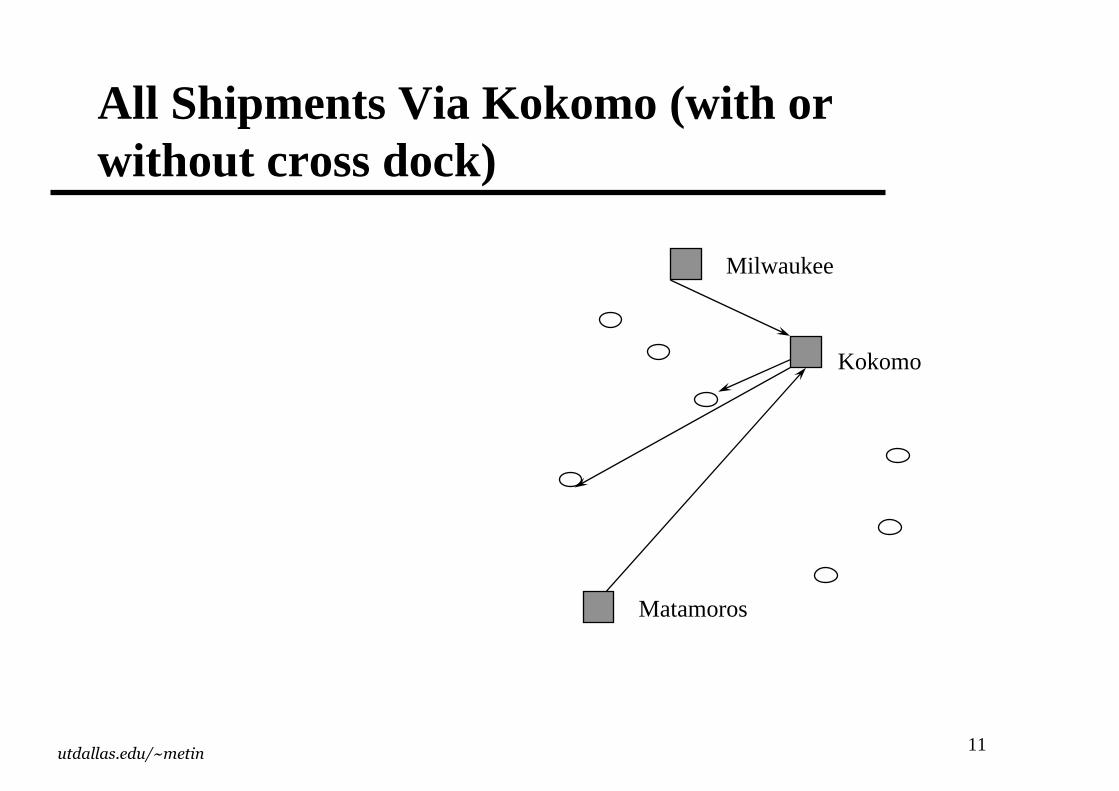
All Shipments Via Kokomo (with or without cross dock)
Milwaukee
Kokomo
Matamoros
12utdallas.edu/~metin
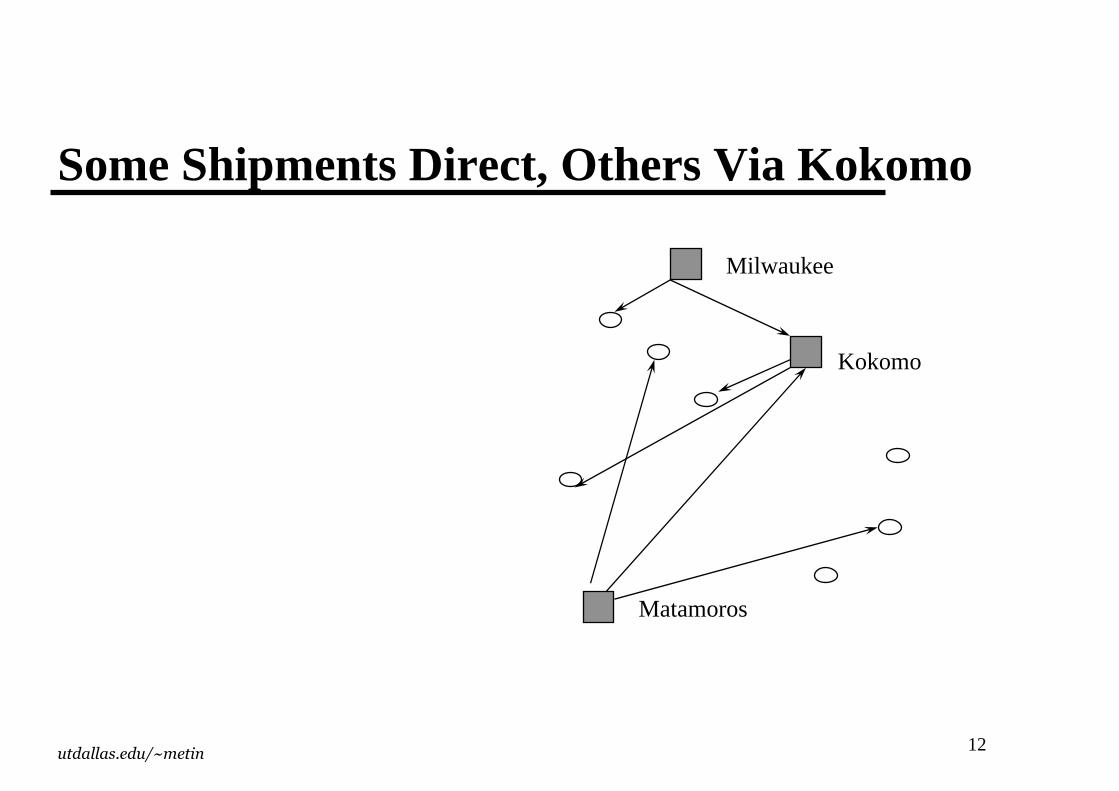
Some Shipments Direct, Others Via Kokomo
Milwaukee
Kokomo
Matamoros
13utdallas.edu/~metin
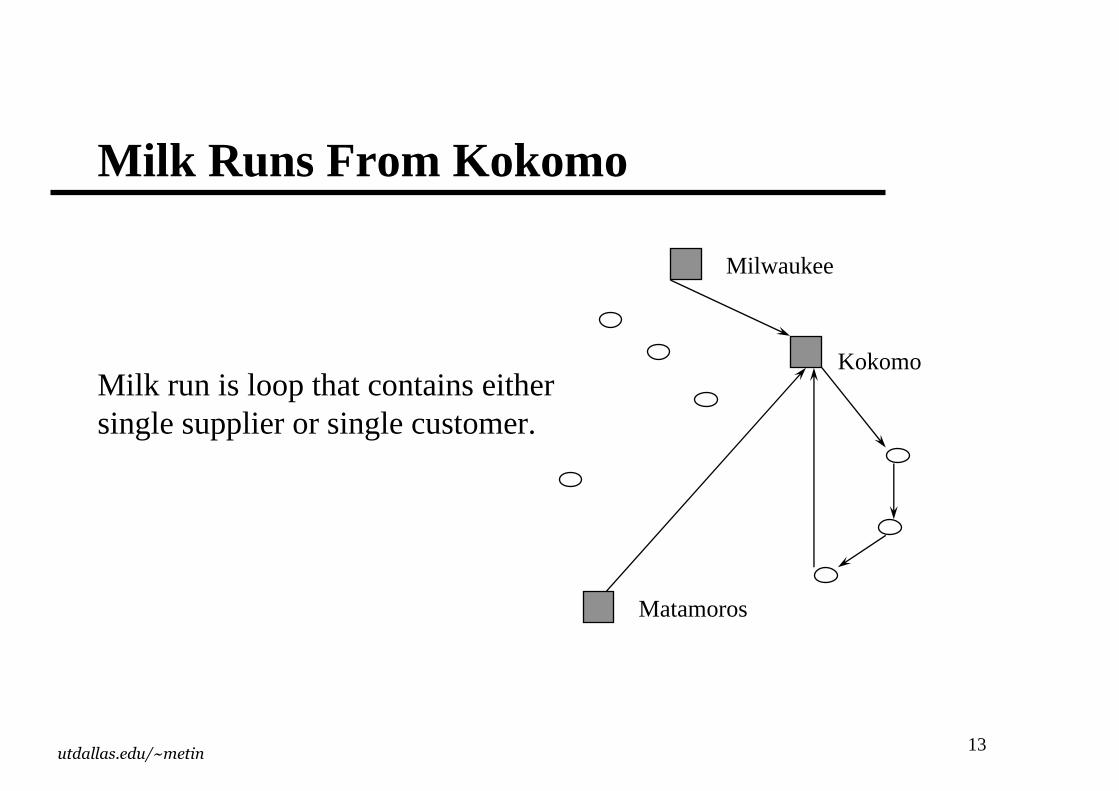
Milk Runs From Kokomo
Milwaukee
Kokomo
Matamoros
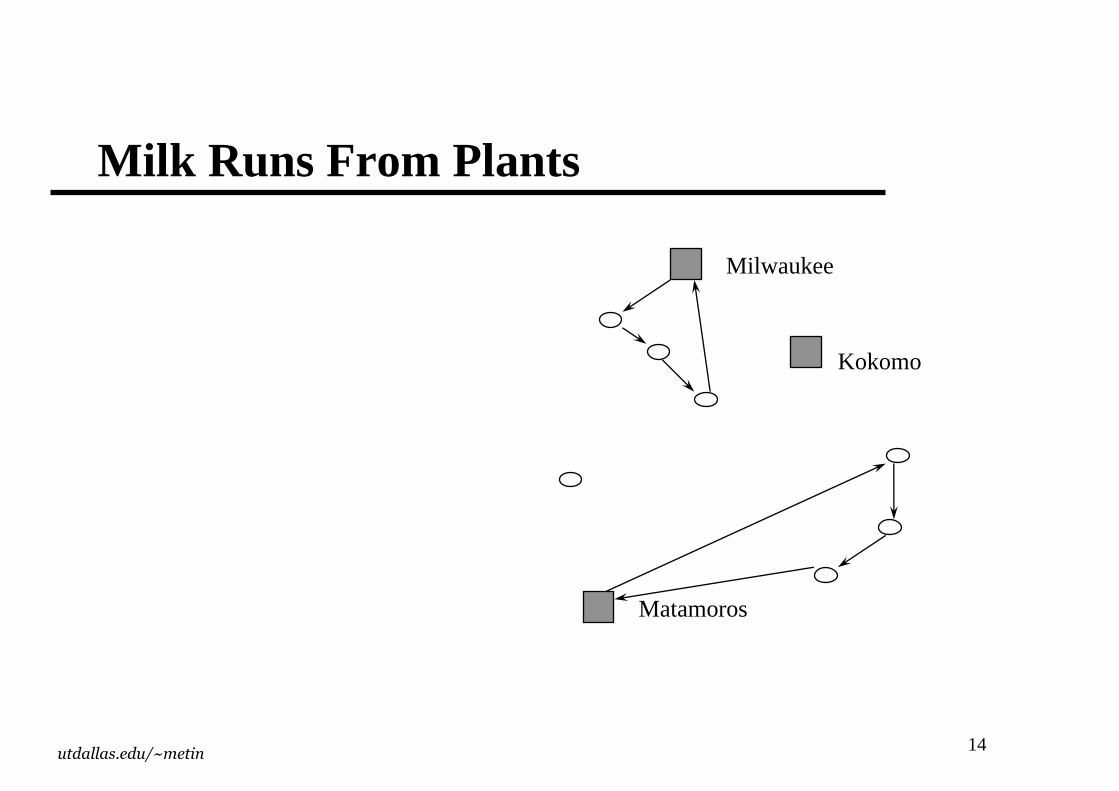
Milk run is loop that contains either single supplier or single customer.
14utdallas.edu/~metin
Milk Runs From Plants
Milwaukee
Kokomo
Matamoros
15utdallas.edu/~metin
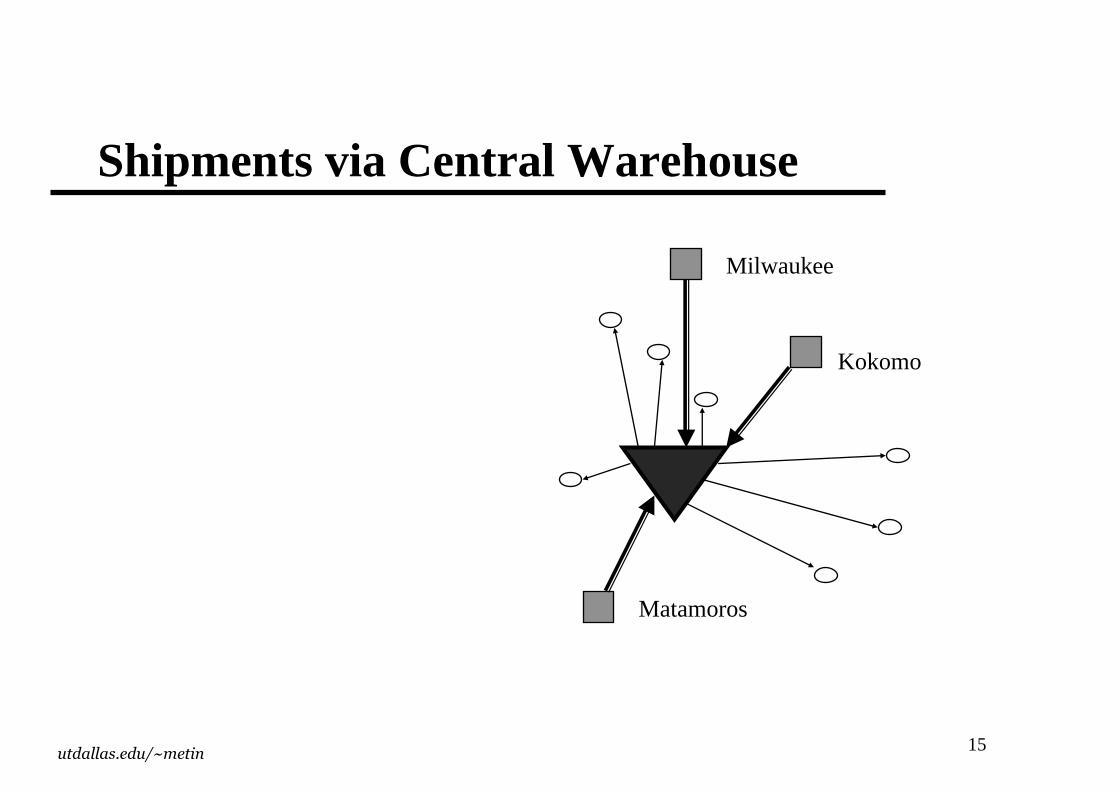
Shipments via Central Warehouse
Milwaukee
Kokomo
Matamoros
16utdallas.edu/~metin
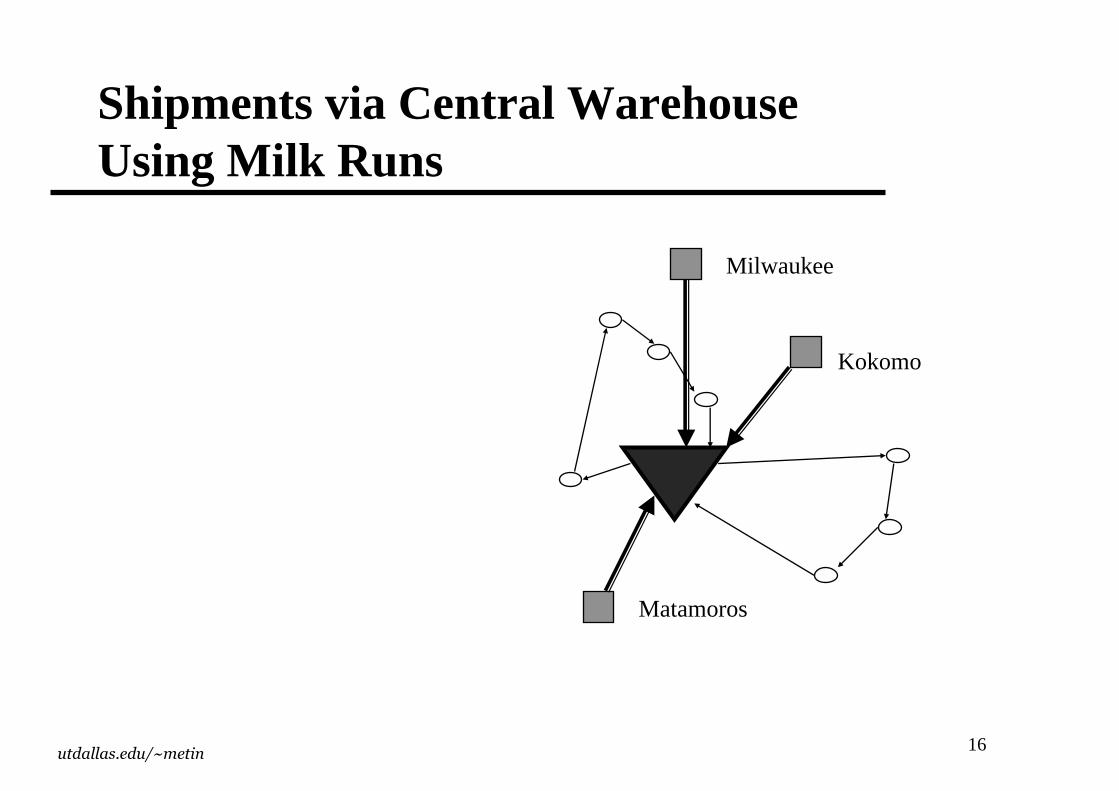
Shipments via Central Warehouse Using Milk Runs
Milwaukee
Kokomo
Matamoros
17utdallas.edu/~metin
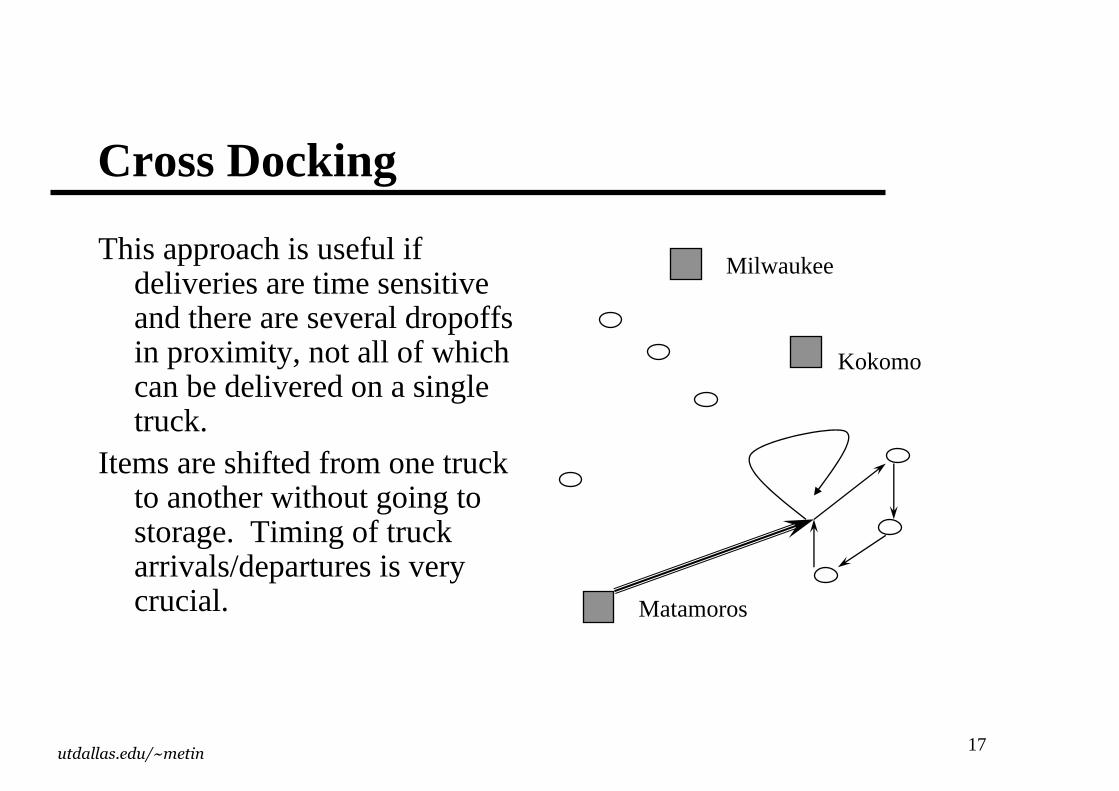
Cross Docking
This approach is useful if deliveries are time sensitive and there are several dropoffsin proximity, not all of which can be delivered on a single truck.
Items are shifted from one truck to another without going to storage. Timing of truck arrivals/departures is very crucial.
Milwaukee
Kokomo
Matamoros
18utdallas.edu/~metin
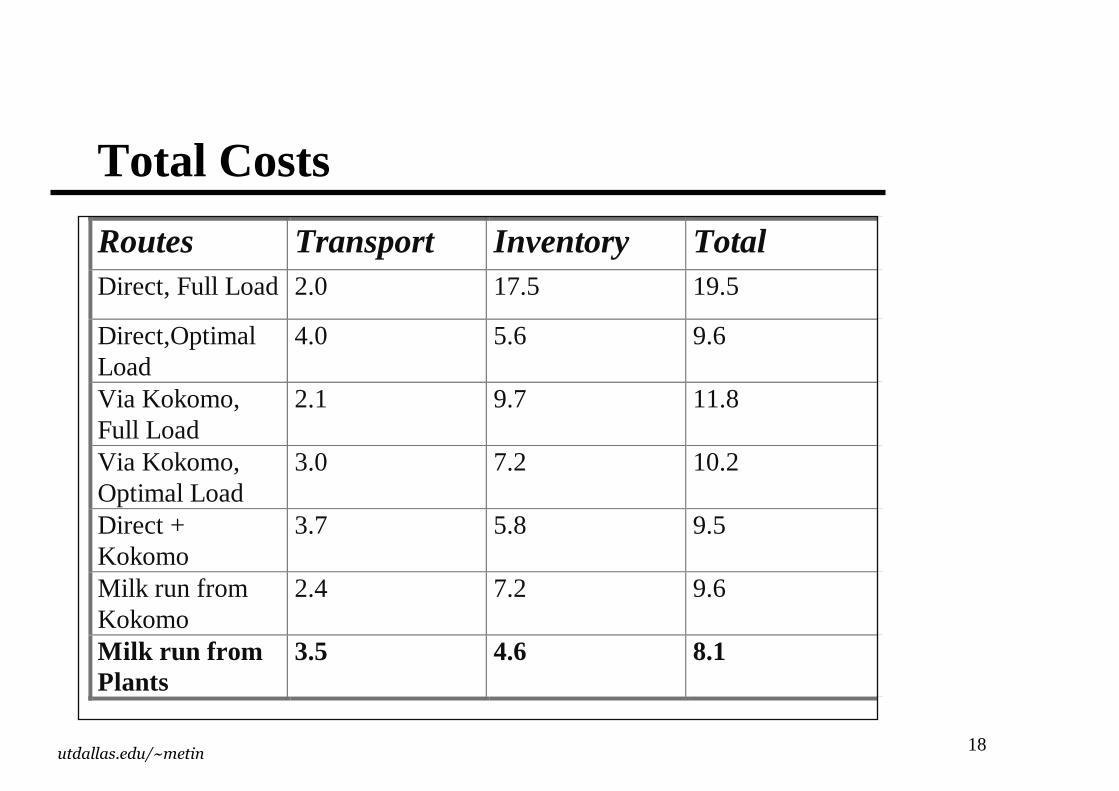
Total Costs
Routes Transport Inventory Total Direct, Full Load 2.0 17.5 19.5
Direct,Optimal Load
4.0 5.6 9.6
Via Kokomo, Full Load
2.1 9.7 11.8
Via Kokomo, Optimal Load
3.0 7.2 10.2
Direct + Kokomo
3.7 5.8 9.5
Milk run from Kokomo
2.4 7.2 9.6
Milk run from Plants
3.5 4.6 8.1
19utdallas.edu/~metin
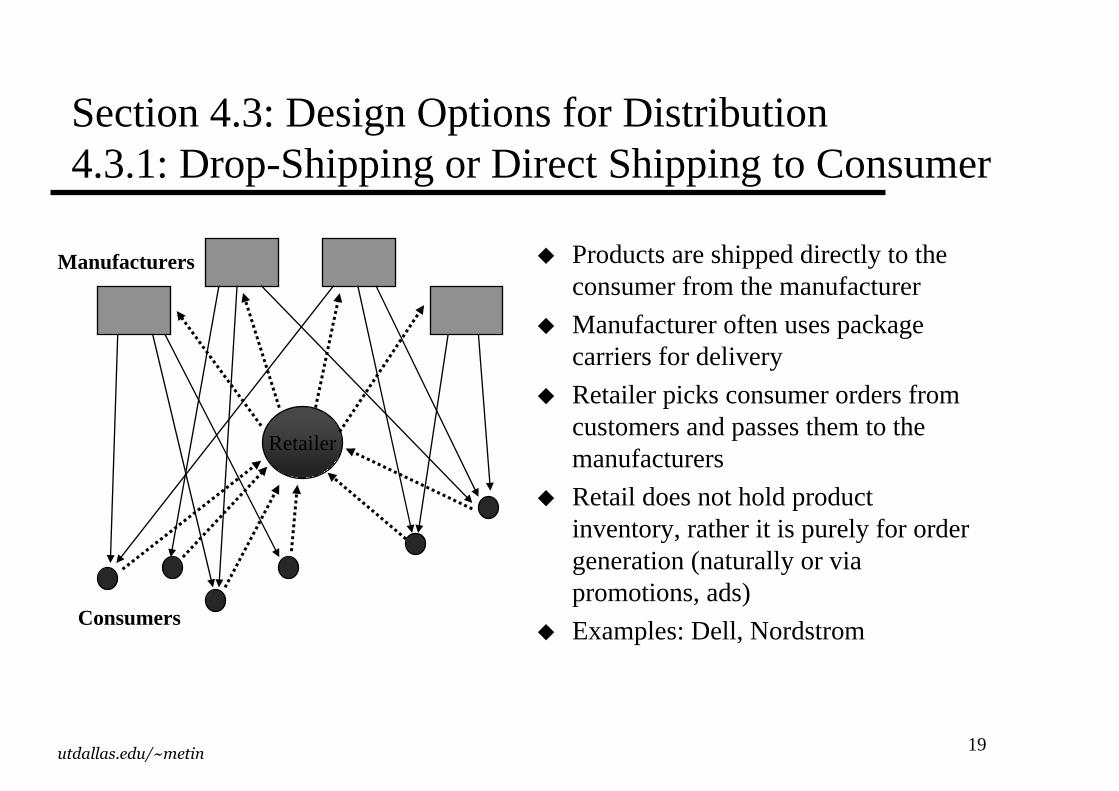
Section 4.3: Design Options for Distribution4.3.1: Drop-Shipping or Direct Shipping to Consumer
� Products are shipped directly to the consumer from the manufacturer
� Manufacturer often uses package carriers for delivery
� Retailer picks consumer orders from customers and passes them to the manufacturers
� Retail does not hold product inventory, rather it is purely for order generation (naturally or via promotions, ads)
� Examples: Dell, Nordstrom
Retailer
Manufacturers
Consumers
20utdallas.edu/~metin
Drop shipping for high-value and low unpredictable demand items
� All consumers’ needs for a particular product is satisfied from a manufacturer: All finished goods inventory for a product reside at one manufacturer. Finished goods inventory is aggregated over different consumers.– Aggregated demand often has smaller standard deviation than the sum of the
standard deviations of the individual demands in the aggregation because extremes cancel out.
� Manufacturers postponecustomization of products until order is placed. Component and sub-assembly inventory is aggregated over different products. � A wide range of products can be provided at a low cost due to postponement.
– e.g. Dell uses postponement very effectively.� Direct shipment simplifies retailers’ functions but complicates manufacturers’ .
Can manufacturer’s handle shipping units one by one to the consumers? Manufacturers and retailers must coordinate their actions using an integrated information systems.� Product returns are harder to handle.� Response times to consumer orders are longer with direct shipping.� Direct shipping increases shipment costs.
21utdallas.edu/~metin
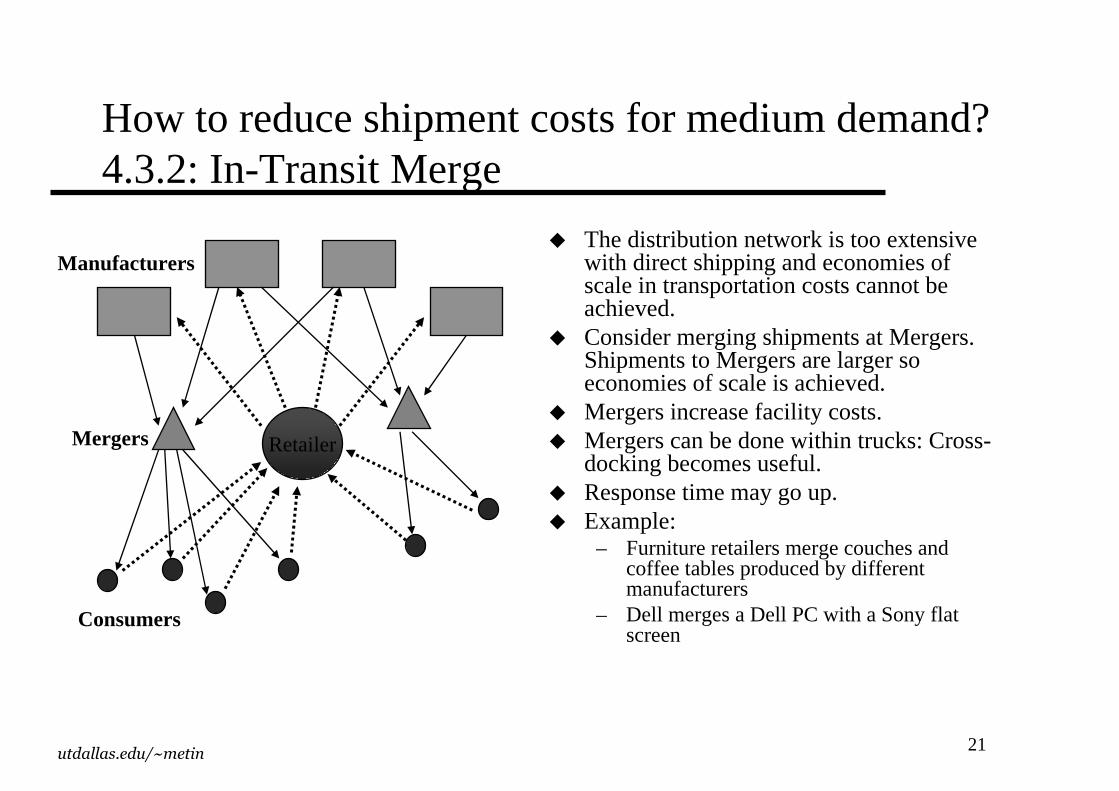
How to reduce shipment costs for medium demand?4.3.2: In-Transit Merge
� The distribution network is too extensive with direct shipping and economies of scale in transportation costs cannot be achieved.� Consider merging shipments at Mergers.
Shipments to Mergers are larger so economies of scale is achieved.� Mergers increase facility costs.� Mergers can be done within trucks: Cross-
docking becomes useful. � Response time may go up.� Example:
– Furniture retailers merge couches and coffee tables produced by different manufacturers
– Dell merges a Dell PC with a Sony flat screen
RetailerMergers
Consumers
Manufacturers
22utdallas.edu/~metin
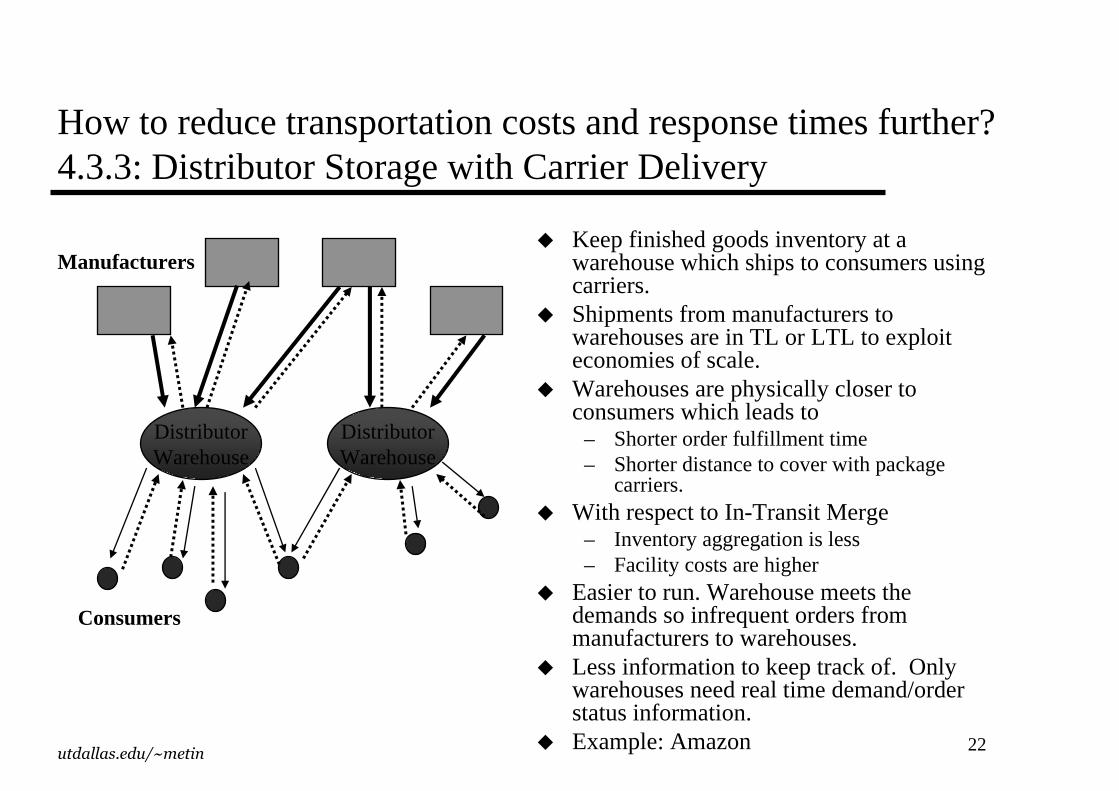
How to reduce transportation costs and response times further?4.3.3: Distributor Storage with Carrier Delivery
� Keep finished goods inventory at a warehouse which ships to consumers using carriers.� Shipments from manufacturers to
warehouses are in TL or LTL to exploit economies of scale. � Warehouses are physically closer to
consumers which leads to– Shorter order fulfillment time– Shorter distance to cover with package
carriers.� With respect to In-Transit Merge
– Inventory aggregation is less – Facility costs are higher
� Easier to run. Warehouse meets the demands so infrequent orders from manufacturers to warehouses. � Less information to keep track of. Only
warehouses need real time demand/order status information.� Example: Amazon
DistributorWarehouse
Manufacturers
Consumers
DistributorWarehouse
23utdallas.edu/~metin
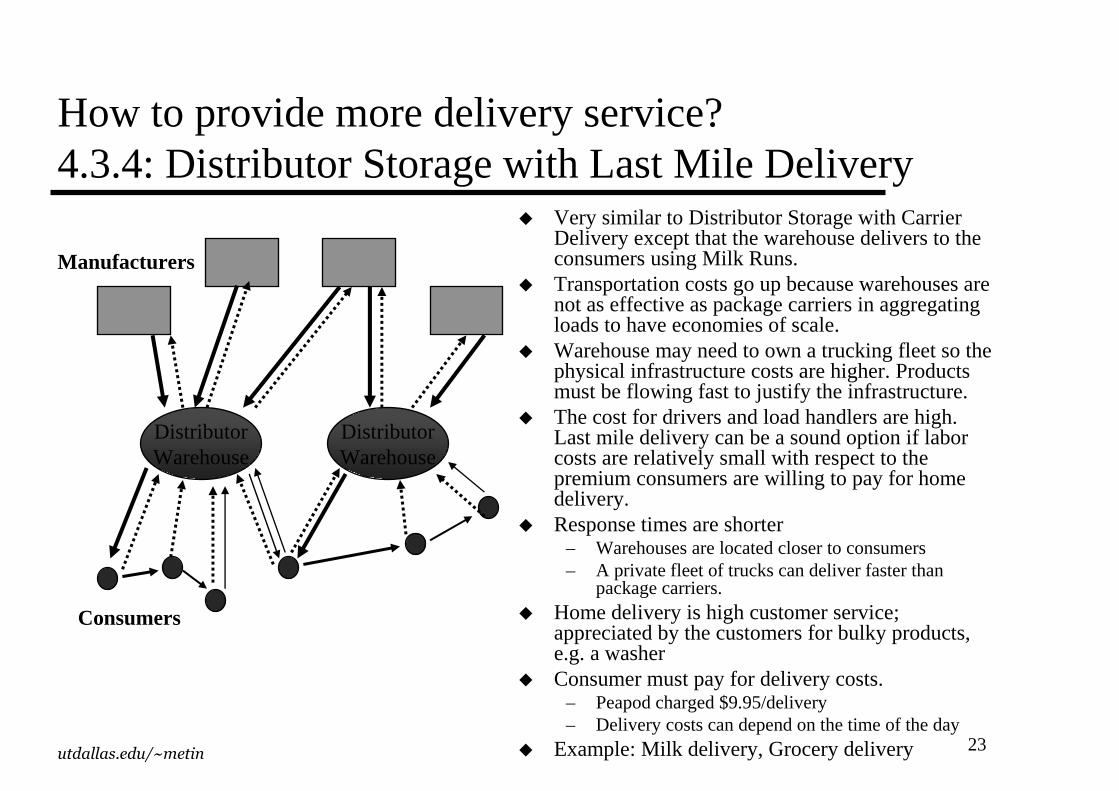
How to provide more delivery service?4.3.4: Distributor Storage with Last Mile Delivery
� Very similar to Distributor Storage with Carrier Delivery except that the warehouse delivers to the consumers using Milk Runs.
� Transportation costs go up because warehouses are not as effective as package carriers in aggregating loads to have economies of scale.
� Warehouse may need to own a trucking fleet so the physical infrastructure costs are higher. Products must be flowing fast to justify the infrastructure.
� The cost for drivers and load handlers are high. Last mile delivery can be a sound option if labor costs are relatively small with respect to the premium consumers are willing to pay for home delivery.
� Response times are shorter– Warehouses are located closer to consumers– A private fleet of trucks can deliver faster than
package carriers.� Home delivery is high customer service;
appreciated by the customers for bulky products, e.g. a washer
� Consumer must pay for delivery costs. – Peapod charged $9.95/delivery– Delivery costs can depend on the time of the day
� Example: Milk delivery, Grocery delivery
DistributorWarehouse
Manufacturers
Consumers
DistributorWarehouse
24utdallas.edu/~metin
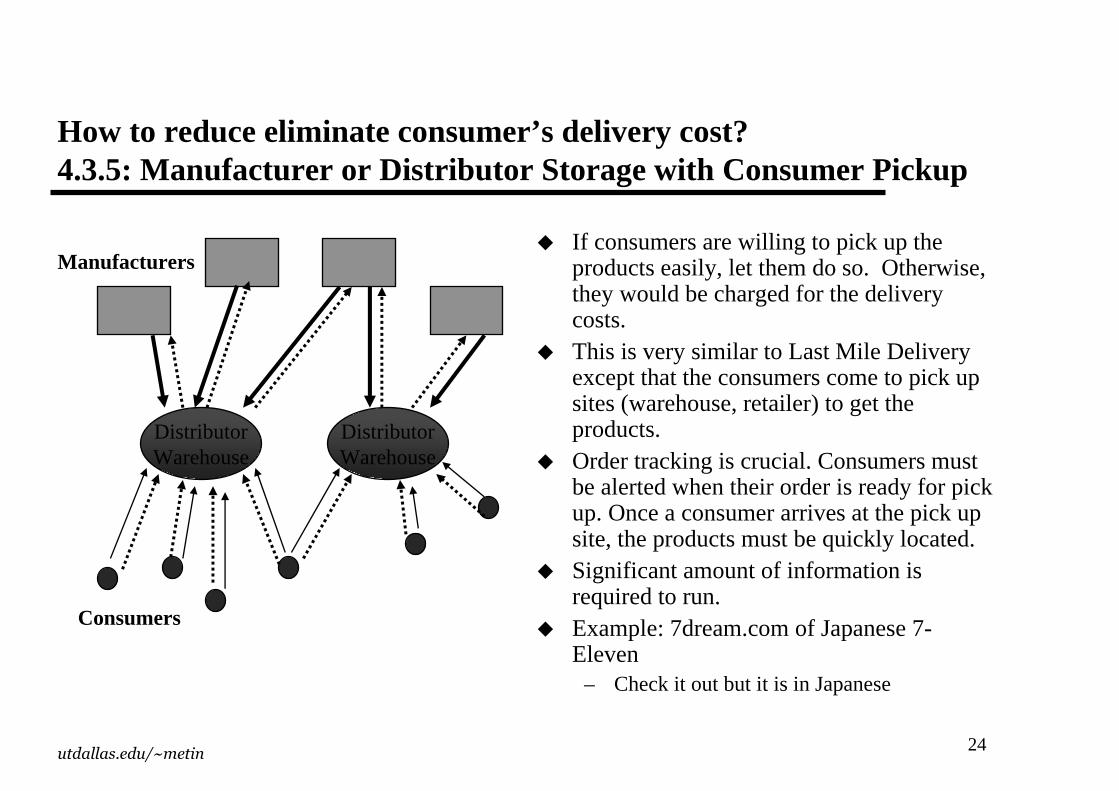
How to reduce eliminate consumer ’s delivery cost?4.3.5: Manufacturer or Distr ibutor Storage with Consumer Pickup
� If consumers are willing to pick up the products easily, let them do so. Otherwise, they would be charged for the delivery costs. � This is very similar to Last Mile Delivery
except that the consumers come to pick up sites (warehouse, retailer) to get the products.� Order tracking is crucial. Consumers must
be alerted when their order is ready for pick up. Once a consumer arrives at the pick up site, the products must be quickly located. � Significant amount of information is
required to run.� Example: 7dream.com of Japanese 7-
Eleven– Check it out but it is in Japanese
DistributorWarehouse
Manufacturers
Consumers
DistributorWarehouse
25utdallas.edu/~metin
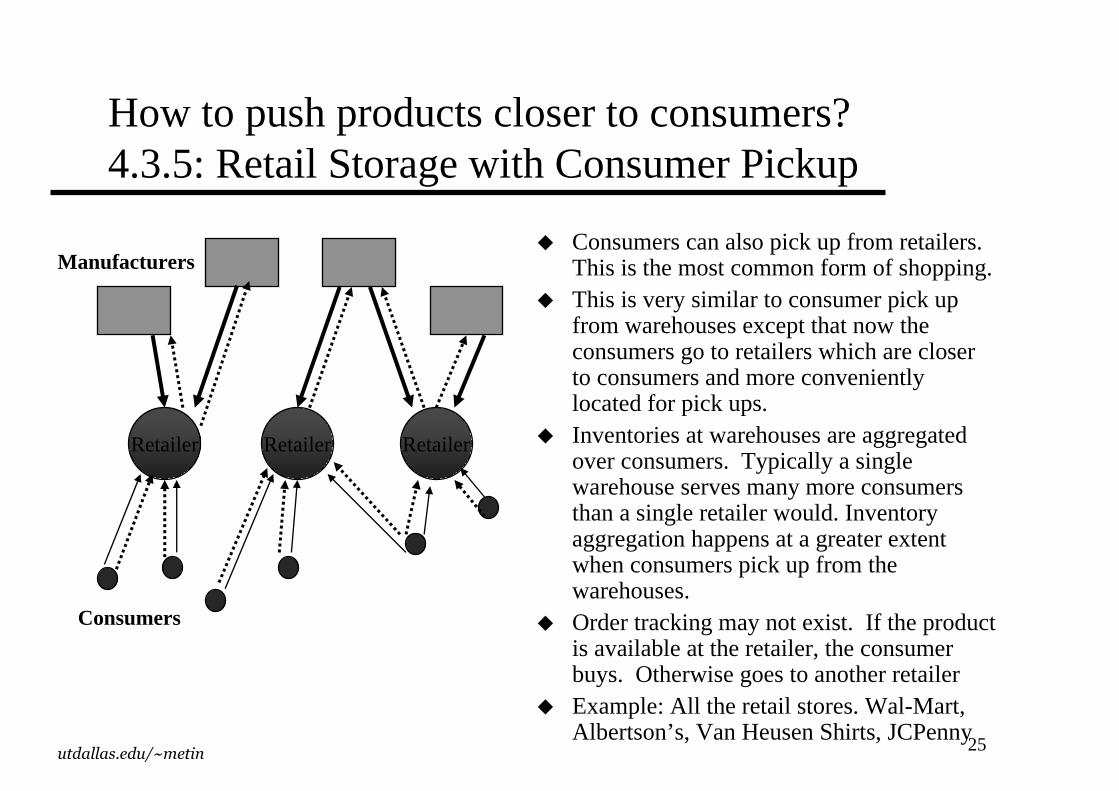
How to push products closer to consumers?4.3.5: Retail Storage with Consumer Pickup
� Consumers can also pick up from retailers. This is the most common form of shopping.� This is very similar to consumer pick up
from warehouses except that now the consumers go to retailers which are closer to consumers and more conveniently located for pick ups.� Inventories at warehouses are aggregated
over consumers. Typically a single warehouse serves many more consumers than a single retailer would. Inventory aggregation happens at a greater extent when consumers pick up from the warehouses.� Order tracking may not exist. If the product
is available at the retailer, the consumer buys. Otherwise goes to another retailer� Example: All the retail stores. Wal-Mart,
Albertson’s, Van Heusen Shirts, JCPenny
Retailer
Manufacturers
Consumers
RetailerRetailer
26utdallas.edu/~metin
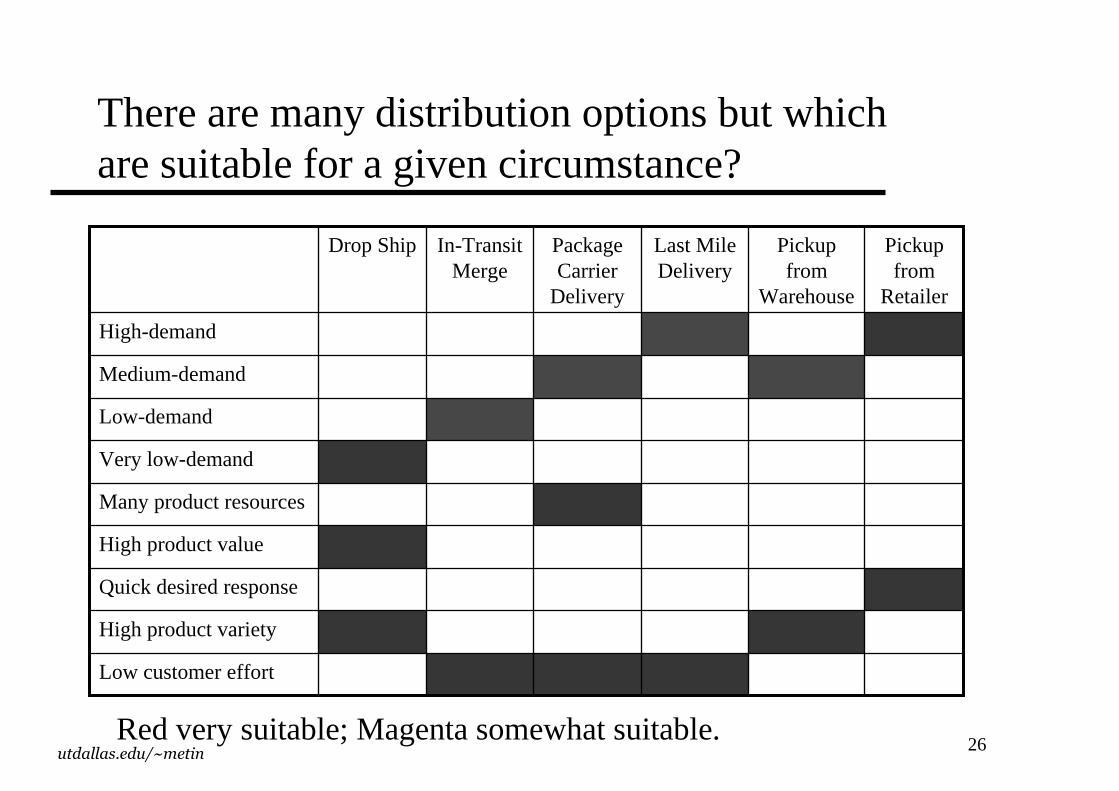
There are many distribution options but which are suitable for a given circumstance?
Low customer effort
High product variety
Quick desired response
High product value
Many product resources
Very low-demand
Low-demand
Medium-demand
High-demand
Pickup from
Retailer
Pickup from
Warehouse
Last Mile Delivery
Package Carrier
Delivery
In-Transit Merge
Drop Ship
Red very suitable; Magentasomewhat suitable.
27utdallas.edu/~metin
What value do distributors add to SCs?
� Economies of scale in inbound transportation costs to distributors� Economies of scale in outbound transportation costs from distributor to retailers by
combining shipments coming from several manufacturers and going to the same retailer.� Inventory aggregation at the distributor as opposed to individual retailer inventories� Smoothes out orders coming from retailers and going to manufacturers. This is a side
effect of aggregation.� Distributors provide a compromise strategy, for keeping inventories in the SCs,
between– Storage at the manufacturer with direct shipments
» Low inventory cost but high transportation cost– Storage at the retailer with customer pickups
» High inventory cost but low transportation cost
� By specializing on distribution, distributors do a better job in logistics of shipments:– On time deliveries– Breaking bulk shipments– Shipment tracking
28utdallas.edu/~metin
14.5: Tradeoffs in Transportation Design
� Transportation, facility, and inventory cost tradeoff
– Choice of transportation mode (later)
– Inventory aggregation (later)
� Transportation cost and responsiveness tradeoff
– Temporal aggregation leads to economies of scale
– Temporal aggregation decreases responsiveness
– See Table 14.8 for Alloy Steel
29utdallas.edu/~metin
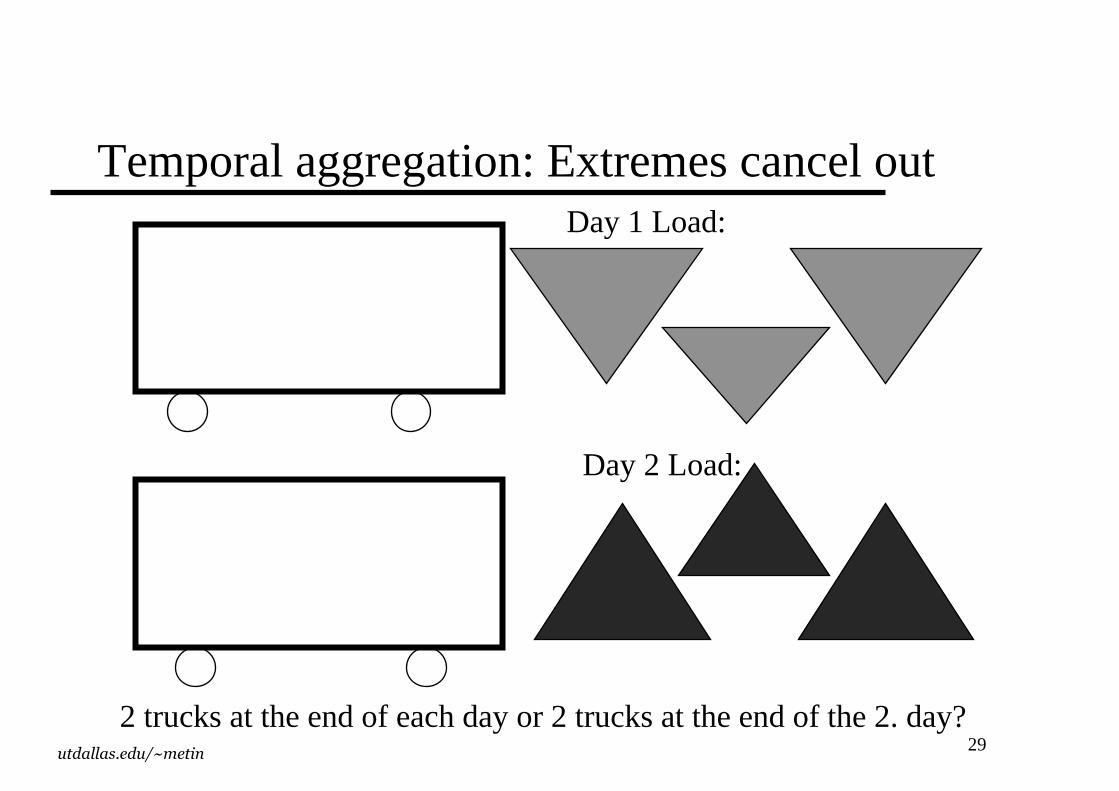
Temporal aggregation: Extremes cancel outDay 1 Load:
Day 2 Load:
2 trucks at the end of each day or 2 trucks at the end of the 2. day?
30utdallas.edu/~metin
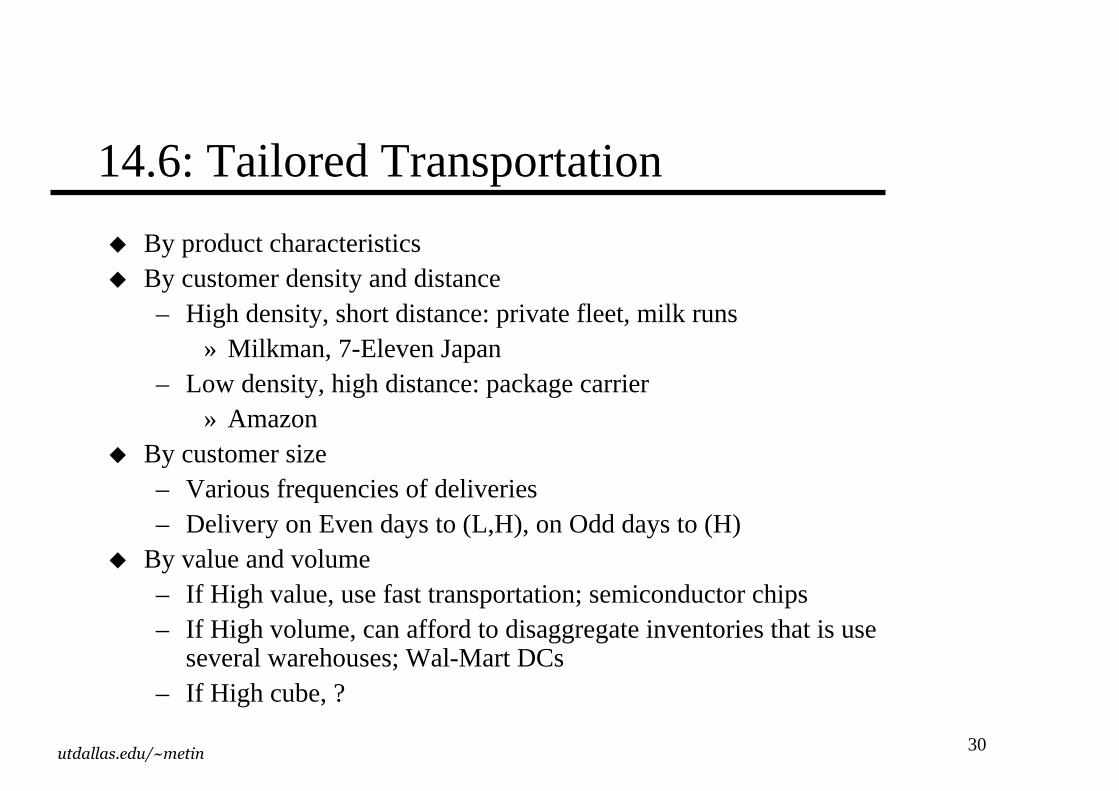
14.6: Tailored Transportation
� By product characteristics� By customer density and distance
– High density, short distance: private fleet, milk runs» Milkman, 7-Eleven Japan
– Low density, high distance: package carrier» Amazon
� By customer size– Various frequencies of deliveries– Delivery on Even days to (L,H), on Odd days to (H)
� By value and volume– If High value, use fast transportation; semiconductor chips– If High volume, can afford to disaggregate inventories that is use
several warehouses; Wal-Mart DCs– If High cube, ?
31utdallas.edu/~metin
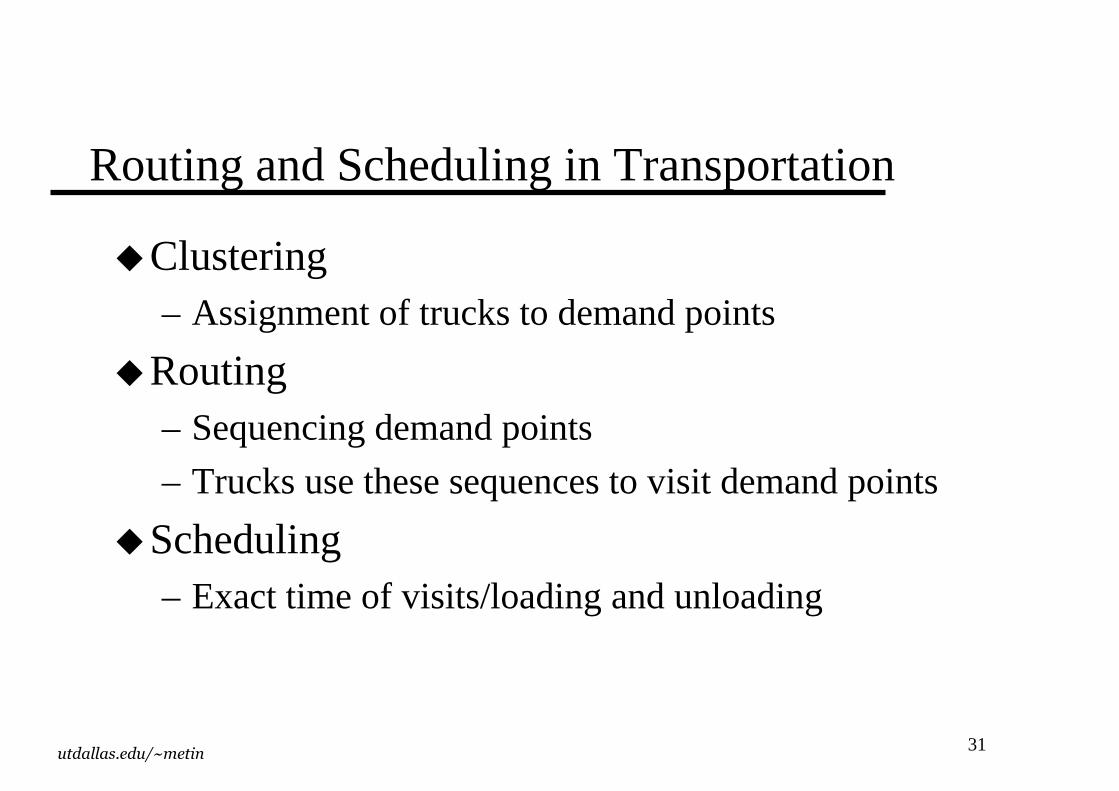
Routing and Scheduling in Transportation
�Clustering– Assignment of trucks to demand points
�Routing– Sequencing demand points
– Trucks use these sequences to visit demand points
�Scheduling– Exact time of visits/loading and unloading
32utdallas.edu/~metin
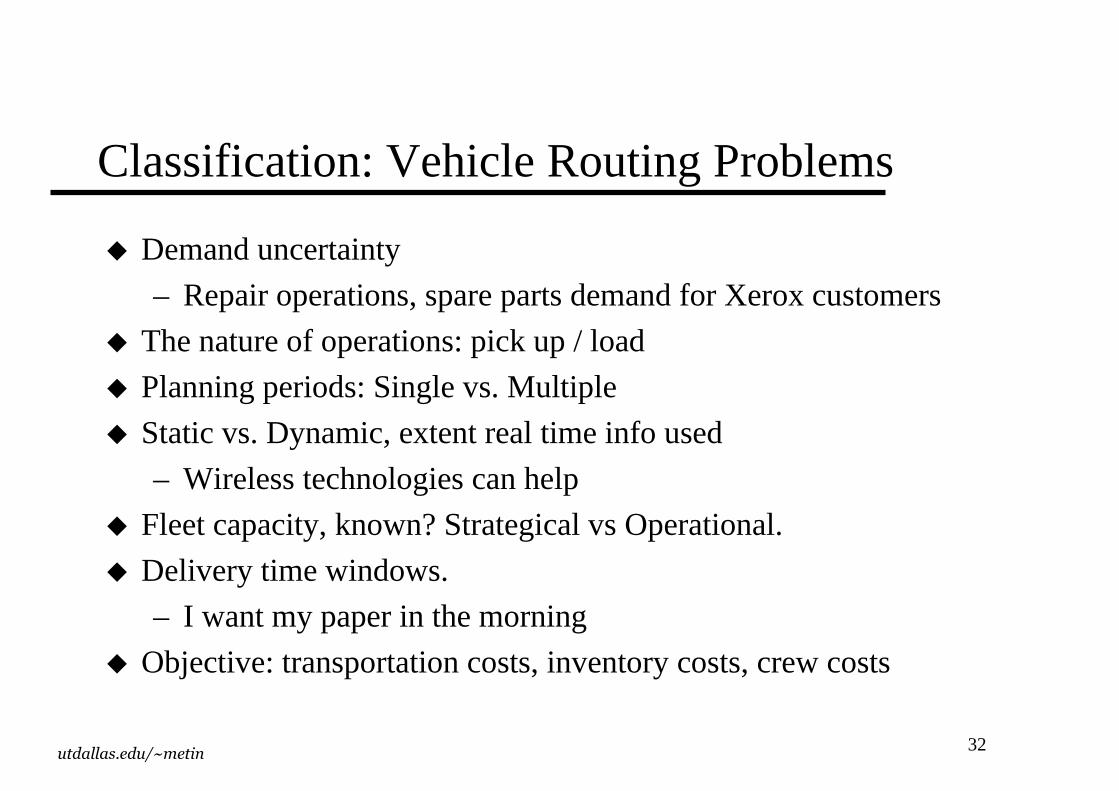
Classification: Vehicle Routing Problems
� Demand uncertainty
– Repair operations, spare parts demand for Xerox customers
� The nature of operations: pick up / load
� Planning periods: Single vs. Multiple
� Static vs. Dynamic, extent real time info used
– Wireless technologies can help
� Fleet capacity, known? Strategical vs Operational.
� Delivery time windows.
– I want my paper in the morning
� Objective: transportation costs, inventory costs, crew costs
33utdallas.edu/~metin
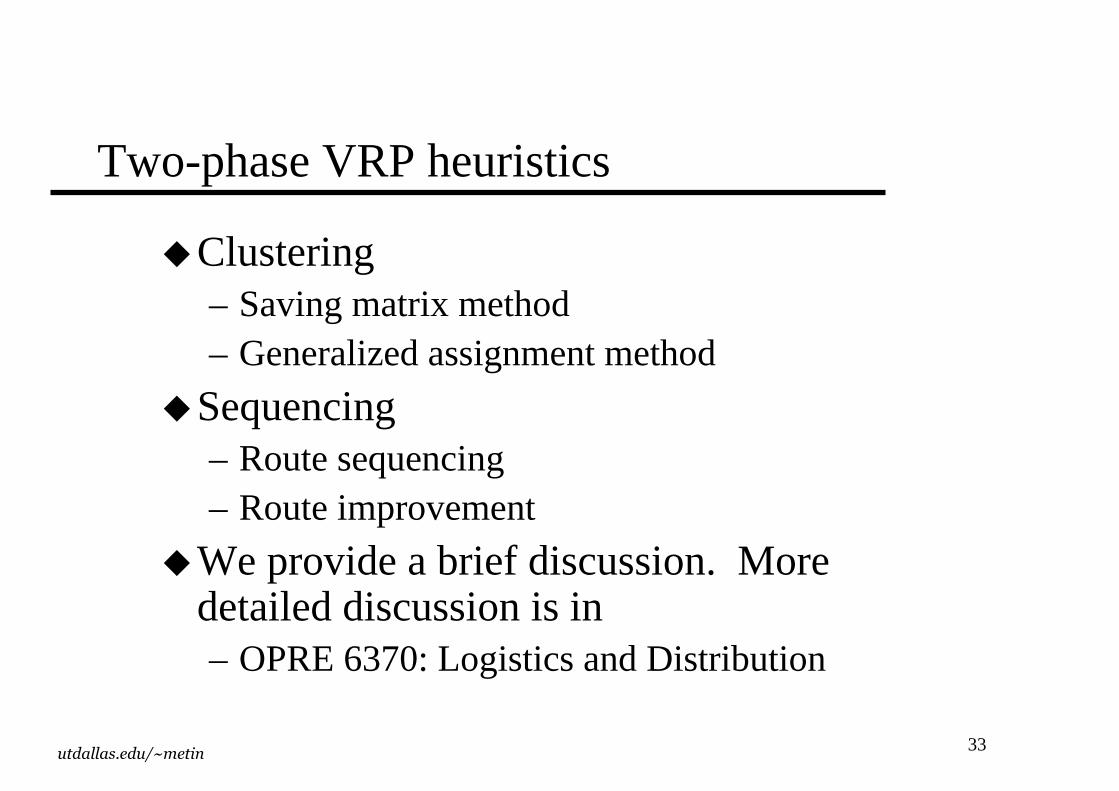
Two-phase VRP heuristics
�Clustering– Saving matrix method– Generalized assignment method
�Sequencing– Route sequencing– Route improvement
�We provide a brief discussion. More detailed discussion is in – OPRE 6370: Logistics and Distribution
34utdallas.edu/~metin
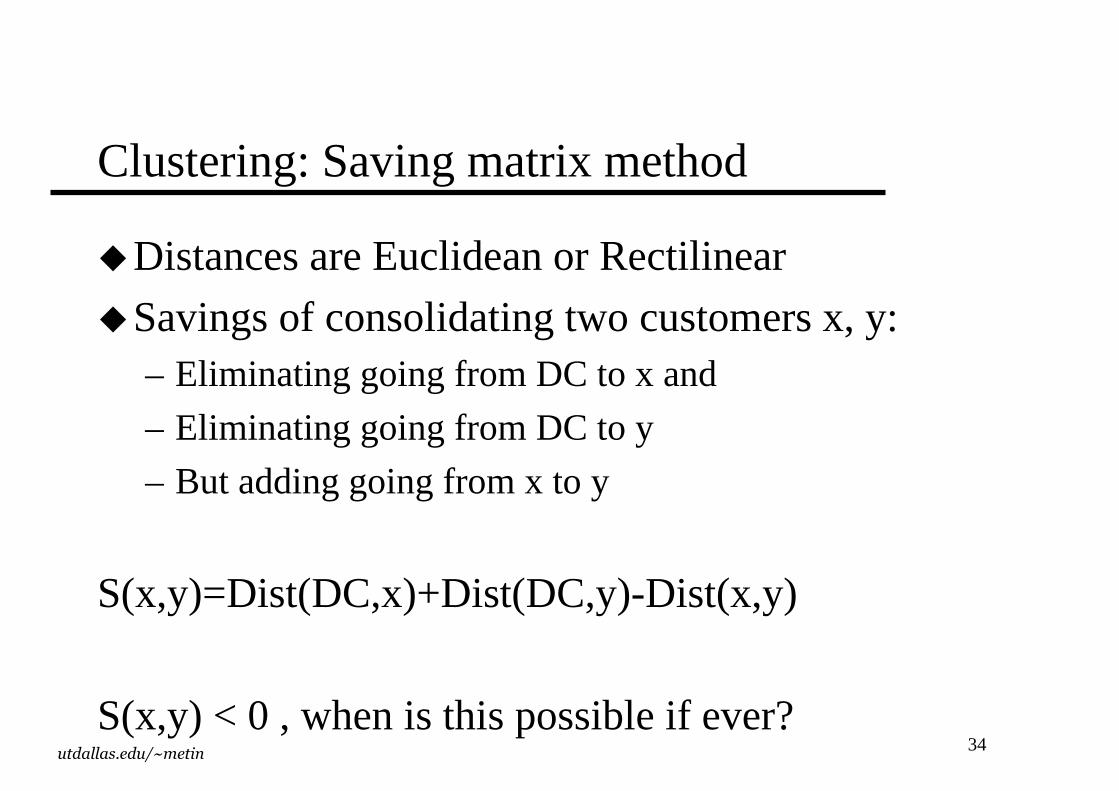
Clustering: Saving matrix method
�Distances are Euclidean or Rectilinear
�Savings of consolidating two customers x, y:– Eliminating going from DC to x and
– Eliminating going from DC to y
– But adding going from x to y
S(x,y)=Dist(DC,x)+Dist(DC,y)-Dist(x,y)
S(x,y) < 0 , when is this possible if ever?
35utdallas.edu/~metin
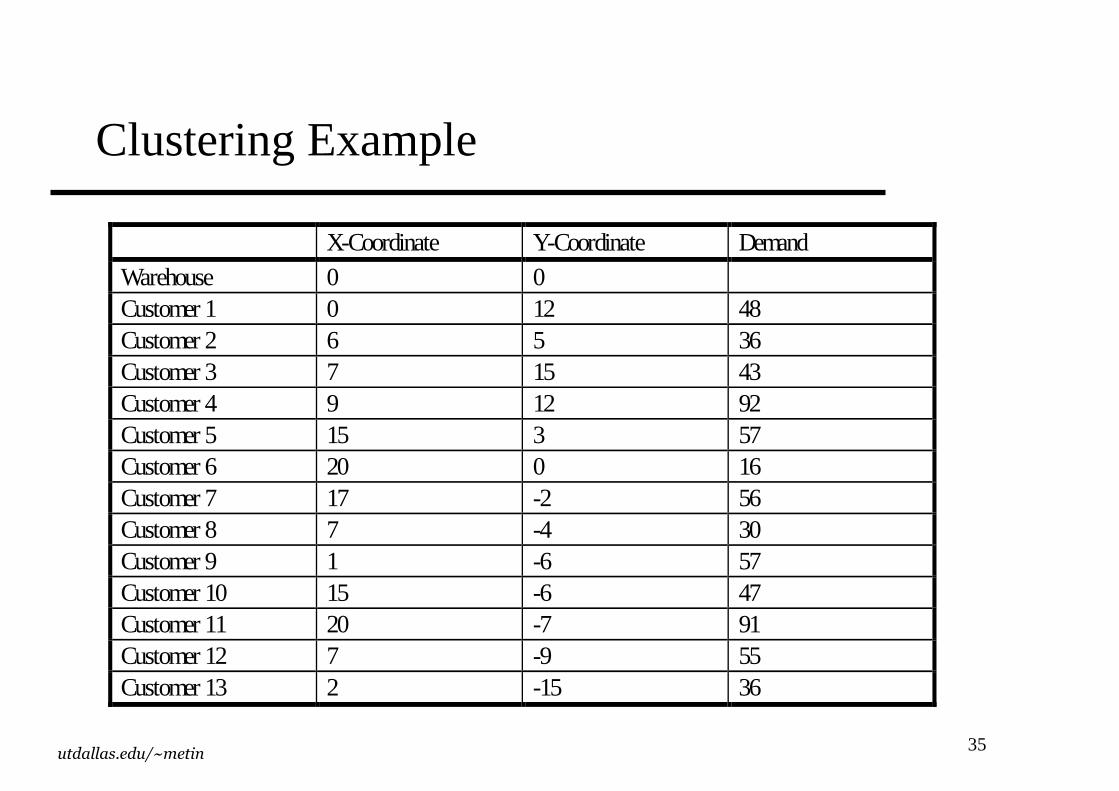
X-Coordinate Y-Coordinate DemandWarehouse 0 0Customer 1 0 12 48Customer 2 6 5 36Customer 3 7 15 43Customer 4 9 12 92Customer 5 15 3 57Customer 6 20 0 16Customer 7 17 -2 56Customer 8 7 -4 30Customer 9 1 -6 57Customer 10 15 -6 47Customer 11 20 -7 91Customer 12 7 -9 55Customer 13 2 -15 36
Clustering Example
36utdallas.edu/~metin
Whse Cust
1 Cust
2 Cust
3 Cust
4 Cust
5 Cust
6 Cust
7 Cust
8 Cust
9 Cust 10
Cust 11
Cust 12
Cust 13
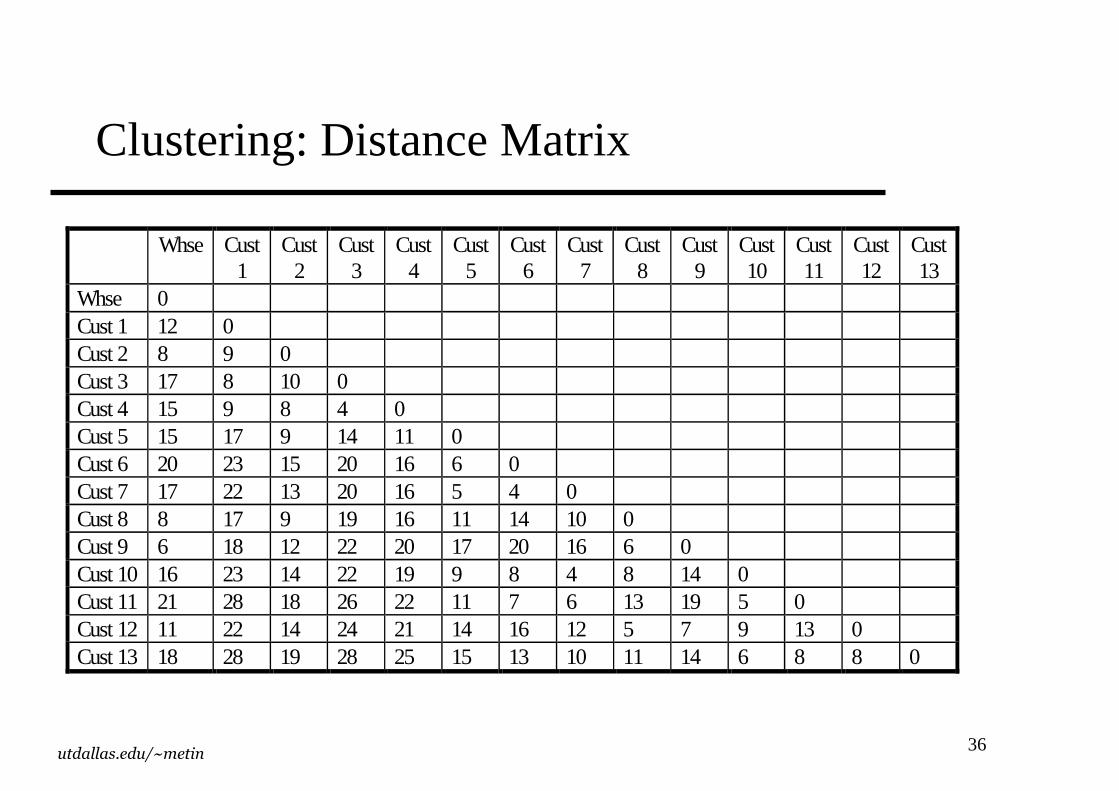
Whse 0 Cust 1 12 0 Cust 2 8 9 0 Cust 3 17 8 10 0 Cust 4 15 9 8 4 0 Cust 5 15 17 9 14 11 0 Cust 6 20 23 15 20 16 6 0 Cust 7 17 22 13 20 16 5 4 0 Cust 8 8 17 9 19 16 11 14 10 0 Cust 9 6 18 12 22 20 17 20 16 6 0 Cust 10 16 23 14 22 19 9 8 4 8 14 0 Cust 11 21 28 18 26 22 11 7 6 13 19 5 0 Cust 12 11 22 14 24 21 14 16 12 5 7 9 13 0 Cust 13 18 28 19 28 25 15 13 10 11 14 6 8 8 0
Clustering: Distance Matrix
37utdallas.edu/~metin
Truck Cust 1
Cust 2
Cust 3
Cust 4
Cust 5
Cust 6
Cust 7
Cust 8
Cust 9
Cust 10
Cust 11
Cust 12
Cust 13
Cust 1 1 0 Cust 2 2 11 0 Cust 3 3 21 15 0
Cust 4 4 18 15 28 0
Cust 5 5 10 14 18 19 0 Cust 6 6 9 13 17 19 29 0 Cust 7 7 7 12 14 16 27 33 0
Cust 8 8 3 7 6 7 12 14 15 0 Cust 9 9 0 2 1 1 4 6 7 8 0 Cust 10 10 5 10 11 12 22 28 29 16 8 0 Cust 11 11 5 11 12 14 25 34 32 16 8 32 0
Cust 12 12 1 5 4 8 12 15 16 14 10 18 19 0 Cust 13 13 2 7 7 8 18 25 25 15 10 28 31 21 0
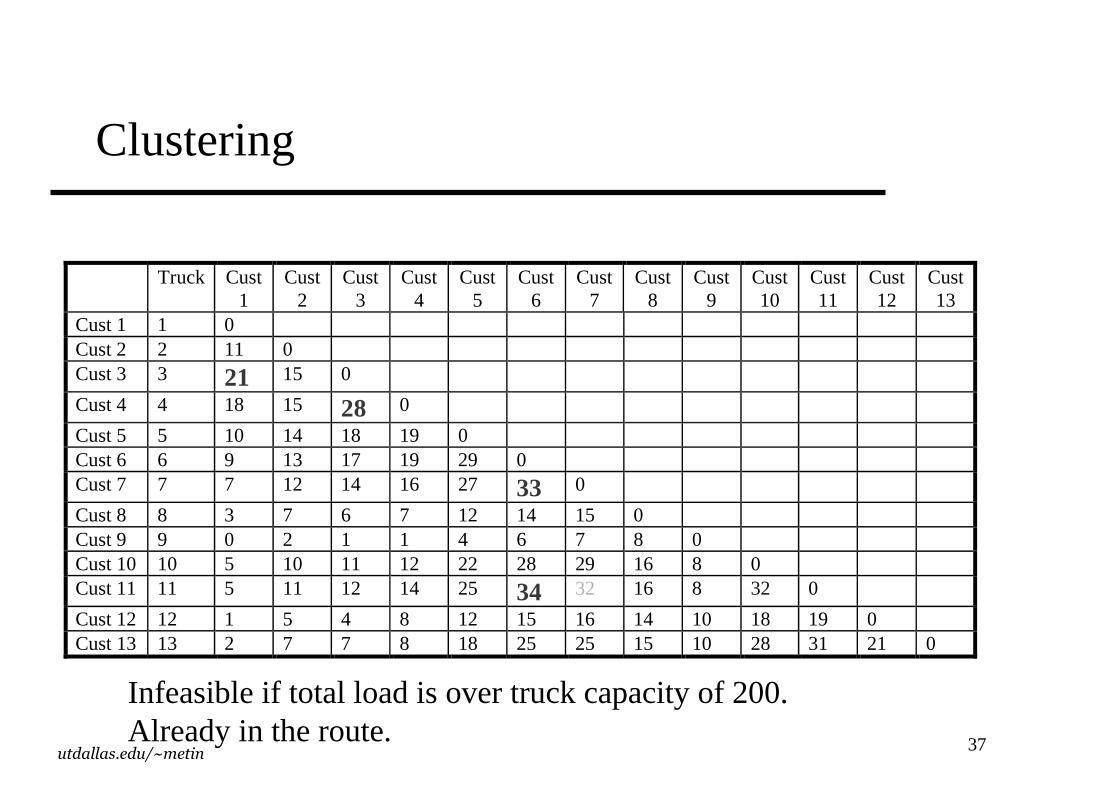
Clustering
Infeasible if total load is over truck capacity of 200.Already in the route.
38utdallas.edu/~metin
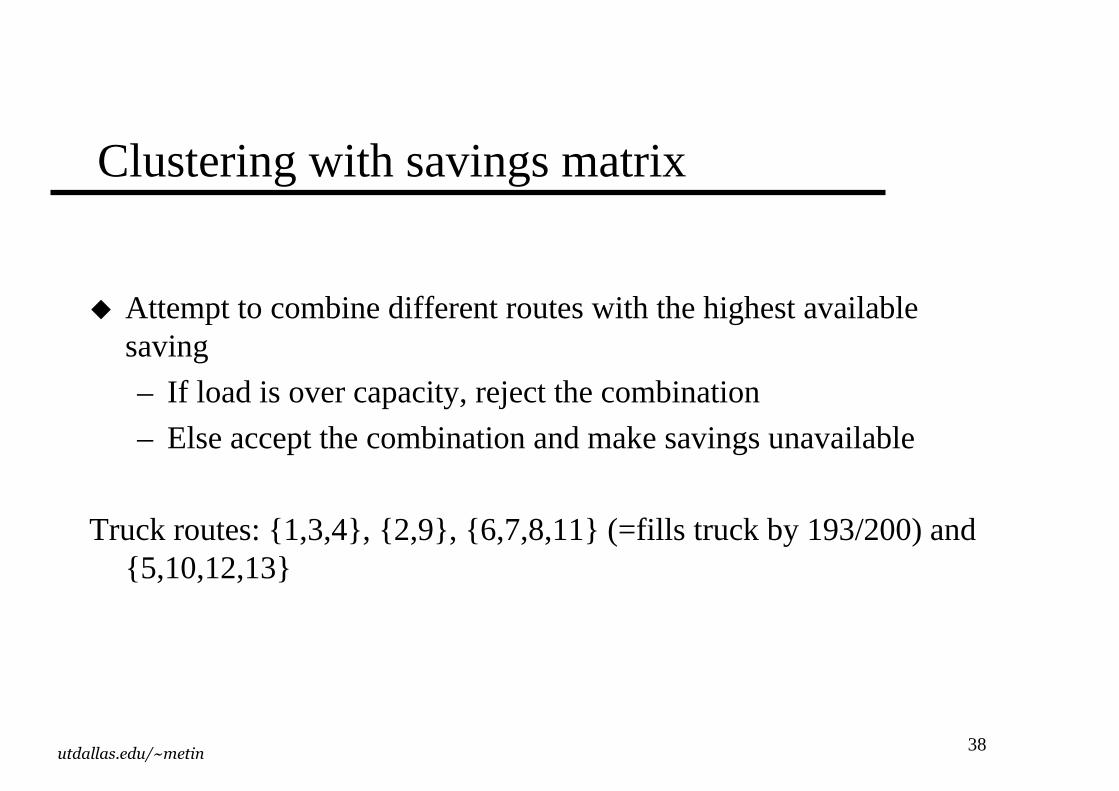
Clustering with savings matrix
� Attempt to combine different routes with the highest available saving
– If load is over capacity, reject the combination
– Else accept the combination and make savings unavailable
Truck routes: { 1,3,4} , { 2,9} , { 6,7,8,11} (=fills truck by 193/200) and { 5,10,12,13}
39utdallas.edu/~metin
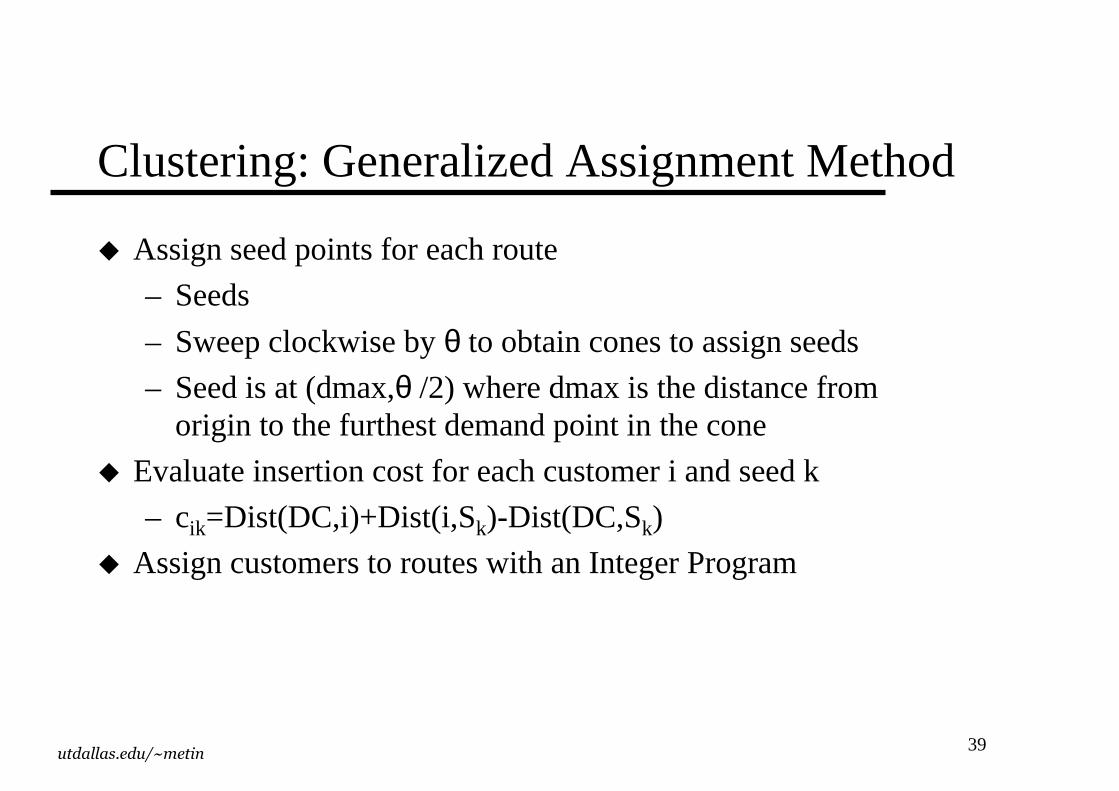
Clustering: Generalized Assignment Method
� Assign seed points for each route
– Seeds
– Sweep clockwise by θ to obtain cones to assign seeds
– Seed is at (dmax,θ /2) where dmax is the distance from origin to the furthest demand point in the cone
� Evaluate insertion cost for each customer i and seed k
– cik=Dist(DC,i)+Dist(i,Sk)-Dist(DC,Sk)
� Assign customers to routes with an Integer Program
40utdallas.edu/~metin
How Much to Sweep
�For every cone sweep as much as possible before going over the transportation capacity bk
�What if for same demand point i:– If i is not included, below capacity and if i is
included above capacity» Use the ArcTan method of the book
» Decide ad hoc, remember you are not making the final call here. The final assignments and cluster construction is by the Integer Program.
41utdallas.edu/~metin
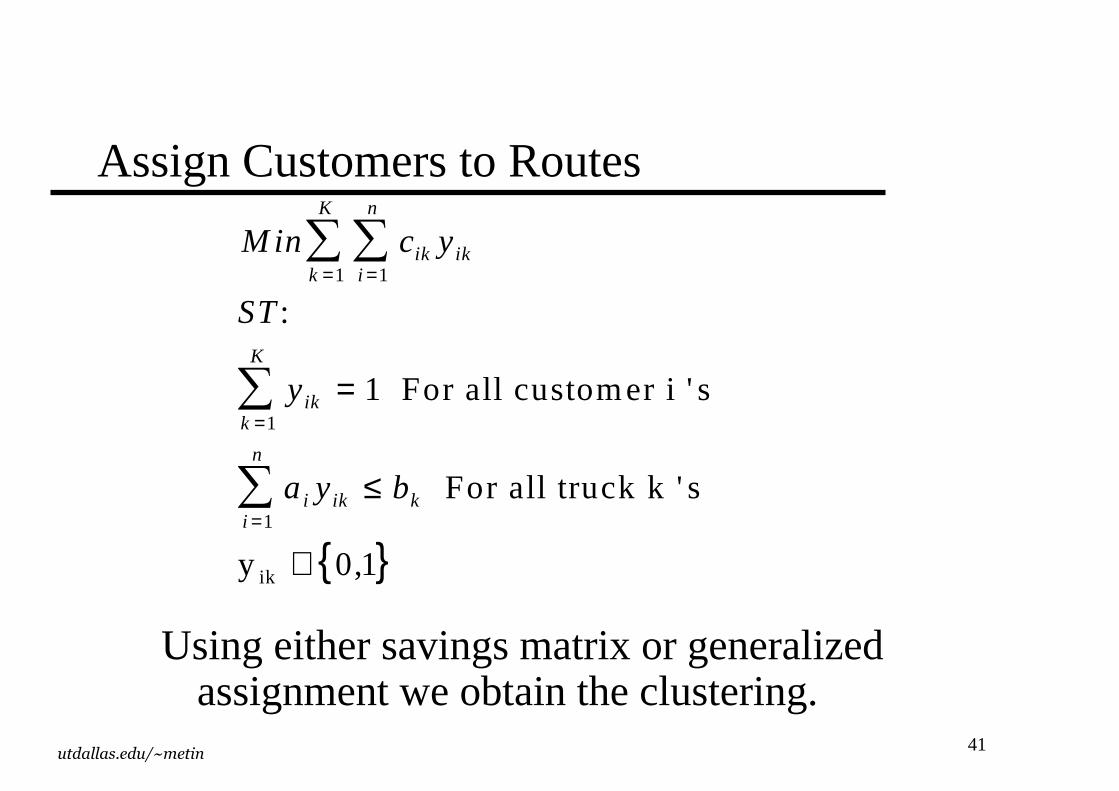
Assign Customers to Routes
Using either savings matrix or generalized assignment we obtain the clustering.
{ }
M in c y
ST
y
a y b
ik iki
n
k
K
ikk
K
i iki
n
k
==
=
=
∑∑
∑∑
=
≤
∈
11
1
1
1
0 1
:
,
For al l customer i ' s
For al l truck k ' s
y ik
42utdallas.edu/~metin
Routing by Construction
� Traveling Salesman Problem, construction heuristics:– Farthest insert: Given a trip and customers to be inserted,
obtain the best way to insert each customer. Insert the customer giving the longest trip.
– Nearest insert: Exactly the same as farthest insert, except that the customer giving the shortest trip is inserted.
– Nearest neighbor: Insert the nearest neighbor.– Sweep: Insert in the order of a sweep.� Sweep needs a picture
43utdallas.edu/~metin
Routing by Improvement
�Traveling Salesman problem, route improvement– 2-Opt, cuts into two paths, how many ways to
join?
– 3-Opt, cuts into three paths, how many ways to join?
– Both needs a route to begin with. They cut and paste pieces of routes to improve the total length of the tour.
44utdallas.edu/~metin
Summary of Learning Objectives
�Strengths and weaknesses of transport modes
�Choices of transportation networks
�Tradeoffs in transportation network design
�Tailored transportation networks
�Heuristics for Clustering and Sequencing