Embed Size (px)
Citation preview
Chapter 12Experimental Designs
Chapter Objectives• understand the role and scope of experimental research in
business • distinguish between causal and correlational analysis • explain the difference between laboratory and field
experiments • explain the following terms: extraneous variables,
manipulation, experimental and control groups, treatment effect, matching and randomisation
• discuss the seven possible threats to internal validity in experimental designs
• describe the different types of experimental designs• explain the role of simulation in experimental research • describe the ethical issues involved in experimental research
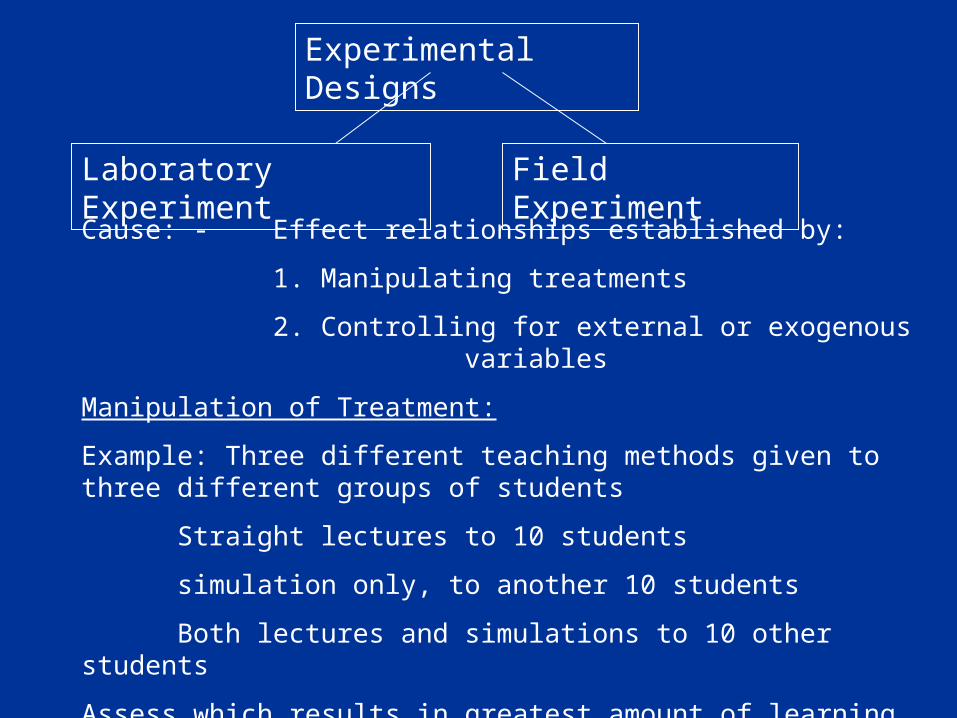
Experimental Designs
Laboratory Experiment Field Experiment
Cause: - Effect relationships established by:
1. Manipulating treatments
2. Controlling for external or exogenous variables
Manipulation of Treatment:
Example: Three different teaching methods given to three different groups of students
Straight lectures to 10 students
simulation only, to another 10 students
Both lectures and simulations to 10 other students
Assess which results in greatest amount of learning
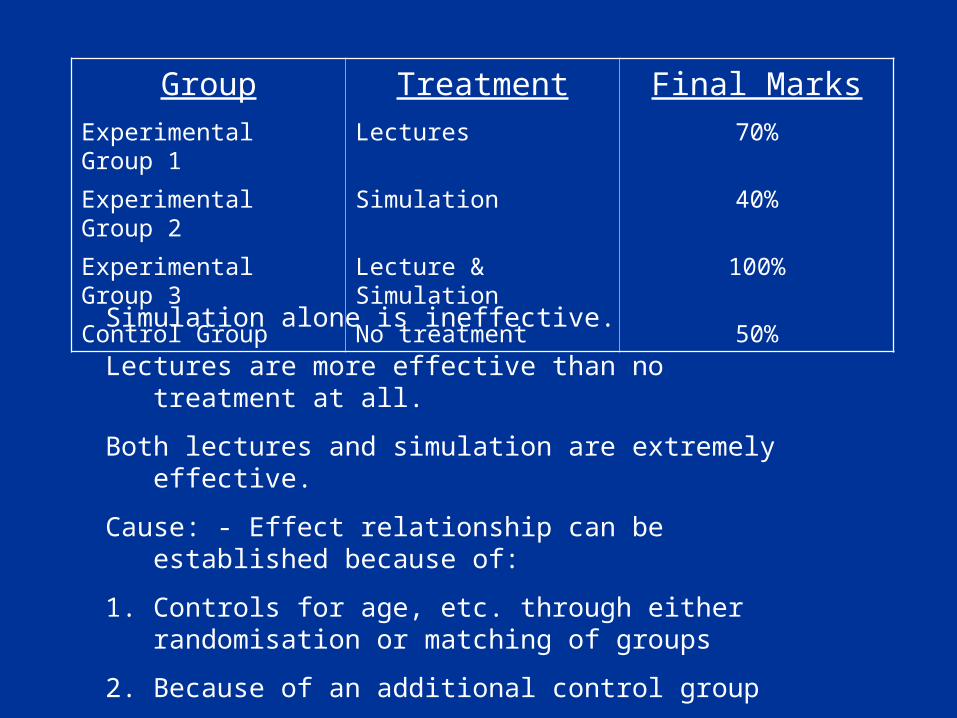
Group Treatment Final MarksExperimental Group 1 Lectures 70%
Experimental Group 2 Simulation 40%
Experimental Group 3 Lecture & Simulation 100%
Control Group No treatment 50%
Simulation alone is ineffective.
Lectures are more effective than no treatment at all.
Both lectures and simulation are extremely effective.
Cause: - Effect relationship can be established because of:
1. Controls for age, etc. through either randomisation or matching of groups
2. Because of an additional control group
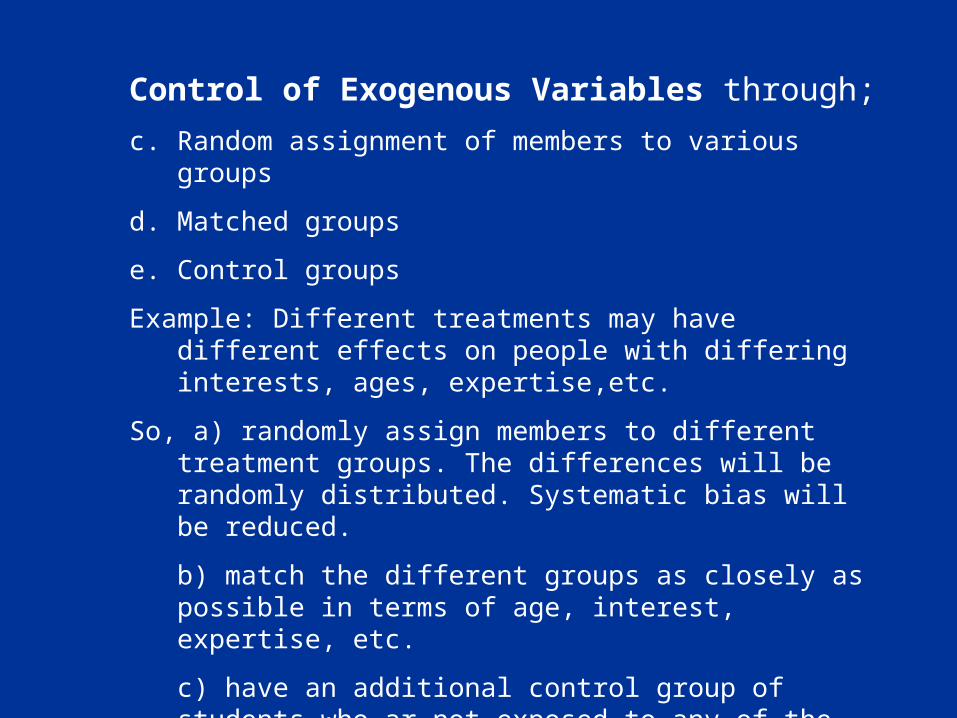
Control of Exogenous Variables through;
c. Random assignment of members to various groups
d. Matched groups
e. Control groups
Example: Different treatments may have different effects on people with differing interests, ages, expertise,etc.
So, a) randomly assign members to different treatment groups. The differences will be randomly distributed. Systematic bias will be reduced.
b) match the different groups as closely as possible in terms of age, interest, expertise, etc.
c) have an additional control group of students who ar not exposed to any of the three treatments, and see how they learn and compare.
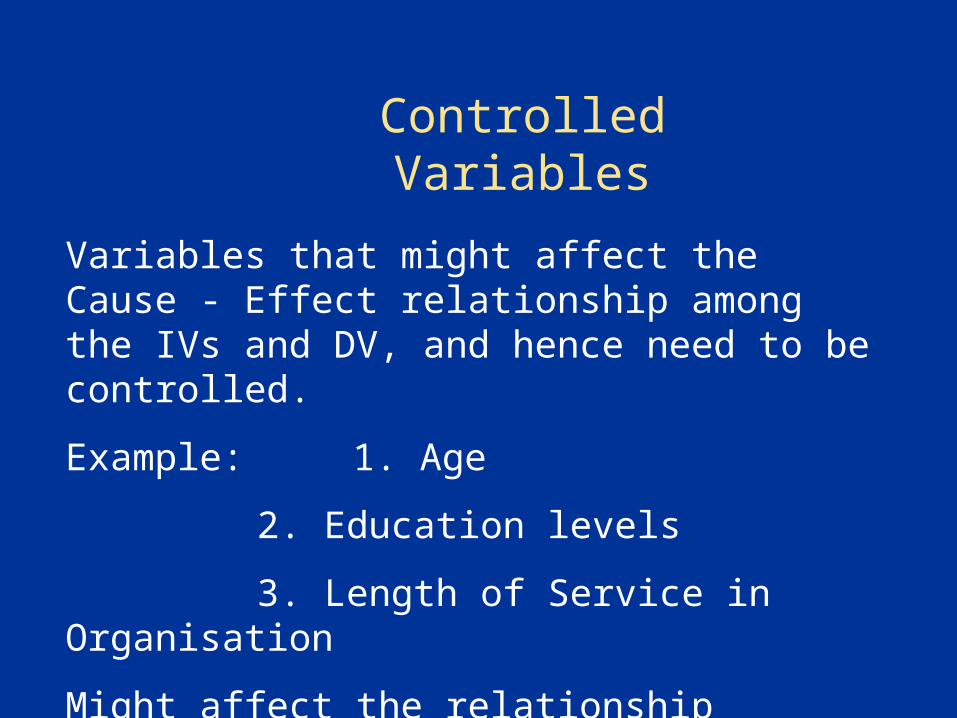
Variables that might affect the Cause - Effect relationship among the IVs and DV, and hence need to be controlled.
Example: 1. Age
2. Education levels
3. Length of Service in Organisation
Might affect the relationship between job characteristics and job satisfaction
Controlled Variables
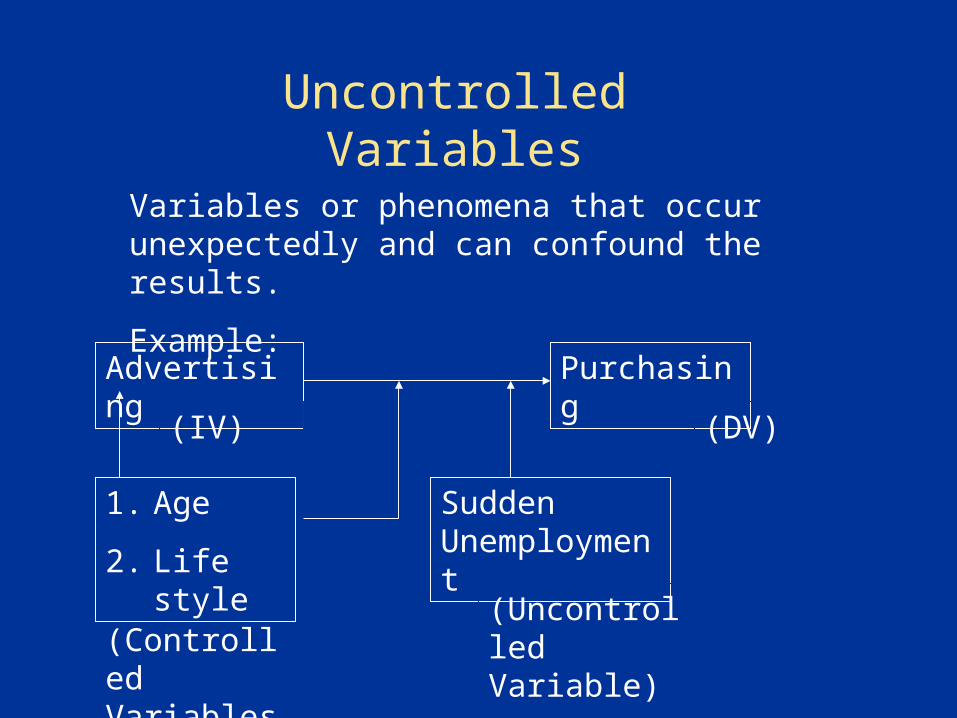
Variables or phenomena that occur unexpectedly and can confound the results.
Example:
Uncontrolled Variables
Advertising Purchasing
1. Age
2. Life style
Sudden Unemployment
(IV) (DV)
(Uncontrolled Variable)(Controlled
Variables)
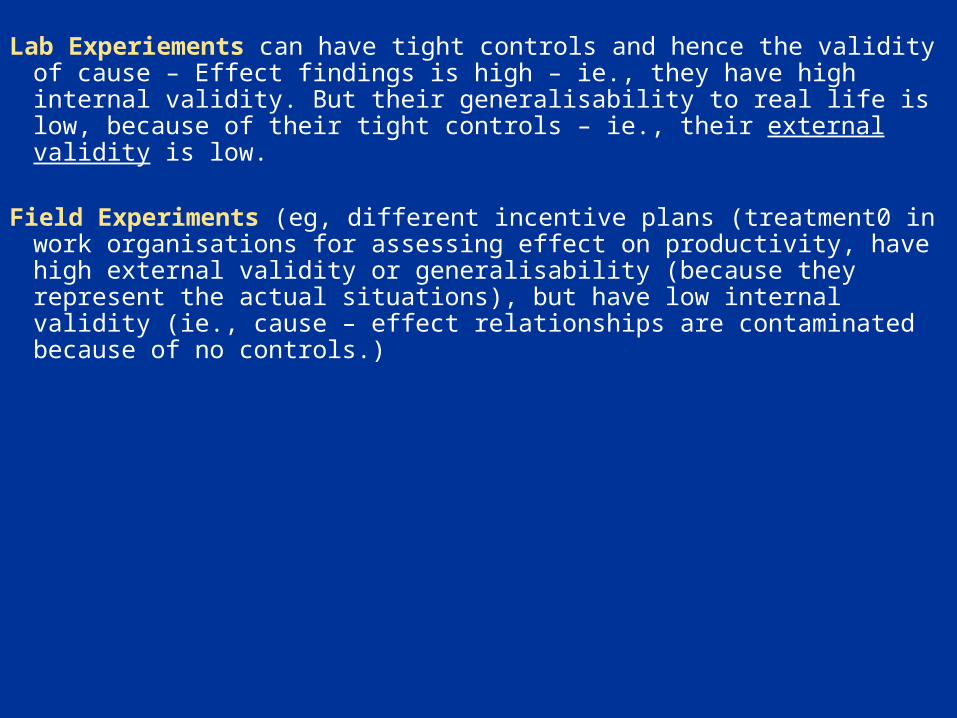
Lab Experiements can have tight controls and hence the validity of cause – Effect findings is high – ie., they have high internal validity. But their generalisability to real life is low, because of their tight controls – ie., their external validity is low.
Field Experiments (eg, different incentive plans (treatment0 in work organisations for assessing effect on productivity, have high external validity or generalisability (because they represent the actual situations), but have low internal validity (ie., cause – effect relationships are contaminated because of no controls.)
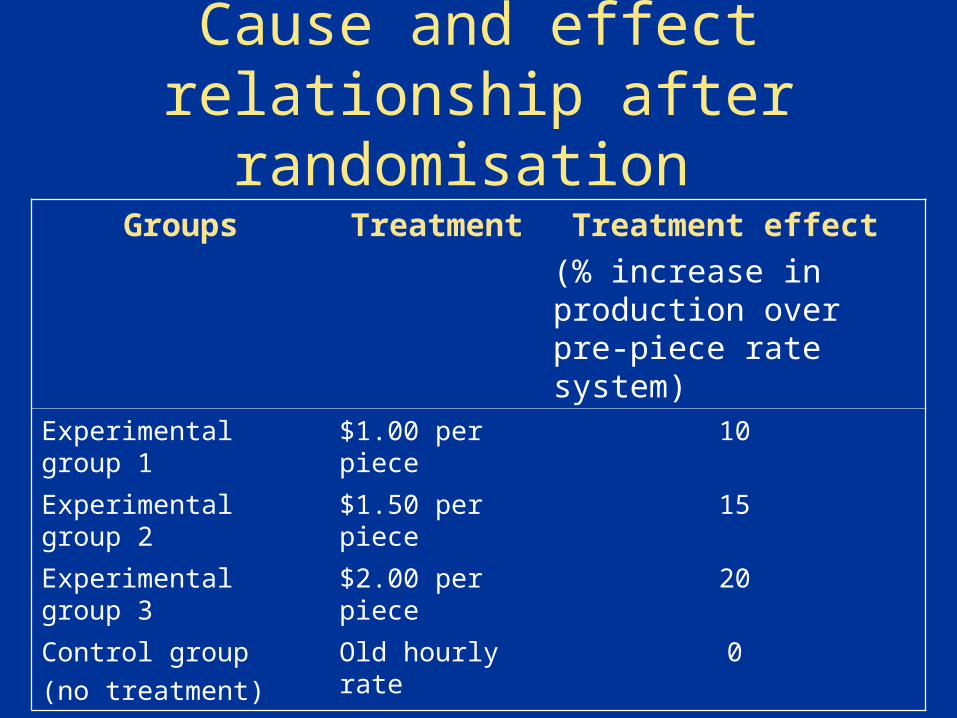
Cause and effect relationship after randomisation
Groups Treatment Treatment effect
(% increase in production over pre-piece rate system)
Experimental group 1 $1.00 per piece 10
Experimental group 2 $1.50 per piece 15
Experimental group 3 $2.00 per piece 20
Control group
(no treatment)
Old hourly rate 0
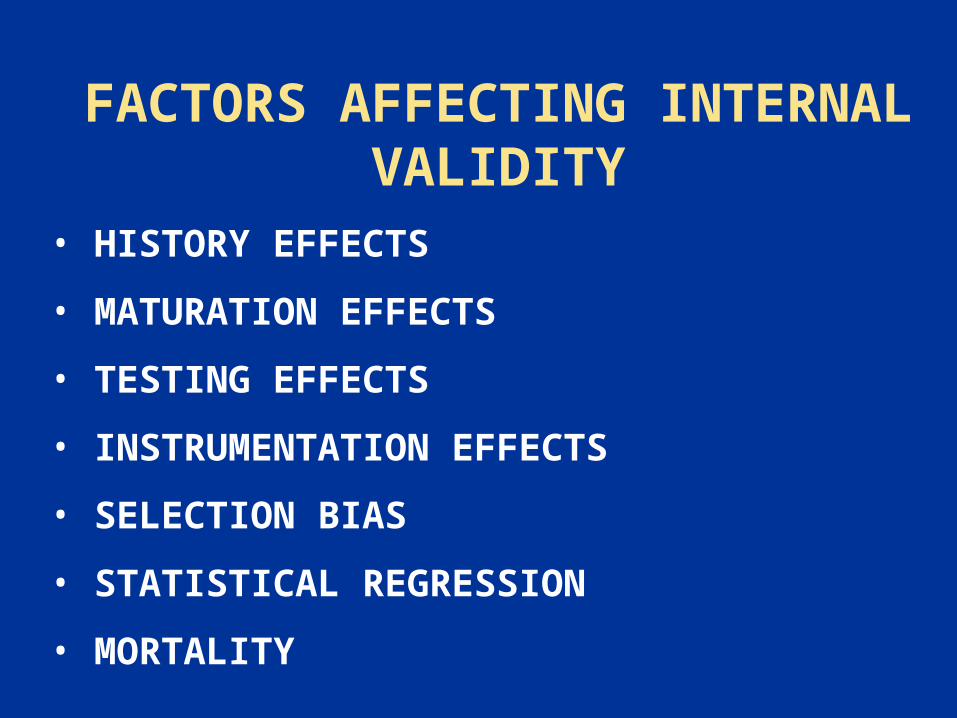
FACTORS AFFECTING INTERNAL VALIDITY
• HISTORY EFFECTS
• MATURATION EFFECTS
• TESTING EFFECTS
• INSTRUMENTATION EFFECTS
• SELECTION BIAS
• STATISTICAL REGRESSION
• MORTALITY
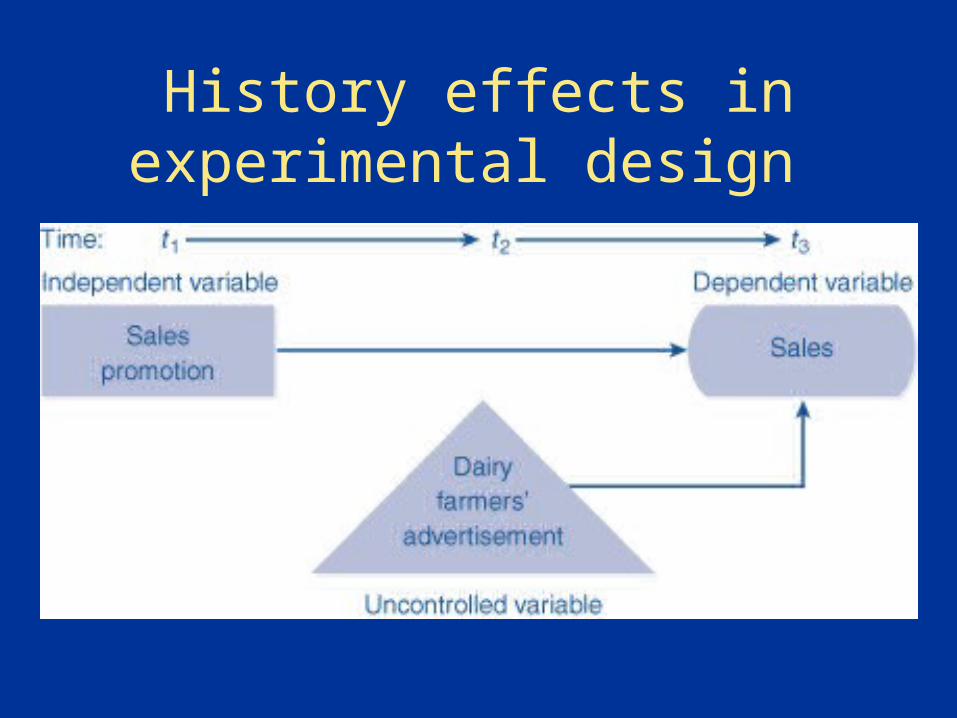
History effects inexperimental design
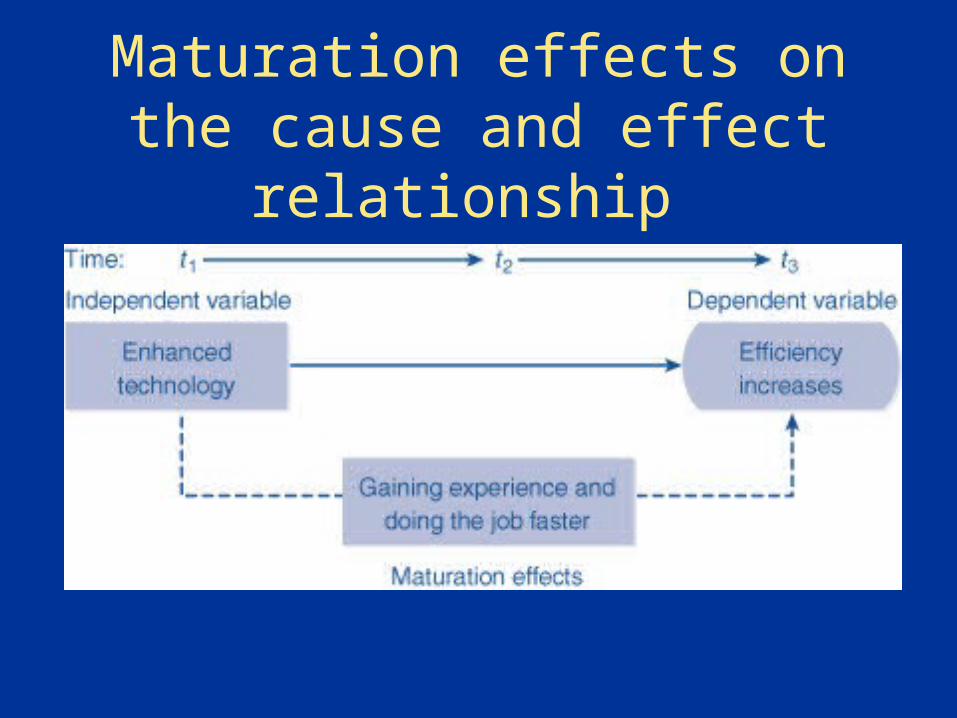
Maturation effects on the cause and effect relationship
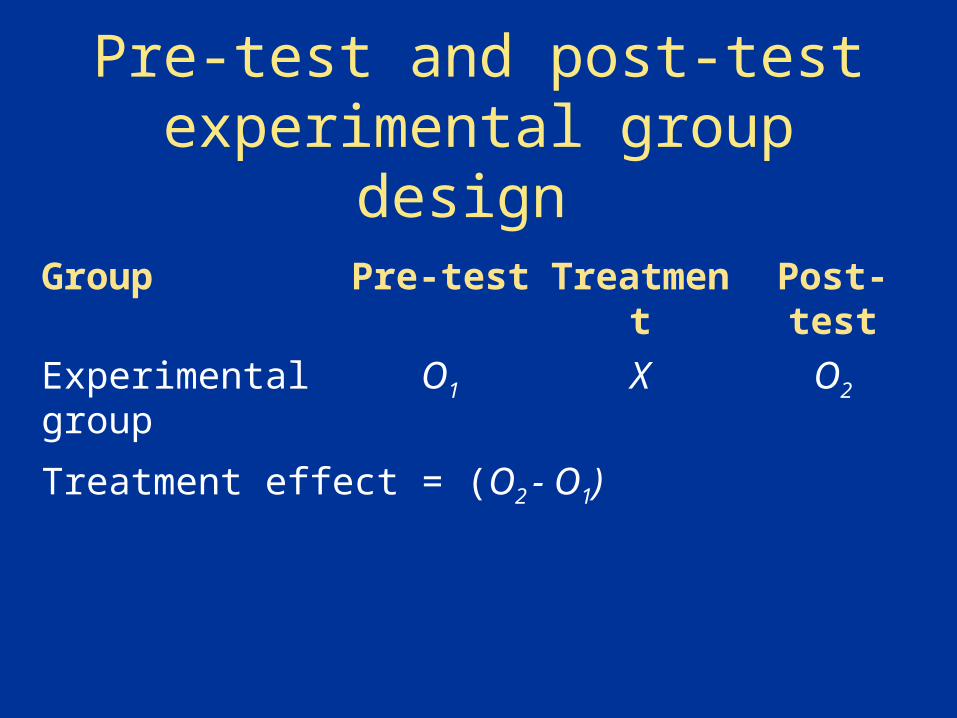
Pre-test and post-test experimental group design
Group Pre-test Treatment Post-test
Experimental group
O1 X O2
Treatment effect = (O2 - O1)
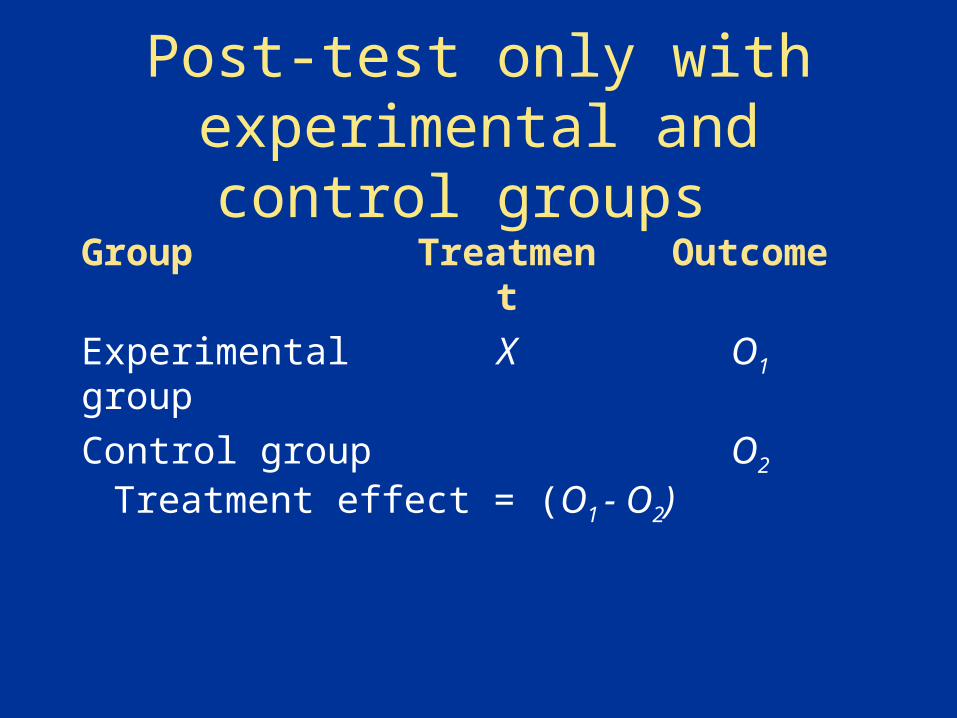
Post-test only with experimental and control groups
Group Treatment Outcome
Experimental group
X O1
Control group O2
Treatment effect = (O1 - O2)
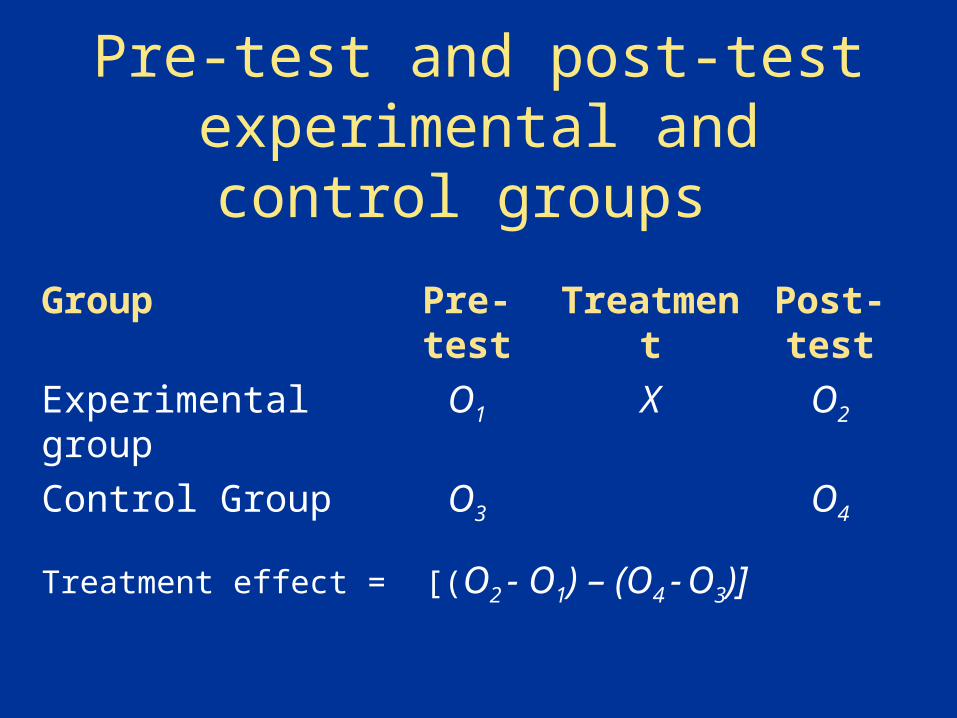
Pre-test and post-test experimental and control groups
Group Pre-test Treatment Post-test
Experimental group O1 X O2
Control Group O3 O4
Treatment effect = [(O2 - O1) – (O4 - O3)]
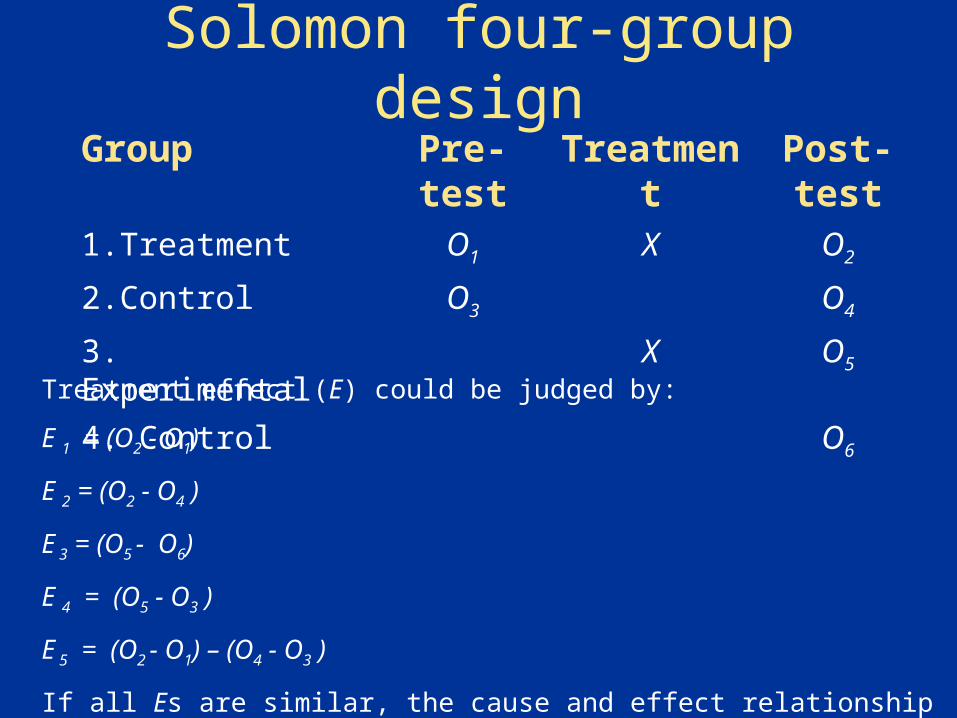
Solomon four-group design
Group Pre-test Treatment Post-test
1.Treatment O1 X O2
2.Control O3 O4
3. Experimental X O5
4. Control O6Treatment effect (E) could be judged by:
E 1 = (O2 - O1)
E 2 = (O2 - O4 )
E 3 = (O5 - O6)
E 4 = (O5 - O3 )
E 5 = (O2 - O1) – (O4 - O3 )
If all Es are similar, the cause and effect relationship is highly valid.
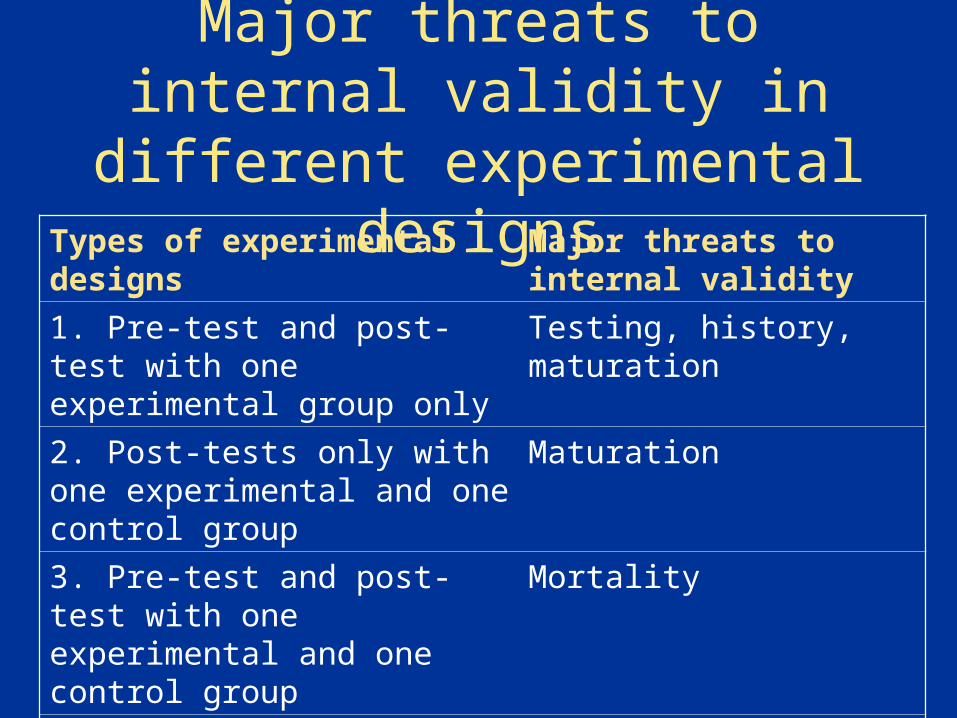
Major threats to internal validity in different experimental designs
Types of experimental designs
Major threats to internal validity
1. Pre-test and post-test with one experimental group only
Testing, history, maturation
2. Post-tests only with one experimental and one control group
Maturation
3. Pre-test and post-test with one experimental and one control group
Mortality
4. Solomon four-group design Mortality
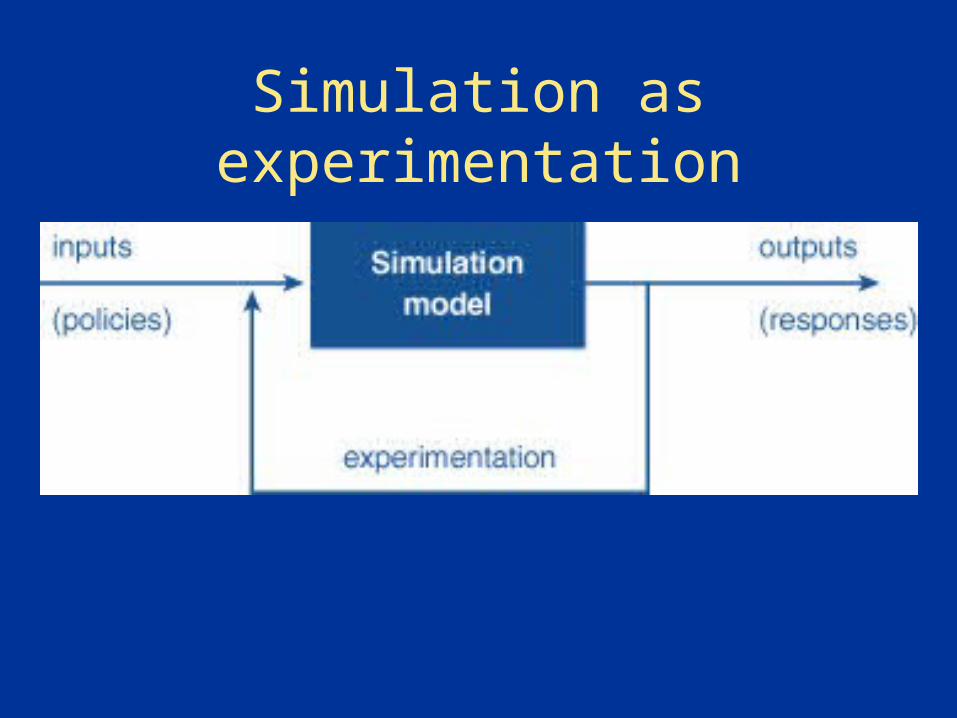
Simulation as experimentation
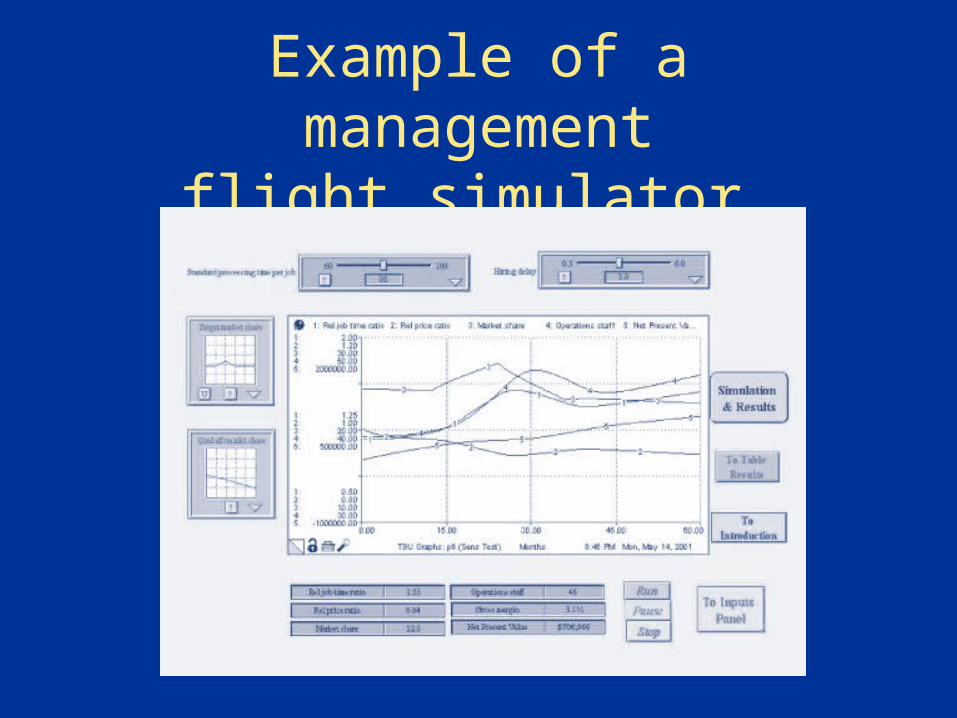
Example of a managementflight simulator
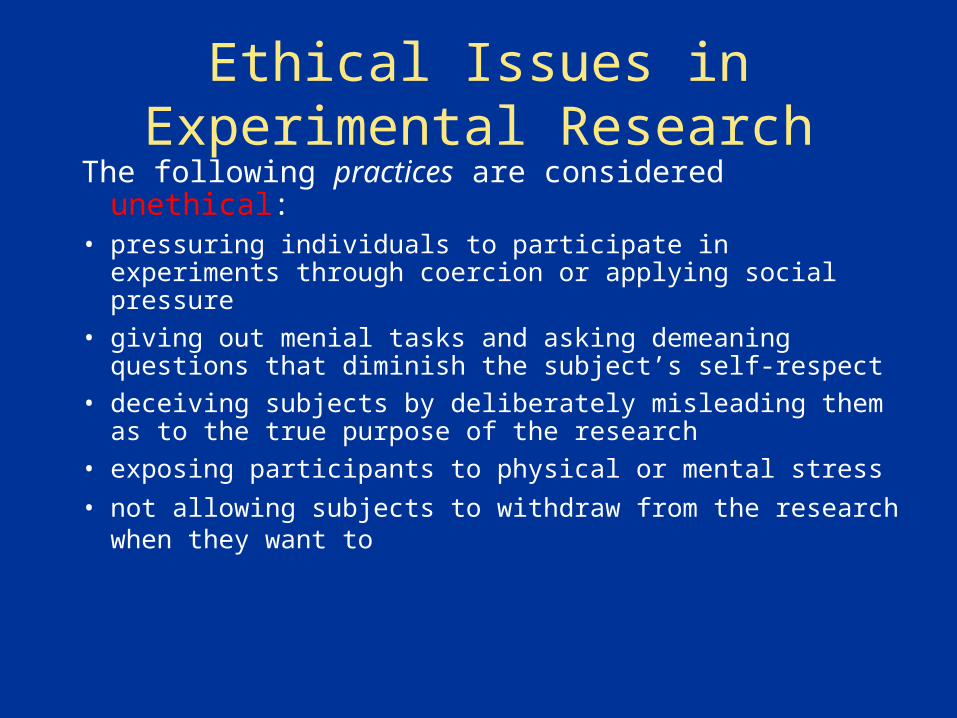
Ethical Issues in Experimental Research
The following practices are considered unethical:• pressuring individuals to participate in experiments
through coercion or applying social pressure
• giving out menial tasks and asking demeaning questions that diminish the subject’s self-respect
• deceiving subjects by deliberately misleading them as to the true purpose of the research
• exposing participants to physical or mental stress
• not allowing subjects to withdraw from the research when they want to
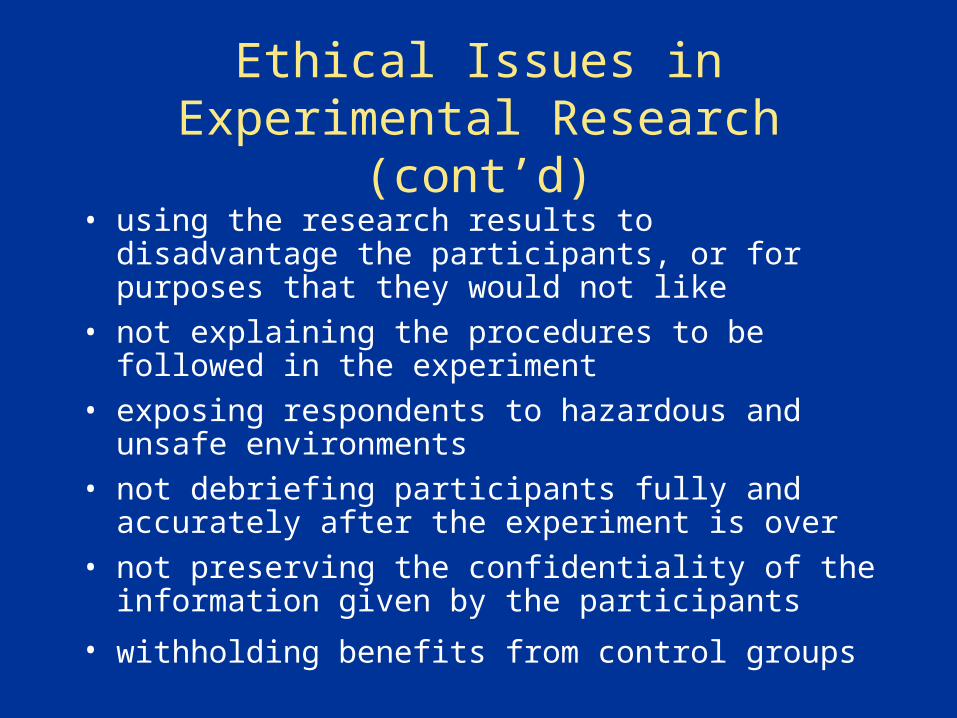
Ethical Issues in Experimental Research(cont’d)
• using the research results to disadvantage the participants, or for purposes that they would not like
• not explaining the procedures to be followed in the experiment
• exposing respondents to hazardous and unsafe environments
• not debriefing participants fully and accurately after the experiment is over
• not preserving the confidentiality of the information given by the participants
• withholding benefits from control groups
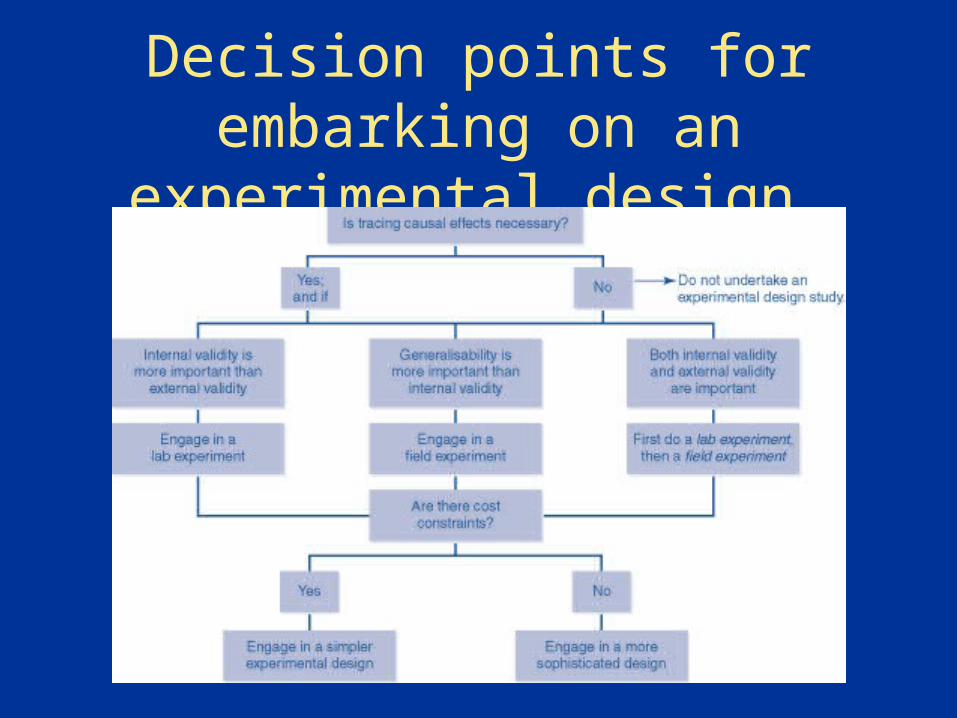
Decision points for embarking on an experimental design
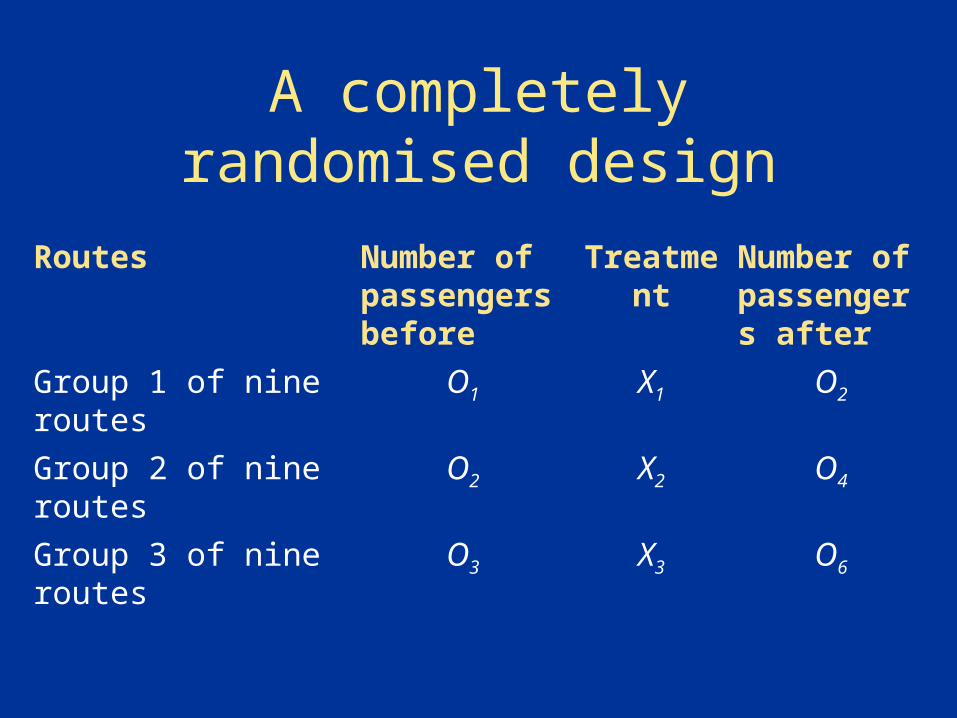
A completely randomised design
Routes Number of passengers before
Treatment
Number of passengers after
Group 1 of nine routes
O1 X1 O2
Group 2 of nine routes
O2 X2 O4
Group 3 of nine routes
O3 X3 O6
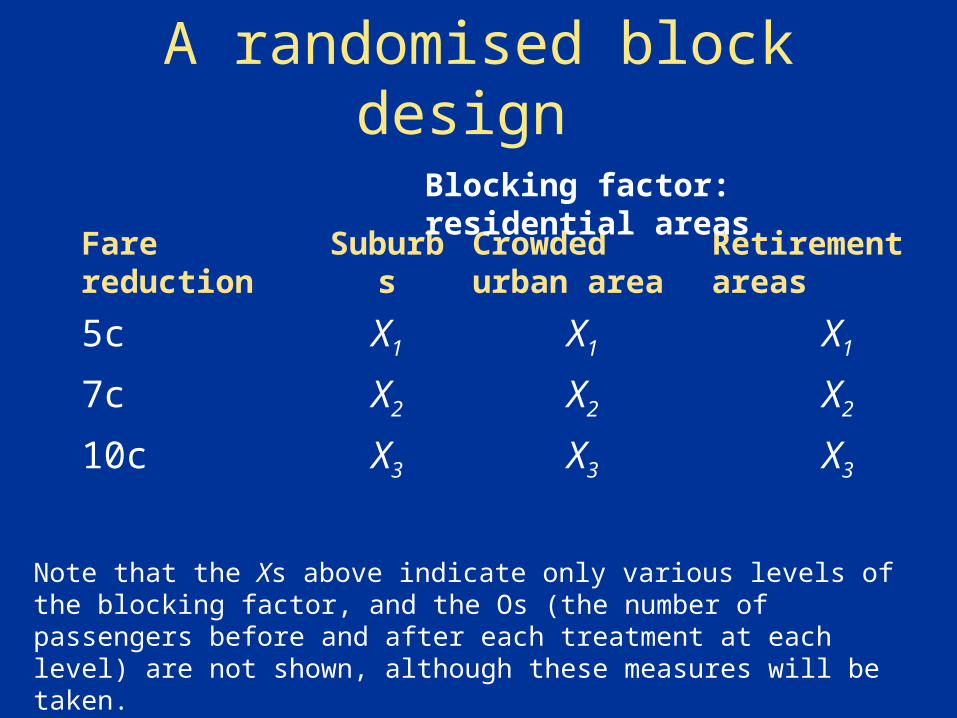
A randomised block design
Fare reduction
Suburbs Crowded urban area
Retirement areas
5c X1 X1 X1
7c X2 X2 X2
10c X3 X3 X3
Blocking factor: residential areas
Note that the Xs above indicate only various levels of the blocking factor, and the Os (the number of passengers before and after each treatment at each level) are not shown, although these measures will be taken.
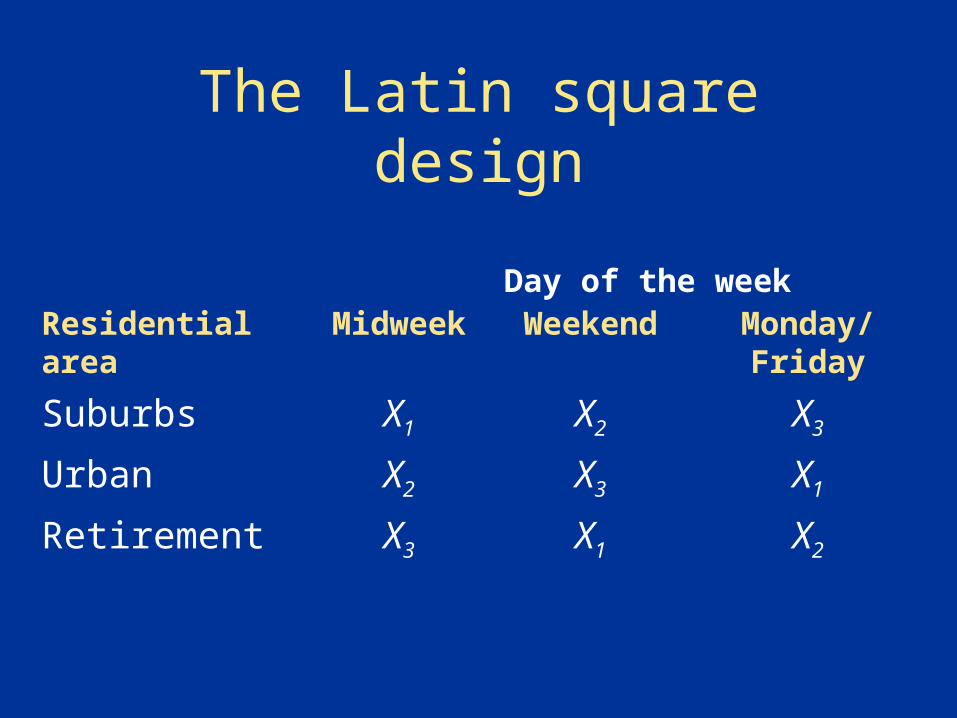
The Latin square design
Residential area Midweek Weekend Monday/Friday
Suburbs X1 X2 X3
Urban X2 X3 X1
Retirement X3 X1 X2
Day of the week
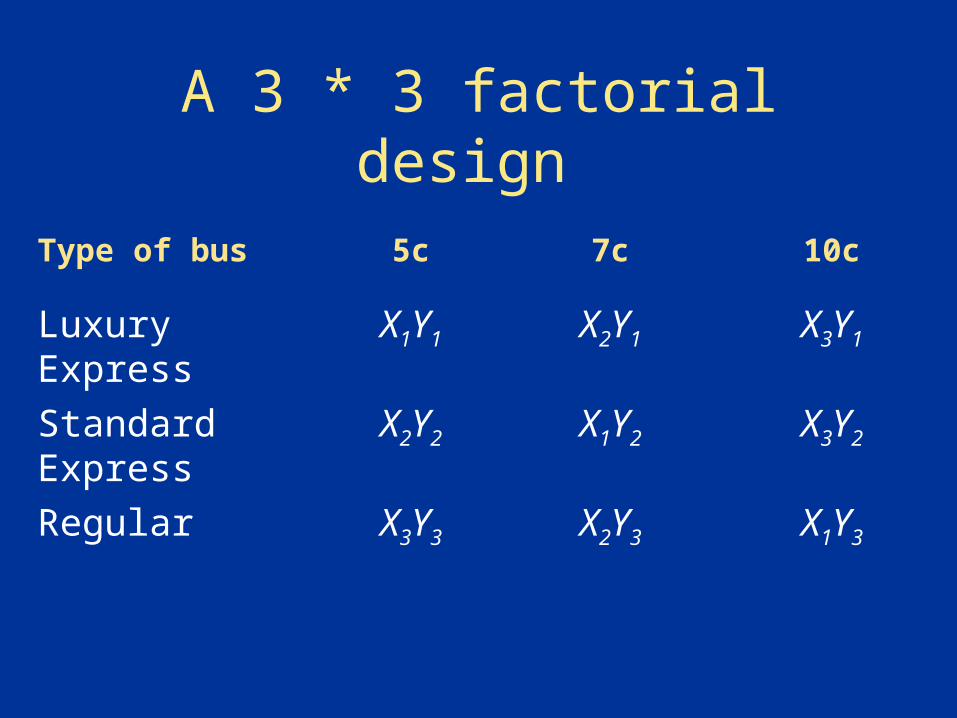
A 3 * 3 factorial design
Type of bus 5c 7c 10c
Luxury Express X1Y1 X2Y1 X3Y1
Standard Express
X2Y2 X1Y2 X3Y2
Regular X3Y3 X2Y3 X1Y3