Embed Size (px)
Citation preview
61
CHAPTER 3
EXPERIMENTAL INVESTIGATIONS 3.1 GENERAL
The choice of study area, the types of algal species considered, the details of
experimental investigations carried out under laboratory and field conditions, the
details of various analytical methods of investigations, phycochemical analysis and
macro-level studies carried out to ascertain the impact of biodeterioration, are
highlighted in this chapter.
3.2 MARINE ALGAE- DEFINITION, FIELD SURVEY AND
IDENTIFICATION
3.2.1 Definition
Seaweeds or benthic marine algae are the group of plants that live either in marine or
brackish water environment. Like the land plants, seaweeds contain photosynthetic
pigments and with the help of sunlight and nutrient present in the seawater, they
photosynthesize and produce food.
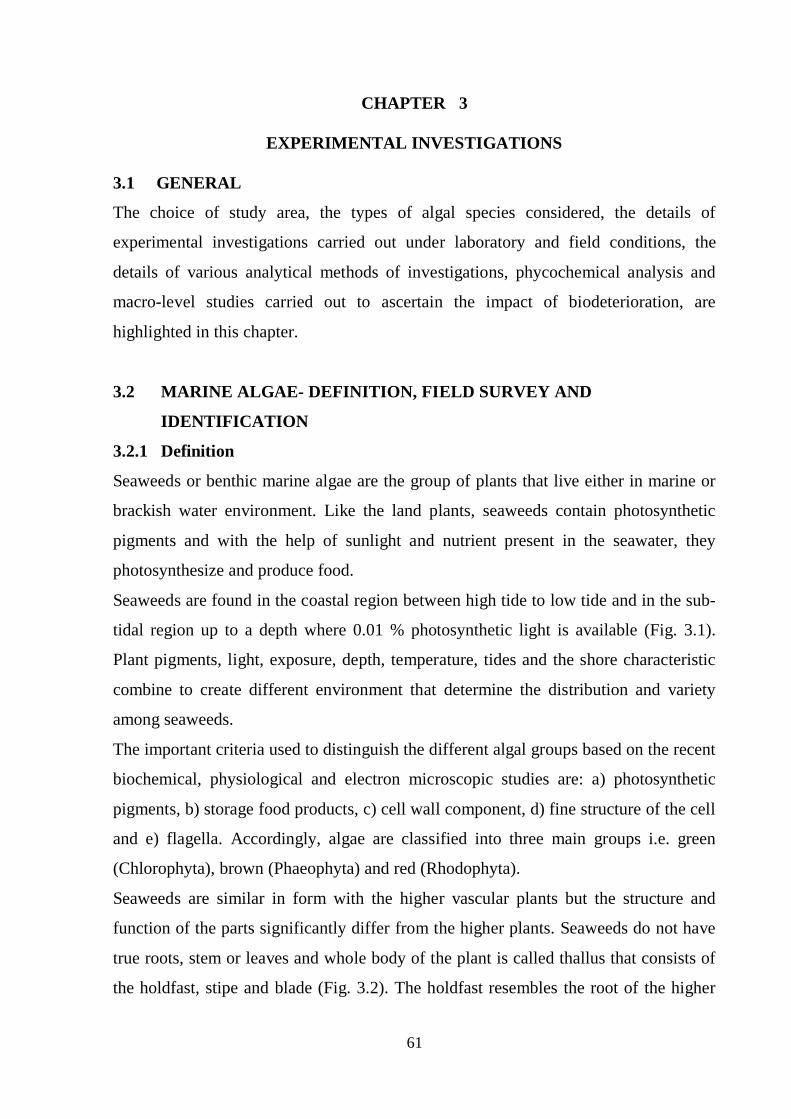
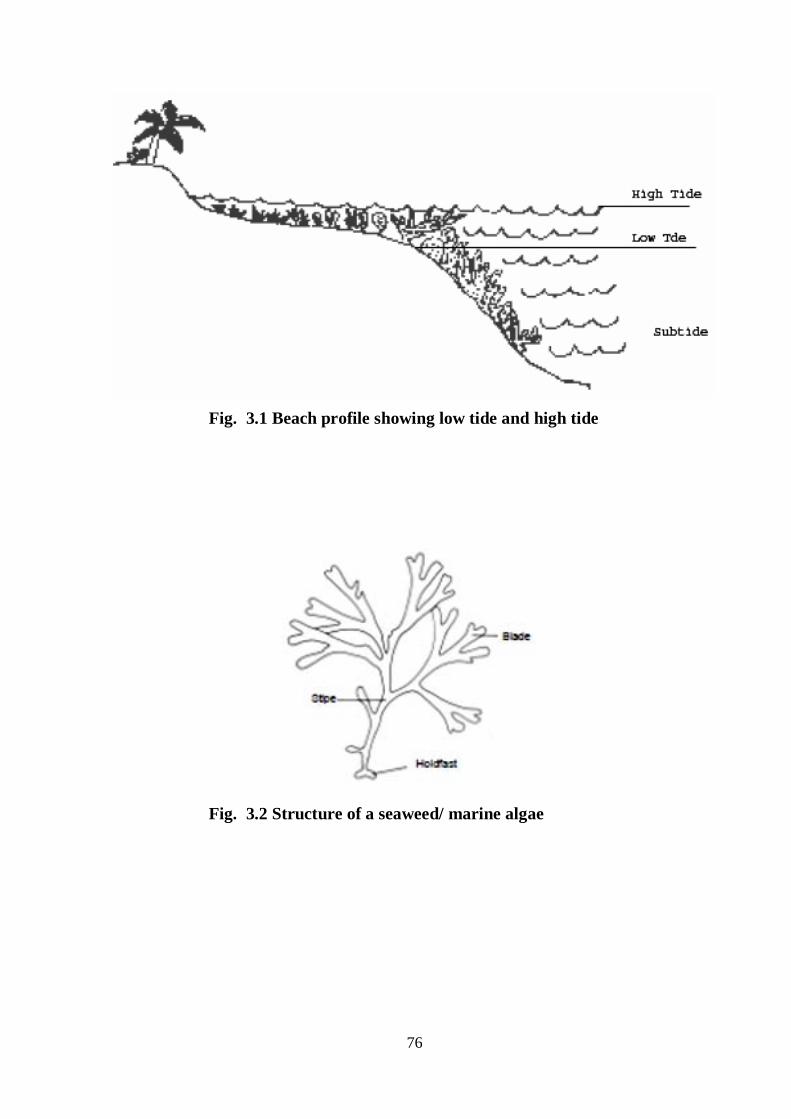
Seaweeds are found in the coastal region between high tide to low tide and in the sub-
tidal region up to a depth where 0.01 % photosynthetic light is available (Fig. 3.1).
Plant pigments, light, exposure, depth, temperature, tides and the shore characteristic
combine to create different environment that determine the distribution and variety
among seaweeds.
The important criteria used to distinguish the different algal groups based on the recent
biochemical, physiological and electron microscopic studies are: a) photosynthetic
pigments, b) storage food products, c) cell wall component, d) fine structure of the cell
and e) flagella. Accordingly, algae are classified into three main groups i.e. green
(Chlorophyta), brown (Phaeophyta) and red (Rhodophyta).
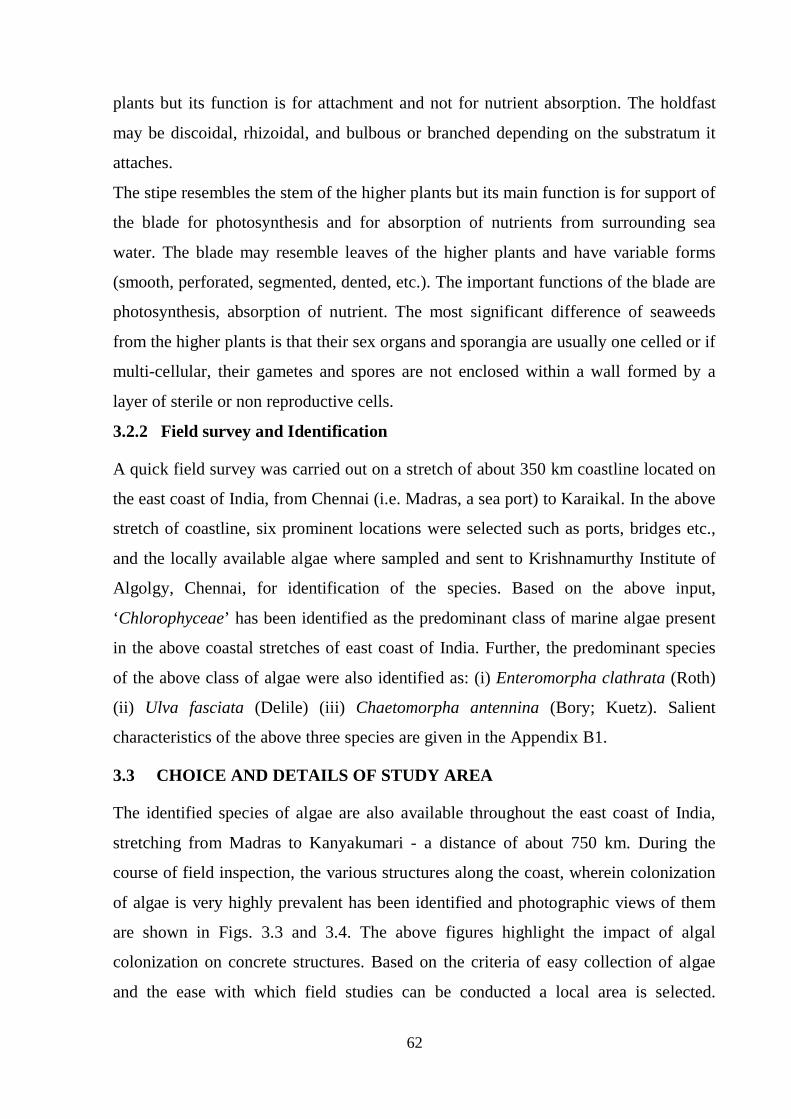
Seaweeds are similar in form with the higher vascular plants but the structure and
function of the parts significantly differ from the higher plants. Seaweeds do not have
true roots, stem or leaves and whole body of the plant is called thallus that consists of
the holdfast, stipe and blade (Fig. 3.2). The holdfast resembles the root of the higher
62
plants but its function is for attachment and not for nutrient absorption. The holdfast
may be discoidal, rhizoidal, and bulbous or branched depending on the substratum it
attaches.
The stipe resembles the stem of the higher plants but its main function is for support of
the blade for photosynthesis and for absorption of nutrients from surrounding sea
water. The blade may resemble leaves of the higher plants and have variable forms
(smooth, perforated, segmented, dented, etc.). The important functions of the blade are
photosynthesis, absorption of nutrient. The most significant difference of seaweeds
from the higher plants is that their sex organs and sporangia are usually one celled or if
multi-cellular, their gametes and spores are not enclosed within a wall formed by a
layer of sterile or non reproductive cells.
3.2.2 Field survey and Identification
A quick field survey was carried out on a stretch of about 350 km coastline located on
the east coast of India, from Chennai (i.e. Madras, a sea port) to Karaikal. In the above
stretch of coastline, six prominent locations were selected such as ports, bridges etc.,
and the locally available algae where sampled and sent to Krishnamurthy Institute of
Algolgy, Chennai, for identification of the species. Based on the above input,
‘Chlorophyceae’ has been identified as the predominant class of marine algae present
in the above coastal stretches of east coast of India. Further, the predominant species
of the above class of algae were also identified as: (i) Enteromorpha clathrata (Roth)
(ii) Ulva fasciata (Delile) (iii) Chaetomorpha antennina (Bory; Kuetz). Salient
characteristics of the above three species are given in the Appendix B1.
3.3 CHOICE AND DETAILS OF STUDY AREA
The identified species of algae are also available throughout the east coast of India,
stretching from Madras to Kanyakumari - a distance of about 750 km. During the
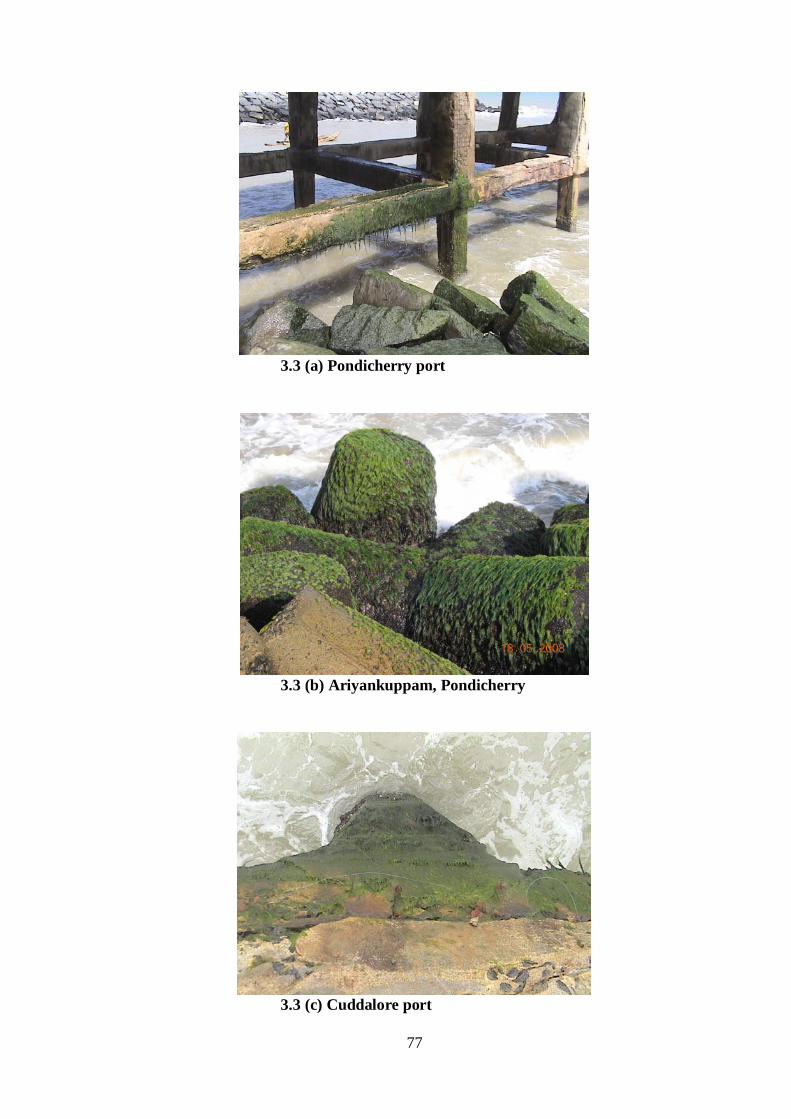
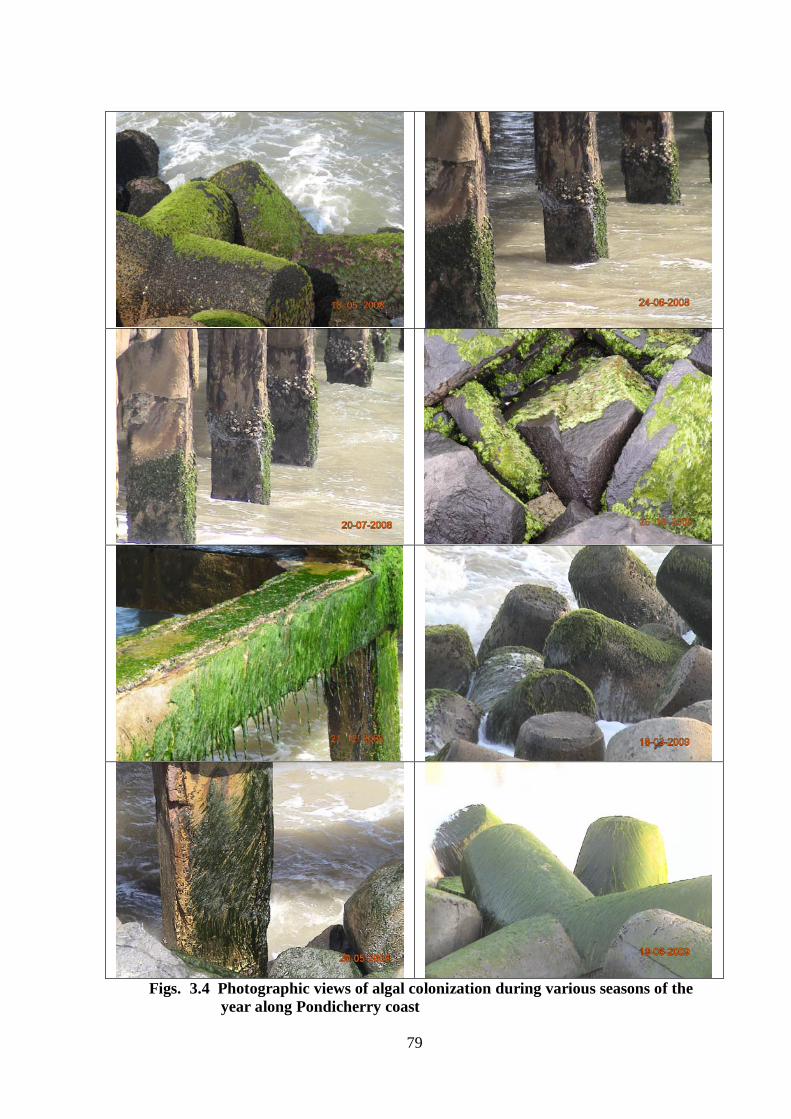
course of field inspection, the various structures along the coast, wherein colonization
of algae is very highly prevalent has been identified and photographic views of them
are shown in Figs. 3.3 and 3.4. The above figures highlight the impact of algal
colonization on concrete structures. Based on the criteria of easy collection of algae
and the ease with which field studies can be conducted a local area is selected.
63
Accordingly, Pondicherry coast located along the east coast of India was selected for
the present study. It is located south of Chennai (Madras) at about 140 km along the
east coast of South India. Pondicherry is bounded by the Bay of Bengal on the east and
all other sides are bounded by the South Arcot district of Tamilnadu. The latitude and
longitude of Pondicherry are: 11056’ N and 790
In order to study the biodeterioration of algae on concretes, sufficient numbers of
cubes (100x100x100 mm) were casted. Cubes thus cast were kept exposed in fresh
water and sea water (without colonization of algal on their surfaces), so as to serve as
‘control’ specimens for the biodeterioration studies. Further, colonization of algae on
concrete cubes were permitted under two environmental regimes, namely (i) under
controlled laboratory conditions and (ii) under actual field conditions in the chosen
study area. Concrete cubes ‘cured’ upto the normal age of 28 days were used for
colonization of algae. When the algal species were attempted to colonize on concrete
50’ E, respectively. Fig 3.5 shows the
location map of the study area. Pondicherry has an average maximum temperature of
31.5º C and an average minimum temperature of 23.9º C. The average annual rainfall
of the region is about 1300 mm.
3.4 LABORATORY AND FIELD INVESTIGATIONS
3.4.1 Choice of Grades of Concrete
As per IS 456 (2000), the minimum grade of concrete for use as a structural material
and (plain) concrete exposed directly along sea – cost shall be M20. Further, calcium
is the most essential for the metabolic activity of algae (see section 2.3.5). Generally,
higher grades of concrete contain higher amount of calcium and hence higher grades
of concrete are expected to provide a higher potential for the metabolic activity of
algae. In view of the above, two grades of concrete, namely M20 and M25 were
selected for the present study. The above two grades of concrete were expected to
influence the metabolic activity of the algae due to varying cement content present in
the mix. Indian Standard of mix proportioning [IS 10262 (1982)] was adopted for
obtaining the design mix proportions of the above two grades of concrete. Brief details
of the approach and mix proportioning calculations are given in Appendix B2.
3.4.2 Experimental Schemes

64
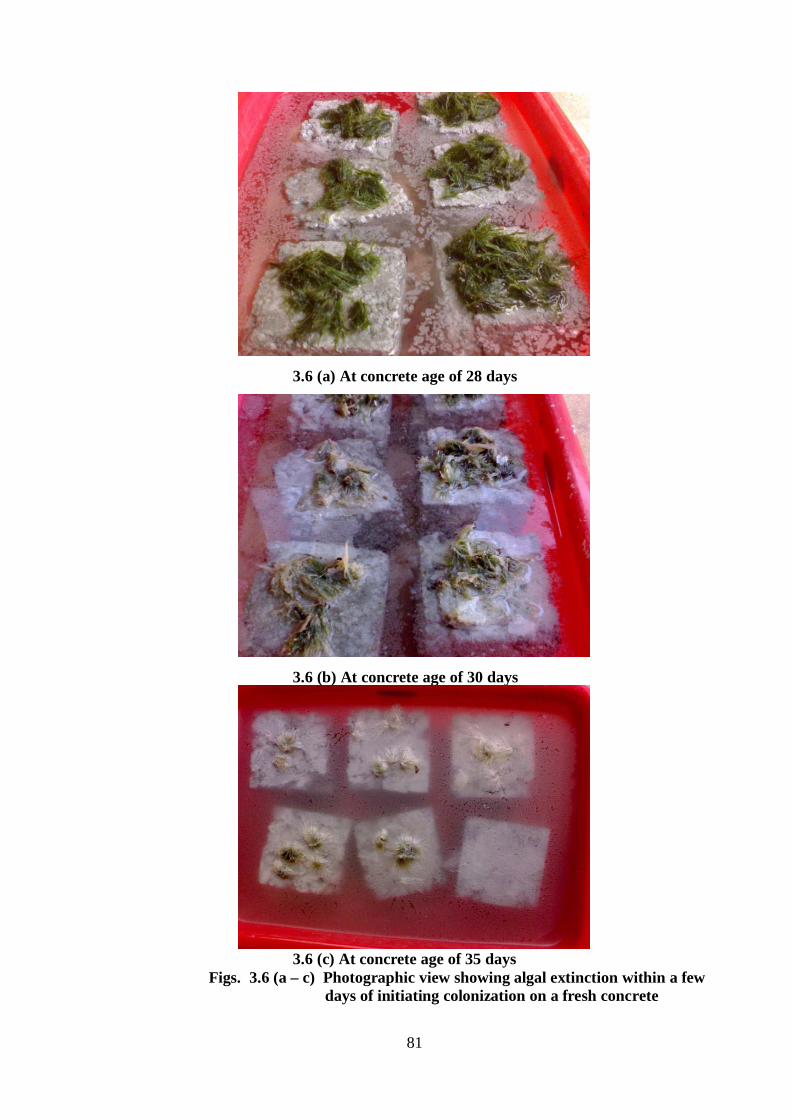
cubes after 28 days, it was found that the entire algal species didn’t colonize, rather,
they became extinct. This phenomenon was observed upto 6 months of exposure, in
both the exposure conditions. The above phenomenon is quite expected as the algae
cannot survive such a high pH, that existed in fresh or at very young age of concrete.
However, as the age of concrete steadily increases the pH of concrete reduces due to
the hydration of concrete. Further, due to setting of equilibrium between the pH of
concrete and the exposure medium (i.e. sea water), the pH reaches a level which is
conducive for the colonization of algae. This is expected to take place only after 6
months. Hence, samplings of algal colonized specimens were done only after 9 months
of exposure in laboratory and field conditions for conducting various tests. Fig. 3.6
shows the very quick extinction of algae as soon as initiation of colonization in a fresh
concrete (under the laboratory condition).
Concrete cubes under the above two regimes were kept exposed for nearly two years.
After three months of exposure, concrete cubes were removed from the above two
environments and subjected to certain non-destructive tests like NDT, compressive
strength test and investigations using SEM and EDAX. Beyond three months and up to
18 months of exposure in the above two environments, the concrete cubes were
subjected to certain sophisticated analytical techniques like XRD, TGA and FTIR,
apart from the above investigations. Fig 3.7 shows the overview of experimental
scheme of investigations adopted in this study.
3.4.3 Control Specimens
M20 and M25 grade concrete cubes (24 numbers in each) were cast and kept
immersed in fresh and sea water (without the algal species) to serve as a ‘control’ for
the biodeterioration studies. Locally available potable water and the actual sea water
sampled from the coastal region of the study area were used. The characteristics of
water from the above two sources tested as per standards methods of APHA (2005) are
given in Table 3.1 and 3.2. Control specimens were also periodically removed from
the above two environments and subjected to a variety of test, as stated above.

65
3.4.4 Algal growth on concrete cubes under laboratory conditions
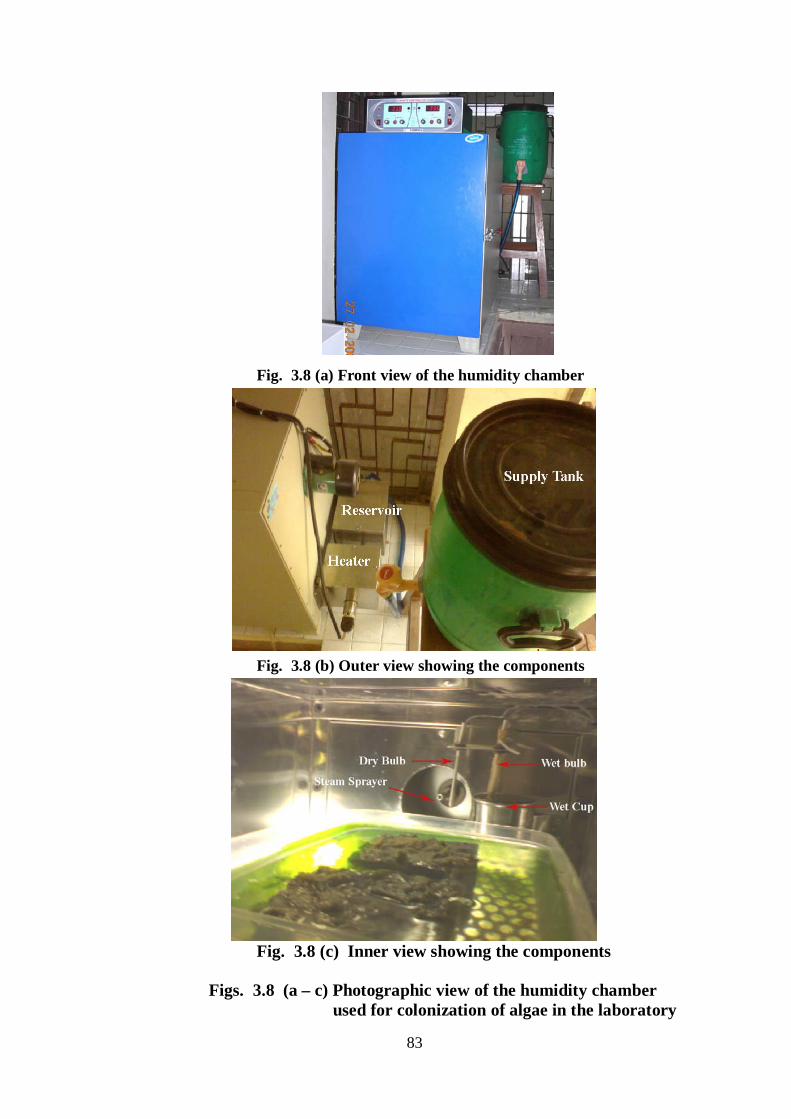
Chlorophyceae was allowed to colonize on the concrete cubes kept in a commercially
available humidity chamber, which has inbuilt provision for imparting light energy
and maintaining humidity conditions for the sustained metabolic activity of the algal
species. Salient details of the humidity chamber are briefly described below.
The chamber is double walled, the inner one being made of stainless steel (304 / 316
grades) and the outer one of stainless steel or GI coated with epoxy powder. The space
between the double walls is filled with glass wool. The chamber is illuminated by a
bulb and cooling is provided by hermetically sealed compressor coupled with a air
cooled condensing unit. Stainless steel tubular heater with fins is provided to generate
steam and injecting it into the working chamber. Temperature is maintained using an
electronic digital temperature controller-cum indicator with dry and wet bulbs
(Fig. 3.8).
The ambient conditions maintained in the chamber for the experimental investigations
are as follows and they are partially based on the environments adopted by Dubosc et
al., (2001) for their experimental study.
(i) Samples were incubated under lighting conditions of 2000 lx, 12 h/day and
‘daylight’ with a white fluorescent lamp.
(ii) Temperature maintained at 300
(iii) Relative humidity (RH) maintained at 90%, through out the day.
C through out the day.
A variable temperature and R.H simulating the ‘day’ and ‘night’ effect, as was adopted
by Dubosc et al., (2001) could not be adopted in the present study, due to the
restriction imposed by the available equipment, that of the humidity chamber.
However, the above ambient conditions are generally, expected to accelerate the
colonization of algae, especially under laboratory condition, as they represent /
simulate the climatic conditions prevalent in the study area.
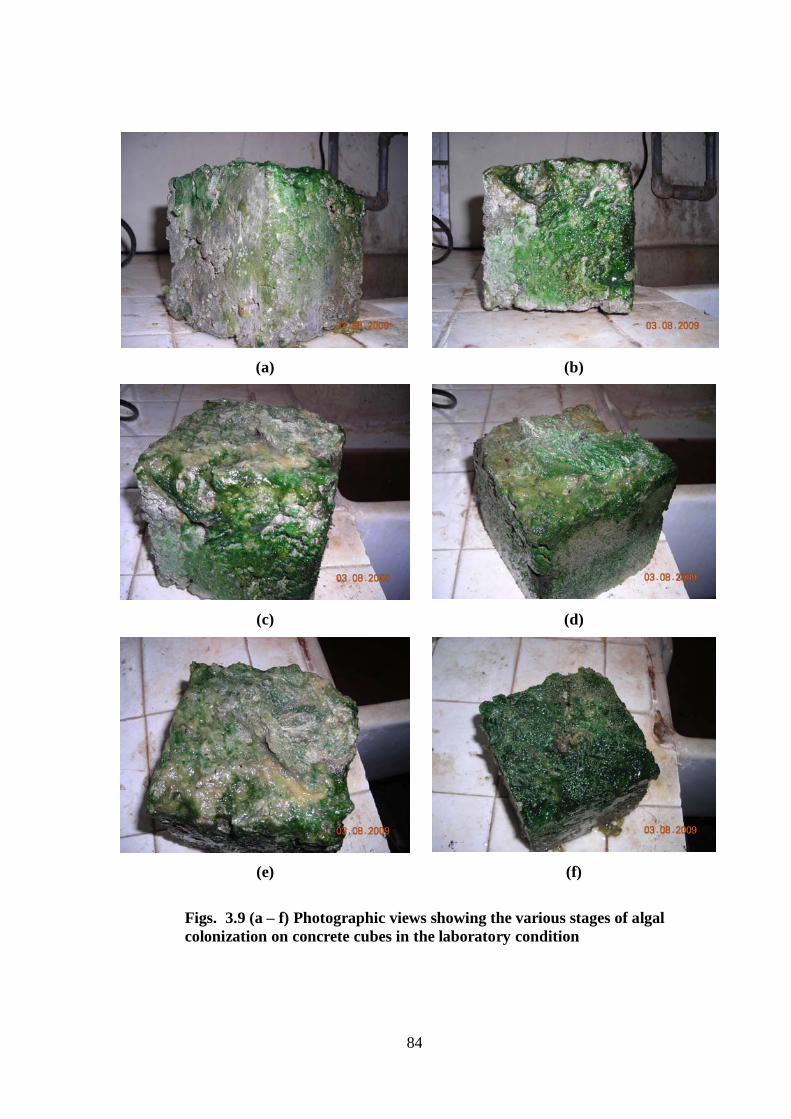
The algal colonization on concrete cubes in laboratory conditions is shown in Fig. 3.9.
3.4.5 Algal growth on concrete cubes under field conditions
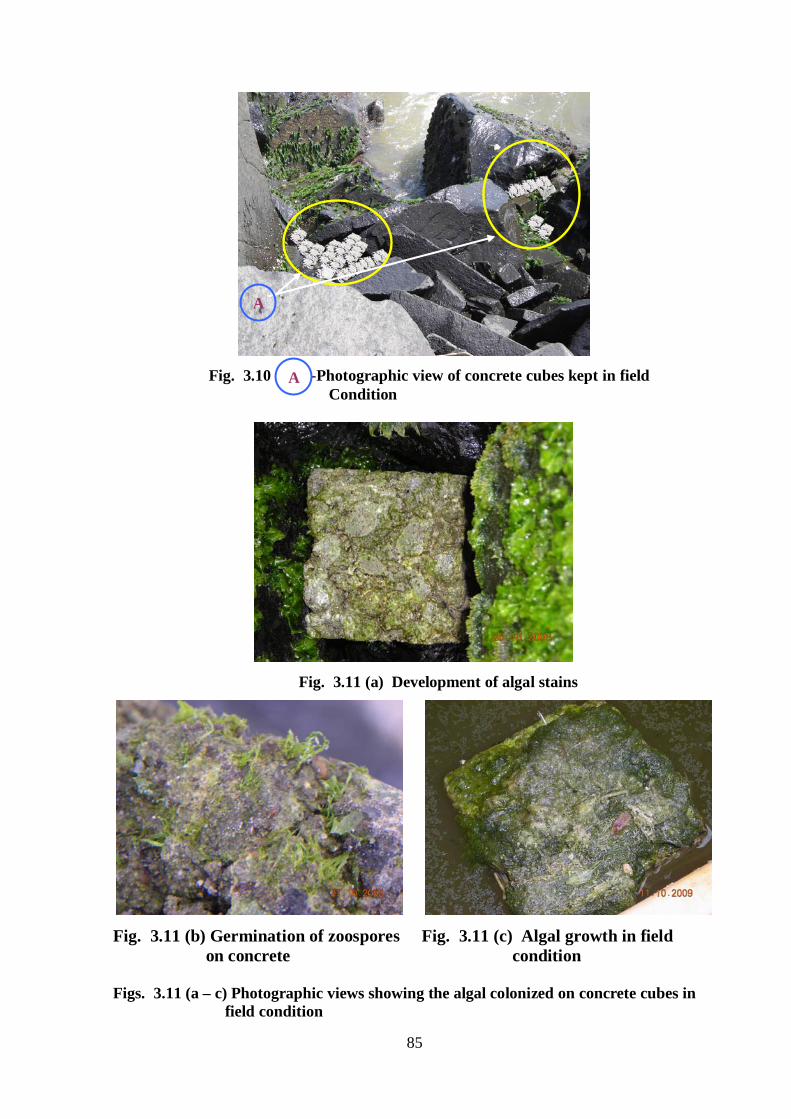
Concrete cubes (M20 and M25 grades) were kept in the coastal area of Pondicherry
region (i.e. in the splash zone) where abundant growth of marine chlorophyceae was
66
found so as to study biodeterioration under natural algal growth conditions (Fig.3.10).
The selected site has algal growth through out the year. Further the selected location is
expected to provide very good environmental conditions for the algal growth on
concrete cubes, as was evident during the field inspection undertaken prior to this
actual study wherein abundant growth of algae on stone and concrete surfaces were
found along the coastal stretches of the region. Moreover release of zoospores from the
existing attached surfaces is expected to attach on to the surfaces of concrete cubes
kept exposed in the coastal area and hence enhance the algal growth under the natural
marine environment Fig. 3.11. The ambient conditions and pH prevailed during the
study period are given in Appendix B3.
3.4.6 Sampling procedure
Specimens were periodically removed from the laboratory and field for conducting
various investigations. Before preparing the specimens for various analysis, the
biomass, namely the algal species colonized on the specimens were carefully scarped
and placed in sterile plastic containers and taken to the Krishnamurthy Institute of
Algology, Chennai, for identification and confirmation of species. Apart from the
above, samples were drawn from the concrete cubes for morphological
characterization. After conducting the compressive strength test (i.e. the destructive
test) the specimens were used for conducting various sophisticated analytical studies,
after duly completing the specific sample preparation procedure for each analytical
instrument investigation.
3.5 SOPHISTICATED ANALYTICAL INVESTIGATIONS
Samples drawn from algal colonized concretes i.e. from the control, laboratory and
field conditions, were subjected to various analytical investigations. The basic
principle involved in each method and the purpose of test etc., are briefly outlined
below. Scanning Electron Microscope (SEM) and Energy Dispersive X-ray analysis
(EDAX), X-ray Diffraction (XRD), Thermogravimetric Analysis (TGA) and Fourier
Transform Infrared Spectroscopy (FT-IR) and Gas chromatograph – Mass
spectrophotometer (GC-MS) were the sophisticated analytical investigations
undertaken in this study.
67
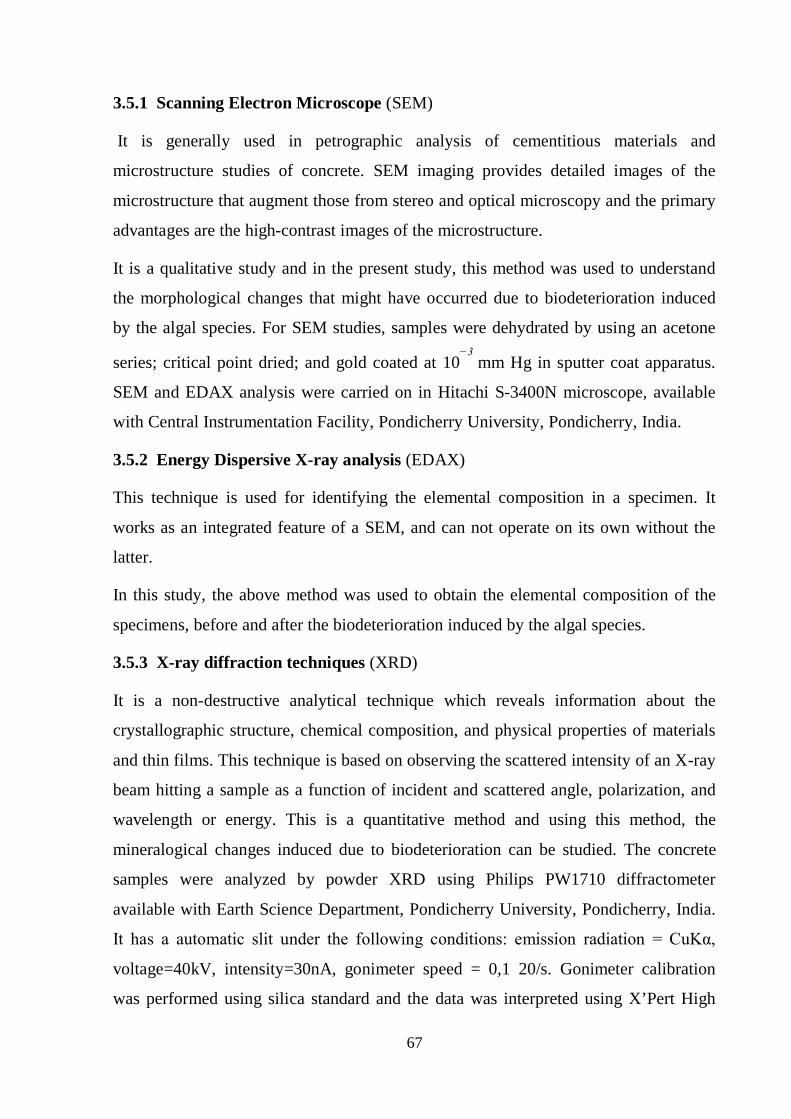
3.5.1 Scanning Electron Microscope (SEM)
It is generally used in petrographic analysis of cementitious materials and
microstructure studies of concrete. SEM imaging provides detailed images of the
microstructure that augment those from stereo and optical microscopy and the primary
advantages are the high-contrast images of the microstructure.
It is a qualitative study and in the present study, this method was used to understand
the morphological changes that might have occurred due to biodeterioration induced
by the algal species. For SEM studies, samples were dehydrated by using an acetone
series; critical point dried; and gold coated at 10−3
It is a non-destructive analytical technique which reveals information about the
crystallographic structure, chemical composition, and physical properties of materials
and thin films. This technique is based on observing the scattered intensity of an X-ray
beam hitting a sample as a function of incident and scattered angle, polarization, and
wavelength or energy. This is a quantitative method and using this method, the
mineralogical changes induced due to biodeterioration can be studied. The concrete
samples were analyzed by powder XRD using Philips PW1710 diffractometer
available with Earth Science Department, Pondicherry University, Pondicherry, India.
It has a automatic slit under the following conditions: emission radiation = CuKα,
voltage=40kV, intensity=30nA, gonimeter speed = 0,1 20/s. Gonimeter calibration
was performed using silica standard and the data was interpreted using X’Pert High
mm Hg in sputter coat apparatus.
SEM and EDAX analysis were carried on in Hitachi S-3400N microscope, available
with Central Instrumentation Facility, Pondicherry University, Pondicherry, India.
3.5.2 Energy Dispersive X-ray analysis (EDAX)
This technique is used for identifying the elemental composition in a specimen. It
works as an integrated feature of a SEM, and can not operate on its own without the
latter.
In this study, the above method was used to obtain the elemental composition of the
specimens, before and after the biodeterioration induced by the algal species.
3.5.3 X-ray diffraction techniques (XRD)

68
Score. Samples were ground in agar mortar and sieved to obtain fraction of particle
size less than 53µm, for the above test.
3.5.4 Thermogravimetric Analysis (TGA)
It measures the change in weight of the sample while it is heated at a constant rate (or
at constant temperature), under air (oxidative) or nitrogen (inert) atmosphere. This
technique is effective for quantitative analysis of thermal reactions that are
accompanied by mass changes, such as evaporation, decomposition, gas absorption,
desorption and dehydration. This is a quantitative method and using this method the
utilization of calcium for metabolic activity of algal species from the change in the
Ca(OH)2 content of the samples can be determined.
Concrete samples were powered in silica mortar and sieved through 75μm sieve.
About 1 gm of the sample was used for the analysis. It has a balance sensitivity of
0.1μg. Type R thermocouple (Pt-13% Rh/Pt) was used for measurement of
temperature in the instrument. The sample was taken in a ceramic crucible and heated
from the room temperature to 1000oC at a heating rate of 10o
For the preparation of the samples, approximately 1.5 mg of the <63 μm fraction was
carefully mixed with 100 mg of powdered anhydrous KBr in an agate mortar. A
pressure of 10 tonnes was applied to this mixture for 5 minutes in order to obtain
transparent pellets. Identification is based on comparison of the bands of the recorded
FTIR spectra with those of a reference literature (Baltakys et al., 2004). FTIR spectra
C/min using air as a
medium under static condition. TGA was done using Q600 thermal analyzer, available
with Central Instrumentation Facility, Pondicherry University, Pondicherry, India.
3.5.5 Fourier Transform Infrared Spectroscopy(FT-IR)
It absorbs electromagnetic radiation in the infrared region of the spectrum which
results in changes in the vibrational energy of molecule. The vibrational energy is a
kind of fingerprint of a compound. This property is therefore used for characterization
of organic, inorganic and biological compounds. The band intensities are proportional
to the concentration of the compound and hence qualitative estimations are possible.
69
were recorded using Thermo Nicolet 6700 spectrometer, available with Central
Instrumentation Facility, Pondicherry University, Pondicherry, India.
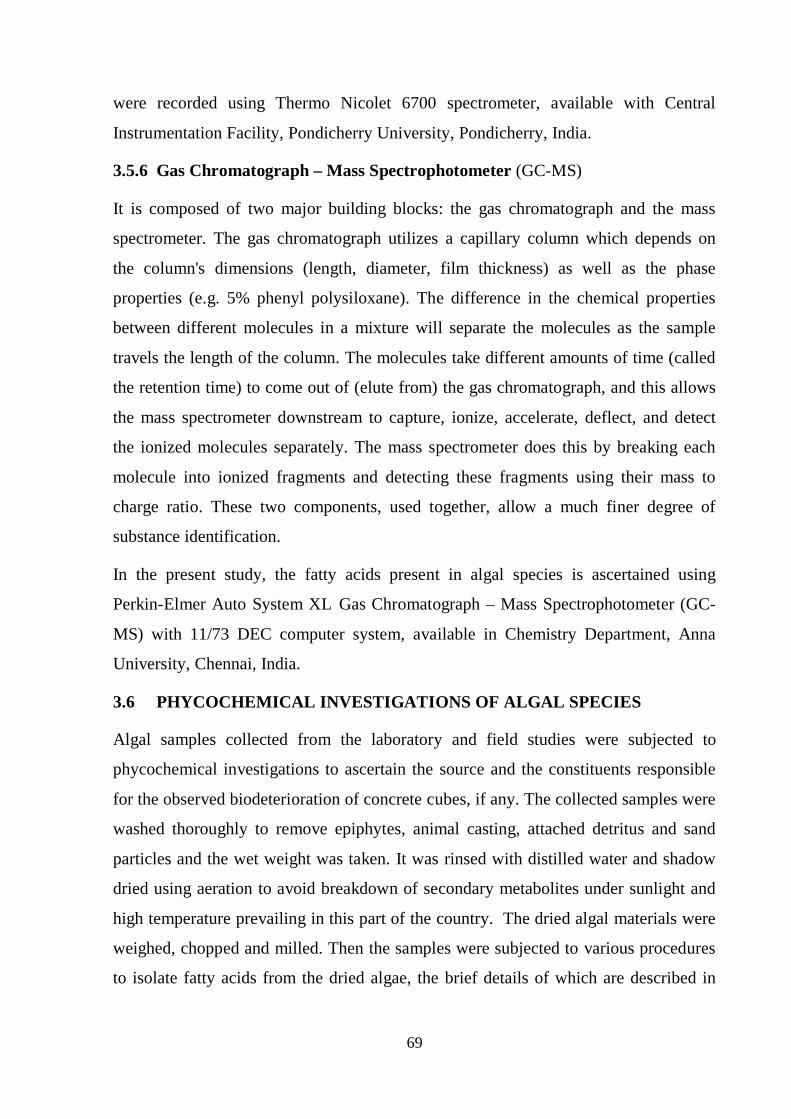
3.5.6 Gas Chromatograph – Mass Spectrophotometer (GC-MS)
It is composed of two major building blocks: the gas chromatograph and the mass
spectrometer. The gas chromatograph utilizes a capillary column which depends on
the column's dimensions (length, diameter, film thickness) as well as the phase
properties (e.g. 5% phenyl polysiloxane). The difference in the chemical properties
between different molecules in a mixture will separate the molecules as the sample
travels the length of the column. The molecules take different amounts of time (called
the retention time) to come out of (elute from) the gas chromatograph, and this allows
the mass spectrometer downstream to capture, ionize, accelerate, deflect, and detect
the ionized molecules separately. The mass spectrometer does this by breaking each
molecule into ionized fragments and detecting these fragments using their mass to
charge ratio. These two components, used together, allow a much finer degree of
substance identification.
In the present study, the fatty acids present in algal species is ascertained using
Perkin-Elmer Auto System XL Gas Chromatograph – Mass Spectrophotometer (GC-
MS) with 11/73 DEC computer system, available in Chemistry Department, Anna
University, Chennai, India.
3.6 PHYCOCHEMICAL INVESTIGATIONS OF ALGAL SPECIES
Algal samples collected from the laboratory and field studies were subjected to
phycochemical investigations to ascertain the source and the constituents responsible
for the observed biodeterioration of concrete cubes, if any. The collected samples were
washed thoroughly to remove epiphytes, animal casting, attached detritus and sand
particles and the wet weight was taken. It was rinsed with distilled water and shadow
dried using aeration to avoid breakdown of secondary metabolites under sunlight and
high temperature prevailing in this part of the country. The dried algal materials were
weighed, chopped and milled. Then the samples were subjected to various procedures
to isolate fatty acids from the dried algae, the brief details of which are described in

70
Appendix B4. The extract from the above samples are used for FTIR and GC-MS
studies for identifying the various fatty acids present in the sample.
3.7 MACRO LEVEL STUDIES
Apart from the above two types of investigations (i.e. phycochemical and sophisticated
analytical methods), concrete specimens which were subjected to biodeterioration by
the algal species were subjected to: visual examination, non-destructive and
destructive tests. Ultra-sonic and rebound hammer tests and the compressive strength
were used to understand the changes in the macro level characteristics like loss in
compressive strength etc.
Specimens which were subjected to significant biodeterioration only were considered
for the above macro level studies according to IS: 13311 (Part 1 & 2) - 1992 and
IS: 516- 1959.
3.7.1 Visual Examination
Control specimens and algal colonized concrete specimens at 18 months under both
the exposure conditions, were subjected to visual examinations, to examine and record
the various physical changes that have taken place. Measurement of actual overall
dimension, (normal) diagonal and solid diagonal, weight, presence of cracks, pore (if
any) and the nature of pores (if present ) such as: size, diameter and depth, were
carried out. Further, pH and CaO of the control and algal colonized specimens were
determined and compared qualitatively with the results from analytical techniques.
Change in pH, especially reduction in pH of concrete can be independently determined
by the ‘phenolphthalein pH indicator test’. For the above test the surface of control and
algal colonized concretes were sprayed at the (top) surface with a standard
phenolphthalein indicator solution (i.e. 1gm phenolphthalein and 90 ml ethanol -
95% v.v ethanol, and diluted to 100 ml using distilled water). If there is change in
color (i.e. from colorless to purple red color), then it indicates that the concrete is still
highly alkaline. Otherwise, it indicates no change in color (i.e. the indicator will
remain colorless) thereby indicating that there is no change in alkalinity of concrete.
The above observations are made immediately after spraying the standard indicator
solution and after 24 hours.

71
The results from the above observations are used to draw inferences on the effect of
biodeterioration of concrete.
3.7.2 Ultra Sonic Pulse Velocity (UPV) Testing
This method is based on the principle that the velocity of an ultrasonic pulse through
any material depends upon the density, modulus of elasticity and Poisson’s ratio of the
material. Comparatively higher velocity is obtained when concrete quality is good in
terms of density, uniformity, homogeneity etc.
The ultrasonic pulse is generated by an electro acoustical transducer. When it is
induced into the concrete from a transducer, it undergoes multiple reflections at the
boundaries of the different material phases within the concrete and a complex system
of stress waves are developed, which includes longitudinal (compression), shear
(transverse) and surface (Reyleigh) waves. The receiving transducer detects the onset
of longitudinal waves which is the fastest. The velocity of the pulses is almost
independent of the geometry of the material through which they pass and depends only
on its elastic properties.
UPV method is a convenient technique for investigating structural concrete. For a
good quality concrete the pulse velocity will be higher and for poor quality it will be
less. If there is a crack, void or flaw inside the concrete, which comes in the way of
transmission of the pulses, the pulse strength is attenuated and it passes around the
discontinuity, thereby making the path length longer. Consequently, lower velocities
are obtained.
The actual pulse velocity obtained depends primarily upon the materials and mix
proportions of concrete. Density and modulus of elasticity of aggregate also
significantly affects the pulse velocity. Any suitable type of transducer operating
within the frequency range of 20 KHz to 150 KHz may be used. Piezoelectric and
magneto-strictive types of transducers may be used and the latter being more suitable
for the lower part of the frequency range. The electronic timing device should be
capable of measuring the time interval elapsing between the onset of a pulse generated
at the transmitting transducer and on its arrival at the receiving transducer. Two forms
of the electronic timing apparatus are possible, one of which use a cathode ray tube on

72
which the leading edge of the pulse is displayed in relation to the suitable time scale,
the other uses an interval timer with a direct reading digital display. If both the forms
of timing apparatus are available, the interpretation of results becomes more reliable.
In the present study, TICO ultrasonic Instrument was used for the UPV test and
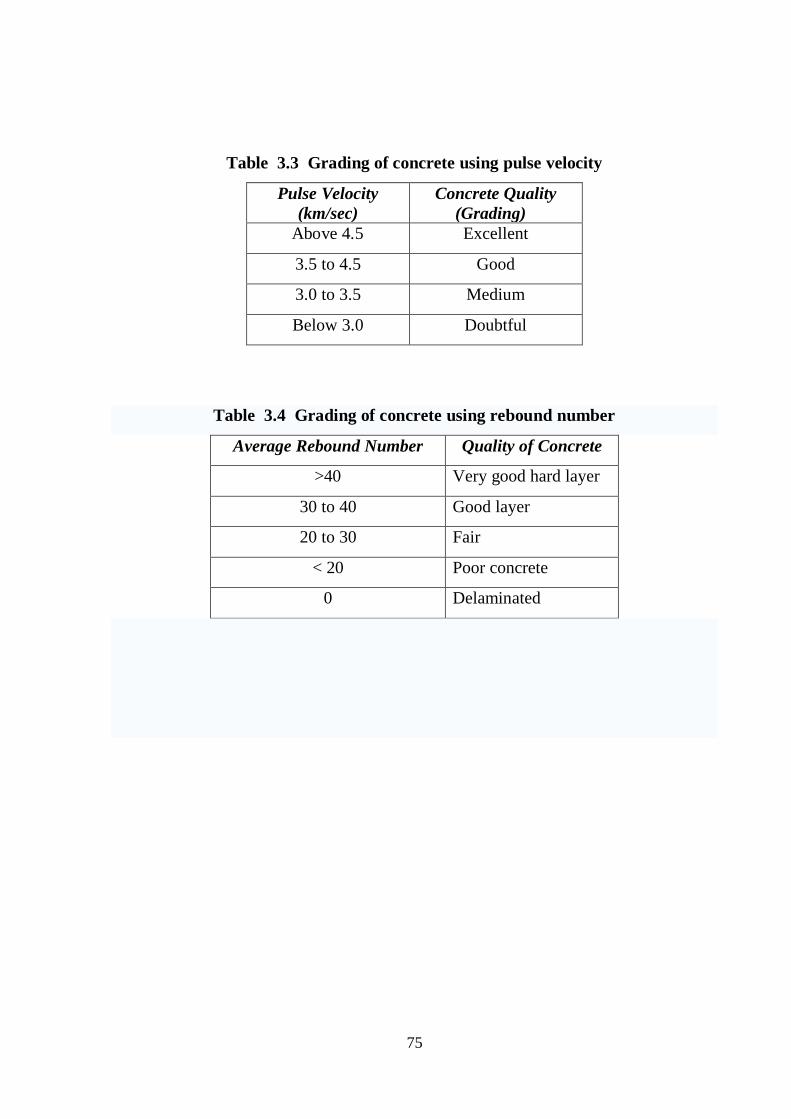
qualifying of concrete is assessed using the guidelines given in Table 3.3, in terms of
the ultrasonic pulse velocity.
3.7.3 Rebound Hammer Test
This method is based on the principle that the rebound of an elastic mass depends on
the hardness of the surface against which a mass strikes. When the plunger of rebound
hammer is pressed against the surface of concrete, the spring controlled mass rebounds
and the extent of such rebound depends upon the surface hardness of concrete. The
surface hardness and hence the rebound are taken to be related to that of the
compressive strength of concrete. The rebound value is read - off along a graduated
scale and is designated as the rebound number or rebound index. The compressive
strength of concrete can be read directly from the graph provided on the body of the
hammer.
In this study DIGI Schmidt 2000 was the make used for rebound hammer test. Table
3.4 gives the quality of concrete in terms of standard values of rebound number. In this
study, the calibration curve (as furnished by manufacturer) was directly used to obtain
the compressive strength of concretes. The values thus obtained are used in discussion
of results and to draw inferences.
3.7.4 Compressive Strength of Concrete
Compressive strength is the capacity of a material to withstand axially directed
pushing forces. When the limit of compressive strength is reached, materials are
crushed. The compressive strength of concrete is taken as its most common
performance measure and used in designing various structures. The compressive
strength is calculated from the failure load divided by the cross-sectional area resisting
the load and reported in units of N/mm2. In this study the test was carried on AIMIL
Compression Test- 3000 tonnes capacity machine.
73
3.8 SUMMARY SEM, EDAX, XRD, TGA, FTIR, GC-MS were the various analytical techniques used
for various qualitative and quantitative studies related to biodeterioration. Further,
macro-level studies on algal colonized studies (NDT and compressive strength) were
conducted to ascertain the extent of biodeterioration. The results from the above
studies are presented and discussed in detail, in the next chapter (i.e. Chapter 4).
74
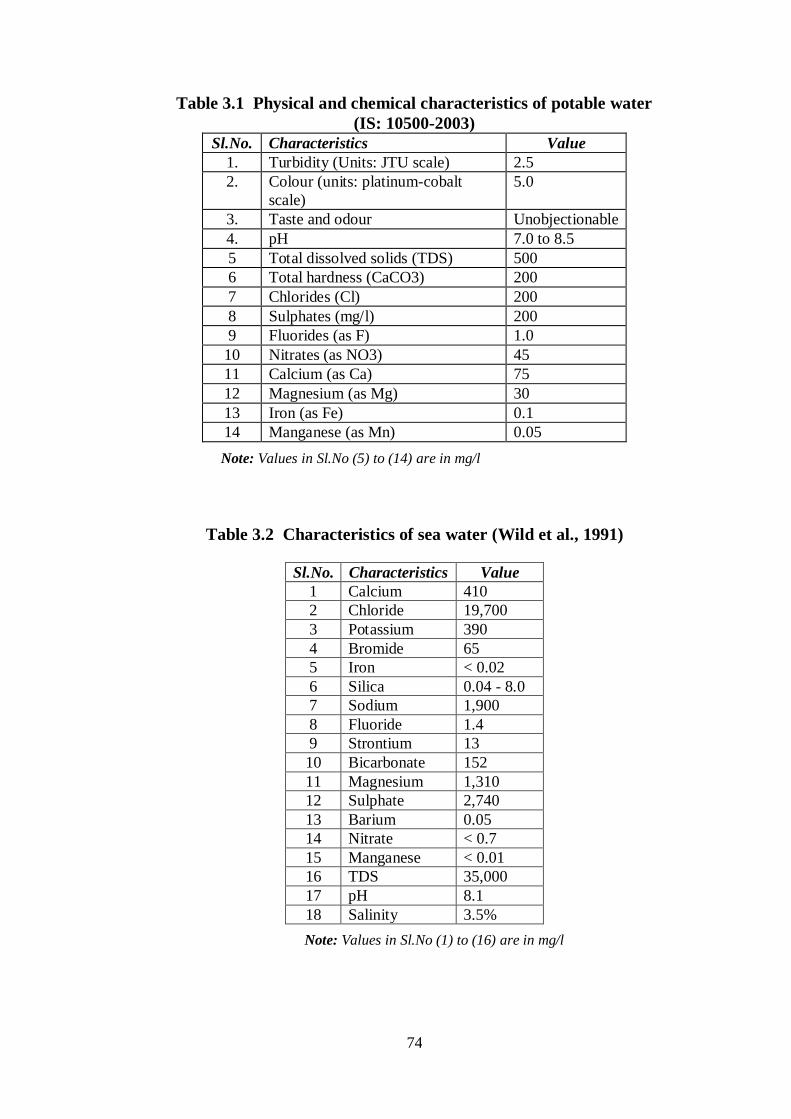
Table 3.1 Physical and chemical characteristics of potable water (IS: 10500-2003)
Sl.No. Characteristics Value 1. Turbidity (Units: JTU scale) 2.5 2. Colour (units: platinum-cobalt
scale) 5.0
3. Taste and odour Unobjectionable 4. pH 7.0 to 8.5 5 Total dissolved solids (TDS) 500 6 Total hardness (CaCO3) 200 7 Chlorides (Cl) 200 8 Sulphates (mg/l) 200 9 Fluorides (as F) 1.0
10 Nitrates (as NO3) 45 11 Calcium (as Ca) 75 12 Magnesium (as Mg) 30 13 Iron (as Fe) 0.1 14 Manganese (as Mn) 0.05
Note: Values in Sl.No (5) to (14) are in mg/l
Table 3.2 Characteristics of sea water (Wild et al., 1991)
Sl.No. Characteristics Value 1 Calcium 410 2 Chloride 19,700 3 Potassium 390 4 Bromide 65 5 Iron < 0.02 6 Silica 0.04 - 8.0 7 Sodium 1,900 8 Fluoride 1.4 9 Strontium 13 10 Bicarbonate 152 11 Magnesium 1,310 12 Sulphate 2,740 13 Barium 0.05 14 Nitrate < 0.7 15 Manganese < 0.01 16 TDS 35,000 17 pH 8.1 18 Salinity 3.5%
Note: Values in Sl.No (1) to (16) are in mg/l
75
Table 3.3 Grading of concrete using pulse velocity
Pulse Velocity (km/sec)
Concrete Quality (Grading)
Above 4.5 Excellent
3.5 to 4.5 Good
3.0 to 3.5 Medium
Below 3.0 Doubtful
Table 3.4 Grading of concrete using rebound number
Average Rebound Number Quality of Concrete
>40 Very good hard layer
30 to 40 Good layer
20 to 30 Fair
< 20 Poor concrete
0 Delaminated
76
Fig. 3.1 Beach profile showing low tide and high tide
Fig. 3.2 Structure of a seaweed/ marine algae
77
3.3 (a) Pondicherry port
3.3 (b) Ariyankuppam, Pondicherry
3.3 (c) Cuddalore port

78
3.3 (d) Kalpakkam
3.3 (e) Kovalam beach
3.3 (f) Tharangampadi, near Karaikal
Figs. 3.3 (a – f) Photographic views of algal colonization
in various places
79
Figs. 3.4 Photographic views of algal colonization during various seasons of the
year along Pondicherry coast

80
Fig. 3.5 Location map of the study area
Note: Locations are
1. Chennai (Madras) Port
2. Kalpakkam
3. Pondicherry Port
4. Ariyankuppam, Pondicherry
5. Cuddalore Port
6. Karaikal Port
81
3.6 (a) At concrete age of 28 days
3.6 (b) At concrete age of 30 days
3.6 (c) At concrete age of 35 days
Figs. 3.6 (a – c) Photographic view showing algal extinction within a few days of initiating colonization on a fresh concrete

82
Fig. 3.7 Overview of experimental scheme adopted
M20 and M25 grade concrete cubes are cast and allowed to cure for 28 days
M20 and M25 grade concrete cubes are kept immersed in potable water
M20 and M25 grade concrete cubes are colonized with algae under field condition
M20 and M25 grade concrete cubes are colonized with algae under laboratory condition
M20 and M25 grade concrete cubes are kept immersed in sea water
Sophisticated Analytical Techniques
Phycochemcial Investigations
Macro-level studies
SEM
EDAX
FTIR
XRD
TGA
Identification of marine algae
Identification of fatty acids secreted by metabolic activity of algae
Visual examinations
NDT on algal colonized concretes
Compressive strength test
Qualitative and Quantitative studies (3-24 months)
Mechanism of biodeterioration
Total effect on the substrate due to biodeterioration
83
Fig. 3.8 (a) Front view of the humidity chamber
Fig. 3.8 (b) Outer view showing the components
Fig. 3.8 (c) Inner view showing the components
Figs. 3.8 (a – c) Photographic view of the humidity chamber used for colonization of algae in the laboratory
84
(a) (b)
(c) (d)
(e) (f)
Figs. 3.9 (a – f) Photographic views showing the various stages of algal colonization on concrete cubes in the laboratory condition
85
Fig. 3.10 -Photographic view of concrete cubes kept in field
Condition
Fig. 3.11 (a) Development of algal stains
Fig. 3.11 (b) Germination of zoospores
on concrete Fig. 3.11 (c) Algal growth in field
condition Figs. 3.11 (a – c) Photographic views showing the algal colonized on concrete cubes in
field condition
A
A


![Catalogue batteries militaires:Mise en page 1 - fpm-france.frfpm-france.fr/wp-content/uploads/2015/05/Catalogue-batteries-milit... · ba 5590 a/u ba 5590 b/l] ba 5590 hc ba 5598 a/u](https://img.pdfslide.us/doc/110x75/5bedc6a109d3f2175d8bd5a2/catalogue-batteries-militairesmise-en-page-1-fpm-ba-5590-au-ba-5590-bl.jpg)