Embed Size (px)
Citation preview

Chapter 11 pt. 2: Chapter 11 pt. 2: Intelligence AssessmentIntelligence Assessment

Warm UpWarm Up
Pick up warm up off of Pick up warm up off of the overheadthe overhead
Work AloneWork Alone15 minutes 15 minutes

Assessing Intelligence: Assessing Intelligence: Aptitude vs. Achievement Aptitude vs. Achievement
TestTestAptitude Tests:Aptitude Tests: are tests are tests designed to predict a person’s designed to predict a person’s future performance.future performance.SAT’s and GRE’sSAT’s and GRE’s
Achievement Test:Achievement Test: a test a test designed to assess what a designed to assess what a person person has learnedhas learned..Midterm Psych exam, chapter 3 Midterm Psych exam, chapter 3
history test, etc.history test, etc.

Assessing IntelligenceAssessing IntelligenceWechsler Adult Intelligence Wechsler Adult Intelligence
Scale (WAIS)Scale (WAIS)most widely used intelligence most widely used intelligence testtest
subtestssubtestsverbal verbal performance (nonverbal) performance (nonverbal) Also a Also a WISCWISC (Wechsler (Wechsler Intelligence Test for Children).Intelligence Test for Children).

Assessing Intelligence- Sample Assessing Intelligence- Sample Items from the WAISItems from the WAIS
VERBAL
General Information Similarities Arithmetic ReasoningVocabularyComprehensionDigit Span
PERFORMANCE
Picture Completion Picture ArrangementBlock DesignObject AssemblyDigit-Symbol Substitution

WAIS SAMPLEWAIS SAMPLE


Qualities of A Good TestQualities of A Good Test
To be accepted all To be accepted all psychological tests must be:psychological tests must be:
1.1. StandardizedStandardized
2.2. Reliable Reliable
3.3. ValidValid

StandardizationStandardizationStandardization:Standardization: defining meaningful defining meaningful
scores by comparison with the scores by comparison with the performance of a pretested group.performance of a pretested group.Your scores are compared with the Your scores are compared with the
pretested group who took the test.pretested group who took the test. Standardized tests usually follow a Standardized tests usually follow a
normal normal distribution.distribution.Normal Distribution: Normal Distribution: bell shaped curve bell shaped curve
that describes the distribution of many that describes the distribution of many physical and psychological properties. physical and psychological properties. Most scores fall near average, and Most scores fall near average, and fewer and fewer scores lie near the fewer and fewer scores lie near the extreme. extreme.

The Normal Curve (Know My The Normal Curve (Know My Distributions)Distributions)
Ninety-five percent of all people fall within 30 points
of 100
Number of
scores
55 70 85 100 115 130 145
Sixty-eight percentof people score within 15 points
above or below 100

Reliability vs. Validity (DON’T Reliability vs. Validity (DON’T MIX THEM UP)MIX THEM UP)
ReliabilityReliability deals with consistencydeals with consistency. . assessed by consistency of scores on:assessed by consistency of scores on:
two halves of the testtwo halves of the testalternate forms of the testalternate forms of the testretesting the same individualretesting the same individual
Weschler and Standford Binet test Weschler and Standford Binet test +.9+.9
ValidityValidity deals with predictabilitydeals with predictability. Does . Does the test measure what it is supposed to the test measure what it is supposed to measure?measure?

Types of ValidityTypes of ValidityContent Validity:Content Validity: the extent to the extent to
which a which a test samples the behavior test samples the behavior that is of interestthat is of interest.Would a .Would a maneuverability test on a skateboard maneuverability test on a skateboard have content validity for testing to see have content validity for testing to see if your qualified to drive?if your qualified to drive?
Predictive Validity:Predictive Validity: The success The success with which a test predicts with which a test predicts the the behavior it is supposed to predict.behavior it is supposed to predict.Do high SAT scores correlate with Do high SAT scores correlate with
high college grades?high college grades?

Predictive Validity is Based Predictive Validity is Based on Criterionon Criterion
Criterion:Criterion: the behavior that a the behavior that a test is supposed to predict. test is supposed to predict. Is Is used to see if test is used to see if test is successful. successful.
What would the criterion be for What would the criterion be for the GRE’s? the GRE’s?

The Flynn EffectThe Flynn EffectSince the advent of intelligence Since the advent of intelligence
tests, tests, people’s IQ scores people’s IQ scores have been improving with have been improving with timetime (flynn effect). (flynn effect).
If standardized with today’s If standardized with today’s tests, scores 80 years ago tests, scores 80 years ago would have a average IQ of 76. would have a average IQ of 76.
Possible Causes?Possible Causes?

The Flynn EffectThe Flynn Effect
70
75
80
85
90
95
100
105
1910 1930 1950 1970 1990
Year
IQ scores
Stability of Change? Stability of Change?
Can infant tests predict Can infant tests predict future intelligence?future intelligence?Picture Test Picture Test Starting at Age 4 may predict Starting at Age 4 may predict
future IQfuture IQAge 7 scores become Age 7 scores become
stable,but not fixedstable,but not fixed

Low Extreme of Low Extreme of IntelligenceIntelligence
Mental Retardation:Mental Retardation: condition of condition of limited mental ability, indicated by limited mental ability, indicated by an an intelligence score of belowintelligence score of below 70 70 andand difficulty adapting to the difficulty adapting to the demands of life.demands of life.
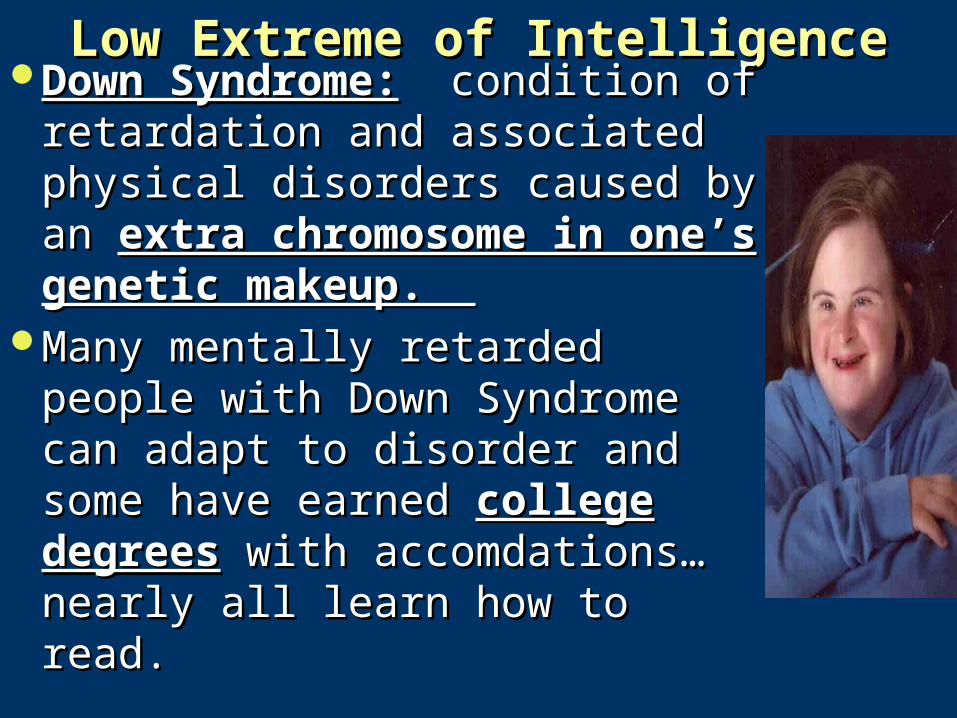
Low Extreme of IntelligenceLow Extreme of IntelligenceDown Syndrome:Down Syndrome: condition condition
of retardation and associated of retardation and associated physical disorders caused by physical disorders caused by an an extra chromosome in extra chromosome in one’s genetic makeup. one’s genetic makeup.
Many mentally retarded Many mentally retarded people with Down Syndrome people with Down Syndrome can adapt to disorder and can adapt to disorder and some have earned some have earned college college degreesdegrees with accomdations… with accomdations…nearly all learn how to read. nearly all learn how to read.

Degrees of Mental Degrees of Mental RetardationRetardation
Degrees of Mental Retardation
Level Typical Intelligence Scores Percentage of the Retarded Adaptation to Demands of Life
Mild 50-70 85% Most learn academic skills up to sixth-grade level. Adults may, with assistance, achieve self-supporting social and vocational skills.
Moderate 35-49 10 May progress to second-grade level. academically. Adults may contribute to their own support by labor in sheltered workshops.
Severe 20-34 3-4 May learn to talk and perform simple work tasks under close supervision but are generally unable to profit from vocational training.

Gifted Gifted
Smart kids are Smart kids are usually usually not “weirdnot “weird” ”
Tend to get Tend to get higher higher degrees degrees
Should gifted Should gifted children be “tracked” children be “tracked” in school?in school?


Is Intelligence Genetic or Is Intelligence Genetic or Environmental?Environmental?
Influenced by both, but the most genetically similar have the most similar scores.
0.0
0.1
0.2
0.3
0.4
0.5
0.6
0.7
0.8
0.9
1.0Similarity ofintelligence
scores(correlation)
Identicaltwinsreared together
Identicaltwinsreared apart
Fraternaltwinsreared together
Siblingsreared together
Unrelatedindividualsreared together

Genetic InfluencesGenetic InfluencesWith age, With age, genetic influences genetic influences
become more apparent.become more apparent.Adopted children’s intelligence scores Adopted children’s intelligence scores
become more like their become more like their biological biological parentsparents, and identical twins , and identical twins similarities continue to increase as similarities continue to increase as they age. they age.
Still hard to tell what percentage of Still hard to tell what percentage of intelligence comes from genes to intelligence comes from genes to account for differences between account for differences between people (heritability).people (heritability).

Genetic InfluencesGenetic Influences
0.35
0.30
0.25
0.20
0.15
0.10
0.05
0.003 years 16 years
Child-parentcorrelation inverbal ability
scores
Children and theirbirth parents
Adopted childrenand their birthparents
Adopted childrenand their adoptiveparents

Environmental Influences Environmental Influences
Early InterventionEarly InterventionHead StartHead Start
Schooling Effects Schooling Effects Schooling and IQ scores Schooling and IQ scores tend to correlatetend to correlate

Schooling EffectSchooling Effect
Grade 6
Grade 5
Grade 4
110 115 120 125 130 135 140 145 150Age in months
118
115
112
109
106
103
100
97
IQ gains relativeto grade 4
baseline

Group Differences in IQ Group Differences in IQ Scores Scores Ethnic Similarities and Differences Ethnic Similarities and Differences
Racial groups differ in IQ scoresRacial groups differ in IQ scores Higher scoring ppl and groups tend to have Higher scoring ppl and groups tend to have
higher incomes and educationhigher incomes and education Individual differences within a race are much Individual differences within a race are much
greater than differences between races greater than differences between races Asian students outperform North American Asian students outperform North American
student on math tests student on math tests IQ scores have increasedIQ scores have increasedWhite and blacks tend to score the same on White and blacks tend to score the same on
infant IQ testsinfant IQ tests

Group Differences in Group Differences in Intelligence Scores Are Probably Intelligence Scores Are Probably
Mostly Attributed to the Mostly Attributed to the EnvironmentEnvironment
Variation within group
Variation within group
Difference within group
Poor soil Fertile soil
Seeds

Group Differences in IQ Group Differences in IQ ScoresScoresGender Similarities and DifferencesGender Similarities and Differences
No big differencesNo big differences Girls are Girls are better spellersbetter spellers, more verbal, more , more verbal, more
sensitive to sensessensitive to sensesBoysBoys tend to be in lower classes more and talk later tend to be in lower classes more and talk later
and stutter more and stutter more Math and Spatial Aptitudes Math and Spatial Aptitudes
No huge differencesNo huge differencesBoys tend to do a bit better on mathBoys tend to do a bit better on mathGirls better on memory and picture recognitionGirls better on memory and picture recognition
Women better at reading facial expressionsWomen better at reading facial expressions

The Question of Bias The Question of Bias 2 definitions 2 definitions 1. Tests detect not only innate differences in 1. Tests detect not only innate differences in
IQ but also differences caused by cultural IQ but also differences caused by cultural experiences experiences Yes. Test do not account for differences in Yes. Test do not account for differences in
cultures, which may make them biascultures, which may make them bias
2. Is a test less valid for some groups than for 2. Is a test less valid for some groups than for others.others.No. The predictive value of a standard IQ No. The predictive value of a standard IQ
testS is roughly the same for black and testS is roughly the same for black and whites and rich and poor…….whites and rich and poor…….
The Question of BiasThe Question of Bias
Stereotype ThreatStereotype ThreatA self confirming concern A self confirming concern that one will be evaluated that one will be evaluated based on a based on a negative negative stereotypestereotype
Black student's taking verbal Black student's taking verbal testtest
Women and math scores Women and math scores