Embed Size (px)
Citation preview

Chapter 11: Chapter 11: Environmental Correlates of Environmental Correlates of Physical ActivityPhysical Activity

One’s environment has the potential to be related to One’s environment has the potential to be related to behavioral outcomesbehavioral outcomes
A functional starting point is with Walter Mischel A functional starting point is with Walter Mischel and his associates’ research regarding delayed and his associates’ research regarding delayed gratification in children gratification in children
• Children were shown toys, marshmallows, or Children were shown toys, marshmallows, or candies. candies.
• Have it now, or have more of it laterHave it now, or have more of it later• Left alone for 20 minutes Left alone for 20 minutes
Environment And Physical ActivityEnvironment And Physical Activity

The children, on average, were not very The children, on average, were not very successful in delaying their gratification--most successful in delaying their gratification--most would quickly play with the toys or eat the would quickly play with the toys or eat the candies. candies.
However, there were some children who could However, there were some children who could wait until the researchers returned wait until the researchers returned (Mischel, Shoda, & (Mischel, Shoda, & Rodriguez, 1989) Rodriguez, 1989)
Why could some children control themselves Why could some children control themselves and wait, while others hardly blinked before and wait, while others hardly blinked before consuming candy? consuming candy?
Environment and Physical ActivityEnvironment and Physical Activity

Taught half the children to Taught half the children to think about fun think about fun thoughtsthoughts while waiting for the researcher to while waiting for the researcher to return. return.
• Condition 1 the children were asked to wait Condition 1 the children were asked to wait while the candy was in plain view on the table while the candy was in plain view on the table
• Condition 2, the children were asked to wait Condition 2, the children were asked to wait while the candy was on the table but under a while the candy was on the table but under a cover. cover.
Environment and Physical ActivityEnvironment and Physical Activity

Think Fun: Delay Time in Minutes
0
2
4
6
8
10
12
Exposed Covered
Fun thoughtsReward thoughtsNo Thoughts
Approximate data from Mischel et al., (1972)

How does this relate to physical activity How does this relate to physical activity participation? participation? • First, like waiting for a second candy, the First, like waiting for a second candy, the
benefits of physical activity participation are benefits of physical activity participation are sometimes more distal than the acute benefits sometimes more distal than the acute benefits of sedentary behaviors. of sedentary behaviors.
• Second, like waiting for candy, physical Second, like waiting for candy, physical activity often takes coping skills to complete. activity often takes coping skills to complete.
Environment And Physical ActivityEnvironment And Physical Activity

It can be concluded that when the environment is It can be concluded that when the environment is risky (i.e., there is a candy waiting to be eaten or a risky (i.e., there is a candy waiting to be eaten or a television show waiting to be watched), it is television show waiting to be watched), it is important to ensure that individuals have important to ensure that individuals have appropriate coping skillsappropriate coping skills
When the environment is supportive (i.e., no When the environment is supportive (i.e., no candy, accessible physical activity options), even candy, accessible physical activity options), even those people without appropriate coping skills can those people without appropriate coping skills can be successful.be successful.
Environment And Physical ActivityEnvironment And Physical Activity

Does the physical environment affect an individual’s level of physical activity?
• Western Environment
• Travel Patterns
• Climate
• Environmental Prompts
• Perceived Access to PA Resources
• Actual Access to PA Resources

Rode & Shephard (1994) studied tRode & Shephard (1994) studied the effects he effects of modernization in a community of of modernization in a community of Canadian InuitCanadian Inuit
In 1970, before acculturation, both Inuit In 1970, before acculturation, both Inuit men and women were more aerobically fit men and women were more aerobically fit than age-matched men in industrialized than age-matched men in industrialized nations, but by 1990, the Inuit physical nations, but by 1990, the Inuit physical superiority had become much less superiority had become much less pronouncedpronounced
The Western EnvironmentThe Western Environment

Rode & Shephard, 1994Rode & Shephard, 1994
Ratio of Vehicles to Households
0.460.29
0 0
1.19
0.65
0.06
0.56
0
0.2
0.4
0.6
0.8
1
1.2
1.4
Snowmobiles Boats Cars ATV
19701990
The Western EnvironmentThe Western Environment
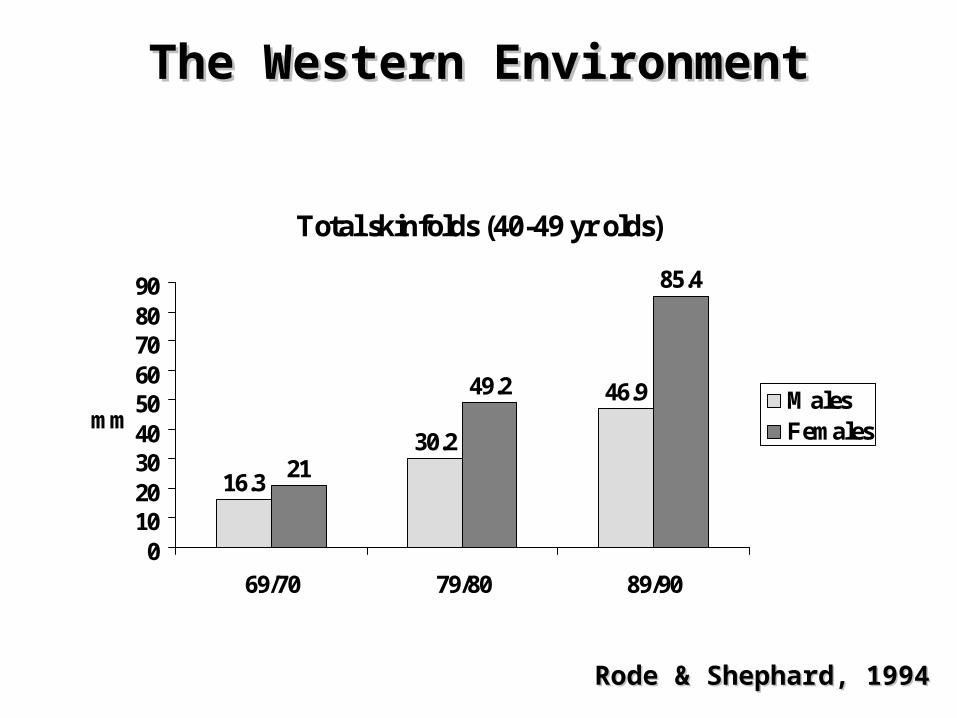
Total skinfolds (40-49 yr olds)
16.3
30.2
46.9
21
49.2
85.4
0102030405060708090
69/70 79/80 89/90
mmMalesFemales
Rode & Shephard, 1994Rode & Shephard, 1994
The Western EnvironmentThe Western Environment

Aerobic Power (40-49 yr olds)
51.645.1
41.540.835.3
30.7
0
10
20
30
40
50
60
69/70 79/80 89/90
ml*
kg*m
in
MalesFemales
Rode & Shephard, 1994Rode & Shephard, 1994
The Western EnvironmentThe Western Environment

Travel patterns of people from different Travel patterns of people from different industrialized countriesindustrialized countries
NetherlandsNetherlands• Trips of one kilometer or less --32% and 60% were Trips of one kilometer or less --32% and 60% were
traveled by bicycle and walking respectivelytraveled by bicycle and walking respectively• Trips of covering distances between 1 and 2.5 Trips of covering distances between 1 and 2.5
kilometers 46% and 21% were traveled by bicycle kilometers 46% and 21% were traveled by bicycle and walking respectively and walking respectively
• Transportation by car only accounted for 44% of all Transportation by car only accounted for 44% of all trips within urban areastrips within urban areas
Environment And Physical ActivityEnvironment And Physical Activity
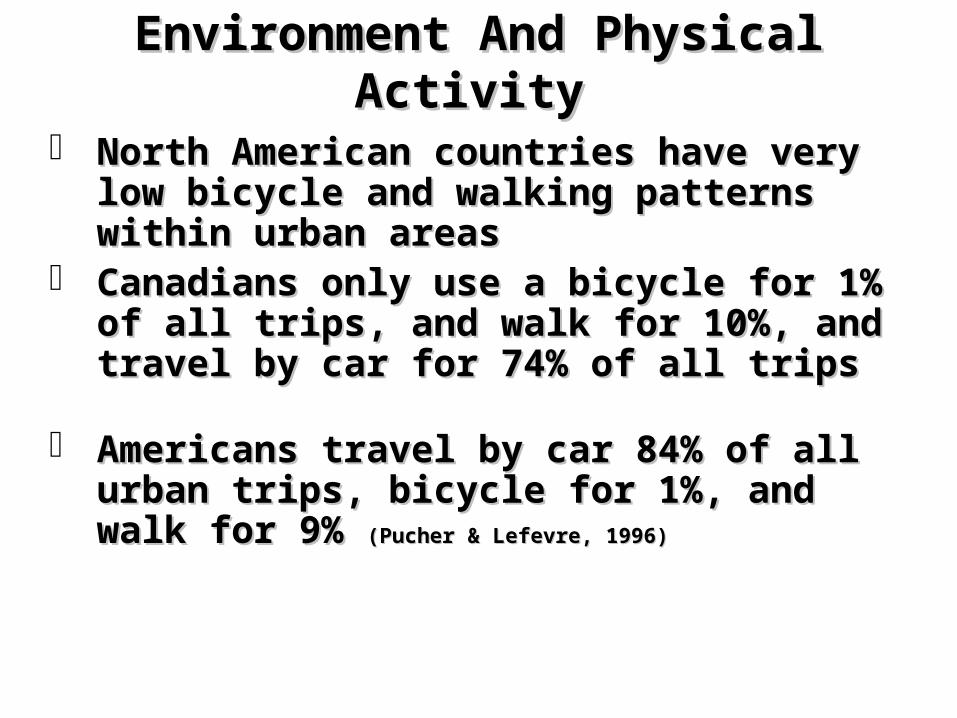
North American countries have very low bicycle North American countries have very low bicycle and walking patterns within urban areasand walking patterns within urban areas
Canadians only use a bicycle for 1% of all trips, Canadians only use a bicycle for 1% of all trips,
and walk for 10%, and travel by car for 74% of and walk for 10%, and travel by car for 74% of all trips all trips
Americans travel by car 84% of all urban trips, Americans travel by car 84% of all urban trips, bicycle for 1%, and walk for 9% bicycle for 1%, and walk for 9% (Pucher & Lefevre, 1996)(Pucher & Lefevre, 1996)
Environment And Physical ActivityEnvironment And Physical Activity

One factor that may account for the differences One factor that may account for the differences between these populations is the the road system between these populations is the the road system (Pucher & Lefevre, 1996)(Pucher & Lefevre, 1996)
Netherlands--urban roads and paths are made to Netherlands--urban roads and paths are made to facilitate cycling and walking. facilitate cycling and walking. • Right of way and separate lanes are provided for Right of way and separate lanes are provided for
cyclistscyclists North America--many urban communities are North America--many urban communities are
developed without sidewalks and clearly with car developed without sidewalks and clearly with car travel in mind travel in mind (Pucher & Lefevre, 1996)(Pucher & Lefevre, 1996)
Environment And Physical ActivityEnvironment And Physical Activity

It could be argued that it is cultural norms that It could be argued that it is cultural norms that really affect the travel patterns of populations really affect the travel patterns of populations in the Netherlands, United States, and Canadain the Netherlands, United States, and Canada
Although, cultural norms undoubtedly have Although, cultural norms undoubtedly have
some impact on travel patterns, studies in both some impact on travel patterns, studies in both the United States and Canada have shown that the United States and Canada have shown that 46% and 70% of respondents respectively, 46% and 70% of respondents respectively, would cycle to work more often if safe bicycle would cycle to work more often if safe bicycle lanes were providedlanes were provided
Environment And Physical ActivityEnvironment And Physical Activity

In 1985, Rod Dishman and his associates In 1985, Rod Dishman and his associates categorized the determinants into personal categorized the determinants into personal characteristics and environmental characteristics and environmental influences. influences.
The weather, distance from facilities, and The weather, distance from facilities, and time pressures were all considered to be time pressures were all considered to be influences of one’s environment. influences of one’s environment.
Environment And Physical ActivityEnvironment And Physical Activity
Donald Iverson and his colleagues reviewed Donald Iverson and his colleagues reviewed research examining physical activity promotion research examining physical activity promotion in medical, worksite, community, and school in medical, worksite, community, and school settings. settings.
Concluded:Concluded:• Less active individuals would become more active if Less active individuals would become more active if
facilities were more accessible, of better quality, and facilities were more accessible, of better quality, and cheaper cheaper
• Community environmental changes such as building Community environmental changes such as building bicycle paths, walking trails, basketball courts, and bicycle paths, walking trails, basketball courts, and swimming pools should increase physical activity. swimming pools should increase physical activity.
Environment And Physical ActivityEnvironment And Physical Activity

Brownell, Stunkard, and Albaum Brownell, Stunkard, and Albaum (1980; Study 1)(1980; Study 1) provided the seminal study on the potential provided the seminal study on the potential impact of one’s environment on subsequent impact of one’s environment on subsequent physical activityphysical activity
Placed a sign at the stairs/escalator choice pointPlaced a sign at the stairs/escalator choice point• The sign was three by three and a half feet and The sign was three by three and a half feet and
depicted a lethargic heavy heart riding up the depicted a lethargic heavy heart riding up the escalator and a healthy slim heart climbing the stairsescalator and a healthy slim heart climbing the stairs
Stair use increased from 5-6% up to 13-16%Stair use increased from 5-6% up to 13-16%
Environmental PromptsEnvironmental Prompts


Perceived AccessPerceived Access Sallis et al. (1997) had undergraduates Sallis et al. (1997) had undergraduates
indicate physical activity resources indicate physical activity resources available to themavailable to them
Home environment; e.g., equipmentHome environment; e.g., equipment Neighborhood environmentNeighborhood environment
• Features; e.g. bike pathsFeatures; e.g. bike paths• Perceived safetyPerceived safety• Type of environment; e.g., residential, Type of environment; e.g., residential,
commercial commercial
Convenience to 18 types of facilitiesConvenience to 18 types of facilities Physical activity was assessedPhysical activity was assessed

Perceived AccessPerceived Access Sallis et al. found: Sallis et al. found:
• The perceived home environment was related The perceived home environment was related to physical activity.to physical activity.
• The perceived neighborhood environment The perceived neighborhood environment was NOT related to physical activitywas NOT related to physical activity
• The perceived convenience of facilities had a The perceived convenience of facilities had a small relationship to PAsmall relationship to PA

Perceived AccessPerceived Access Booth et al. (2000) had adults 60+ years Booth et al. (2000) had adults 60+ years
indicate physical activity resources indicate physical activity resources available to themavailable to them
Home environmentHome environment Neighborhood environmentNeighborhood environment
• Features, eg. bike pathsFeatures, eg. bike paths• Perceived safetyPerceived safety• Access to facilitiesAccess to facilities
2 Week recall of physical activity obtained2 Week recall of physical activity obtained

Perceived AccessPerceived Access Booth et al. found: Booth et al. found:
• The perceived home environment was NOT The perceived home environment was NOT related to physical activity.related to physical activity.
• The perceived neighborhood environment The perceived neighborhood environment was NOT related to physical activitywas NOT related to physical activity
• The perceived access to facilities was related The perceived access to facilities was related to physical activityto physical activity

Actual Access to ResourcesActual Access to Resources
Sallis et al. (1990) phoned a random sample Sallis et al. (1990) phoned a random sample of 2,053 residents of San Diegoof 2,053 residents of San Diego
Physical activity levels determinedPhysical activity levels determined Address obtained (to match against address Address obtained (to match against address
of local facilities)of local facilities) PA of each respondent matched with PA of each respondent matched with
density of facilities in his/her density of facilities in his/her neighborhoodsneighborhoods
They found that the density of They found that the density of neighborhood facilities was related to neighborhood facilities was related to physical activityphysical activity

What about the issue of access?What about the issue of access?
Estabrooks, Lee, & Gyurcsik investigated the Estabrooks, Lee, & Gyurcsik investigated the availability & accessibility of physical availability & accessibility of physical activity resources with a small mid-western activity resources with a small mid-western citycity
A secondary purpose was to examine A secondary purpose was to examine community socioeconomic status in relation community socioeconomic status in relation to the identified physical activity resources to the identified physical activity resources

Neighborhood Context and Physical Neighborhood Context and Physical ActivityActivity
0
1
2
3
4
5
6
7
1965 1974
Year of Survey
Ph
ysic
al A
ctiv
ity
Poverty Area
Nonpoverty Area
Data source: Yen, I.H., & Kaplan, G.A. (1998). Poverty area residence and changes in Data source: Yen, I.H., & Kaplan, G.A. (1998). Poverty area residence and changes in physical activity level: Evidence from the Alameda County Study. physical activity level: Evidence from the Alameda County Study. AJPH, 88AJPH, 88, 1709-1712., 1709-1712.

Availability and AccessibilityAvailability and Accessibility
The data collection protocol included two steps. The data collection protocol included two steps.
First, world-wide-web, telephone directory, and First, world-wide-web, telephone directory, and city map searchers were conducted to identify city map searchers were conducted to identify city resources for physical activity participationcity resources for physical activity participation
• SchoolsSchools• ParksParks• Fitness centersFitness centers• Dance studiosDance studios• Running pathsRunning paths
Second, a number of agencies were Second, a number of agencies were contacted to provide global/geographic contacted to provide global/geographic information system (GIS) data on information system (GIS) data on physical activity resources and physical activity resources and community characteristics. community characteristics. • County and City Parks and RecreationCounty and City Parks and Recreation• The Metropolitan Planning DepartmentThe Metropolitan Planning Department• The City Police DepartmentThe City Police Department
Availability and AccessibilityAvailability and Accessibility

For the consistency of information gathered For the consistency of information gathered census tracts were used as the unit of analysis census tracts were used as the unit of analysis ((nn=37). =37).
• Census tracks were matched based upon Census tracks were matched based upon geographic area, population, and economic statusgeographic area, population, and economic status
• High and low SES areas were identified using a High and low SES areas were identified using a combination of employment rate, poverty rate, combination of employment rate, poverty rate, and average income within the tract and average income within the tract
Availability and AccessibilityAvailability and Accessibility
• High SES (4 tracks, High SES (4 tracks, nn=18,825)=18,825)• Per Capita Income= 21,126Per Capita Income= 21,126• 4.8 % below poverty level4.8 % below poverty level• 2.8% unemployment2.8% unemployment
• Low SES (6 tracks, Low SES (6 tracks, nn=20,250)=20,250)• Per Capita Income= 8,582Per Capita Income= 8,582• 26.6 % below poverty level26.6 % below poverty level• 9.7% unemployment9.7% unemployment
Availability and AccessibilityAvailability and Accessibility

0
10
20
30
40
50
60
70
80
Total Pay Free
High SESLow SES
Availability and AccessibilityAvailability and Accessibility

Areas with low and high SES did not differ in Areas with low and high SES did not differ in the amount of resourcesthe amount of resources
Accessibility…Accessibility…• 75% of resources are free of charge in high SES 75% of resources are free of charge in high SES
areasareas• 40% of the resources were pay facilities in low 40% of the resources were pay facilities in low
SES areasSES areas
City planning appears to favor areas of high City planning appears to favor areas of high SES when providing physical activity SES when providing physical activity resources such as free facilities, green space, resources such as free facilities, green space, and walkwaysand walkways
Availability and AccessibilityAvailability and Accessibility

ENDEND