Embed Size (px)
Citation preview
CHAPTER 10
Government Laboratory
Services provided bythe Government Laboratory
Audit CommissionHong Kong30 October 2014
This audit review was carried out under a set of guidelines tabled inthe Provisional Legislative Council by the Chairman of the PublicAccounts Committee on 11 February 1998. The guidelines wereagreed between the Public Accounts Committee and the Director ofAudit and accepted by the Government of the Hong Kong SpecialAdministrative Region.
Report No. 63 of the Director of Audit contains 10 Chapters whichare available on our website at http://www.aud.gov.hk
Audit Commission26th floor, Immigration Tower7 Gloucester RoadWan ChaiHong Kong
Tel : (852) 2829 4210Fax : (852) 2824 2087E-mail : [email protected]
— i —
SERVICES PROVIDED BY THEGOVERNMENT LABORATORY
Contents
Paragraph
EXECUTIVE SUMMARY
PART 1: INTRODUCTION
Audit review
Acknowledgement
PART 2: PROVISION OF LABORATORY SERVICESTO USER BUREAUX AND DEPARTMENTS
Turnaround time of services
Audit recommendations
Response from the Administration
Quality assurance
Audit recommendations
Response from the Administration
1.1 – 1.14
1.15 – 1.16
1.17
2.1
2.2 – 2.21
2.22
2.23
2.24 – 2.37
2.38
2.39
— ii —
Paragraph
Coordination with user bureaux and departments
Audit recommendations
Response from the Administration
Handling emergency incidents
Audit recommendation
Response from the Administration
PART 3: OUTSOURCING OF LABORATORY SERVICES
Tender evaluation and contract administration
Audit recommendations
Response from the Administration
Monitoring contractor performance
Audit recommendations
Response from the Administration
Proficiency testing programmes
Audit recommendations
Response from the Administration
Post-implementation review of outsourcing
Audit recommendations
Response from the Administration
2.40 – 2.54
2.55
2.56
2.57 – 2.61
2.62
2.63
3.1
3.2 – 3.15
3.16
3.17
3.18 – 3.21
3.22
3.23
3.24 – 3.30
3.31
3.32
3.33 – 3.45
3.46
3.47
— iii —
Paragraph
PART 4: MANAGEMENT OF CHEMICALS,SAMPLES, EXHIBITS AND EQUIPMENT
Stock management of chemicals
Audit recommendations
Response from the Administration
Handling of samples and exhibits
Audit recommendations
Response from the Administration
Maintenance of equipment
Audit recommendations
Response from the Administration
PART 5: WAY FORWARD
Challenges facing the Government Laboratory
Areas for improvement
Government Laboratory’s long-termstrategic development plan
Audit recommendation
Response from the Administration
4.1
4.2 – 4.17
4.18
4.19
4.20 – 4.25
4.26
4.27
4.28 – 4.36
4.37
4.38 – 4.39
5.1
5.2
5.3
5.4 – 5.5
5.6
5.7
— iv —
Appendices Page
A : Services provided by the Government Laboratory
B : Government Laboratory: Organisation chart (extract)(31 July 2014)
C : The number of staff and the workloadof the Government Laboratory (2009 to 2013)
D : Actual compliance rates reportedin the Controlling Officer’s Report (2013)
E : Illustration of calculation of average target turnaroundtime for “Pharmaceuticals (quality control)”
F : Case 1: Audit analysis of the COR performanceinformation for testing of “Pharmaceuticals (qualitycontrol)”
G : Acronyms and abbreviations
70 – 72
73
74
75 – 78
79 – 80
81 – 84
85 – 86
— v —
SERVICES PROVIDED BY THEGOVERNMENT LABORATORY
Executive Summary
1. The Government Laboratory (GL) provides a broad range of analytical,
advisory and forensic services to enable government bureaux and departments
(B/Ds) to meet their responsibilities. In 2014-15, the financial provision of the GL
is $436 million. As at 31 March 2014, the GL had about 460 professional,
technical and supporting staff. Headed by the Government Chemist, the GL is
organised into three Divisions, namely the Analytical and Advisory Services
Division (AASD), the Forensic Science Division (FSD), and the Administration
Division. The former two Divisions are further divided into 27 Sections. The
AASD performs statutory testing as the referee analyst under a number of
ordinances and regulations. It also provides a wide range of chemical testing and
advisory services to B/Ds and public institutions. The FSD provides forensic
science services to the criminal justice system. The Audit Commission (Audit) has
recently conducted a review of the services provided by the GL.
Provision of laboratory servicesto user bureaux and departments
2. Turnaround time of services. Many requests for laboratory tests need to
be performed in a timely manner. The work performance of the GL is published in
its Controlling Officer’s Report (COR). The GL sets performance targets expressed
primarily as a compliance rate, i.e. the percentage of completion of case
submissions from its user B/Ds within a specified turnaround time for each type of
testing service. Audit found that the practices used for counting the actual
turnaround time were not uniformly adopted by individual Sections of the GL and
the actual turnaround times of some types of testing had been excluded from the
calculation of work performance. Audit also found that the target turnaround times
of the sub-categories of services managed by individual Sections of the GL were
Executive Summary
— vi —
well above their actual turnaround times, thus accounting for the high compliance
rates achieved. In spite of the high compliance rates of turnaround times, results of
Audit’s survey of July 2014 on 17 user B/Ds (the Audit Survey) revealed that there
were requests from some user B/Ds for expediting the GL’s services to better serve
their operational needs (paras. 2.4, 2.5, 2.11 to 2.14, 2.19 and 2.20).
3. Quality assurance. Audit examination of the GL’s internal quality audit
reports revealed that the FSD had reported root cause analysis in the summary
report of the annual quality audit and submitted to Division Heads for endorsement
and necessary actions, while the AASD had not. Audit reviewed the root cause
analyses conducted by the FSD and noted that some of these analyses were not
thoroughly carried out. Audit analysis of the “non-conformities” and “areas worth
improvement” identified by the GL’s quality audits revealed some irregularities
common among different Sections and some recurring year after year (paras. 2.32
to 2.34 and 2.37).
4. Coordination with user B/Ds. To promote effective coordination and
facilitate regular consultations, the GL signed a Memorandum of Understanding
(MOU) with the Hong Kong Police Force (HKPF) in 2000 and the Customs and
Excise Department (C&ED) in 2003. In the Audit Survey, the HKPF and the
C&ED considered that the MOU was useful for the GL to understand their needs
and there was a need to review the MOU on a regular basis. Of the 15 surveyed
B/Ds without such an MOU, four agreed that it would better serve their operational
needs if MOUs were signed with the GL. Furthermore, seven of the 17 surveyed
B/Ds considered that the GL could provide more types of testing services.
Four B/Ds considered that the GL could provide more tests for each type of service
(paras. 2.42, 2.45, 2.46 and 2.52).
Outsourcing of laboratory services
5. Tender evaluation and contract administration. Since 2008, the GL has
outsourced some of its regular food surveillance testing work to local accredited
laboratories. In 2013-14, about 120,000 food tests were outsourced at a total
contract sum of $2.63 million, accounting for some 60% of the AASD’s routine
food testing work (or 17% of the AASD’s testing work). The GL outsourced a total
Executive Summary
— vii —
of 17 food testing contracts in 2013-14. Of the four private laboratories involving
outsourcing by the GL, one was awarded 97% of the food testing (in 13 separate
contracts). Audit considers that reliance on a dominant contractor for the food
testing may pose concentration risks to the GL. Audit also noted that the past
performance of laboratories (such as late reporting of test results or warnings
issued) had not been taken into account in tender assessment (paras. 3.5, 3.9, 3.10
and 3.15).
6. Monitoring contractor performance. To safeguard the quality of
outsourcing services, the GL regularly monitors the performance of contractors.
During each contract period, the Chemist-in-charge conducted at least one routine
on-site inspection. The on-site inspections were normally announced one or
two days in advance. There is a need for the GL to consider introducing
unannounced inspections to enhance the monitoring of contractor performance.
Although the GL formulated in 2011 a comprehensive checklist as a guide for
inspections, this checklist was not used by GL staff. Audit considers that using the
checklist by different inspection teams would help ensure completeness and
consistency (paras. 3.18 to 3.21).
7. Post-implementation review (PIR) of outsourcing. Audit found that the
GL’s outsourcing had improved the turnaround times tremendously in conducting
food tests. The turnaround times in conducting outsourced food tests were much
shorter than those for in-house food tests. After six years of implementation since
2008, it is timely for the GL to conduct a PIR on the outsourcing of the laboratory
testing so as to take stock of the position and plan the way forward. The Audit
Survey also found that some user B/Ds would like to outsource the laboratory
services to private laboratories (directly by themselves or by the GL). Additionally,
Audit noted that some user B/Ds wanted to have staff seconded from the GL. The
Secretary for Food and Health has allocated a recurrent funding of $12 million a
year to the GL for outsourcing its routine food tests to commercial laboratories.
Audit however found that of the $10.33 million expenditure on outsourcing in
2013-14, only $2.69 million (26%) was spent on contract payments to contractors,
while $7.64 million (74%) was spent on items not directly related to outsourcing
(paras. 3.36, 3.37, 3.42 to 3.44).
Executive Summary
— viii —
Management of chemicals, samples, exhibits and equipment
8. Stock management of chemicals. The GL spends about $120 million a
year on purchasing equipment and chemicals. Audit noted that there were stock
discrepancies between stock balance reports and stocktaking records. Audit selected
20 items with discrepancies for the year 2014 and checked whether the discrepancies
were properly adjusted. It was found that the stock balances of six items had not
been adjusted accordingly. Audit conducted a stocktaking exercise on 28 July 2014
at the GL main store, and found discrepancies in 20% of the items checked. Audit
also noted that no expiry dates of chemicals were recorded in the stock system.
There was no requirement for the GL’s Sections to conduct stocktakes regularly on
the stock held and to check the expiry dates of the stock items (paras. 4.2, 4.4 to
4.7, 4.9 and 4.14).
9. Handling of samples and exhibits. Many of the samples received by the
GL are formal exhibits used for prosecution purposes. The reports are required to
be delivered, and the exhibits to be returned, to the user B/Ds. Taking 28 July 2014
as the cut-off date, Audit found that 32% of the cases with reports and/or exhibits
had not been collected for over 3 months after the completion date (including 14%
over one year). Audit noted that there were no stocktaking requirements stipulated
in the quality manuals for samples/exhibits, nor were there any guidelines for
handling exhibits remaining uncollected by user B/Ds for a long time. Audit also
found cases in which the exhibits were only collected a long time (e.g. over 1 year
in 56 cases) after the reports were completed. As such, the GL may need extra
storage space/facilities to keep these long-outstanding exhibits (paras. 4.23 to 4.25).
10. Maintenance of equipment. The GL has been using the service of the
Electrical and Mechanical Services Trading Fund (EMSTF) to maintain and repair
its equipment since the establishment of the EMSTF in 1996. The GL entered into a
five-year Service Level Agreement (SLA) with the EMSTF starting from
1 April 2001. Under the current SLA (1 July 2011 to 31 March 2016), the GL
would pay the EMSTF a maintenance fee of about $40.38 million over the period
according to the equipment list. The current SLA will expire on 31 March 2016.
In April 2014, the GL was exploring the way forward and the strategy for the
maintenance of all equipment in use. In this regard, the GL identified some major
challenges, including: (a) the warranties of many items of scientific equipment
would expire in the next few years; (b) the additions to the equipment list for
maintenance services might increase the SLA fee substantially; and (c) for some
scientific equipment with advanced technology, the EMSTF might not have the
required expertise to provide maintenance services (paras. 4.28, 4.30, 4.32 and
4.35).
Executive Summary
— ix —
Way forward
11. Given its limited resources and the wide spectrum of government services
that require its support, the GL is facing challenges to continuously improve its
efficiency and cost-effectiveness in the provision of laboratory services. The
frequent occurrence of emergency incidents (notably food incidents) in recent years
has also put pressure on the GL in providing support to various B/Ds in dealing with
such incidents. The GL is meanwhile reviewing its way forward to meet the
challenges (paras. 5.2 and 5.5).
Audit recommendations
12. Audit recommendations are made in the respective sections of this
Audit Report. Only the key ones are highlighted in this Executive Summary.
Audit has recommended that the Government Chemist should:
Provision of laboratory services to user B/Ds
(a) critically review the GL’s compilation of performance information on
turnaround times reported in the COR to ensure that it is clearly and
fairly presented (para. 2.22(a));
(b) continue to make efforts to shorten the target turnaround times of
laboratory services to help user B/Ds better meet their operational
needs (para. 2.22(e));
(c) take measures to ensure that root cause analyses are thoroughly
conducted and the results are documented, so as to identify
appropriate corrective actions (para. 2.38(b));
(d) liaise with user B/Ds for signing an amplified version of MOU with
the GL in order to better define and predict the service needs and
facilitate effective planning of the use of resources (para. 2.55(c));
Executive Summary
— x —
Outsourcing of laboratory services
(e) consider the need to limit the number of outsourcing contracts that
each private laboratory may be awarded so as to reduce concentration
risks (para. 3.16(a));
(f) introduce unannounced on-site inspections, and remind the inspecting
officers to use the inspection checklist to properly document the
results for each inspection (para. 3.22(a) and (b));
(g) conduct a PIR on the outsourcing of laboratory services, including
exploring the feasibility of more outsourcing of laboratory services
and staff secondment to user B/Ds, and reviewing the propriety of
charging to the outsourcing vote items which are not directly related
to outsourcing (para. 3.46(b) and (c));
Management of chemicals, samples, exhibits and equipment
(h) ensure that the expired stocks are disposed of periodically and the
stock lists are updated promptly (para. 4.18(d));
(i) provide more management information for monitoring
long-outstanding cases pending collection by user B/Ds
(para. 4.26(b)); and
Way forward
(j) take on board the audit observations and recommendations in this
Audit Report in taking forward the GL’s long-term strategic
development plan (para. 5.6).
Response from the Administration
13. The Government Chemist agrees with the audit recommendations.
— 1 —
PART 1: INTRODUCTION
1.1 This PART describes the background to the audit and outlines the audit
objectives and scope.
Background
1.2 The Government Laboratory (GL), with the Food and Health Bureau as
its housekeeping Bureau, provides a broad range of analytical, advisory and forensic
services to enable government bureaux and departments (B/Ds) to meet their
responsibilities for law and order, public health and safety, environmental
protection, government revenue, consumers’ interests, and implementation of
government policies. It also provides similar services to other statutory bodies.
Appendix A shows the main services provided by the GL.
1.3 The GL provides services to B/Ds free of charge. It may also provide
scientific services to statutory bodies and the private sector on a full-cost recovery
basis, provided that its main functions are not affected.
1.4 The GL provides services under the following three categories:
(a) Statutory testing. The Government Chemist discharges statutory
functions as referee analyst under various ordinances and regulations;
(b) Advisory and investigative services. The GL provides a wide range of
chemical testing and advisory services to B/Ds and public institutions; and
(c) Forensic science services. The GL provides forensic science services to
the criminal justice system.
1.5 In 2014-15, the financial provision of the GL is $436 million. Figure 1
shows the financial provision for each category of services.

Introduction
— 2 —
Figure 1
Financial provision for the GL
(2014-15)
Source: GL records
Mission of the GL
1.6 The GL’s mission is to provide our community with quality analytical,
forensic and advisory services achieved through advancing measurement science and
standards. The GL strives to:
(a) keep up with the latest development in measurement science and
technology;
(b) be prepared to meet the needs of community;
(c) strengthen international collaborations; and
(d) develop metrology in chemistry and biology.
1.7 The GL aims to be a leading laboratory in the region offering significant
contributions to the testing community at large. It actively participates in the
activities organised by the international and regional metrological organisations and
offers necessary support to the local testing and certification sectors.
Forensic science services:$150 million (34%)
Advisory andinvestigative services:
$80 million (19%)
Statutory testing:$206 million (47%)
Introduction
— 3 —
Organisation of the GL
1.8 As at 31 March 2014, the GL had about 460 professional, technical and
supporting staff. Headed by the Government Chemist, the GL is organised into
three Divisions, namely the Analytical and Advisory Services Division (AASD), the
Forensic Science Division (FSD), and the Administration Division. The former
two Divisions, each headed by an Assistant Government Chemist, are responsible
for providing laboratory testing services. These two Divisions are further divided
into four Groups and 27 Sections according to different scientific disciplines (such
as biochemical sciences, environmental chemistry, forensic toxicology, etc.).
Reporting to a Group Head at the Chief Chemist level, each Section is headed by a
Senior Chemist who is supported by several Chemists and Science Laboratory
Technologists (SLTs). Appendix B shows an extract of the GL’s organisation chart.
Appendix C shows the number of staff and the workload of the GL for the past
five years.
1.9 The headquarters of the GL is situated in Homantin. It also has
six satellite laboratories which are spread out in different locations. Of the
27 Sections of the GL, 18 are located in Homantin headquarters and 9 in the satellite
laboratories.
AASD
1.10 The AASD performs 11 categories of statutory testing (see Appendix D
for details) as the referee analyst under a number of ordinances and regulations,
including:
(a) analysis of food products for regulatory compliance (e.g. under the Public
Health and Municipal Services Ordinance — Cap. 132);
(b) examination of western and Chinese medicines for registration and quality
control (e.g. under the Pharmacy and Poisons Ordinance — Cap. 138);
(c) testing of dutiable commodities for tariff classification (under the Dutiable
Commodities Ordinance — Cap.109);
Introduction
— 4 —
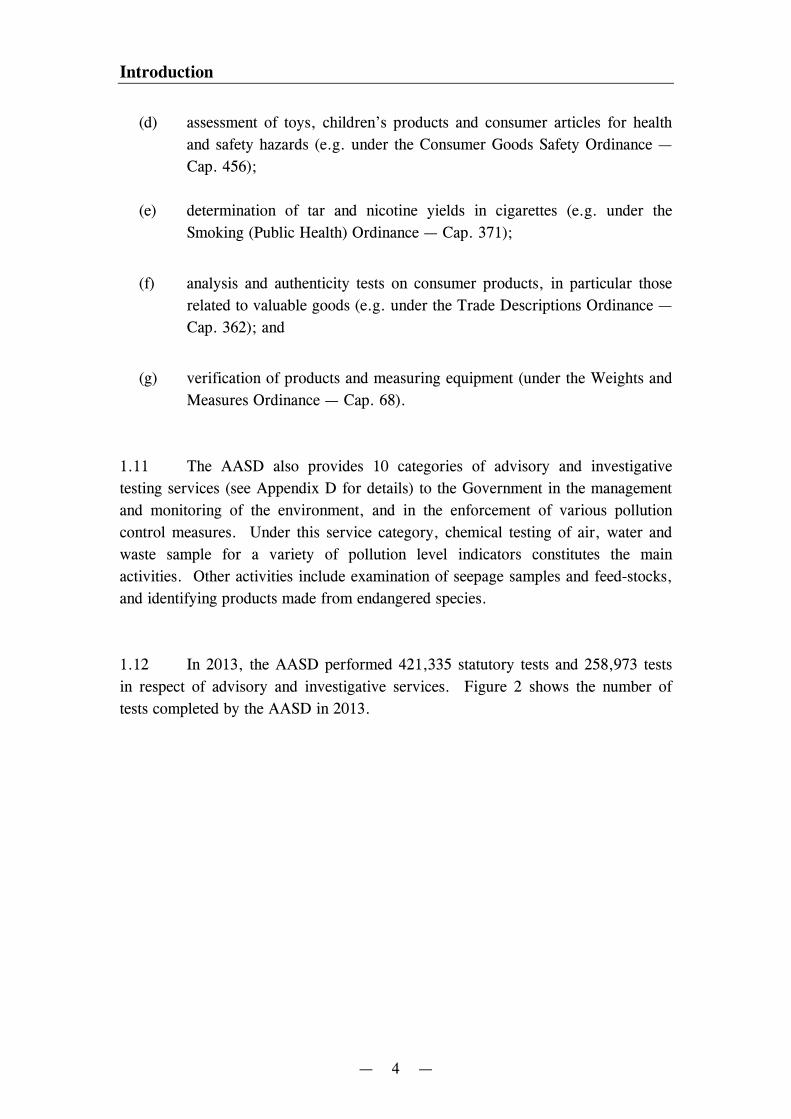
(d) assessment of toys, children’s products and consumer articles for health
and safety hazards (e.g. under the Consumer Goods Safety Ordinance —
Cap. 456);
(e) determination of tar and nicotine yields in cigarettes (e.g. under the
Smoking (Public Health) Ordinance — Cap. 371);
(f) analysis and authenticity tests on consumer products, in particular those
related to valuable goods (e.g. under the Trade Descriptions Ordinance —
Cap. 362); and
(g) verification of products and measuring equipment (under the Weights and
Measures Ordinance — Cap. 68).
1.11 The AASD also provides 10 categories of advisory and investigative
testing services (see Appendix D for details) to the Government in the management
and monitoring of the environment, and in the enforcement of various pollution
control measures. Under this service category, chemical testing of air, water and
waste sample for a variety of pollution level indicators constitutes the main
activities. Other activities include examination of seepage samples and feed-stocks,
and identifying products made from endangered species.
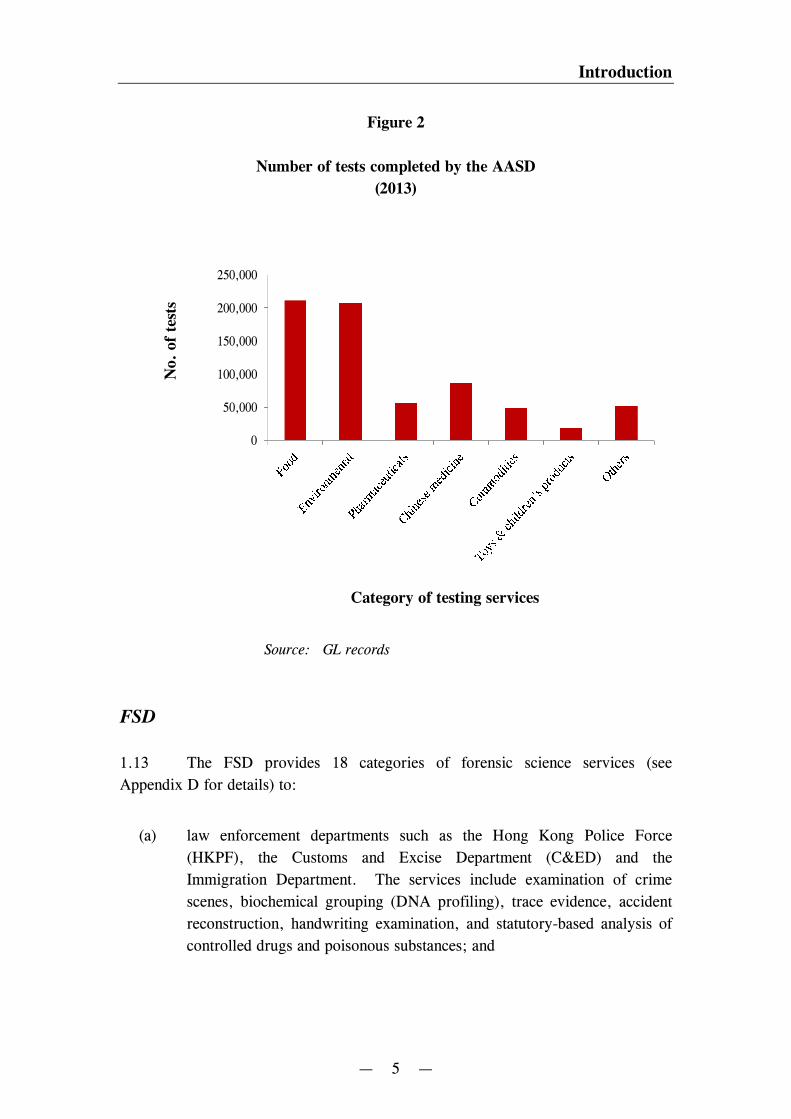
1.12 In 2013, the AASD performed 421,335 statutory tests and 258,973 tests
in respect of advisory and investigative services. Figure 2 shows the number of
tests completed by the AASD in 2013.
Introduction
— 5 —
Figure 2
Number of tests completed by the AASD
(2013)
0
50,000
100,000
150,000
200,000
250,000
Source: GL records
FSD
1.13 The FSD provides 18 categories of forensic science services (see
Appendix D for details) to:
(a) law enforcement departments such as the Hong Kong Police Force
(HKPF), the Customs and Excise Department (C&ED) and the
Immigration Department. The services include examination of crime
scenes, biochemical grouping (DNA profiling), trace evidence, accident
reconstruction, handwriting examination, and statutory-based analysis of
controlled drugs and poisonous substances; and
No.
ofte
sts
Category of testing services
Introduction
— 6 —
(b) the Department of Health (for the Methadone Maintenance Scheme), the
Social Welfare Department, the Correctional Services Department and
other organisations requiring urinalysis monitoring service.
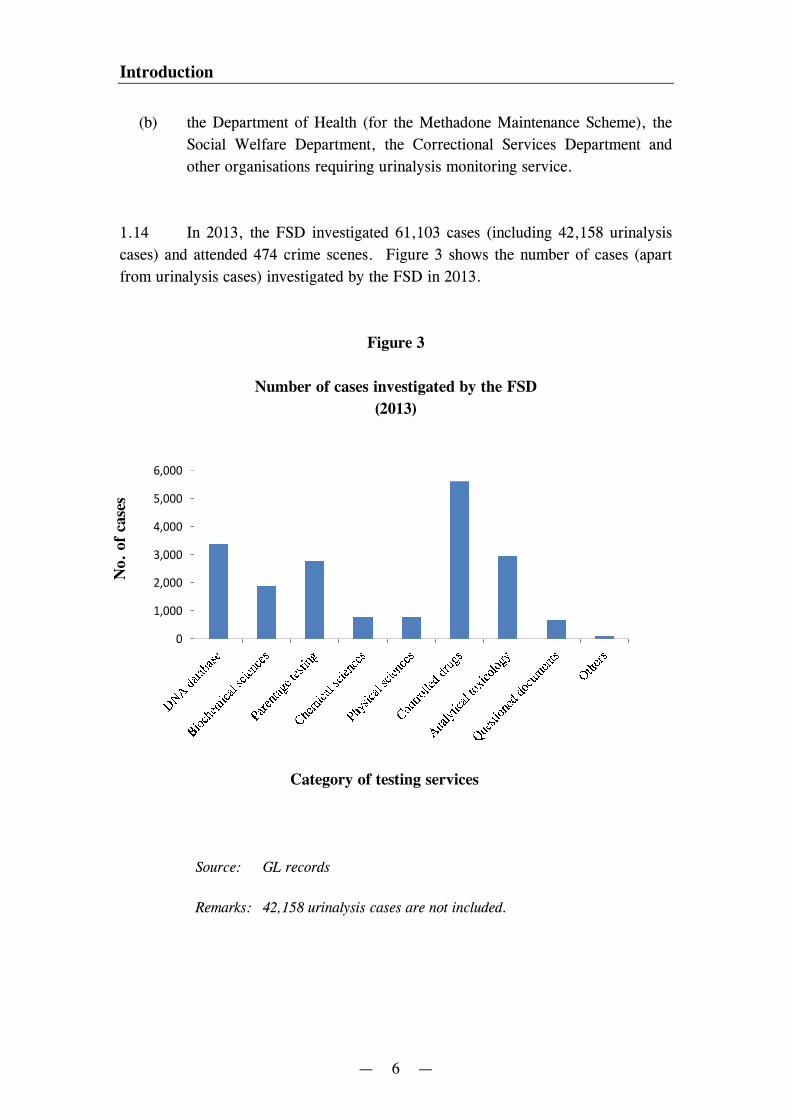
1.14 In 2013, the FSD investigated 61,103 cases (including 42,158 urinalysis
cases) and attended 474 crime scenes. Figure 3 shows the number of cases (apart
from urinalysis cases) investigated by the FSD in 2013.
Figure 3
Number of cases investigated by the FSD
(2013)
0
1,000
2,000
3,000
4,000
5,000
6,000
Source: GL records
Remarks: 42,158 urinalysis cases are not included.
No.
ofca
ses
Category of testing services
Introduction
— 7 —
Audit review
1.15 Audit review of 2002. In March 2002, the Audit Commission (Audit)
completed a review to examine the operations of the GL (the 2002 Audit Review).
The review found that there was room for improvement in a number of areas
including turnaround time of services, coordination with user B/Ds, and
maintenance of equipment. In particular, the review recommended the GL to
explore the option of outsourcing its routine analytical testing services to accredited
laboratories. The review results were included in Chapter 4 of Director of Audit’s
Report No. 38 of March 2002.
1.16 Some 12 years have elapsed since the 2002 Audit Review. Audit has
recently conducted a review to follow up the implementation of the 2002 Audit
Review’s recommendations, and examine the measures (including outsourcing of
laboratory services) taken by the GL to improve the efficiency and effectiveness of
its services to user B/Ds. In conducting this review, Audit conducted a survey
(Audit Survey) to gather information from 17 major user B/Ds on the quality of
services provided by the GL as well as the related coordination mechanism. The
audit review focused on the following areas:
(a) provision of laboratory services to user B/Ds (PART 2);
(b) outsourcing of laboratory services (PART 3);
(c) management of chemicals, samples, exhibits and equipment (PART 4);
and
(d) way forward (PART 5).
Audit has found room for improvement in the above areas, and has made a number
of recommendations to address the issues.
Acknowledgement
1.17 Audit would like to acknowledge with gratitude the assistance and full
cooperation of the staff of the GL and the 17 user B/Ds (see para. 1.16) during the
course of the audit review.
— 8 —
PART 2: PROVISION OF LABORATORY SERVICESTO USER BUREAUX AND DEPARTMENTS
2.1 This PART examines the GL’s provision of services to user B/Ds,
focusing on the following areas:
(a) turnaround time of services (paras. 2.2 to 2.23);
(b) quality assurance (paras. 2.24 to 2.39);
(c) coordination with user B/Ds (paras. 2.40 to 2.56); and
(d) handling emergency incidents (paras. 2.57 to 2.63).
Turnaround time of services
2.2 The GL is committed to achieving the goal of valid analytical
measurements and quality forensic examination service that is impartial and
accurate. The AASD provides a wide variety of analytical, investigative, and
technical advisory services in the field of applied chemistry and related scientific
disciplines to B/Ds, public institutions and official international organisations. The
services offered by the AASD are classified under 11 categories of “statutory
testing” services and 10 categories of “advisory and investigative services”.
Additionally, 18 of the 21 categories of services have sub-categories of testing
services (see Appendix D for details). The FSD provides a comprehensive range of
forensic investigative services to the law enforcement departments in Hong Kong.
The services offered by the FSD are classified under 6 categories of services
managed by the Criminalistics and Quality Management Group and 12 categories of
services managed by the Drugs, Toxicology and Documents Group (see Appendix D
for details).
2.3 The GL classifies the user B/Ds’ testing requirements as urgent service
requests or non-urgent ones. For urgent requests, the tests would be completed
within two days to support user B/Ds in response to emergency situations or public
health safety concerns (such as food incidents). For example, the AASD handled
some 250 urgent cases in 2013.
Provision of laboratory services to user bureaux and departments
— 9 —
Setting of performance targets
2.4 Many requests for laboratory tests need to be performed in a timely
manner. The work performance of the GL is published in its Controlling Officer’s
Report (COR) and is presented by test category with the volume of testing and the
performance target. The COR generally showed a high rate of compliance with its
performance targets.
2.5 To measure and manage GL’s ability to meet the user B/Ds’ demands, the
GL sets performance targets expressed primarily as a compliance rate, i.e. the
percentage of completion of case submissions from its user B/Ds within a specified
turnaround time (Note 1) for each type of testing service.
Databases of test sample information
2.6 The GL maintains two web-based application systems for storing the
centralised database of test sample information, one for AASD’s samples and the
other for FSD’s samples. Details of test samples received by the AASD are input
into the Sample Information Management System (SIMS) while details of those
received by the FSD are input into the Extended Sample Information Management
System (ESIMS). Both the SIMS and the ESIMS are used by GL staff for making
enquiries and tracking of the status of the testing. The design of the systems is to
enable the GL staff to make use of the system information to respond to user B/Ds’
enquiries of the laboratory testing services.
2.7 The information stored in the databases of both systems includes data such
as reference/case number, date of receipt, sample description/category, responsible
section, number of tests and the target turnaround time. The centralised database
information is eventually copied (downloaded) to the corresponding Sectional
databases.
Note 1: Turnaround time is the case-completion time defined as the number of workingdays between the date of receipt of the exhibits/case at the GL and the date thatthe exhibits/report are available for return to the user B/D concerned.
Provision of laboratory services to user bureaux and departments
— 10 —
2.8 The Section users responsible for the input of the individual data would
update their own Section’s database with data such as the test report/certificate date
and the Chemist code. The AASD Section users subsequently transfer (upload) the
completed data records back to the SIMS which would be aggregated and
summarised in various statistical reports generated for the AASD. The FSD Section
users use the Sectional databases to generate the statistical reports.
2.9 Management reports are regularly generated by the systems. Year-end
progress review reports are generated for preparing the COR. Quarterly progress
reports are generated for reporting to the relevant bureaux. Monthly statistical
returns/Section reports, including the returns for the Divisions showing the
percentage of samples that achieved the target turnaround time, are generated for
internal discussion during the Divisional Management Meetings of the AASD and
the FSD.
Audit analysis of actual turnaround time
2.10 Audit Review. The 2002 Audit Review (see para. 1.15) noted that for
some service performance, the GL could set more challenging targets given the fact
that their actual performance had consistently been well above the targets set. In
this review, Audit reviewed the 2013 COR compiled by the GL. The COR listed
39 categories of testing, with actual compliance rate well above 90% for
substantially all of the categories (see Appendix D). Of the 39 categories of testing
disclosed in the COR, 18 have sub-categories. These 18 categories with
sub-categories are for “statutory testing” and “advisory and investigative services”
(see paras. 1.4 and 2.2). According to the GL, different samples require different
analytical procedures, thus different reporting time applies for each sub-category.
The quoted number of working days for a specific category in the GL’s COR
represents an average of reporting time for the different types of samples/test
requests within the category, while the target and actual compliance rates, expressed
in percentages, represent the total compliance rate of the concerned samples/test
requests within a particular category against their sub-categories’ respective target
turnaround times (not disclosed in the COR). In other words, for the categories
with sub-categories, the average reporting time quoted in the COR is for reference
only, but not used for measuring the compliance rate.
Provision of laboratory services to user bureaux and departments
— 11 —
2.11 According to Financial Services and the Treasury Bureau Circular
Memorandum 12/2013, Controlling Officers should make sure that information set
out in the CORs is substantiated and accurate, and also satisfy themselves that
proper performance records are maintained and, as far as practicable, can be
validated. Audit reperformed the calculations of the compliance rate for 2013, but
the results did not match or could not be reconciled to the information reported in
the GL’s COR. As reported in the COR, while targets were met for all categories
of laboratory services, the actual compliance rates for 20 of these categories as
calculated by Audit were lower than the reported achievements. Audit expressed
concerns to the GL that data in the GL systems did not seem to support the
information reported in the COR. In response, the GL provided additional
information to Audit for reconciling the differences. According to the GL, the
difference between audit calculations of the compliance rate and that reported in the
COR was very much due to the differing practices of the Sections in counting the
number of days taken to provide the services. Audit counted the day of receipt of
test sample consistently while some Sections excluded the day. While the difference
was not significant for the targets with longer turnaround time, it made a significant
difference for those with short turnaround time. According to the GL, the GL
comprised many Sections which provided different services to different user B/Ds,
there were many differences among them due to historical and operational reasons.
Another reason noted by Audit was that some types of testing had been excluded by
some Sections of the GL in the calculation of its work performance reported in the
COR.
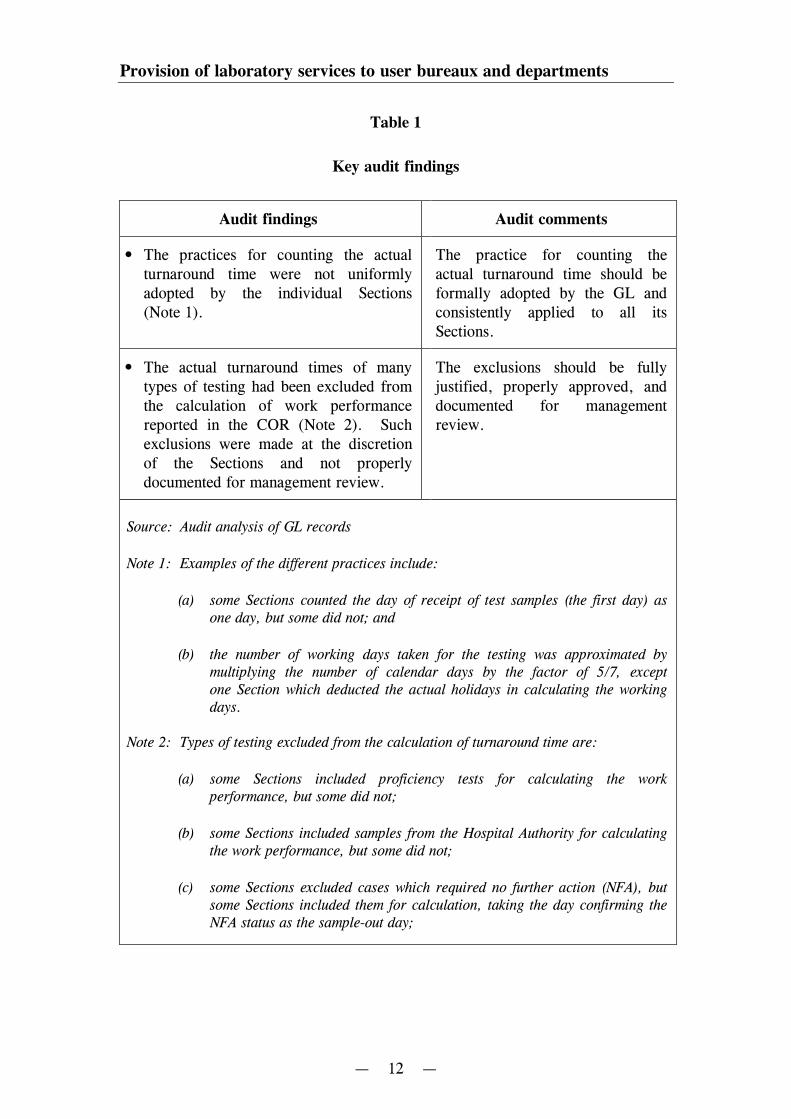
2.12 Key findings arising from the audit analysis of the reconciliation of the
differences are summarised in Table 1.
Provision of laboratory services to user bureaux and departments
— 12 —
Table 1
Key audit findings
Audit findings Audit comments
• The practices for counting the actualturnaround time were not uniformlyadopted by the individual Sections(Note 1).
The practice for counting theactual turnaround time should beformally adopted by the GL andconsistently applied to all itsSections.
• The actual turnaround times of manytypes of testing had been excluded fromthe calculation of work performancereported in the COR (Note 2). Suchexclusions were made at the discretionof the Sections and not properlydocumented for management review.
The exclusions should be fullyjustified, properly approved, anddocumented for managementreview.
Source: Audit analysis of GL records
Note 1: Examples of the different practices include:
(a) some Sections counted the day of receipt of test samples (the first day) asone day, but some did not; and
(b) the number of working days taken for the testing was approximated bymultiplying the number of calendar days by the factor of 5/7, exceptone Section which deducted the actual holidays in calculating the workingdays.
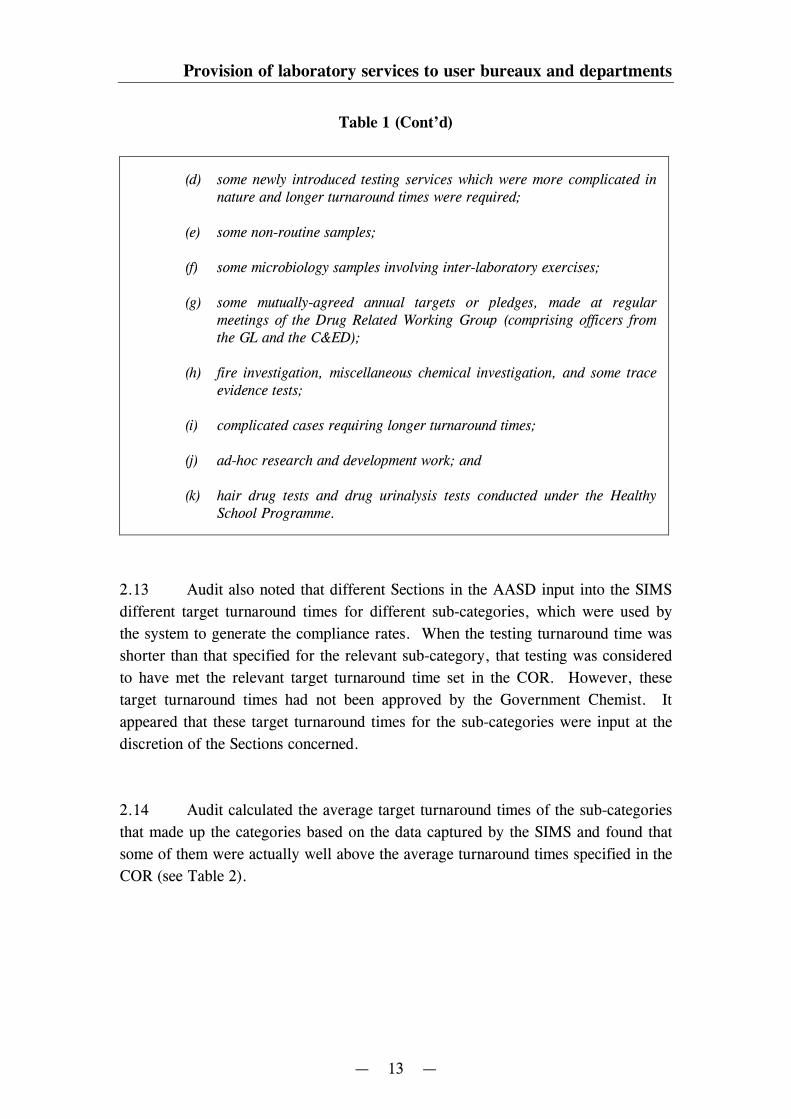
Note 2: Types of testing excluded from the calculation of turnaround time are:
(a) some Sections included proficiency tests for calculating the workperformance, but some did not;
(b) some Sections included samples from the Hospital Authority for calculatingthe work performance, but some did not;
(c) some Sections excluded cases which required no further action (NFA), butsome Sections included them for calculation, taking the day confirming theNFA status as the sample-out day;
Provision of laboratory services to user bureaux and departments
— 13 —
Table 1 (Cont’d)
(d) some newly introduced testing services which were more complicated innature and longer turnaround times were required;
(e) some non-routine samples;
(f) some microbiology samples involving inter-laboratory exercises;
(g) some mutually-agreed annual targets or pledges, made at regularmeetings of the Drug Related Working Group (comprising officers fromthe GL and the C&ED);
(h) fire investigation, miscellaneous chemical investigation, and some traceevidence tests;
(i) complicated cases requiring longer turnaround times;
(j) ad-hoc research and development work; and
(k) hair drug tests and drug urinalysis tests conducted under the HealthySchool Programme.
2.13 Audit also noted that different Sections in the AASD input into the SIMS
different target turnaround times for different sub-categories, which were used by
the system to generate the compliance rates. When the testing turnaround time was
shorter than that specified for the relevant sub-category, that testing was considered
to have met the relevant target turnaround time set in the COR. However, these
target turnaround times had not been approved by the Government Chemist. It
appeared that these target turnaround times for the sub-categories were input at the
discretion of the Sections concerned.
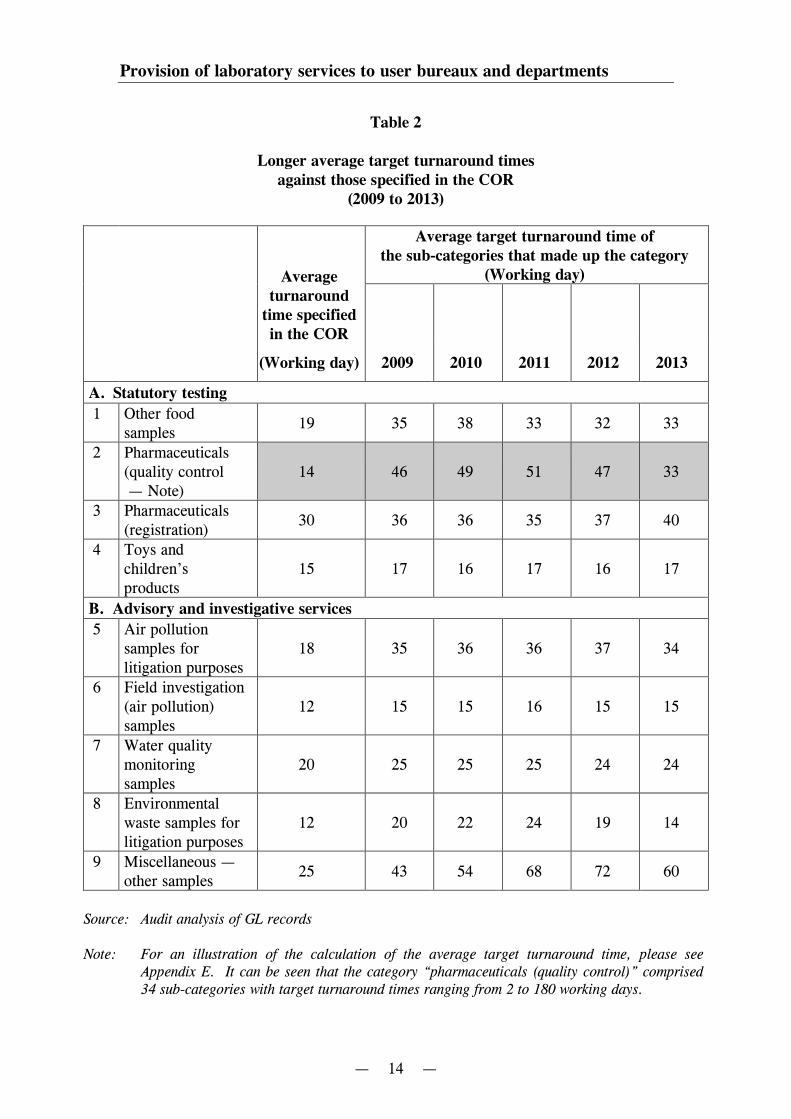
2.14 Audit calculated the average target turnaround times of the sub-categories
that made up the categories based on the data captured by the SIMS and found that
some of them were actually well above the average turnaround times specified in the
COR (see Table 2).
Provision of laboratory services to user bureaux and departments
— 14 —
Table 2
Longer average target turnaround timesagainst those specified in the COR
(2009 to 2013)
Averageturnaround
time specifiedin the COR
Average target turnaround time ofthe sub-categories that made up the category
(Working day)
(Working day) 2009 2010 2011 2012 2013
A. Statutory testing
1 Other foodsamples
19 35 38 33 32 33
2 Pharmaceuticals(quality control— Note)
14 46 49 51 47 33
3 Pharmaceuticals(registration)
30 36 36 35 37 40
4 Toys andchildren’sproducts
15 17 16 17 16 17
B. Advisory and investigative services
5 Air pollutionsamples forlitigation purposes
18 35 36 36 37 34
6 Field investigation(air pollution)samples
12 15 15 16 15 15
7 Water qualitymonitoringsamples
20 25 25 25 24 24
8 Environmentalwaste samples forlitigation purposes
12 20 22 24 19 14
9 Miscellaneous —other samples
25 43 54 68 72 60
Source: Audit analysis of GL records
Note: For an illustration of the calculation of the average target turnaround time, please seeAppendix E. It can be seen that the category “pharmaceuticals (quality control)” comprised34 sub-categories with target turnaround times ranging from 2 to 180 working days.
Provision of laboratory services to user bureaux and departments
— 15 —
2.15 Audit found that the target turnaround times set by the Sections for the
sub-categories that were included in a category of services could be substantially
different (sometimes longer) than the average shown in the COR. Taking
“Pharmaceuticals (quality control)” (i.e. Item 4 at Appendix D) as an example, the
average turnaround time specified in the COR was 14 working days. However, if a
weighted average had been taken to calculate the target turnaround time of all the
tests performed in the 34 sub-categories within the category, the average target
turnaround time in 2013 would have been 33, and not 14 working days (see Item 2
in Table 2). Audit selected the category “Pharmaceuticals (quality control)” for
case study to illustrate the reconciliation of the differences between Audit’s
calculations and those of the GL for 2013. Audit found from the case study that:
(a) not all the test requests had been included for calculating the compliance
rate;
(b) the target turnaround times of the sub-categories were generally much
higher than the actual turnaround times; and
(c) the turnaround time stated as an average in the COR was not the
benchmark used to measure the compliance rate of the sub-categories.
Details are given in Case 1 at Appendix F.
2.16 In general, setting longer target turnaround times would make it easier for
the GL to meet the target compliance rates set in the COR. Audit considers that the
GL needs to take measures to ensure that the target turnaround times for the
sub-categories input into the SIMS are subject to regular verification and
management review, and that the range of target turnaround times used by
the Sections for the sub-categories may be more accurate and descriptive than the
average target turnaround times for reporting in the COR.
Management information for user B/Ds
2.17 As mentioned in paragraph 2.6, the SIMS and the ESIMS are used by the
GL for handling user B/Ds’ enquiries on related testing information and status
checking of the testing. They had been developed for many years. However, Audit
found that:
Provision of laboratory services to user bureaux and departments
— 16 —
(a) the SIMS and the ESIMS were not designed for providing comprehensive
information as they could not readily generate information on the actual
turnaround time of each test category;
(b) it took quite a long time to extract accurate information required for audit
analysis. Some data needed to be extracted from records of individual
Sections (i.e. they were not readily available from the centralised
systems); and
(c) during the process of audit analysis, Audit found some doubtful/illogical
cases with the sample-in dates later than the sample-out dates. Upon
enquiry, the GL informed Audit in September 2014 that the ESIMS
contained some system bugs, and hence it was not used for generating
performance reports. However, the doubtful/illogical cases were more
likely due to errors in data entry.
For better management control purposes, Audit considers that the SIMS and
the ESIMS need to be enhanced in order to provide more readily comprehensive
management information for the GL.
GL’s customer surveys
2.18 The GL seeks annual feedbacks from its user B/Ds through questionnaire
surveys. The feedbacks shall be analysed and used to improve the management
system testing and calibration activities as well as customer services.
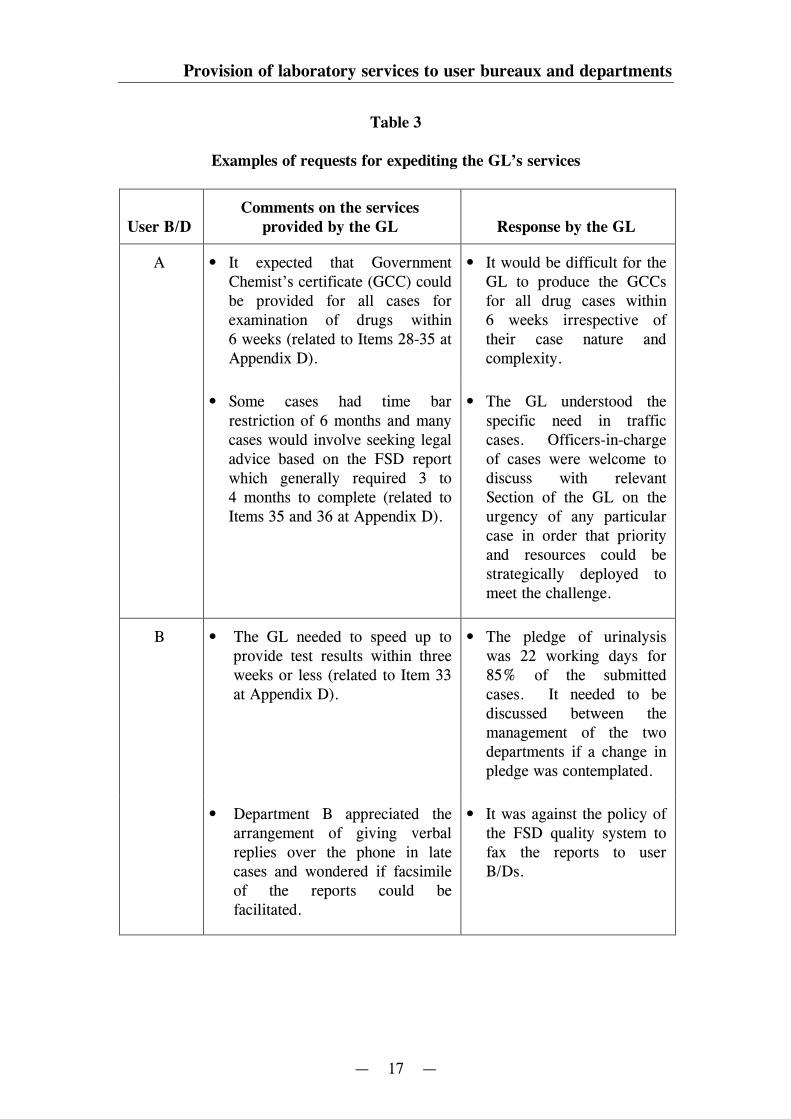
2.19 Audit examination of these customer surveys for the past three years
revealed that there were requests for expediting the GL’s services from some user
B/Ds in order to better serve their operational needs (see Table 3 for details).
Provision of laboratory services to user bureaux and departments
— 17 —
Table 3
Examples of requests for expediting the GL’s services
User B/DComments on the services
provided by the GL Response by the GL
A • It expected that GovernmentChemist’s certificate (GCC) couldbe provided for all cases forexamination of drugs within6 weeks (related to Items 28-35 atAppendix D).
• It would be difficult for theGL to produce the GCCsfor all drug cases within6 weeks irrespective oftheir case nature andcomplexity.
• Some cases had time barrestriction of 6 months and manycases would involve seeking legaladvice based on the FSD reportwhich generally required 3 to4 months to complete (related toItems 35 and 36 at Appendix D).
• The GL understood thespecific need in trafficcases. Officers-in-chargeof cases were welcome todiscuss with relevantSection of the GL on theurgency of any particularcase in order that priorityand resources could bestrategically deployed tomeet the challenge.
B • The GL needed to speed up toprovide test results within threeweeks or less (related to Item 33at Appendix D).
• The pledge of urinalysiswas 22 working days for85% of the submittedcases. It needed to bediscussed between themanagement of the twodepartments if a change inpledge was contemplated.
• Department B appreciated thearrangement of giving verbalreplies over the phone in latecases and wondered if facsimileof the reports could befacilitated.
• It was against the policy ofthe FSD quality system tofax the reports to userB/Ds.
Provision of laboratory services to user bureaux and departments
— 18 —
Table 3 (Cont’d)
User B/DComments on the services
provided by the GL Response by the GL
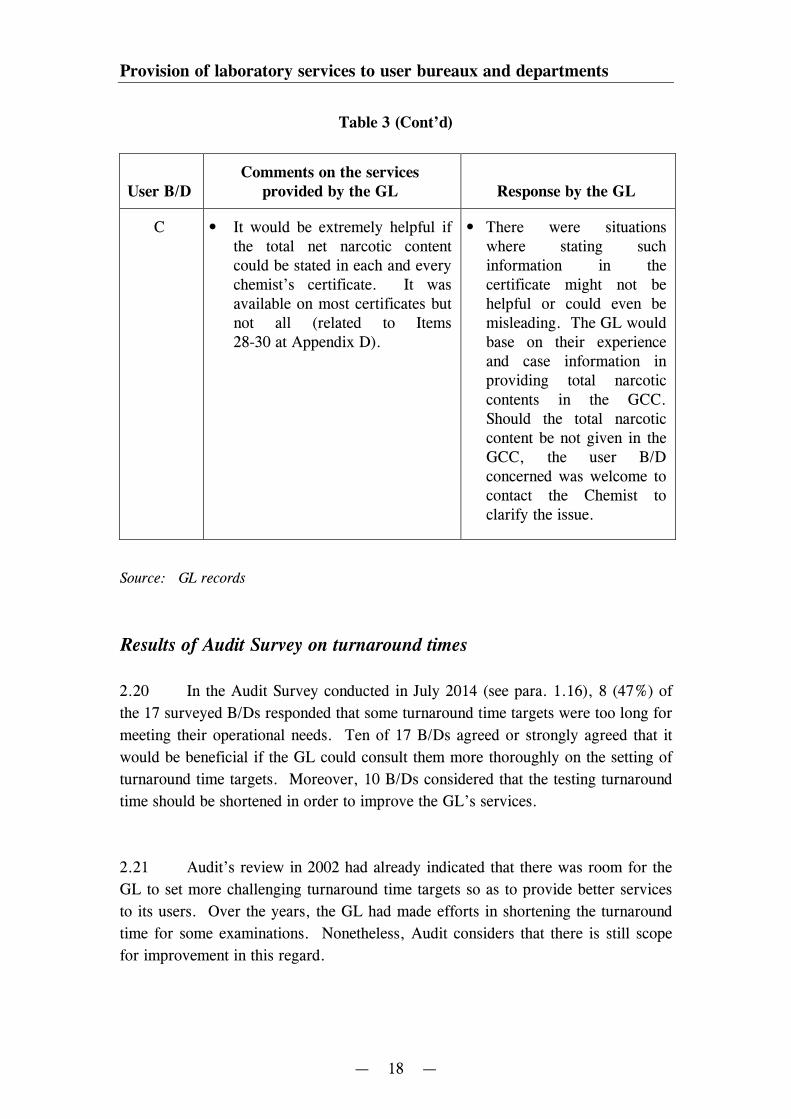
C • It would be extremely helpful ifthe total net narcotic contentcould be stated in each and everychemist’s certificate. It wasavailable on most certificates butnot all (related to Items28-30 at Appendix D).
• There were situationswhere stating suchinformation in thecertificate might not behelpful or could even bemisleading. The GL wouldbase on their experienceand case information inproviding total narcoticcontents in the GCC.Should the total narcoticcontent be not given in theGCC, the user B/Dconcerned was welcome tocontact the Chemist toclarify the issue.
Source: GL records
Results of Audit Survey on turnaround times
2.20 In the Audit Survey conducted in July 2014 (see para. 1.16), 8 (47%) of
the 17 surveyed B/Ds responded that some turnaround time targets were too long for
meeting their operational needs. Ten of 17 B/Ds agreed or strongly agreed that it
would be beneficial if the GL could consult them more thoroughly on the setting of
turnaround time targets. Moreover, 10 B/Ds considered that the testing turnaround
time should be shortened in order to improve the GL’s services.
2.21 Audit’s review in 2002 had already indicated that there was room for the
GL to set more challenging turnaround time targets so as to provide better services
to its users. Over the years, the GL had made efforts in shortening the turnaround
time for some examinations. Nonetheless, Audit considers that there is still scope
for improvement in this regard.
Provision of laboratory services to user bureaux and departments
— 19 —
Audit recommendations
2.22 Audit has recommended that the Government Chemist should:
(a) critically review the GL’s compilation of performance information on
turnaround times reported in the COR to ensure that it is clearly and
fairly presented (e.g. disclosing the range of turnaround times of the
sub-categories actually used to measure the compliance rates);
(b) establish management controls over the creation of sub-categories and
their target turnaround times in the computer systems;
(c) fix the system bugs (see para. 2.17(c)) and enhance procedures for
validating data input to ensure data accuracy and enable efficient
generation of management information;
(d) enhance the SIMS and the ESIMS in order to provide more readily
comprehensive management information for the GL; and
(e) continue with the GL’s efforts to shorten the target turnaround times
of its services so as to help user B/Ds better meet their operational
needs.
Response from the Administration
2.23 The Government Chemist generally agrees with the audit
recommendations. He has said that the GL will:
(a) review the compilation of performance information;
(b) enhance the computer and information management systems to facilitate
management control and the generation of management information; and
(c) continue the efforts to improve the target turnaround times of its services
and/or the percentages of work meeting these targets.
Provision of laboratory services to user bureaux and departments
— 20 —
Quality assurance
2.24 The GL has adopted the ISO/IEC 17025 (the International Standard —
Note 2) quality system and acquired ISO 17025 accreditation under the Hong Kong
Laboratory Accreditation Scheme (HOKLAS — Note 3) operated by the Hong Kong
Accreditation Service (HKAS).
2.25 According to the International Standard:
(a) the laboratory shall establish, implement and maintain a management
system appropriate to the scope of its activities. The laboratory shall
document its policies, systems, programmes, procedures and instructions
to the extent necessary to assure the quality of the test and/or calibration
results. The system’s documentation shall be communicated to,
understood by, available to, and implemented by the appropriate
personnel; and
(b) in accordance with a predetermined schedule and procedure, the
laboratory’s top management shall periodically conduct a review of the
laboratory’s management system and testing and/or calibration activities
to ensure their continuing suitability and effectiveness, and to introduce
Note 2: This International Standard, jointly published by International Organisation forStandardisation (ISO) and International Electrotechnical Commission (IEC),specifies the general requirements for the competence to carry out tests and/orcalibrations, including sampling. It covers testing and calibration performedusing standard methods, non-standard methods, and laboratory developedmethods. This International Standard is applicable to all organisationsperforming tests and/or calibrations. It is also applicable to all laboratoriesregardless of the number of personnel or the extent of the scope of testing and/orcalibration activities.
Note 3: The HOKLAS is an accreditation scheme operated by the Hong KongAccreditation Service. The scheme is open to voluntary participation from anyHong Kong laboratory, proficiency testing provider, and reference materialproducer that performs objective testing and calibration, provides proficiencytests, produces reference material falling within the scope of the scheme, andmeets the HOKLAS criteria of competence.
Provision of laboratory services to user bureaux and departments
— 21 —
necessary changes or improvements. Findings from management reviews
and the actions that arise from them shall be recorded. The management
shall ensure that those actions are carried out within an appropriate and
agreed timescale.
2.26 Under its quality policy, the GL is committed to achieving the goal of
valid analytical measurements and quality forensic examination service that is
impartial and accurate. The GL shall provide user B/Ds at all times with a service
complying with recognised standards of practice. A quality system in line with
ISO 17025 has been implemented in the GL to achieve its management objectives.
2.27 The Divisional management system implemented in the AASD and the
FSD shall be reviewed separately once a year for its effectiveness in achieving
Divisional management objectives and for identifying any need for improvement due
to changing external circumstances. This shall be done through the use of the
quality policy, quality objectives, audit results, proficiency testing results, client
feedback, corrective and preventive action, and management review.
2.28 For the above purpose, Divisional Management Review Meetings chaired
by Division Heads shall be convened each year. Notes of meeting shall be prepared
and maintained by the Divisional Quality Assurance (QA) Managers. The following
shall be specified for any action arising from the meeting:
(a) the nature and details of the action to be taken;
(b) the responsible action officer; and
(c) the scheduled implementation date.
2.29 The Divisional QA Managers are responsible for the follow-up
verification of the implementation and effectiveness of the proposed actions. The
findings of the follow-up verifications shall be recorded by the Divisional QA
Managers and reported to the responsible Division Heads.
Provision of laboratory services to user bureaux and departments
— 22 —
2.30 To evaluate the effectiveness of the quality system implemented by the
GL in achieving its quality objectives, Audit examined the Management Review
Reports of both the AASD and the FSD for the past three years. Audit noted that
the established quality systems of the GL were generally operating satisfactorily.
However, Audit also noted some areas where improvements could be made. Details
are given in paragraphs 2.31 to 2.37.
Internal quality audit
2.31 Generally in line with the International Standard, the GL conducts
Divisional internal quality audit of the Section’s activities annually to verify that its
operations comply with the requirements of the Laboratory’s quality documents
(Note 4), the Security Manual, the Safety Manual, and the accreditation criteria set
out in the HOKLAS operated by the HKAS. The Divisional quality audit comprises
on-site inspections and reviews of the operation of each Section. The internal
quality audit findings are categorised as non-conformities (NCs — Note 5) and areas
worth improvement (AWIs — Note 6). A summary report of the annual quality
audit will be compiled and submitted by the Divisional QA Managers to Division
Heads for endorsement and necessary actions.
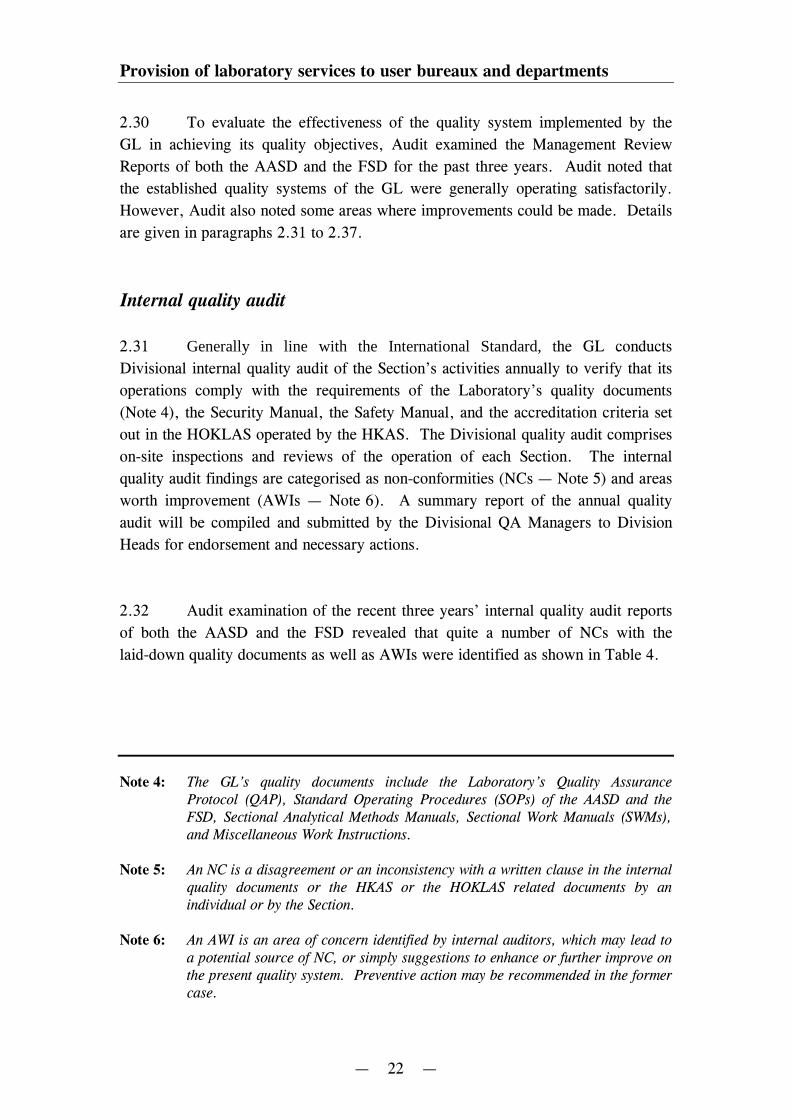
2.32 Audit examination of the recent three years’ internal quality audit reports
of both the AASD and the FSD revealed that quite a number of NCs with the
laid-down quality documents as well as AWIs were identified as shown in Table 4.
Note 4: The GL’s quality documents include the Laboratory’s Quality AssuranceProtocol (QAP), Standard Operating Procedures (SOPs) of the AASD and theFSD, Sectional Analytical Methods Manuals, Sectional Work Manuals (SWMs),and Miscellaneous Work Instructions.
Note 5: An NC is a disagreement or an inconsistency with a written clause in the internalquality documents or the HKAS or the HOKLAS related documents by anindividual or by the Section.
Note 6: An AWI is an area of concern identified by internal auditors, which may lead toa potential source of NC, or simply suggestions to enhance or further improve onthe present quality system. Preventive action may be recommended in the formercase.
Provision of laboratory services to user bureaux and departments
— 23 —
Table 4
Results of internal quality audits
(2011 to 2013)
2011 (Note) 2012 (Note) 2013 (Note)
AASD FSD AASD FSD AASD FSD
Number of AWI/NC
AWI 6 46 22 33 19 26
NC 0 16 0 30 0 16
Total 6 62 22 63 19 42
Source: Audit analysis of GL records
Note: The internal quality audits of the AASD and the FSD have different audit periods.The former covers the preceding financial year and the latter covers the precedingcalendar year.
Root cause analysis
2.33 Different Divisional practices. Corrective actions shall be taken to
rectify any identified non-conforming work or departures from the documented
quality systems. The corrective actions taken shall include the necessary
investigations to reveal the root cause of the NC. However, there is no similar root
cause analysis requirements in GL’s quality manuals in handling identified AWIs.
As AWIs are potential sources of NCs, Audit considers it worthwhile for the GL to
set down root cause analysis requirements in the GL’s quality manuals in handling
identified AWIs. In practice, the GL had conducted root cause analysis on both
AWIs and NCs identified. However, Audit noted that the FSD had reported such
root cause analysis in the summary report of the annual quality audit and submitted
to Division Heads for endorsement and necessary actions (see para. 2.31), while the
AASD had not.
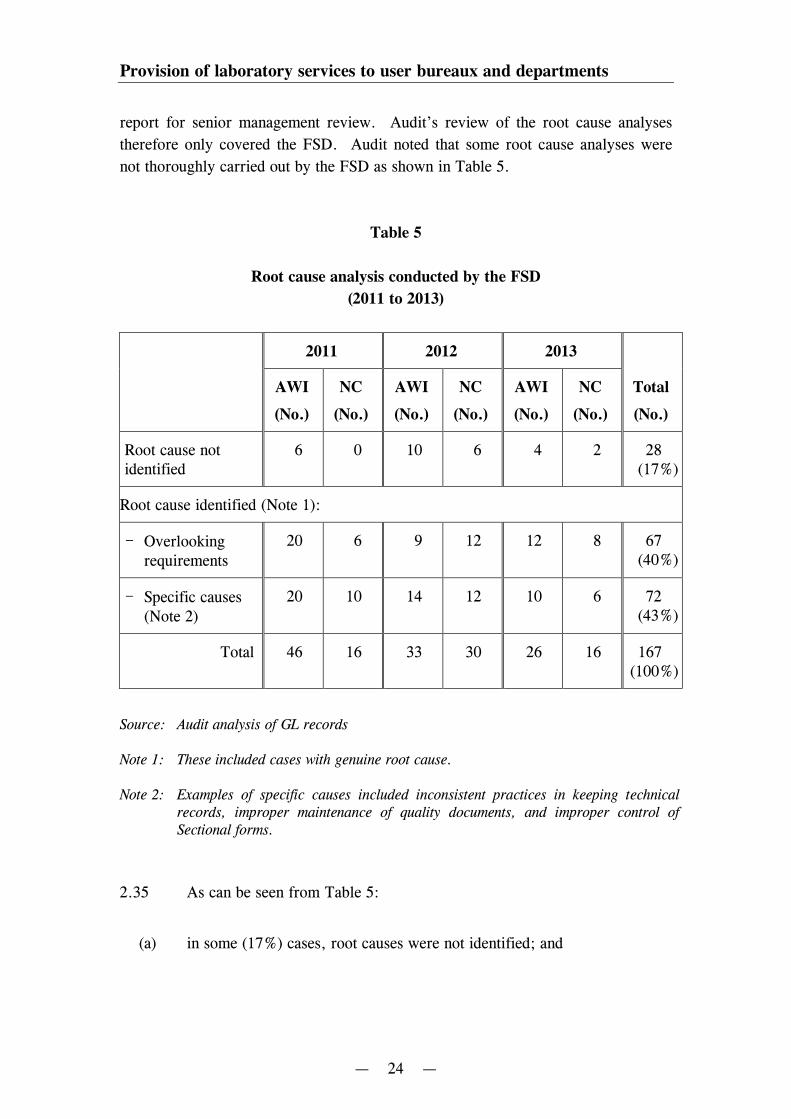
2.34 Root cause analysis of some NCs not thoroughly conducted. As shown
in Table 4, the AASD had not identified any NCs in the past three years and it was
not its practice to report a root cause analysis on identified AWIs in the summary
Provision of laboratory services to user bureaux and departments
— 24 —
report for senior management review. Audit’s review of the root cause analyses
therefore only covered the FSD. Audit noted that some root cause analyses were
not thoroughly carried out by the FSD as shown in Table 5.
Table 5
Root cause analysis conducted by the FSD
(2011 to 2013)
2011 2012 2013
AWI
(No.)
NC
(No.)
AWI
(No.)
NC
(No.)
AWI
(No.)
NC
(No.)
Total
(No.)
Root cause notidentified
6 0 10 6 4 2 28(17%)
Root cause identified (Note 1):
- Overlookingrequirements
20 6 9 12 12 8 67(40%)
- Specific causes(Note 2)
20 10 14 12 10 6 72(43%)
Total 46 16 33 30 26 16 167(100%)
Source: Audit analysis of GL records
Note 1: These included cases with genuine root cause.
Note 2: Examples of specific causes included inconsistent practices in keeping technicalrecords, improper maintenance of quality documents, and improper control ofSectional forms.
2.35 As can be seen from Table 5:
(a) in some (17%) cases, root causes were not identified; and
Provision of laboratory services to user bureaux and departments
— 25 —
(b) a considerable proportion (40%) of the inadequacies identified in the
quality internal audits were due to the overlooking of quality
requirements.
2.36 Audit considers that root cause analysis is an important part in the
corrective action procedure. Potential causes involve methods and procedures, staff
skills and training, consumables, or equipment and its calibration. The GL needs to
carry out the root cause analysis thoroughly for future improvement.
Common types of NCs
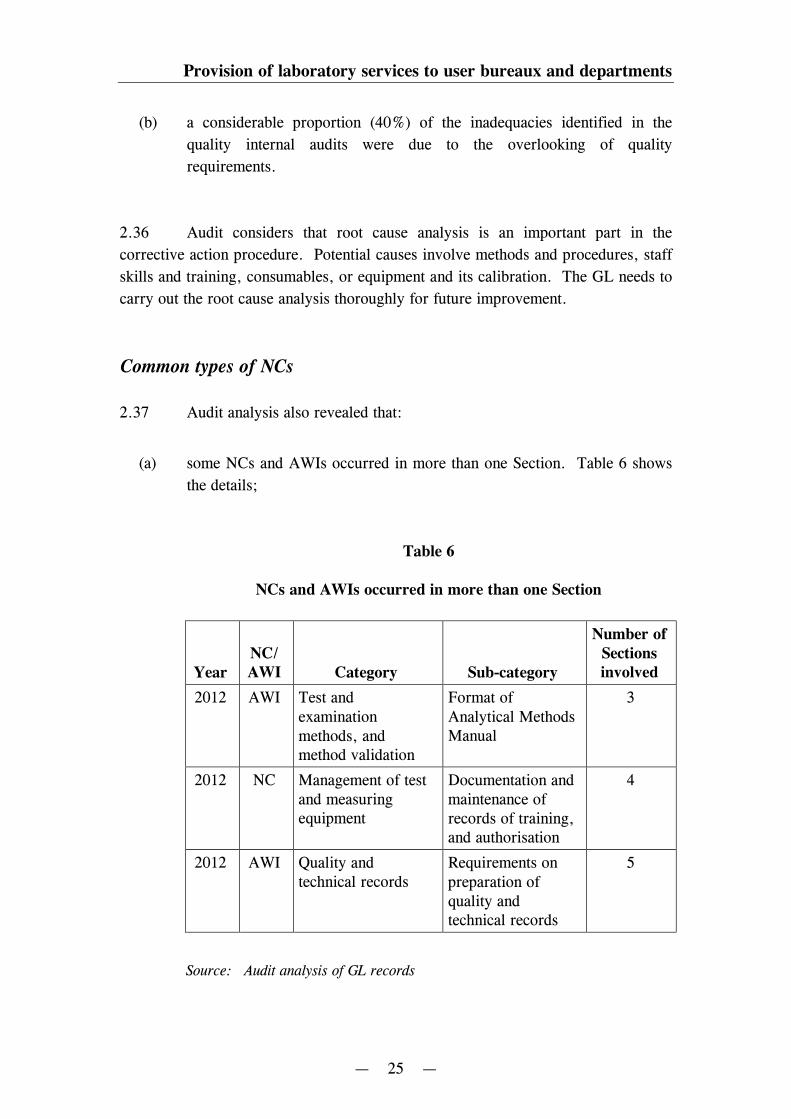
2.37 Audit analysis also revealed that:
(a) some NCs and AWIs occurred in more than one Section. Table 6 shows
the details;
Table 6
NCs and AWIs occurred in more than one Section
YearNC/AWI Category Sub-category
Number ofSectionsinvolved
2012 AWI Test andexaminationmethods, andmethod validation
Format ofAnalytical MethodsManual
3
2012 NC Management of testand measuringequipment
Documentation andmaintenance ofrecords of training,and authorisation
4
2012 AWI Quality andtechnical records
Requirements onpreparation ofquality andtechnical records
5
Source: Audit analysis of GL records
Provision of laboratory services to user bureaux and departments
— 26 —
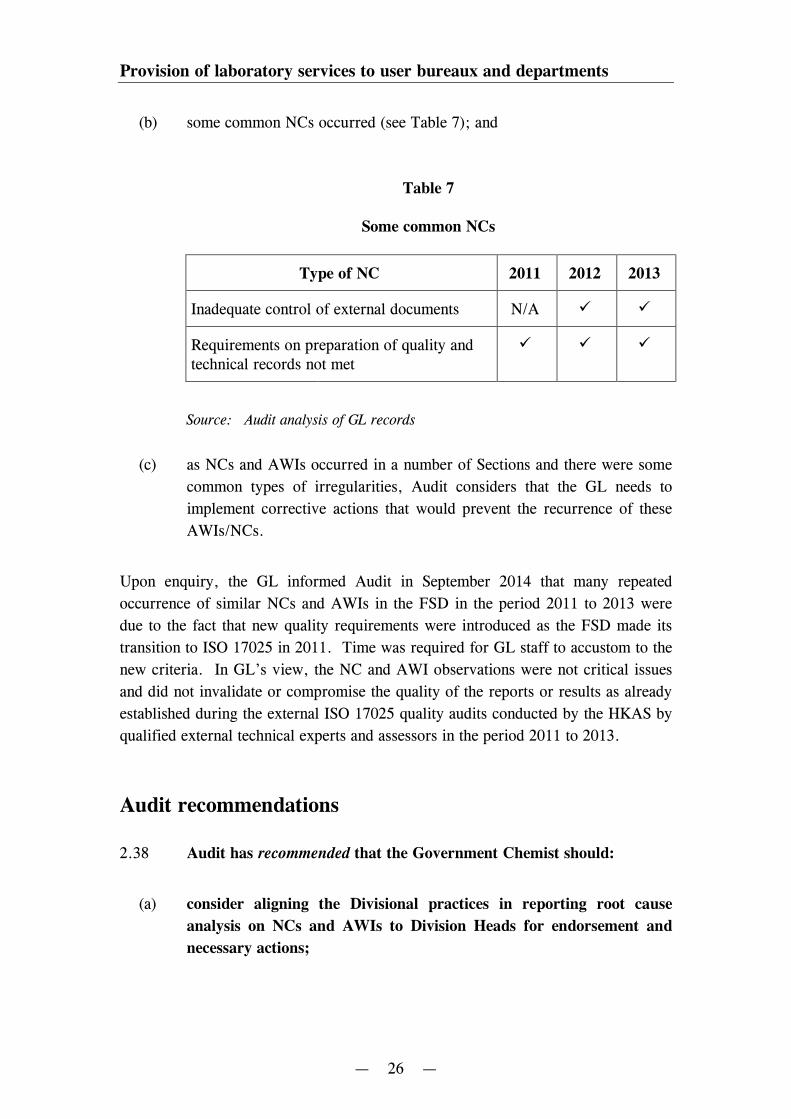
(b) some common NCs occurred (see Table 7); and
Table 7
Some common NCs
Type of NC 2011 2012 2013
Inadequate control of external documents N/A
Requirements on preparation of quality andtechnical records not met
Source: Audit analysis of GL records
(c) as NCs and AWIs occurred in a number of Sections and there were some
common types of irregularities, Audit considers that the GL needs to
implement corrective actions that would prevent the recurrence of these
AWIs/NCs.
Upon enquiry, the GL informed Audit in September 2014 that many repeated
occurrence of similar NCs and AWIs in the FSD in the period 2011 to 2013 were
due to the fact that new quality requirements were introduced as the FSD made its
transition to ISO 17025 in 2011. Time was required for GL staff to accustom to the
new criteria. In GL’s view, the NC and AWI observations were not critical issues
and did not invalidate or compromise the quality of the reports or results as already
established during the external ISO 17025 quality audits conducted by the HKAS by
qualified external technical experts and assessors in the period 2011 to 2013.
Audit recommendations
2.38 Audit has recommended that the Government Chemist should:
(a) consider aligning the Divisional practices in reporting root cause
analysis on NCs and AWIs to Division Heads for endorsement and
necessary actions;
Provision of laboratory services to user bureaux and departments
— 27 —
(b) take measures to ensure that root cause analyses are thoroughly
conducted and the results are documented, so as to identify necessary
corrective actions to address the risks relating to the identified NCs
and AWIs; and
(c) step up efforts to implement effective corrective actions to tackle those
cases of common types of irregularities of AWIs/NCs.
Response from the Administration
2.39 The Government Chemist agrees with the audit recommendations. He has
said that measures were in place to ensure that root cause analyses were conducted
so as to identify necessary corrective or preventive actions to address the identified
NCs and AWIs.
Coordination with user bureaux and departments
2.40 The GL provides a wide range of laboratory tests on samples from
various B/Ds. For the purposes of maintaining the GL’s work performance, good
communication is required for discussion with user B/Ds on matters such as
working relationships, analytical requirements, testing arrangements and
procedures, resource constraints, etc.
2.41 The GL holds periodic (annually or quarterly) Senior Management
Meetings (SMMs) with major user B/Ds. According to the GL, its staff would
sometimes directly discuss with the user B/Ds’ senior management for important
issues. There would also be frequent liaisons and discussions at Section Head or
Chemist level.
Memorandum of Understanding
2.42 To promote effective coordination and facilitate regular consultations on
policy issues and matters of common interests, the GL signed a Memorandum of
Understanding (MOU) with the HKPF in 2000. Subsequent to the 2002 Audit
Review, another MOU was signed in 2003 with the C&ED to enhance cooperation.
Provision of laboratory services to user bureaux and departments
— 28 —
According to the MOU with the C&ED, the GL and the C&ED shall, among
others:
(a) agree on the scope, capacity, and levels of services to enable effective
planning of the resources for the provision of services;
(b) agree on the performance measures and standards to ensure the targets are
relevant and the needs of the C&ED are addressed;
(c) regularly review the scope of services and the associated demand for
services to facilitate better planning for use of resources; and
(d) review the terms of the MOU at a two-year interval.
SMMs
2.43 Audit noted that the terms of the MOU with the C&ED were
comparatively more comprehensive than those of the HKPF. In the 2013 SMM
with the C&ED, key service achievements of the 2012 testing were tabulated for
review and key service requirements for 2013 to 2015 were projected for mutual
agreement. During the SMM, the C&ED enquired about the test services they
needed but were not provided by the GL so that it could make a better sample
submission plan to the GL as well as the outsourcing arrangements with private
laboratories. The C&ED also opined that outsourcing was not the ultimate
alternative as test services provided directly by the GL would have the unique
advantages of building up information databank and expertise useful for the
continuity and improvement measures to support long-term operations.
2.44 For other user B/Ds, the testing targets were mainly based on the pledge
in the COR and had been conventionally adopted. According to the GL, the COR
targets and the details of testing services including key service requirements would
be reviewed and discussed during meetings when necessary. When there was no
significant change in the overall testing requirements, the meetings would then focus
more on the new service requirements and specific test types/parameters. The user
B/Ds may be updated on the progress of service provision if necessary.
Provision of laboratory services to user bureaux and departments
— 29 —
Results of Audit Survey on MOUs with the GL
2.45 In the Audit Survey conducted in July 2014 (see para. 1.16), the C&ED
and the HKPF expressed the view that the MOU was useful for the GL to
understand their needs regarding the services provided and there was a need to
review the MOU on a regular basis. The HKPF also agreed that there was a need
to further amplify the MOU.
2.46 Of the 15 surveyed B/Ds that have not signed MOUs with the GL,
4 (27%) B/Ds agreed that it would better serve their operational needs if MOUs
were signed with the GL. However, 4 (27%) of the 15 B/Ds considered that there
would be difficulties in working out a mutually agreed MOU with the GL.
Reviewing the service requirements of user B/Ds
2.47 The significant advances in technology in recent years coupled with the
introduction of new government policies and regulations involving scientific
considerations, the launching of new materials and products in the local market as
well as the sophistication of criminal activities have contributed to significant
changes in the work patterns of, and methodology employed at the GL. This has
led not only to a broader coverage in scope of service provision, a higher degree of
specialisation among the professional staff, but also to the installation of a powerful
array of modern scientific instruments. Therefore, the GL needs to closely liaise
with user B/Ds for planning the service requirements to suit the changing
circumstances. In this regard, the Audit Survey showed that some user B/Ds
considered that the signing of MOUs with the GL would better serve their
operational needs.
2.48 Apart from the signing of MOUs, the GL may also model on the SMM
arrangement with the C&ED to hold meetings with the senior management of other
user B/Ds. At these meetings, a more comprehensive review of the key service
achievements can be conducted to identify difficulties in the existing testing services
(e.g. the testing samples, the collection method, testing results, etc.). Such
meetings also provide a good opportunity for reviewing effectiveness of the newly
introduced services (e.g. hair drug tests).
Provision of laboratory services to user bureaux and departments
— 30 —
Need to review and amplify the MOUs
2.49 Audit noted that, subsequent to the 2002 Audit Review, the GL discussed
signing an MOU with a number of user B/Ds in July 2002, October 2002, August
2003 and May 2004 respectively. However, at that time, they did not consider that
there was a need to sign such an MOU, but would keep in view the need to do so.
For the existing MOUs with the HKPF and C&ED, they had remained unchanged
since they were signed in 2000 and 2003 respectively. As far as could be
ascertained, there had not been any comprehensive review of the MOU of the
HKPF.
2.50 The 2002 Audit Review recommended that the MOU should be amplified
in specifying the key service requirements (e.g. objectives, levels and capacity of
services required, method of operation, performance measures and standards, etc.).
The amplification could refine and predict the user B/Ds’ service needs, and enable
a more accurate workload forecast. The GL should continue to liaise with the user
B/Ds concerned for developing an amplified version of the existing MOU.
GL’s customer surveys
2.51 Audit examination of the GL’s customer surveys for the past three years
revealed that there were requests for the GL to provide more training, briefing and
sharing sessions on a regular basis from some user B/Ds. Table 8 shows some
examples of such requests.
Provision of laboratory services to user bureaux and departments
— 31 —
Table 8
Examples of requests from user B/Ds formore training/briefings/sharing sessions by the GL
User B/D
Comments on the training/briefings/sharing sessions
provided/arranged by the GL Response by the GL
X • It suggested that theFSD could providetraining/briefings to frontlineofficers with a view toallowing them to have moreunderstanding of the work ofthe FSD.
• Training could be organisedon request, and interestedparties might contact the GLfor further arrangement.
Y • It disagreed that the training/briefings by the FSD of lessthan 10 hours per year wouldbe sufficient.
• Close liaison would be madewith the training unit of theuser B/D concerned inarranging more effectivecustom-made training totheir officers.
Z • Sharing session would beuseful for mutualunderstanding of eachdepartment’s work and hencehoped that such arrangementwould be continued.
• GL supported holding suchsharing sessions on anannual basis to strengthenmutual communication.
Source: GL records
Results of Audit Survey on services/training provided by the GL
2.52 In the Audit Survey conducted in July 2014, 7 (41%) of the 17 surveyed
B/Ds would like to see the GL provide more types of testing services. Four (24%)
B/Ds considered that the GL could provide additional number of tests for each type
of service.
Provision of laboratory services to user bureaux and departments
— 32 —
2.53 A majority (10 or 59%) of the surveyed B/Ds agreed or strongly agreed
that training provided by the GL enabled their staff to understand the laboratory
services provided. Nine (53%) B/Ds agreed or strongly agreed that more training
provided by the GL could better meet their operational needs.
2.54 In Audit’s view, the GL needs to consider expanding the scope of their
laboratory services and providing more testing for its user B/Ds. The GL also
needs to consider providing more training to user B/Ds.
Audit recommendations
2.55 Audit has recommended that the Government Chemist should:
(a) strengthen the coordination with the user B/Ds’ senior management
by conducting in the GL’s periodic meetings with them a more
comprehensive review of the laboratory services provided, including:
(i) providing more information such as key service achievements
and the actual turnaround testing times; and
(ii) projecting and agreeing on the key service requirements and
performance targets;
(b) consider amplifying the existing MOUs by including more details such
as the scope of services, agreed service levels, performance
measurements and monitoring, liaison and coordination, etc.;
(c) continue to liaise with user B/Ds for signing an amplified version of
MOU with the GL in order to better define and predict the service
needs and facilitate effective planning of the use of resources;
(d) consider the need to expand the scope of laboratory services and
provide more testing for user B/Ds; and
(e) consider providing more training to user B/Ds.
Provision of laboratory services to user bureaux and departments
— 33 —
Response from the Administration
2.56 The Government Chemist agrees with the audit recommendations.
Handling emergency incidents
2.57 Emergency incidents refer to those unpredictable events which are caused
by unforeseeable factors, resulting in serious damage to or concern of the
community. There were quite a number of emergency incidents in recent years,
including food incidents such as the radiation contamination of food products
imported from Japan following the Fukushima nuclear accident in March 2011, and
the plasticiser contamination of a wide variety of Taiwanese food and drinks in
June 2011. More recently, in 2014, the gutter oil scandal also posed food safety
threat to the general public. The GL was required to render testing and advisory
services to support various B/Ds in dealing with these incidents. In general, these
emergency incidents arouse great public concerns and time is of the essence in
taking effective measures to handle these cases. As the nature of an emergency
incident is very often unprecedented, there is no established methodology for
providing the laboratory testing services required. Such emergency incidents pose
great challenges to the GL in providing the urgent laboratory services necessary to
support the handling of the cases.
2.58 The Government Chemist issued a document entitled “Contingency Plan
for Major Crises”. The scale of crises is classified into three levels, which varies
with the importance and scale of the crises. Upon activation of this Plan, the
Departmental Emergency Coordinating Centre (DECC) will be set up and activated
automatically for coordinating the work in times of crisis. The DECC consists of an
Emergency Director, Operation Director, Human Resource Coordinator and
Physical Resource Coordinator. The composition of the DECC varies at different
levels of crises. Operation procedures are also included in the contingency plan.
Provision of laboratory services to user bureaux and departments
— 34 —
2.59 In July 2014, Audit requested the GL to provide for examination the case
files containing all relevant documents and correspondence relating to food incidents
(e.g. incidents relating to oil fish and radiation contamination of food products).
However, no such files were available for audit examination. Upon enquiries, GL
staff informed Audit in August 2014 that they did not have a separate file to keep all
documents relating to an emergency incident. Audit examined the relevant
correspondence files, but could not find any correspondence relating to the
emergency incidents.
2.60 Audit noted that the documents relating to an emergency incident were not
organised in a separate subject file. In the circumstances, when there are staff
changes, it would be difficult for new staff to learn from the past experience. When
similar crises occur in the future, the GL’s staff might have to work from scratch.
The emergency incidents may occur from time to time unpredictably. Prompt
actions need to be taken by the GL in order to provide support to various B/Ds to
tackle the incidents. Audit considers it important for the GL to learn from the past
experiences and the precedent cases. The methodologies in collecting the necessary
evidence, methods to obtain the expertise from various fields, difficulties
encountered, and the lessons learnt and whether the categorisation and assignment of
the three levels of crisis had provided an adequate scaled response to each incident,
should be documented properly. This is conducive to the sharing of experience with
other staff (especially new staff) and strengthening the GL’s capability in handling
similar crises in future.
2.61 Upon enquiry, the GL informed Audit in September 2014 that there might
not be written communications between users and the GL on food incidents due to
the urgent nature of the request (verbal communications are preferred and more
direct in many food incidents). All test methods employed by the GL during the
incidents were properly validated. These methods together with the validation data
and the corresponding test records were documented according to the requirements
of the quality system and could be retrieved easily. On the other hand, the full set
of “Emergency Case Report” related to emergency services for dealing with
incidents involving hazardous chemicals had been maintained since 2001. The
reports could be viewed by all professional staff of the AASD. In the yearly
Emergency Respond Team Review Exercise, team members were reminded to study
the past case reports for reference and selected special cases would be discussed in
detail.
Provision of laboratory services to user bureaux and departments
— 35 —
Audit recommendation
2.62 Audit has recommended that the Government Chemist should ensure
that all relevant documents and correspondence relating to emergency incidents
(e.g. food incidents) are properly filed for future reference, so that the
experience in tackling such incidents can be shared with all staff concerned in
the GL.
Response from the Administration
2.63 The Government Chemist agrees with the audit recommendation. He has
said that the “Emergency Case Reports” related to emergency services for dealing
with incidents involving hazardous chemicals had been properly maintained.
Information about the testing services provided during food incidents, including all
testing records and method development and validation data, had also been properly
filed.
— 36 —
PART 3: OUTSOURCING OF LABORATORYSERVICES
3.1 This PART examines issues relating to the GL’s outsourcing of laboratory
services, focusing on the following areas:
(a) tender evaluation and contract administration (paras. 3.2 to 3.17);
(b) monitoring contractor performance (paras. 3.18 to 3.23);
(c) proficiency testing programmes (paras. 3.24 to 3.32); and
(d) post-implementation review of outsourcing (paras. 3.33 to 3.47).
Tender evaluation and contract administration
Outsourcing of food testing work
3.2 2002 Audit Review. In the 2002 Audit Review, Audit noted that the
demand for different kinds of analytical and investigative testing services was
increasing because of the growing public concern about the environment, food and
health. To meet the increasing demand and to further improve the GL performance,
Audit had recommended that the GL should explore the option of outsourcing
routine analytical testing services to accredited laboratories. The GL welcomed the
audit recommendation.
3.3 In 2007, the GL commissioned the Efficiency Unit (EU) to conduct a
study to identify outsourcing opportunities for laboratory services of the AASD.
The EU study team considered that the outsourcing allowed the AASD of the GL to
focus its resources on tackling priorities on policy and complicated testing services,
and enabled the private sector to take up those routine services. The study team
further proposed the outsourcing and development opportunities for the AASD. The
study team recommended that the AASD should outsource those services classified
as highly feasible for outsourcing in the first phase (e.g. testing on Chinese
medicines and wastewater monitoring) and consider outsourcing other services in
the second phase.
Outsourcing of laboratory services
— 37 —
3.4 The EU also sought Department of Justice’s advice regarding the legal
implications/limitations on outsourcing routine testing of the AASD’s services. The
legal advice was that routine testing not involving law enforcement was not subject
to any legislative restrictions.
3.5 Since 2008, the GL has outsourced some of its regular food surveillance
testing work (which will not normally result in any legal actions) to local accredited
laboratories. The scope covered the testing of food preservatives, heavy metals,
additives, pesticide residues, and veterinary drug residues. Since the
commencement of outsourcing in 2008 and up to March 2014, the GL had entered
into 83 outsourcing contracts with a total contract value of $24.12 million. The
scale of outsourcing activities had increased from 22,000 food tests (involving
2,900 samples) in 2008-09 to around 120,000 food tests (about 13,400 samples) in
2013-14. It accounted for about 60% of the AASD’s routine food testing work (or
17% of all the AASD’s testing work) in 2013-14. Figure 4 shows the trend of the
GL’s outsourcing activities. Although the number of tests continued to increase, the
total contract sums for outsourcing dropped significantly from $6.49 million in
2010-11 to $2.63 million in 2013-14. This is possibly the result of competitive
tendering.
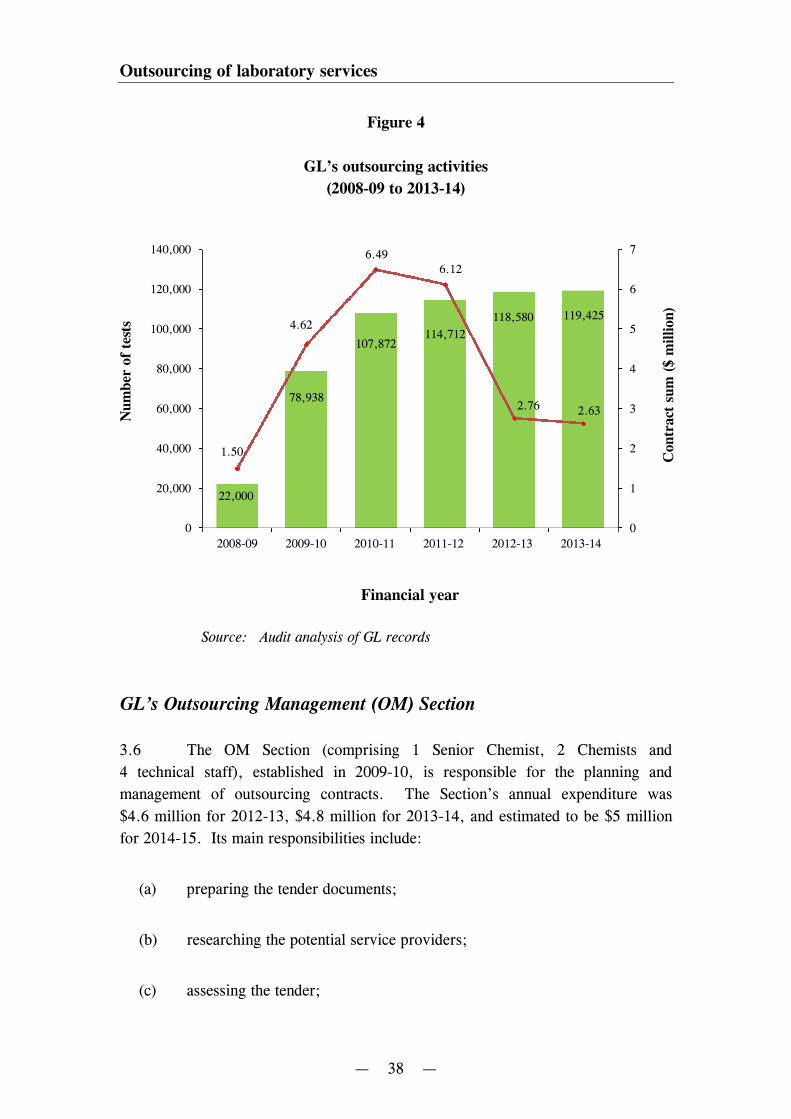
Outsourcing of laboratory services
— 38 —
Figure 4
GL’s outsourcing activities
(2008-09 to 2013-14)
22,000
78,938
107,872114,712
118,580 119,425
1.50
4.62
6.496.12
2.76 2.63
0
1
2
3
4
5
6
7
0
20,000
40,000
60,000
80,000
100,000
120,000
140,000
2008-09 2009-10 2010-11 2011-12 2012-13 2013-14
Source: Audit analysis of GL records
GL’s Outsourcing Management (OM) Section
3.6 The OM Section (comprising 1 Senior Chemist, 2 Chemists and
4 technical staff), established in 2009-10, is responsible for the planning and
management of outsourcing contracts. The Section’s annual expenditure was
$4.6 million for 2012-13, $4.8 million for 2013-14, and estimated to be $5 million
for 2014-15. Its main responsibilities include:
(a) preparing the tender documents;
(b) researching the potential service providers;
(c) assessing the tender;
Num
ber
of
test
s
Contr
act
sum
($m
illion)
Financial year
Outsourcing of laboratory services
— 39 —
(d) preparing check samples;
(e) conducting on-site inspections; and
(f) reviewing the test reports of the contract laboratories.
Tender evaluation and contract administration
3.7 The GL tender procedures for the outsourcing of services are as follows:
(a) Determination of outsourcing contracts. Each year (normally in
November), the Centre for Food Safety of the Food and Environmental
Hygiene Department (FEHD) and the GL work out a food surveillance
plan and agree on the number of chemical analyses to be conducted for
the coming year. According to the test types and timeframe, the GL
comes up with an outsourcing plan for the coming year;
(b) Invitation of tenders. Only laboratories having accreditation from the
HKAS are invited for tenders. The OM Section from time to time
maintains a list of potential service providers. As at July 2014, the list
compiled contained 11 local private laboratories. The Supplies Section of
the GL invites the contractors in the list to tender;
(c) Two-envelope approach. The GL adopts a two-envelope approach to
tendering. A tenderer has to submit his technical offer and price offer in
separate envelopes;
(d) Tender evaluation. A tender assessment team is formed to evaluate the
tenders received. The team will first conduct a technical assessment and
then a price assessment. Tender evaluation is conducted in accordance
with a pre-approved standard marking scheme; and
(e) Submission of tender report. The tender assessment team will submit a
tender evaluation report to the Assistant Government Chemist of the
AASD and seek approval for awarding the contract to the selected
tenderer.
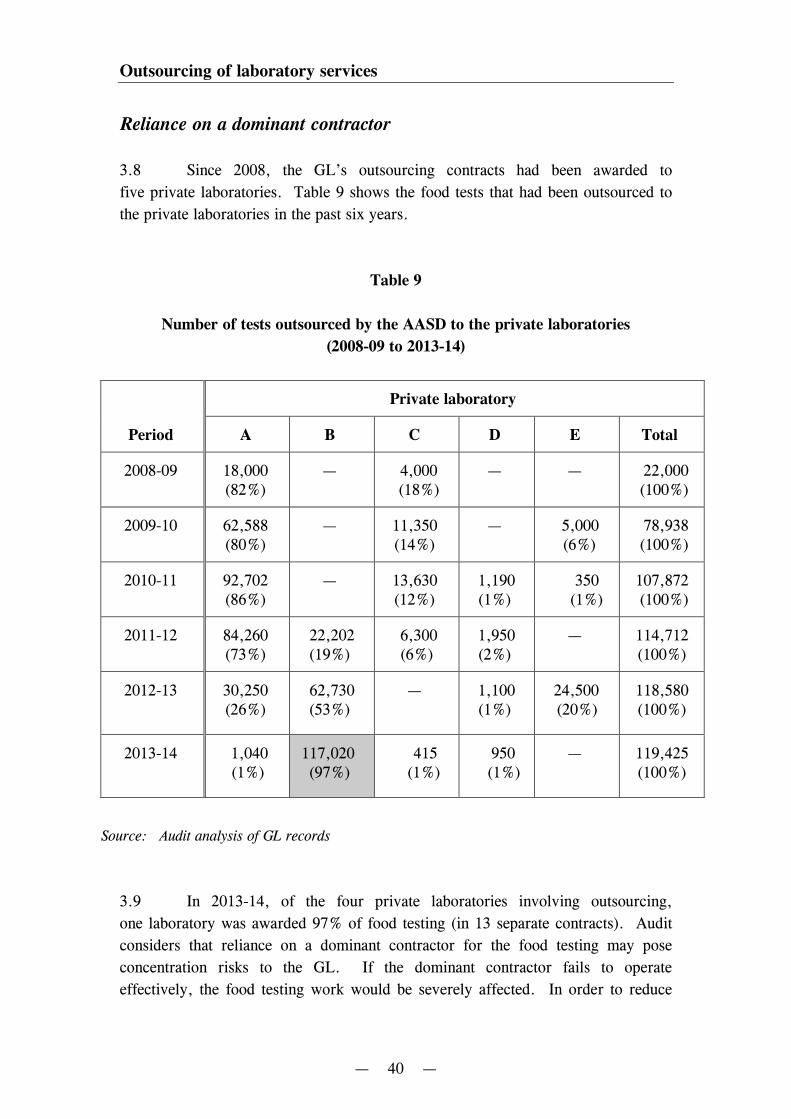
Outsourcing of laboratory services
— 40 —
Reliance on a dominant contractor
3.8 Since 2008, the GL’s outsourcing contracts had been awarded to
five private laboratories. Table 9 shows the food tests that had been outsourced to
the private laboratories in the past six years.
Table 9
Number of tests outsourced by the AASD to the private laboratories
(2008-09 to 2013-14)
Period
Private laboratory
A B C D E Total
2008-09 18,000(82%)
— 4,000(18%)
— — 22,000(100%)
2009-10 62,588(80%)
— 11,350(14%)
— 5,000(6%)
78,938(100%)
2010-11 92,702(86%)
— 13,630(12%)
1,190(1%)
350(1%)
107,872(100%)
2011-12 84,260(73%)
22,202(19%)
6,300(6%)
1,950(2%)
— 114,712(100%)
2012-13 30,250(26%)
62,730(53%)
— 1,100(1%)
24,500(20%)
118,580(100%)
2013-14 1,040(1%)
117,020(97%)
415(1%)
950(1%)
— 119,425(100%)
Source: Audit analysis of GL records
3.9 In 2013-14, of the four private laboratories involving outsourcing,
one laboratory was awarded 97% of food testing (in 13 separate contracts). Audit
considers that reliance on a dominant contractor for the food testing may pose
concentration risks to the GL. If the dominant contractor fails to operate
effectively, the food testing work would be severely affected. In order to reduce
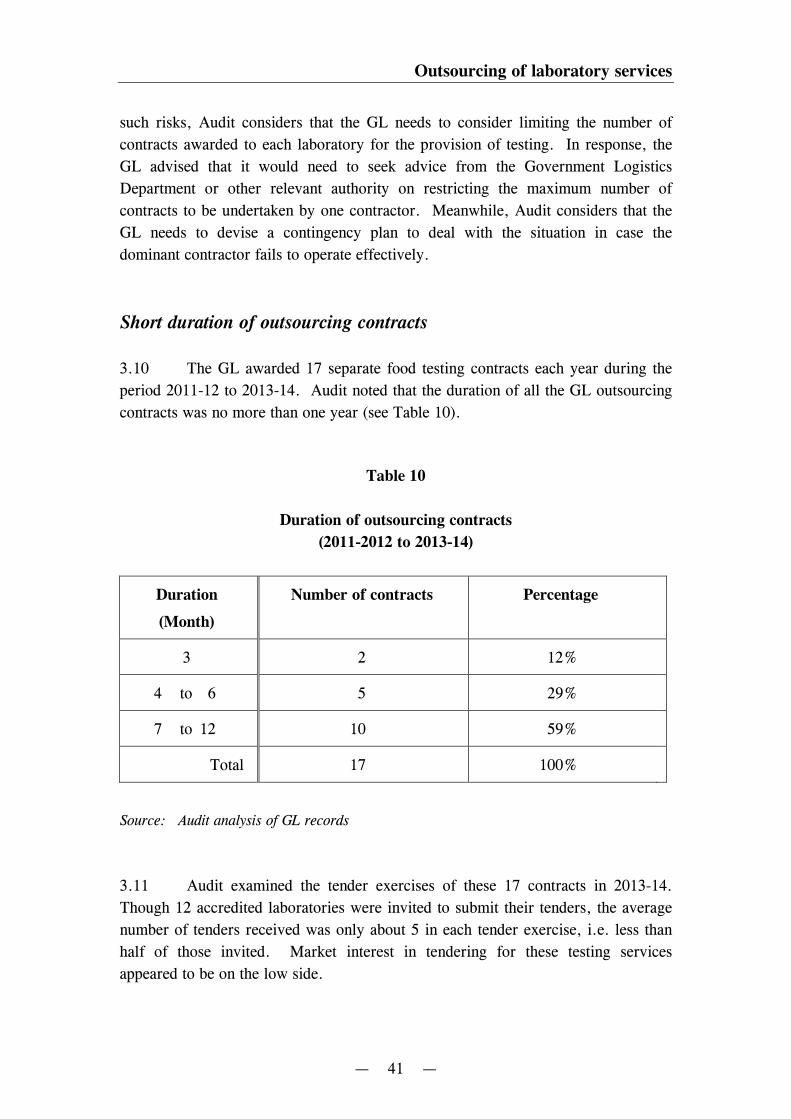
Outsourcing of laboratory services
— 41 —
such risks, Audit considers that the GL needs to consider limiting the number of
contracts awarded to each laboratory for the provision of testing. In response, the
GL advised that it would need to seek advice from the Government Logistics
Department or other relevant authority on restricting the maximum number of
contracts to be undertaken by one contractor. Meanwhile, Audit considers that the
GL needs to devise a contingency plan to deal with the situation in case the
dominant contractor fails to operate effectively.
Short duration of outsourcing contracts
3.10 The GL awarded 17 separate food testing contracts each year during the
period 2011-12 to 2013-14. Audit noted that the duration of all the GL outsourcing
contracts was no more than one year (see Table 10).
Table 10
Duration of outsourcing contracts
(2011-2012 to 2013-14)
Duration
(Month)
Number of contracts Percentage
3 2 12%
4 to 6 5 29%
7 to 12 10 59%
Total 17 100%
Source: Audit analysis of GL records
3.11 Audit examined the tender exercises of these 17 contracts in 2013-14.
Though 12 accredited laboratories were invited to submit their tenders, the average
number of tenders received was only about 5 in each tender exercise, i.e. less than
half of those invited. Market interest in tendering for these testing services
appeared to be on the low side.
Outsourcing of laboratory services
— 42 —
3.12 Preparation for tender submission is often time-consuming and costly.
This might be a reason for the general lack of market interest in tendering for the
GL’s outsourcing contracts, especially those which were of small contract sums and
short contract duration. The short-term contract arrangement also increased GL’s
administrative costs arising from frequent contract renewals.
3.13 According to the EU report “A General Guide to Outsourcing” in 2008,
“Departments should determine the optimum scope of outsourcing from the point of
view of both the department and the potential service providers. Surveys of
departments and service providers have identified the loss of economy, efficiency
and effectiveness in letting contracts that are too small and have short contract
duration.” Audit considers that the GL should assess the benefits of bundling
services and strike a balance between the benefits and risks involved in engaging
contractors. The arrangement of longer-term contracts may provide better incentive
for potential service providers to bid the GL’s outsourcing contracts. This will also
encourage the service providers to invest more in equipment, technology and
people, as overhead costs and return on investment can be spread over a longer time
period.
Tender evaluation
3.14 In assessing the tenders, the GL adopts the two-envelope approach —
technical assessment (accounting for 40% of the combined score) and price
assessment (accounting for 60% of the combined score). For the technical
assessment, the experience, number of customer complaints received, competence,
personnel, and analytical techniques and facilities of the potential laboratories are
taken into consideration.
3.15 Audit analysis of the turnaround time of testing services provided by the
outsourced contractors indicated that 6% of the test samples results for the years
2012-13 (762 of 12,848 samples) and 2013-14 (748 of 13,365 samples) were not
reported by the contractors to the GL in a timely manner. Warnings of
unsatisfactory performance were issued to two contractors in the past two years.
However, Audit noted that the past performance of laboratories (such as late
reporting of test results or warnings issued) had not been taken into account in
tender assessment. As the food testing results have public health implications,
timely reporting and quality of the test results are crucial contractual requirements.
Outsourcing of laboratory services
— 43 —
Audit considers that the GL should take due account of the past performance of
contractors when evaluating future tenders.
Audit recommendations
3.16 Audit has recommended that the Government Chemist should:
(a) consider the need to limit the number of contracts that each private
laboratory may be awarded for the provision of testing services so as
to reduce concentration risks;
(b) prepare a contingency plan to deal with the situation in case the
dominant contractor fails to operate effectively;
(c) take measures to increase market interest in the outsourcing contracts
(e.g. arranging longer-term contracts); and
(d) take due account of the contractors’ past performance when
evaluating future tenders.
Response from the Administration
3.17 The Government Chemist agrees with the audit recommendations.
Monitoring contractor performance
3.18 To safeguard the quality of outsourcing services, the OM Section
regularly reviews and monitors the performance of contractors on individual
contracts. Performance monitoring measures include:
(a) conducting on-site inspections of the contract laboratory;
(b) issuing quality check (QC) samples;
(c) reviewing the contractor’s test and quality records; and
Outsourcing of laboratory services
— 44 —
(d) checking other matters that affect the delivery of testing services.
On-site inspections
3.19 During each contract period, the Chemist-in-charge will conduct at least
one routine on-site inspection for auditing the relevant test and quality records, as
well as inspecting the operation of the contractor for assessing the contractor’s
technical competence and compliance with contract requirements. Follow-up
inspections (if required) will be conducted in cases where irregularities had been
found. After the inspection, the inspecting Chemist needs to prepare a report listing
significant observations of the inspection and submits it to the Senior Chemist for
information.
Arrangement of QC samples
3.20 For each contract period, the Chemist-in-charge arranges QC samples (at
least two QC samples for each contract) to the contractor for evaluating its
performance. According to the contract monitoring schedule of OM Section,
relevant controlled samples are planted in a batch of food samples which will be
collected by the private laboratories concerned for testing. The Chemist-in-charge
assesses the results submitted by the contractor, prepares a summary report and
submits it to the Senior Chemist for review.
3.21 Audit found that there was room for improvement in the GL’s monitoring
measures, as follows:
(a) Announced inspection conducted. In response to enquiries, GL staff
informed Audit in July 2014 that the on-site inspections were normally
announced one or two days in advance. However, carrying out
unannounced inspections might be needed if there is reason to doubt the
quality of the contractor’s laboratory services. For example, when a
laboratory has received a complaint about its testing activities which cast
doubt on the laboratory’s standards. Audit considers that the GL needs to
consider introducing unannounced on-site inspections to see if there is
room for improvement in sample storage conditions, handling of tests and
calibration items, equipment location and utilisation, etc.;
Outsourcing of laboratory services
— 45 —
(b) Inspection checklist not used. The GL formulated in 2011 a
comprehensive checklist as a guide for their inspections. The checklist
covers the management requirements (including organisation,
management system, document control, etc.), technical requirements
(personnel, accommodation and environmental conditions, test and
calibration methods, equipment, etc.), and contract requirements (services
specifications). The use of the checklist by different inspection teams
would help ensure completeness and consistency. However, Audit noted
that this checklist was not used by GL staff for facilitating the conduct of
inspections and documenting the inspection results; and
(c) Issuing of QC samples. Audit analysis indicated that for 2013-14, the
number of QC samples sent to contractor laboratories did not seem to be
correlated with the quantum of the food samples outsourced. For
example, in 2013-14, two QC samples each were included among the
1,350 food samples outsourced to one contractor laboratory, and among
the 260 food samples outsourced to another contractor laboratory. The
QC sample may be an inter-laboratory comparison test sample (such as
Food Analysis Performance Assessment Scheme (FAPAS) QC sample —
Note 7 ), spiked sample (Note 8 ), split sample (Note 9 ), etc. Audit
analysed the 77 QC sample reports of 2013-14, but found that the GL
used FAPAS in 69 (90%) QC samples. Audit noted that the FAPAS QC
sample is a blend test material which can easily be identified by the
contractors. Audit considers that the GL should use more varieties in its
QC samples to evaluate the contractors’ performance.
Note 7: FAPAS QC test materials are real food matrices with one or more properties thathave been established from the results of laboratories participating in aproficiency test and are used by laboratories as quality control materials.
Note 8: A spiked sample is a sample that has been added a known amount of analyte (aspike) by the GL. The spiked sample is analysed by a private laboratory. Acomparison is made between the laboratory’s and GL’s known results.
Note 9: A split sample is a sample that is divided into two subsamples. Both subsamplesare analysed by a private laboratory. The results are compared.
Outsourcing of laboratory services
— 46 —
Audit recommendations
3.22 Audit has recommended that the Government Chemist should:
(a) enhance the monitoring of contractor performance, for example by
conducting unannounced inspections to ensure that the contractors
comply with the terms of the contracts;
(b) remind the inspecting officers to use the comprehensive inspection
checklist to properly document the results for each inspection; and
(c) make better use of QC samples for evaluating contractor performance
(e.g. issuing QC samples to contractors with reference to the quantum
of the food samples outsourced, and making more use of other types
of QC samples such as spiked samples and split samples).
Response from the Administration
3.23 The Government Chemist agrees with the audit recommendations.
Proficiency testing programmes
3.24 In order to undertake the GL’s outsourcing contracts, private laboratories
must get the HKAS’s accreditation in the test parameters concerned, and maintain
the accreditation status throughout the contract period.
3.25 Accreditation is granted by the HKAS on a test-by-test basis. It will only
be granted to a laboratory in respect of a specific test after an expert team has
confirmed the laboratory’s competence in performing the test through an on-site
assessment. After accreditation is granted, the HKAS will continue to monitor the
performance of the laboratory through periodic on-site re-assessments, on-site
surveillance visits and proficiency testing (PT) programmes.
Outsourcing of laboratory services
— 47 —
3.26 A PT programme is an important tool used by laboratory accreditation
bodies to assess the competency of field laboratories. The GL, as an accredited PT
provider in Hong Kong, has organised PT programmes to provide opportunities for
participating laboratories to benchmark and improve their performance in specific
testing disciplines. Participation in PT programmes is one of the mandatory
requirements for laboratory accreditation. In each PT programme, the GL evaluates
the performance of the participating laboratories and issues performance reports to
them. Accreditation would be granted upon the satisfactory results of relevant PT
programme.
Need for diversification of the PT programmes
3.27 The GL has provided PT programmes to support the development of the
local testing industry. For the past five years (up to June 2014), the GL had
organised a total of 18 PT programmes, comprising 15 (83%) programmes on food
safety testing, 2 (11%) on environmental testing, and 1 (6%) on forensic science
testing. It can be seen that the scope of PT programmes mainly covered the food
safety testing category.
3.28 The GL has conducted annual surveys on the needs of the local testing
community. Audit examined the survey results for the period 2011 to 2013. Audit
found that other than the topic on food testing, the industry welcomed more PT
programmes for tests relating to phthalates in plastics, and analysis for air and
permanent gases. In order to assist the testing industry in building up the capability
and capacity to take up government’s outsourcing of laboratory testing of different
disciplines, the GL should consider organising more types of PT programmes in the
longer term.
Need to assess the effectiveness of the PT programmes
3.29 Though the GL organised PT programmes periodically, it did not conduct
customer surveys for all the programmes. For the past five years (up to June 2014),
of the 18 PT programmes organised, the GL conducted customer surveys for only
9 (50%) programmes. In order to measure the achievement of the PT programmes
towards their planned objectives, and assess the overall effectiveness of the PT
programmes to facilitate future planning, the GL needs to conduct formal evaluation
for all the PT programmes conducted so as to identify areas for improvement.
Outsourcing of laboratory services
— 48 —
Need to promote the PT programmes
3.30 When the GL launches a PT programme, invitations to join the
programme are made to local laboratories through the HKAS. Audit noted that
there were not many (ranging from 1 to 10) local laboratories participating in each
programme. To help enhance the capability of local laboratories, Audit considers
that the GL needs to step up efforts to promote the PT programmes (e.g. making all
PT programme information accessible to all interested laboratories).
Audit recommendations
3.31 Audit has recommended that the Government Chemist should:
(a) consider organising more types of PT programmes for different
testing disciplines in the longer term;
(b) conduct formal evaluation for all the PT programmes organised by
the GL so as to identify areas for improvement; and
(c) step up efforts to promote the PT programmes organised by the GL.
Response from the Administration
3.32 The Government Chemist agrees with the audit recommendations.
Post-implementation review of outsourcing
3.33 The introduction of outsourcing is to facilitate the GL to release its
resources to focus on new test method development, to cope with new testing work
arising from amendments of food legislation and perform other duties including
analytical tests for urgent food incidents.
3.34 In 2013-14, the GL’s outsourcing increased to about 120,000 tests
involving 13,400 samples, accounting for about 60% of its actual routine food
testing work and about 17% of all the AASD’s testing work.
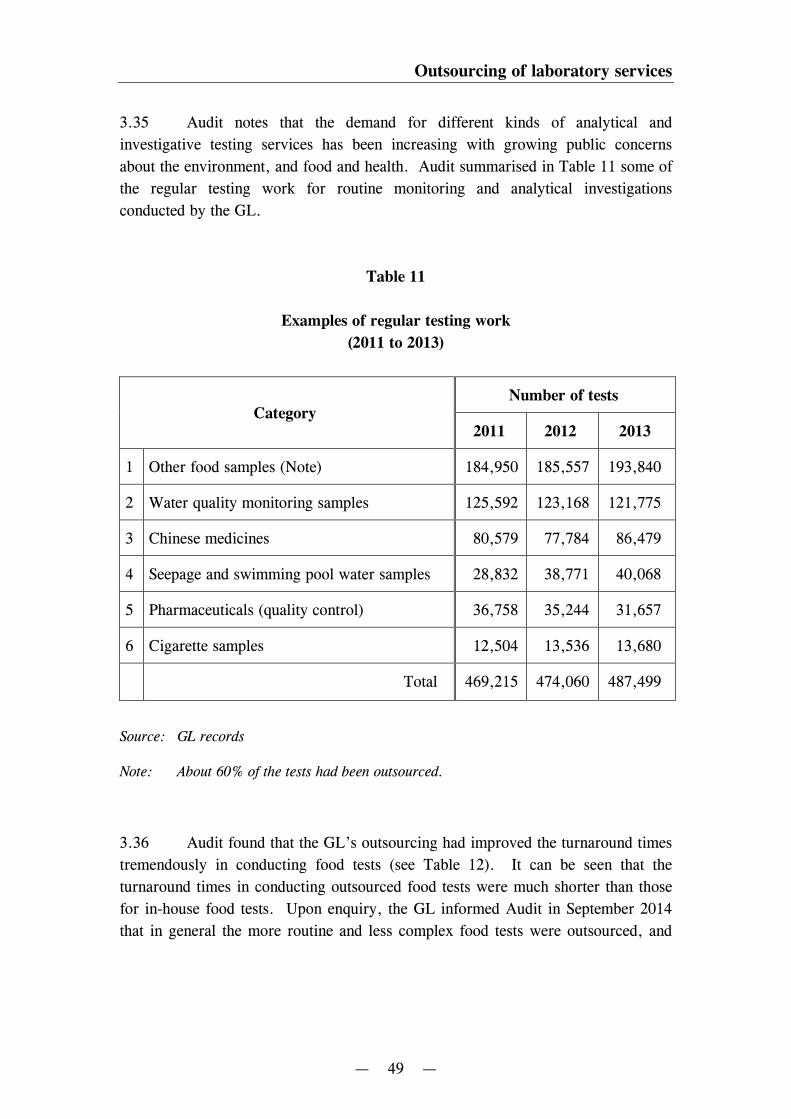
Outsourcing of laboratory services
— 49 —
3.35 Audit notes that the demand for different kinds of analytical and
investigative testing services has been increasing with growing public concerns
about the environment, and food and health. Audit summarised in Table 11 some of
the regular testing work for routine monitoring and analytical investigations
conducted by the GL.
Table 11
Examples of regular testing work
(2011 to 2013)
CategoryNumber of tests
2011 2012 2013
1 Other food samples (Note) 184,950 185,557 193,840
2 Water quality monitoring samples 125,592 123,168 121,775
3 Chinese medicines 80,579 77,784 86,479
4 Seepage and swimming pool water samples 28,832 38,771 40,068
5 Pharmaceuticals (quality control) 36,758 35,244 31,657
6 Cigarette samples 12,504 13,536 13,680
Total 469,215 474,060 487,499
Source: GL records
Note: About 60% of the tests had been outsourced.
3.36 Audit found that the GL’s outsourcing had improved the turnaround times
tremendously in conducting food tests (see Table 12). It can be seen that the
turnaround times in conducting outsourced food tests were much shorter than those
for in-house food tests. Upon enquiry, the GL informed Audit in September 2014
that in general the more routine and less complex food tests were outsourced, and
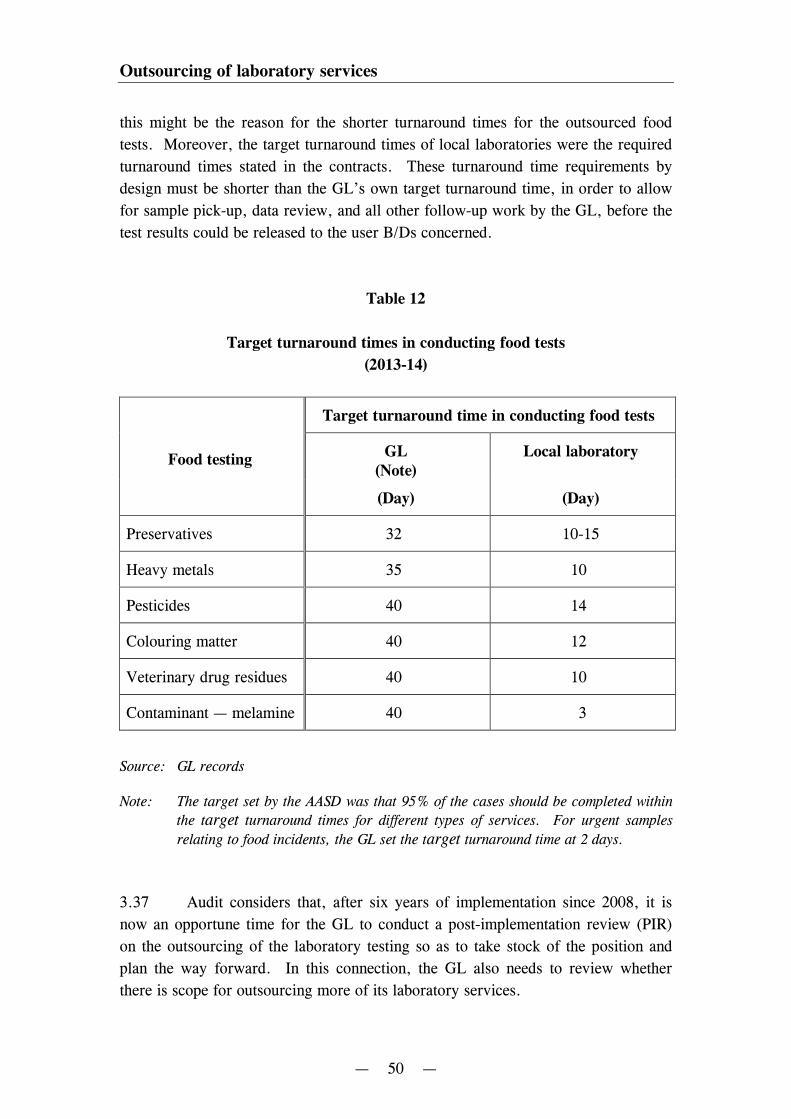
Outsourcing of laboratory services
— 50 —
this might be the reason for the shorter turnaround times for the outsourced food
tests. Moreover, the target turnaround times of local laboratories were the required
turnaround times stated in the contracts. These turnaround time requirements by
design must be shorter than the GL’s own target turnaround time, in order to allow
for sample pick-up, data review, and all other follow-up work by the GL, before the
test results could be released to the user B/Ds concerned.
Table 12
Target turnaround times in conducting food tests
(2013-14)
Food testing
Target turnaround time in conducting food tests
GL(Note)
Local laboratory
(Day) (Day)
Preservatives 32 10-15
Heavy metals 35 10
Pesticides 40 14
Colouring matter 40 12
Veterinary drug residues 40 10
Contaminant — melamine 40 3
Source: GL records
Note: The target set by the AASD was that 95% of the cases should be completed within
the target turnaround times for different types of services. For urgent samples
relating to food incidents, the GL set the target turnaround time at 2 days.
3.37 Audit considers that, after six years of implementation since 2008, it is
now an opportune time for the GL to conduct a post-implementation review (PIR)
on the outsourcing of the laboratory testing so as to take stock of the position and
plan the way forward. In this connection, the GL also needs to review whether
there is scope for outsourcing more of its laboratory services.

Outsourcing of laboratory services
— 51 —
Results of Audit Survey on outsourcing and staff secondment
3.38 Opinion on outsourcing by the GL. In the Audit Survey conducted in
July 2014 (see para. 1.16), the FEHD, as the only department that had services
outsourced by the GL, strongly agreed that the outsourcing of food testing had not
compromised the quality of testing services and had improved the turnaround time
of testing services.
3.39 For the other 16 B/Ds with services performed by the GL, 6 (38%)
considered that it could better meet their service needs if they could outsource the
laboratory testing directly to accredited private laboratories instead of having to go
through the GL. Five (31%) B/Ds considered that outsourcing of testing services by
the GL would not affect the quality of testing services. Seven (44%) B/Ds
considered that outsourcing could improve the turnaround time of testing services.
One user B/D indicated that it had enlisted private accredited laboratories and
outsourced some testing directly to accredited laboratories as the GL could not fully
satisfy its testing needs.
3.40 Opinion on staff secondment from the GL. A total of 48 professional or
technical staff are currently seconded by the GL to departments. Most of them
(38 or 79%) are seconded to the FEHD. In the Audit Survey, two user B/Ds
(including the FEHD) strongly agreed that the staff secondment helped them achieve
their service objectives. The FEHD further considered that more secondment from
the GL could better meet its operational needs.
3.41 For the other 15 B/Ds surveyed that did not have staff secondment from
the GL, 6 (40%) considered that it would be helpful if the GL seconded staff to
them. However, 6 (40%) B/Ds agreed that there would be difficulties in arranging
staff secondment from the GL.
3.42 Audit noted that a number of user B/Ds of the GL would like to outsource
the laboratory services to private laboratories (directly by themselves or by the GL).
Audit considers that the GL needed to communicate more with these departments to
ascertain the feasibility for outsourcing of their laboratory services. Audit also
noted that some departments wanted to have staff seconded from the GL. Audit
considers that the GL should ascertain the needs of these departments regarding staff
secondment.
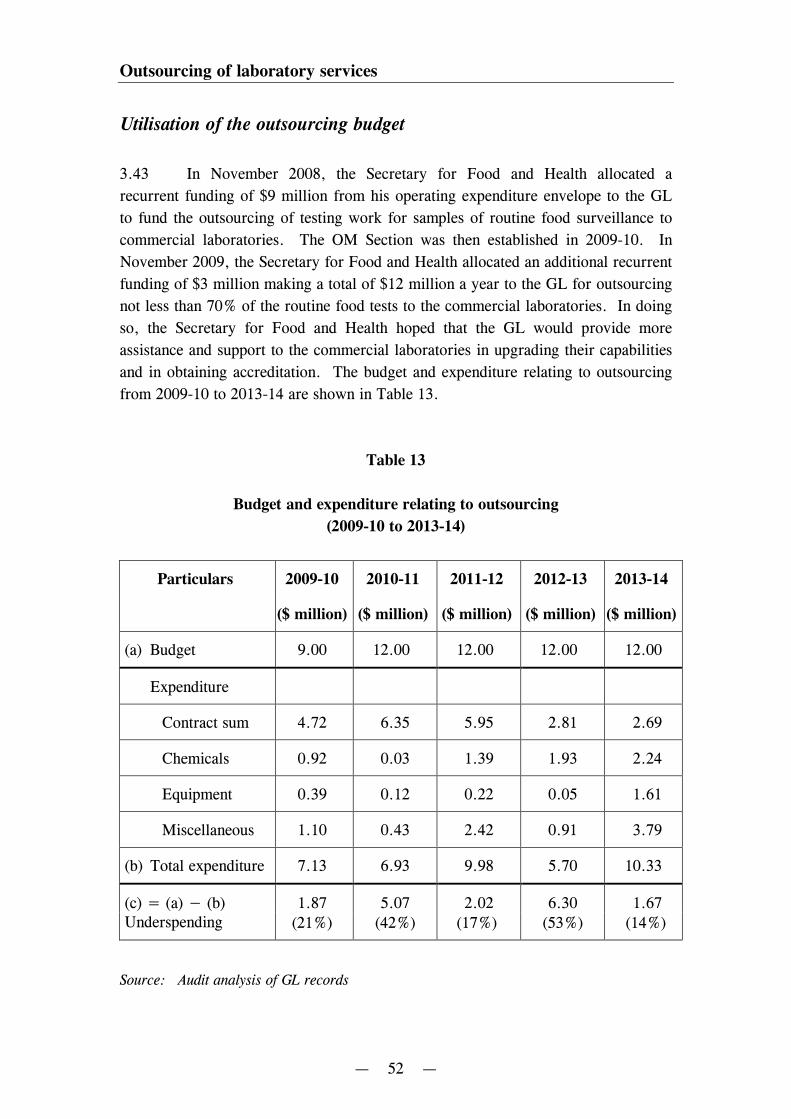
Outsourcing of laboratory services
— 52 —
Utilisation of the outsourcing budget
3.43 In November 2008, the Secretary for Food and Health allocated a
recurrent funding of $9 million from his operating expenditure envelope to the GL
to fund the outsourcing of testing work for samples of routine food surveillance to
commercial laboratories. The OM Section was then established in 2009-10. In
November 2009, the Secretary for Food and Health allocated an additional recurrent
funding of $3 million making a total of $12 million a year to the GL for outsourcing
not less than 70% of the routine food tests to the commercial laboratories. In doing
so, the Secretary for Food and Health hoped that the GL would provide more
assistance and support to the commercial laboratories in upgrading their capabilities
and in obtaining accreditation. The budget and expenditure relating to outsourcing
from 2009-10 to 2013-14 are shown in Table 13.
Table 13
Budget and expenditure relating to outsourcing
(2009-10 to 2013-14)
Particulars 2009-10 2010-11 2011-12 2012-13 2013-14
($ million) ($ million) ($ million) ($ million) ($ million)
(a) Budget 9.00 12.00 12.00 12.00 12.00
Expenditure
Contract sum 4.72 6.35 5.95 2.81 2.69
Chemicals 0.92 0.03 1.39 1.93 2.24
Equipment 0.39 0.12 0.22 0.05 1.61
Miscellaneous 1.10 0.43 2.42 0.91 3.79
(b) Total expenditure 7.13 6.93 9.98 5.70 10.33
(c) = (a) − (b) Underspending
1.87 5.07 2.02 6.30 1.67(21%) (42%) (17%) (53%) (14%)
Source: Audit analysis of GL records
Outsourcing of laboratory services
— 53 —
3.44 As can be seen from Table 13, the outsourcing budgets had all along been
underspent, ranging from $1.67 million (14%) to $6.30 million (53%). Audit also
noted that the total contract sums for outsourcing dropped significantly from a high
of $6.35 million in 2010-11 to $2.69 million in 2013-14. In the same period,
however, the related expenditure on chemicals, equipment and particularly
miscellaneous items had increased significantly. In 2013-14, of the $10.33 million
expenditure on outsourcing, $2.69 million (26%) was spent on the contract
payments to contractors, while $7.64 million (i.e. $2.24 million + $1.61 million +
$3.79 million) or 74% was spent on chemicals, equipment and miscellaneous items.
3.45 Upon enquiry, the GL informed Audit that while the chemicals,
equipment and miscellaneous items were not used by contractors under the
outsourcing contracts, many of these items were used in support of the local testing
industry through conducting in-house method development work and the subsequent
technological transfer, as well as providing PT programmes to local testing
laboratories. Audit considers it questionable whether such a significant proportion
of the budget allocated for outsourcing should be spent on items which were not
directly related to outsourcing. The GL needs to critically review the proper use of
its outsourcing budget in future.
Audit recommendations
3.46 Audit has recommended that the Government Chemist should conduct
a PIR on the outsourcing of the laboratory services to take stock of the position
and plan the way forward. In conducting the PIR, the GL should among other
things:
(a) review whether the objective of releasing its resources to focus on new
test method development and to cope with new testing work arising
from amendments of food legislation as well as urgent food incidents
(see para. 3.33) has been achieved;
(b) in consultation with the user B/Ds, explore the feasibility and
desirability of the following options:
Outsourcing of laboratory services
— 54 —
(i) outsourcing more of the laboratory services currently provided
by the GL for user B/Ds;
(ii) assisting user B/Ds to outsource laboratory services themselves;
and
(iii) arranging staff secondment to user B/Ds to meet their
laboratory service needs; and
(c) critically review the propriety of charging to the outsourcing vote
items which are not directly related to outsourcing.
Response from the Administration
3.47 The Government Chemist agrees with the audit recommendations.
— 55 —
PART 4: MANAGEMENT OF CHEMICALS,SAMPLES, EXHIBITS AND EQUIPMENT
4.1 This PART examines the GL’s management of chemicals, samples,
exhibits and equipment, focusing on the following areas:
(a) stock management of chemicals (paras. 4.2 to 4.19);
(b) handling of samples and exhibits (paras. 4.20 to 4.27); and
(c) maintenance of equipment (paras. 4.28 to 4.39).
Stock management of chemicals
4.2 The GL spends about $120 million a year on purchasing equipment and
chemicals, and uses an extensive range of scientific equipment in delivering its
services. When procuring the equipment and chemicals, the GL follows the
requirements of the Government’s Stores and Procurement Regulations (SPRs). It
also has to adhere to the procedural requirements laid down in the GL’s QAP and
the SOPs. The QAP is the highest level quality document which outlines the GL’s
policy on the quality system, whereas the SOPs set out the procedures to be
followed when implementing particular aspects of the quality system in individual
Divisions. The Supplies Section under the Administration Division is responsible
for the coordination of procurement in the GL.
4.3 The Supplies Section is tasked to control the stock of commonly used
chemical items using a computer requisition system known as Internal Ordering,
Inventory Keeping, External Purchases and Budgetary Control System (IIEB) which
has been put in place since 1999. The inventory system basically maintains the list
of stock items, keeps track of purchase orders, captures deliveries, facilitates
reorder notification, and tracks slow-moving items. Reports are provided for stock
management (e.g. stock movement transaction report, stock balance report,
slow-moving items and excessive stock report). There are four supplies storerooms
for keeping common inventories and consumables used by the GL.
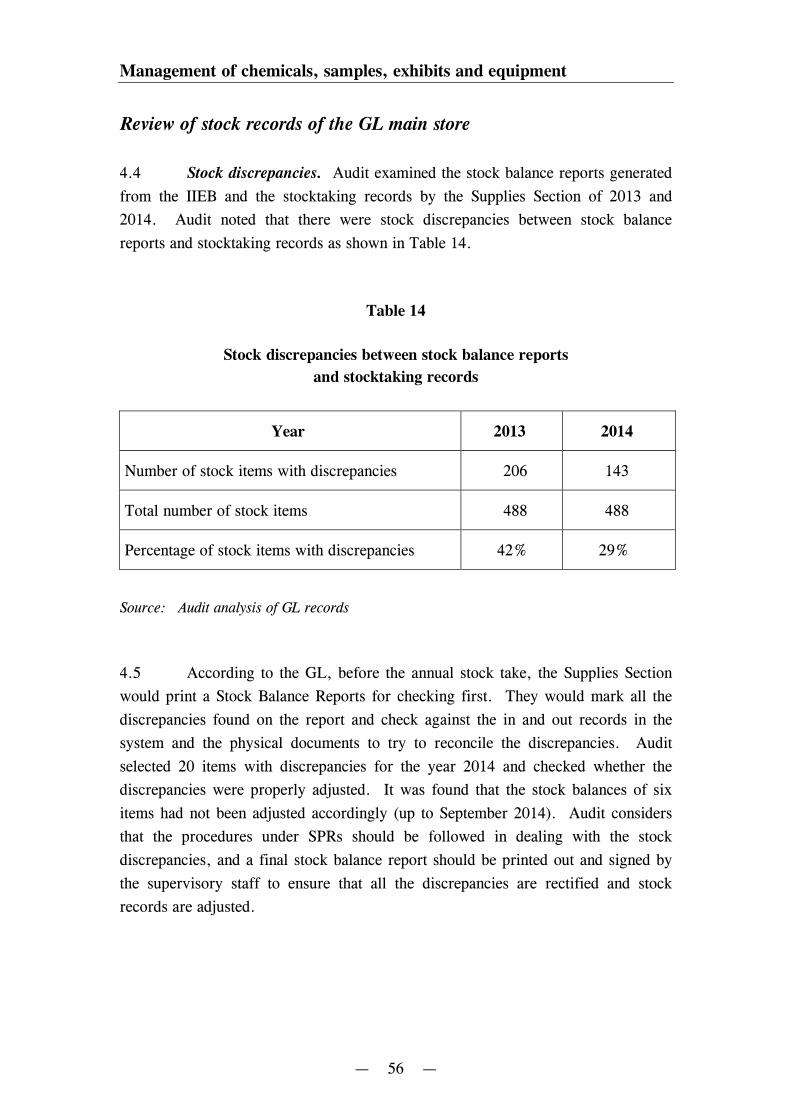
Management of chemicals, samples, exhibits and equipment
— 56 —
Review of stock records of the GL main store
4.4 Stock discrepancies. Audit examined the stock balance reports generated
from the IIEB and the stocktaking records by the Supplies Section of 2013 and
2014. Audit noted that there were stock discrepancies between stock balance
reports and stocktaking records as shown in Table 14.
Table 14
Stock discrepancies between stock balance reports
and stocktaking records
Year 2013 2014
Number of stock items with discrepancies 206 143
Total number of stock items 488 488
Percentage of stock items with discrepancies 42% 29%
Source: Audit analysis of GL records
4.5 According to the GL, before the annual stock take, the Supplies Section
would print a Stock Balance Reports for checking first. They would mark all the
discrepancies found on the report and check against the in and out records in the
system and the physical documents to try to reconcile the discrepancies. Audit
selected 20 items with discrepancies for the year 2014 and checked whether the
discrepancies were properly adjusted. It was found that the stock balances of six
items had not been adjusted accordingly (up to September 2014). Audit considers
that the procedures under SPRs should be followed in dealing with the stock
discrepancies, and a final stock balance report should be printed out and signed by
the supervisory staff to ensure that all the discrepancies are rectified and stock
records are adjusted.
Management of chemicals, samples, exhibits and equipment
— 57 —
4.6 Stock disposal. Upon examination of the 2013 stocktaking report, Audit
found that there were four items marked “item not found” by the staff of Supplies
Section. Upon Audit’s enquiry, the Supplies Section confirmed that most of the
unfound items (mainly chemical items which already expired) were passed to the
Safety Officer for disposal. Audit noted that the stock records were not timely
updated after the disposal of stock.
4.7 Audit stocktaking exercise. Audit conducted a stocktaking exercise on
28 July 2014 at the GL main store. There were 437 stock items listed in the Stock
Balance Report as at 28 July 2014. Audit selected 20 (about 5%) of the stock items
for checking. Audit found that there were discrepancies for four (20%) of the
20 items.
4.8 According to SPRs 610 and 620(c), departments should keep complete
records of the receipt and issue of all stores held in a departmental store unit and
post all ledgers promptly, and support each entry of the ledgers by a voucher, the
nature and number of which should be recorded against the entry. Audit considers
that the GL needs to remind all officers to record and update the store records
promptly to avoid any discrepancies. If there are any discrepancies found, prompt
action needs to be taken to investigate into the reasons and rectify the records
accordingly.
4.9 Expiry dates of chemicals. Audit noted that no expiry dates of chemicals
were recorded in the IIEB. In the circumstances, it would be difficult for the
Supplies Section to monitor the usage of such chemicals stock. Moreover, using
expired products may undermine the accuracy of laboratory testing. While the
Supplies Officer informed Audit that they regularly checked whether the chemicals
had expired, there was no documentation of such checking. Audit considers that the
expiry dates of the chemicals should be included in the IIEB for better stock
management in order to prevent the use of expired chemicals.
Stock kept at the user Sections
4.10 According to the SOPs of the AASD and the FSD, Section Head shall
conduct regular supervisory checks on items kept in stock under the Section,
especially those of high-value items like certified reference materials. The Section
Head may also assign officers who are not involved in day-to-day stock keeping to
conduct the checks and to investigate any discrepancies found.
Management of chemicals, samples, exhibits and equipment
— 58 —
4.11 The user Sections obtain the chemicals/reagents from the Supplies
Section. According to the SWMs of the Sections in the FSD, the Section staff
(usually an SLT) is responsible for ensuring that chemicals/reagents are not used
beyond the expiry date. The SLT also monitors the stock balance to initiate stock
replenishment and proposes disposal of expired items for approval by the Senior
Chemist concerned. However, no such detailed requirements were found in the
SWMs (Note 10) of the Sections in the AASD.
4.12 Audit found in a stocktake of one Section in the FSD that there were
174 solid chemical items and 38 solvent items which had been in the stock list of the
Section for over 10 years (some of them even over 20 years). Although no expiry
date was marked on the stock list, it is not sure whether the solvents could still be
used. They might have already expired but not yet been disposed of. It was also
found that 11 solid chemical items and 11 solvent items had already expired but not
yet been disposed of. There were four solvent items which were only disposed
of over 5 years after their expiry. Upon enquiry, the GL informed Audit in
September 2014 that some solvents were very stable in nature and could be used
without any problem.
4.13 According to the SOPs of both Divisions, minimum stock levels based on
the advice of the user Sections are set for each stock item and are reviewed at a
regular interval by the Supplies Section to ensure that an optimum stock is
maintained at all times to support the laboratory activities. However, there was no
evidence to show that the Supplies Section regularly checked the stock kept by the
user Sections or asked the user Sections to file a return on the stock kept. The
Supplies Section mainly checked the stock at the GL main store, while the user
Sections managed their own stock.
4.14 Lack of regular stocktakes. After reviewing the QAP, SOPs and SWMs,
Audit found that there were no guidelines on the requirement for the user Sections
to conduct stocktakes regularly on the stock held on hand and to check the expiry
dates of the stock items.
Note 10: The SWMs stipulate the quality control plans for the tests conducted, the samplehandling procedures adopted by the Sections and the training modules arrangedin the Sections.
Management of chemicals, samples, exhibits and equipment
— 59 —
4.15 Audit considers it a good practice for the user Sections to conduct regular
stocktakes on the chemicals/solvents on hand and dispose of the expired chemicals
within a reasonable period of time. Furthermore, as some chemicals are dangerous,
special care is needed to handle the disposal of the chemical waste. Audit considers
that good stock management can save storage space, prevent the use of expired
chemicals and the accumulation of useless but dangerous chemicals. When the stock
is disposed of, the stock record should be updated accordingly.
4.16 Audit noted that the last exercise for the disposal of the expired chemicals
of the main store and the user Sections was conducted in 2009. No other disposal
exercise had thereafter been conducted. Upon enquiry, the GL informed Audit in
October 2014 that general chemicals like solvents could be disposed of as chemical
wastes to be collected by the authorised contractor every week. However, for the
disposal of other specialty chemicals, special arrangements have to be made with the
authorised contractor. Up to August 2014, the Safety Officer had received requests
from a few user Sections to dispose of 335 chemical/solvent/reagent items under
special arrangement. However, the Sections were not required to file any returns
regularly on the items to be disposed of under special arrangements to the Supplies
Section or the Safety Officer. Audit considers that regular filing of items to be
disposed of under special arrangements can help the Safety Officer plan the disposal
exercise more effectively and also the Supplies Section to monitor the stock level.
4.17 Audit considers that the GL needs to improve its stock management by
conducting regular stocktakes in both the main store and user Sections, disposing of
the expired stock items periodically, and updating the stock list promptly.
Audit recommendations
4.18 Audit has recommended that the Government Chemist should:
(a) ensure that proper stock records are kept in accordance with the
SPRs;
(b) establish departmental stocktaking guidelines (e.g. procedures before
and after the stocktake, and review of stocktake results by
supervisory officers), and ensure regular stocktakes are conducted for
all stocks;
Management of chemicals, samples, exhibits and equipment
— 60 —
(c) include the expiry dates of the items in the stock list of the main store
to facilitate better stock management; and
(d) ensure that the expired stocks are disposed of periodically and the
stock lists are updated promptly.
Response from the Administration
4.19 The Government Chemist agrees with the audit recommendations. He has
said that for general chemicals and reagents, there might not be a need to keep track
of their expiry dates as they were normally chemically stable under storage
conditions and their turnover was high. For those reference materials, expiry dates
and detailed stock list were kept and regularly reviewed by Sections.
Handling of samples and exhibits
4.20 According to the QAP and SOPs, all samples and exhibits submitted by
user B/Ds should be handled with care. All samples and exhibits are logged in the
individual Division’s computerised central sample register using unique laboratory
numbers for identification (with the AASD using the SIMS and the FSD using the
ESIMS). Records of chain-of-custody for regulatory samples/exhibits are
maintained. The sample registration officer is required to ensure that all samples
submitted are properly sealed to prevent loss or contamination. Proper security can
be achieved by storing the samples in locked cabinets or rooms. For items which
require registration, plastic bins fitted with locks are used. The names of officers
with access to the exhibits must be properly recorded.
4.21 According to the SOPs, the custody of the exhibits during the course of
examination lies with the examiner in possession of the samples/exhibits (i.e. either
the reporting officer or his/her subordinates). To ensure that the integrity of
evidence is preserved, Sections shall provide their staff with detailed procedures in
the SWMs on maintaining the custody of the samples and exhibits during the course
of examination. Subsequent handling of the test samples within Sections after
registration shall be in accordance with the SWMs on “Handling of Test Samples”.
Management of chemicals, samples, exhibits and equipment
— 61 —
Since the types/nature of the exhibits received by different Sections are different,
each Section has its own SWM providing different sets of guidelines. These
guidelines include the assignment of cases, and the procedures for receiving,
storage, examination, returning and transferring of the exhibits.
4.22 Most of the samples received by the AASD and part of the samples
received by the FSD are routine samples. After completion of cases, the GL will
dispose of them within a designated period of time unless requested otherwise by the
user B/Ds. The procedures for disposal of the exhibits are separately stipulated in
different SWMs as different samples require different treatments. For the formal
samples received by the AASD, the GL did not keep any information on the exhibit
return dates in the computer system. They only keep it in manual form by marking
on the file. The AASD could not provide a full database on the return dates of the
exhibits.
4.23 On the other hand, most of the samples received by the FSD and some of
the samples received by the AASD are formal exhibits used for prosecution
purposes. Such exhibits are required to be returned to the user B/Ds. The reporting
officers of these Sections will normally only return the exhibits directly to the user
B/Ds if there is urgency or if the case involves a large number of exhibits.
Otherwise, in most cases, the reporting officer concerned will deliver the case file
and exhibits for a case in person to the Forensic Counter Exhibit Officer who shall
take immediate possession of the exhibits. The exhibits and the reports are ready
for collection by the user B/Ds at the Forensic Counter.
4.24 Audit took 28 July 2014 as the cut-off date and checked the completion
dates of the files (together with the exhibits pending collection by the user B/Ds) at
the Forensic Counter and calculated the number of working days between the cut-off
date and the report completion date. Audit found that 32% of the cases with reports
and/or exhibits had not been collected for over 3 months after the completion date
(including 14% over 1 year). Two of the cases had been completed some four years
ago but were still not yet collected by the user B/Ds. Audit noted that there were no
stocktaking requirements stipulated in the QAP, SOPs and SWMs for
samples/exhibits, nor were there any guidelines for handling exhibits that have
remained uncollected by user B/Ds for a long period of time.
Management of chemicals, samples, exhibits and equipment
— 62 —
4.25 Audit examined the time elapsed before the user B/Ds collected the
exhibits in the period 2009 to July 2014 by analysing the number of working days
between the exhibit collection dates and the report completion dates. The total
number of cases with exhibits collected during the period was 127,523. In 809
cases, the exhibits were collected before the cases were completed. Audit found
that out of 73,094 cases with return dates provided, most (about 98%) of the
exhibits were collected within 3 months after the completion of the reports.
However, there were 53,620 cases (i.e. 42% of a total of 127,523 cases) in which
no such information was readily available in the computer system. Also, there were
56 cases in which the exhibits were collected over one year after the reports were
completed. As such, the GL may need extra storage space/facilities to keep these
long-outstanding exhibits. Audit considers that the GL needs to take measures to
enhance the management of reports/exhibits pending collection by user B/Ds.
Audit recommendations
4.26 Audit has recommended that the Government Chemist should take
measures to enhance the GL’s management of reports/exhibits pending
collection by user B/Ds by, for example:
(a) reminding and urging user B/Ds to collect the reports and the exhibits
promptly;
(b) providing more management information (e.g. the completion dates
and the exhibit collection dates) for monitoring long-outstanding cases
pending collection by user B/Ds; and
(c) conducting periodic stocktakes of the exhibits at both the user
Sections and the Forensic Counter in order to identify exhibits that
have remained uncollected for a long period of time.
Response from the Administration
4.27 The Government Chemist agrees with the audit recommendations.
Management of chemicals, samples, exhibits and equipment
— 63 —
Maintenance of equipment
4.28 The GL has been using the service of the Electrical and Mechanical
Services Trading Fund (EMSTF) to maintain and repair its scientific equipment, and
electrical, mechanical, air-conditioning and building services equipment since the
establishment of the EMSTF in 1996. According to Financial Circular No. 9/99
“Untying Departments from the Services of the EMSTF” issued in June 1999, upon
untying from August 2002, user departments would be free to retain the services of
the EMSTF or to choose alternative service providers to meet part or all of their
electrical and mechanical service needs.
4.29 Furthermore, Financial Circular No. 6/2001 “Use of Trading Fund
Services” issued in August 2001 states that a Controlling Officer may choose to
enter into a service agreement with a trading fund direct, without recourse to
competitive bidding, if he or she is clearly satisfied that:
(a) the trading fund is fully capable of delivering in a cost-effective manner
specific services that his or her department needs; and
(b) having regard to the circumstances of the case (such as the urgency or the
special circumstances of the services required), inviting competitive
bidding for the delivery of such services is not appropriate.
The Controlling Officer will be accountable for the decision on why competitive
bidding is not appropriate.
Renewal of Service Level Agreements with the EMSTF
4.30 The GL entered into a five-year Service Level Agreement of
Comprehensive Engineering Services for Government Laboratory (SLA — Note 11)
with the EMSTF starting from 1 April 2001. The SLA was renewed in April 2006
and July 2011 with an intervening three-month SLA for the period April 2011 to
June 2011. Details of the SLAs are shown in Table 15.
Note 11: An SLA between the EMSTF and a user department incorporates the technicalrequirements, specifications, and terms and conditions for the provision ofEMSTF services.
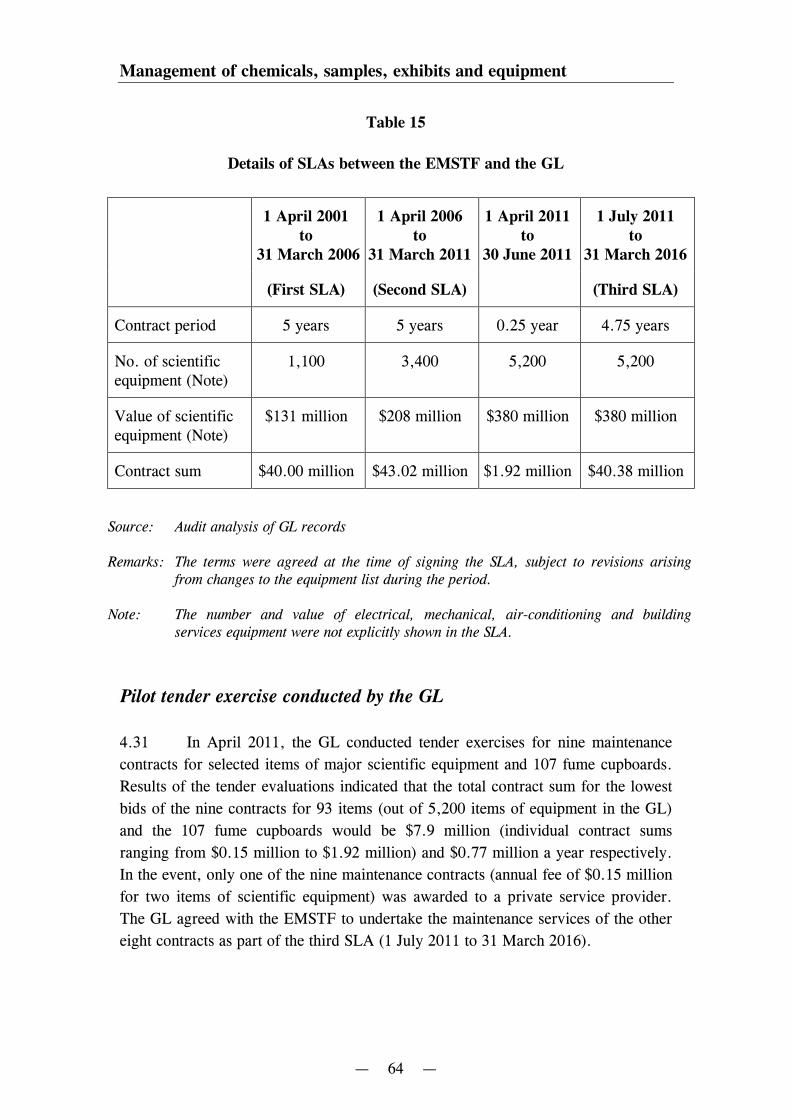
Management of chemicals, samples, exhibits and equipment
— 64 —
Table 15
Details of SLAs between the EMSTF and the GL
1 April 2001to
31 March 2006
1 April 2006to
31 March 2011
1 April 2011to
30 June 2011
1 July 2011to
31 March 2016
(First SLA) (Second SLA) (Third SLA)
Contract period 5 years 5 years 0.25 year 4.75 years
No. of scientificequipment (Note)
1,100 3,400 5,200 5,200
Value of scientificequipment (Note)
$131 million $208 million $380 million $380 million
Contract sum $40.00 million $43.02 million $1.92 million $40.38 million
Source: Audit analysis of GL records
Remarks: The terms were agreed at the time of signing the SLA, subject to revisions arisingfrom changes to the equipment list during the period.
Note: The number and value of electrical, mechanical, air-conditioning and buildingservices equipment were not explicitly shown in the SLA.
Pilot tender exercise conducted by the GL
4.31 In April 2011, the GL conducted tender exercises for nine maintenance
contracts for selected items of major scientific equipment and 107 fume cupboards.
Results of the tender evaluations indicated that the total contract sum for the lowest
bids of the nine contracts for 93 items (out of 5,200 items of equipment in the GL)
and the 107 fume cupboards would be $7.9 million (individual contract sums
ranging from $0.15 million to $1.92 million) and $0.77 million a year respectively.
In the event, only one of the nine maintenance contracts (annual fee of $0.15 million
for two items of scientific equipment) was awarded to a private service provider.
The GL agreed with the EMSTF to undertake the maintenance services of the other
eight contracts as part of the third SLA (1 July 2011 to 31 March 2016).
Management of chemicals, samples, exhibits and equipment
— 65 —
Fee adjustment under the current SLA
4.32 Under the third (current) SLA (1 July 2011 to 31 March 2016), the GL
would pay the EMSTF a maintenance fee of about $40.38 million over the period.
The annual baseline fee was set at $8.5 million ($40.38 million over 4.75 years)
according to the equipment list. The baseline fee would be adjusted according to
additions and deletions to the equipment list during the period. However, at the
time of signing the SLA in July 2011, the equipment list was not yet finalised and
the old equipment list (5,200 items with a total value of $380 million) was adopted.
It was agreed that the baseline fee would be revised when the equipment list was
finalised.
4.33 In October 2012, the equipment list was finalised at $288 million (with
some 2,800 items of equipment) and the annual baseline fee was revised downwards
from $8.5 million to $7.47 million. It was agreed between the EMSTF and the GL
that the revised baseline fee should be dated back to 1 July 2012. However, Audit
noted that the SLA fee was not revised until 1 April 2013, nine months after
1 July 2012. As such, the amount of SLA fee paid during the period might involve
an overpayment of $0.77 million. Audit considers that the equipment list should be
finalised before the start of a new SLA as far as possible, so that the annual baseline
fee can be accurately and promptly determined. Moreover, the revised SLA fee
should be implemented according to the agreed timeframe.
4.34 Upon enquiry, the GL informed Audit in September 2014 that the
overpayment of $0.77 million was a result of the trim down of annual SLA baseline
fee in accordance with the updated equipment list completed in October 2012. The
revised fee took retrospective effect from July 2012 but was eventually implemented
from April 2013. The reconciliation of arrear in payment was not implemented in
2012 because:
(a) the GL anticipated that the equipment list would be increased in the
remaining contract period ending 31 March 2016. The amount of
$0.77 million could be used to offset the increase in SLA baseline fee and
thus the GL would not need to seek supplementary provision in this
respect as far as possible; and
Management of chemicals, samples, exhibits and equipment
— 66 —
(b) the overpayment would be settled upon the final instalment of SLA fee
that would be made prior to the expiry of the 5-year SLA period by
31 March 2016.
Impending expiry of current SLA
4.35 The current SLA will expire on 31 March 2016. In April 2014, the GL
was exploring the way forward and the strategy for the maintenance of all
equipment in use. In this regard, the GL identified some major challenges,
including:
(a) in the next few years, the warranties of many items of scientific
equipment would expire. The additions to the equipment list for
maintenance services might increase the SLA fee substantially; and
(b) for some scientific equipment with advanced technology, the EMSTF
might not have the required expertise to provide maintenance services.
4.36 The GL decided that market tests through a tendering exercise should be
carried out to see whether some of the maintenance work could be done by other
service providers before the equipment list to be covered by the SLA was finalised
with the EMSTF.
Audit recommendations
4.37 Audit has recommended that the Government Chemist should:
(a) plan ahead for the arrangement for equipment maintenance before
expiry of the current SLA by March 2016 with a view to addressing
the challenges mentioned in paragraph 4.35;
(b) in collaboration with the EMSTF, enhance the mechanism on
updating the equipment list and revision of SLA fee, and ensure that
the equipment list is finalised before the start of a new SLA; and
Management of chemicals, samples, exhibits and equipment
— 67 —
(c) examine the SLA fee paid for the period 1 July 2012 to
31 March 2013, and take measures to recover from the EMSTF any
overpayment.
Response from the Administration
4.38 The Government Chemist agrees with the audit recommendations.
4.39 The Director of the Electrical and Mechanical Services agrees with the
audit recommendations. He has said that:
(a) the EMSTF is working closely with the GL to update the equipment list
and revise the SLA fee through regular meetings. The EMSTF would
fully support and assist the GL in enhancing the updating mechanism and
preparing the updated list for SLA renewal; and
(b) the SLA fee adjustment due to reduction in equipment items effective
from July 2012 was examined and agreed between the GL and the
EMSTF. It was agreed that the fee adjustment, including the
overpayment for the period from 1 July 2012 to 31 March 2013, would be
settled within the current SLA period ending on 31 March 2016.
— 68 —
PART 5: WAY FORWARD
5.1 This PART explores the way forward for the provision of laboratory
services by the GL.
Challenges facing the Government Laboratory
5.2 The GL provides a broad range of analytical, advisory and forensic
services to B/Ds. Given its limited resources and the wide spectrum of government
services that require its support, the GL is facing great challenges to continuously
improve its efficiency and cost-effectiveness in the provision of laboratory services.
In particular, the frequent occurrence of emergency incidents (notably food incidents)
in recent years has put great pressure on the GL in providing urgent and complex
laboratory testing and advisory services to support various B/Ds in dealing with
such incidents.
Areas for improvement
5.3 The 2002 Audit Review had found that there was room for improvement
in a number of areas including turnaround time of services and coordination with
user B/Ds, and highlighted the need to explore the option of outsourcing the GL’s
routine analytical testing services to accredited laboratories. In the current review,
Audit has followed up the implementation of the 2002 audit recommendations and
examined the measures (including outsourcing of laboratory services) taken by the
GL to improve the efficiency and effectiveness of its services to user B/Ds. Audit
has identified a number of areas that call for improvement. Key areas for
improvement are set out in PARTs 2 to 4.
Government Laboratory’s long-termstrategic development plan
5.4 The GL recognises that there have been changes in the demand of the
services in recent years, especially in the areas of food safety, public health and
consumer protection. In particular, the growing number of incidents requiring
urgent services in the last few years (including melamine, phthalates and
Way forward
— 69 —
radioactivity in food products) called for not only emergency responses and
round-the-clock testing services, but also development of testing methods to meet
the highest possible international standards within a very short time. The GL also
recognises that, under the current organisational structure and the constraints of
compartmentalised locations of its laboratories, the professional exchange among
staff working in the same testing discipline could not be established.
5.5 In order to better prepare for the future needs of the society and maintain
its quality of services to meet the increasing unpredictable demand for laboratory
services, the GL considers that a paradigm shift in its operations is needed. The GL
is meanwhile reviewing its existing operations and will discuss its long-term
strategic development plan with the Food and Health Bureau to better prepare the
GL to face the upcoming challenges and demands in serving the community.
Audit recommendation
5.6 Audit has recommended that the Government Chemist should take on
board the observations and recommendations in this Audit Report in taking
forward the GL’s long-term strategic development plan.
Response from the Administration
5.7 The Government Chemist agrees with the audit recommendation. He has
said that he would implement the recommendations made in the Audit Report as
appropriate.
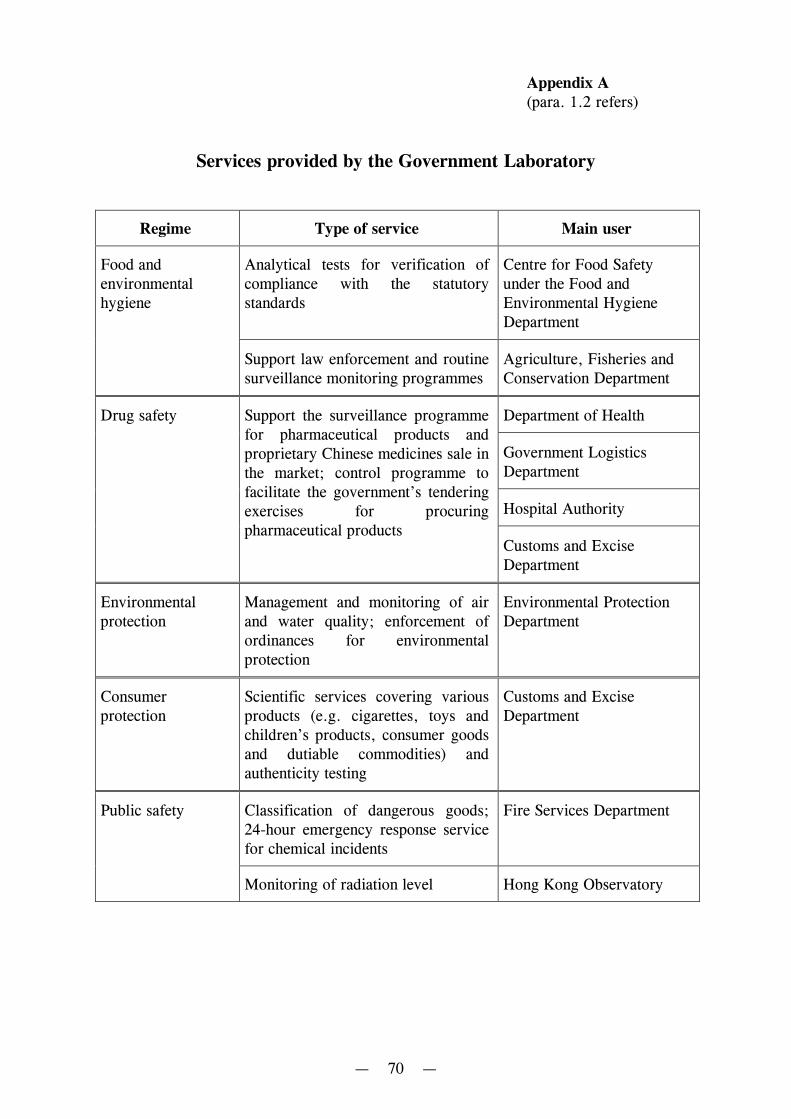
Appendix A(para. 1.2 refers)
— 70 —
Services provided by the Government Laboratory
Regime Type of service Main user
Food andenvironmentalhygiene
Analytical tests for verification ofcompliance with the statutorystandards
Centre for Food Safetyunder the Food andEnvironmental HygieneDepartment
Support law enforcement and routinesurveillance monitoring programmes
Agriculture, Fisheries andConservation Department
Drug safety Support the surveillance programmefor pharmaceutical products andproprietary Chinese medicines sale inthe market; control programme tofacilitate the government’s tenderingexercises for procuringpharmaceutical products
Department of Health
Government LogisticsDepartment
Hospital Authority
Customs and ExciseDepartment
Environmentalprotection
Management and monitoring of airand water quality; enforcement ofordinances for environmentalprotection
Environmental ProtectionDepartment
Consumerprotection
Scientific services covering variousproducts (e.g. cigarettes, toys andchildren’s products, consumer goodsand dutiable commodities) andauthenticity testing
Customs and ExciseDepartment
Public safety Classification of dangerous goods;24-hour emergency response servicefor chemical incidents
Fire Services Department
Monitoring of radiation level Hong Kong Observatory
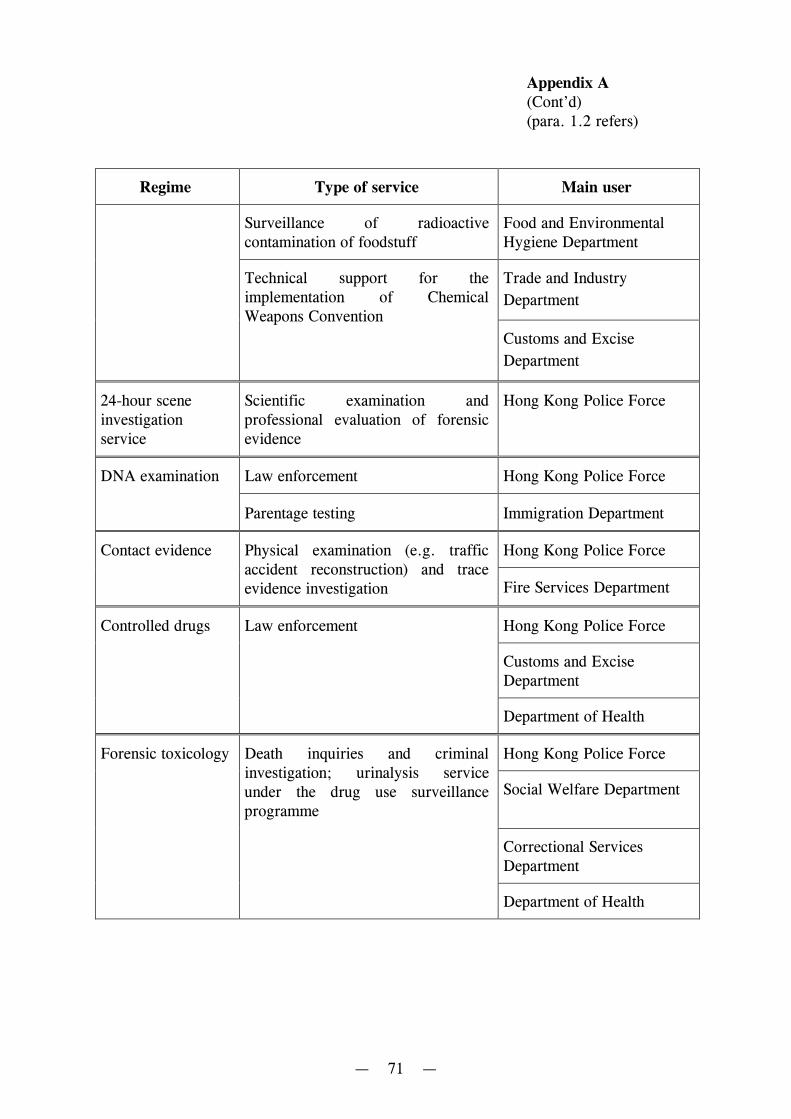
Appendix A(Cont’d)(para. 1.2 refers)
— 71 —
Regime Type of service Main user
Surveillance of radioactivecontamination of foodstuff
Food and EnvironmentalHygiene Department
Technical support for theimplementation of ChemicalWeapons Convention
Trade and Industry
Department
Customs and Excise
Department
24-hour sceneinvestigationservice
Scientific examination andprofessional evaluation of forensicevidence
Hong Kong Police Force
DNA examination Law enforcement Hong Kong Police Force
Parentage testing Immigration Department
Contact evidence Physical examination (e.g. trafficaccident reconstruction) and traceevidence investigation
Hong Kong Police Force
Fire Services Department
Controlled drugs Law enforcement Hong Kong Police Force
Customs and ExciseDepartment
Department of Health
Forensic toxicology Death inquiries and criminalinvestigation; urinalysis serviceunder the drug use surveillanceprogramme
Hong Kong Police Force
Social Welfare Department
Correctional ServicesDepartment
Department of Health
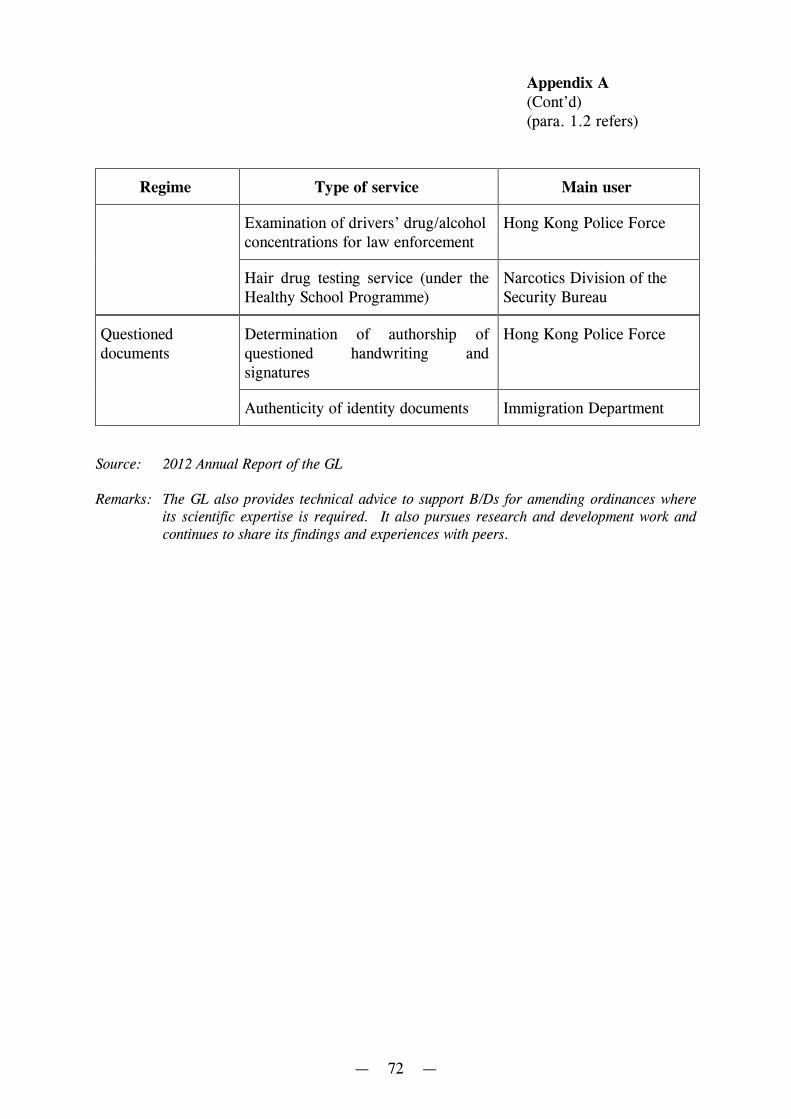
Appendix A(Cont’d)(para. 1.2 refers)
— 72 —
Regime Type of service Main user
Examination of drivers’ drug/alcoholconcentrations for law enforcement
Hong Kong Police Force
Hair drug testing service (under theHealthy School Programme)
Narcotics Division of theSecurity Bureau
Questioneddocuments
Determination of authorship ofquestioned handwriting andsignatures
Hong Kong Police Force
Authenticity of identity documents Immigration Department
Source: 2012 Annual Report of the GL
Remarks: The GL also provides technical advice to support B/Ds for amending ordinances whereits scientific expertise is required. It also pursues research and development work andcontinues to share its findings and experiences with peers.
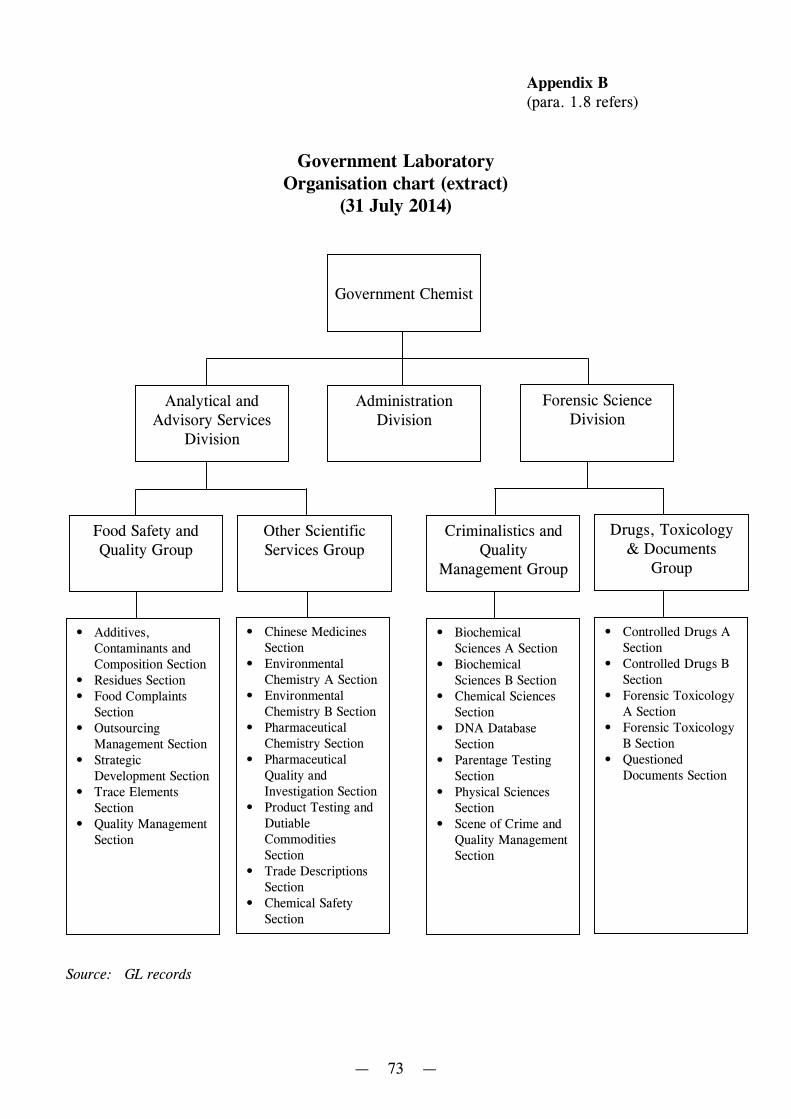
Appendix B(para. 1.8 refers)
— 73 —
Government LaboratoryOrganisation chart (extract)
(31 July 2014)
Source: GL records
Analytical andAdvisory Services
Division
AdministrationDivision
Forensic ScienceDivision
Food Safety andQuality Group
Other ScientificServices Group
Criminalistics andQuality
Management Group
Drugs, Toxicology& Documents
Group
Government Chemist
• Additives,Contaminants andComposition Section
• Residues Section• Food Complaints
Section• Outsourcing
Management Section• Strategic
Development Section• Trace Elements
Section• Quality Management
Section
• Chinese MedicinesSection
• EnvironmentalChemistry A Section
• EnvironmentalChemistry B Section
• PharmaceuticalChemistry Section
• PharmaceuticalQuality andInvestigation Section
• Product Testing andDutiableCommoditiesSection
• Trade DescriptionsSection
• Chemical SafetySection
• BiochemicalSciences A Section
• BiochemicalSciences B Section
• Chemical SciencesSection
• DNA DatabaseSection
• Parentage TestingSection
• Physical SciencesSection
• Scene of Crime andQuality ManagementSection
• Controlled Drugs ASection
• Controlled Drugs BSection
• Forensic ToxicologyA Section
• Forensic ToxicologyB Section
• QuestionedDocuments Section
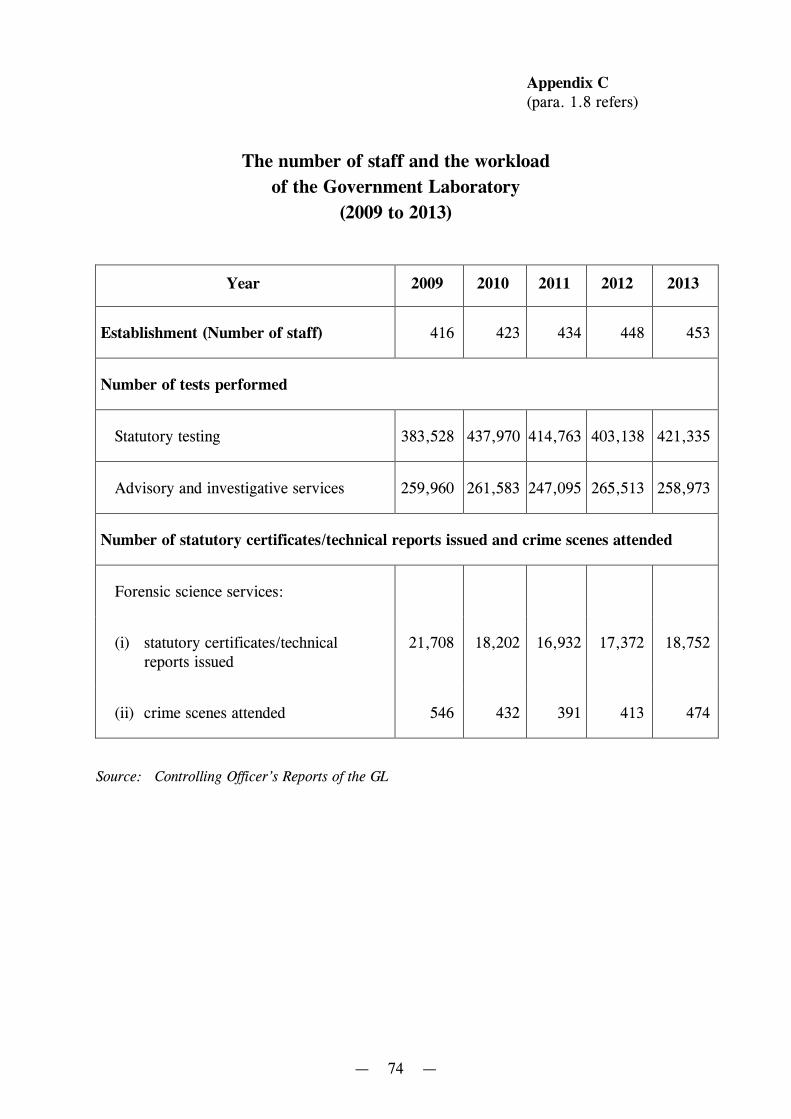
Appendix C(para. 1.8 refers)
— 74 —
The number of staff and the workload
of the Government Laboratory
(2009 to 2013)
Year 2009 2010 2011 2012 2013
Establishment (Number of staff) 416 423 434 448 453
Number of tests performed
Statutory testing 383,528 437,970 414,763 403,138 421,335
Advisory and investigative services 259,960 261,583 247,095 265,513 258,973
Number of statutory certificates/technical reports issued and crime scenes attended
Forensic science services:
(i) statutory certificates/technicalreports issued
21,708 18,202 16,932 17,372 18,752
(ii) crime scenes attended 546 432 391 413 474
Source: Controlling Officer’s Reports of the GL
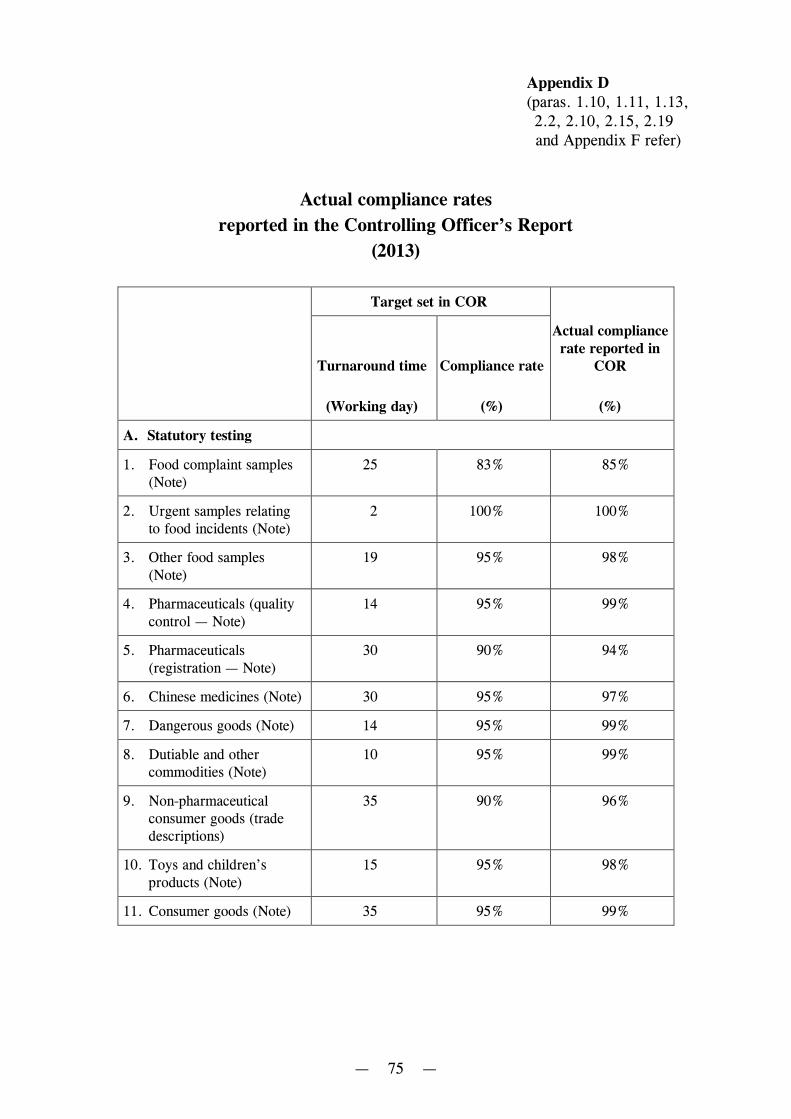
Appendix D(paras. 1.10, 1.11, 1.13,2.2, 2.10, 2.15, 2.19and Appendix F refer)
— 75 —
Actual compliance rates
reported in the Controlling Officer’s Report
(2013)
Target set in COR
Turnaround time Compliance rate
Actual compliancerate reported in
COR
(Working day) (%) (%)
A. Statutory testing
1. Food complaint samples(Note)
25 83% 85%
2. Urgent samples relatingto food incidents (Note)
2 100% 100%
3. Other food samples(Note)
19 95% 98%
4. Pharmaceuticals (qualitycontrol — Note)
14 95% 99%
5. Pharmaceuticals(registration — Note)
30 90% 94%
6. Chinese medicines (Note) 30 95% 97%
7. Dangerous goods (Note) 14 95% 99%
8. Dutiable and othercommodities (Note)
10 95% 99%
9. Non-pharmaceuticalconsumer goods (tradedescriptions)
35 90% 96%
10. Toys and children’sproducts (Note)
15 95% 98%
11. Consumer goods (Note) 35 95% 99%
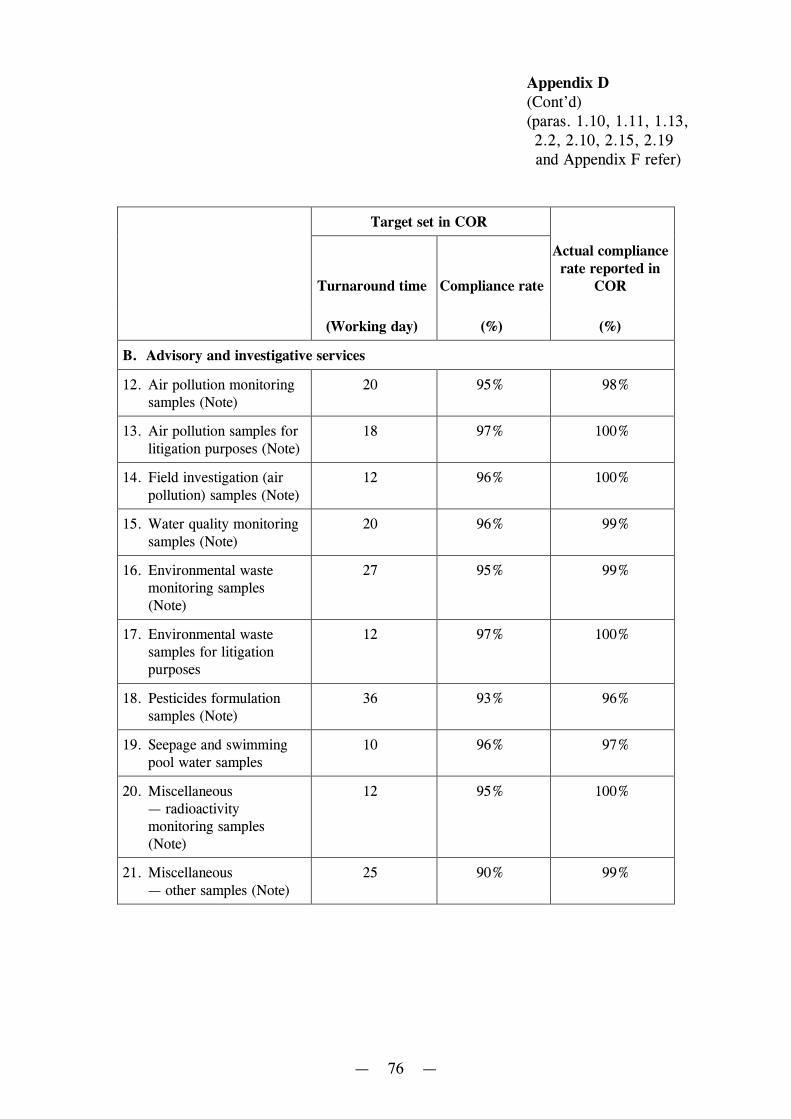
Appendix D(Cont’d)(paras. 1.10, 1.11, 1.13,2.2, 2.10, 2.15, 2.19and Appendix F refer)
— 76 —
Target set in COR
Turnaround time Compliance rate
Actual compliancerate reported in
COR
(Working day) (%) (%)
B. Advisory and investigative services
12. Air pollution monitoringsamples (Note)
20 95% 98%
13. Air pollution samples forlitigation purposes (Note)
18 97% 100%
14. Field investigation (airpollution) samples (Note)
12 96% 100%
15. Water quality monitoringsamples (Note)
20 96% 99%
16. Environmental wastemonitoring samples(Note)
27 95% 99%
17. Environmental wastesamples for litigationpurposes
12 97% 100%
18. Pesticides formulationsamples (Note)
36 93% 96%
19. Seepage and swimmingpool water samples
10 96% 97%
20. Miscellaneous— radioactivitymonitoring samples(Note)
12 95% 100%
21. Miscellaneous— other samples (Note)
25 90% 99%
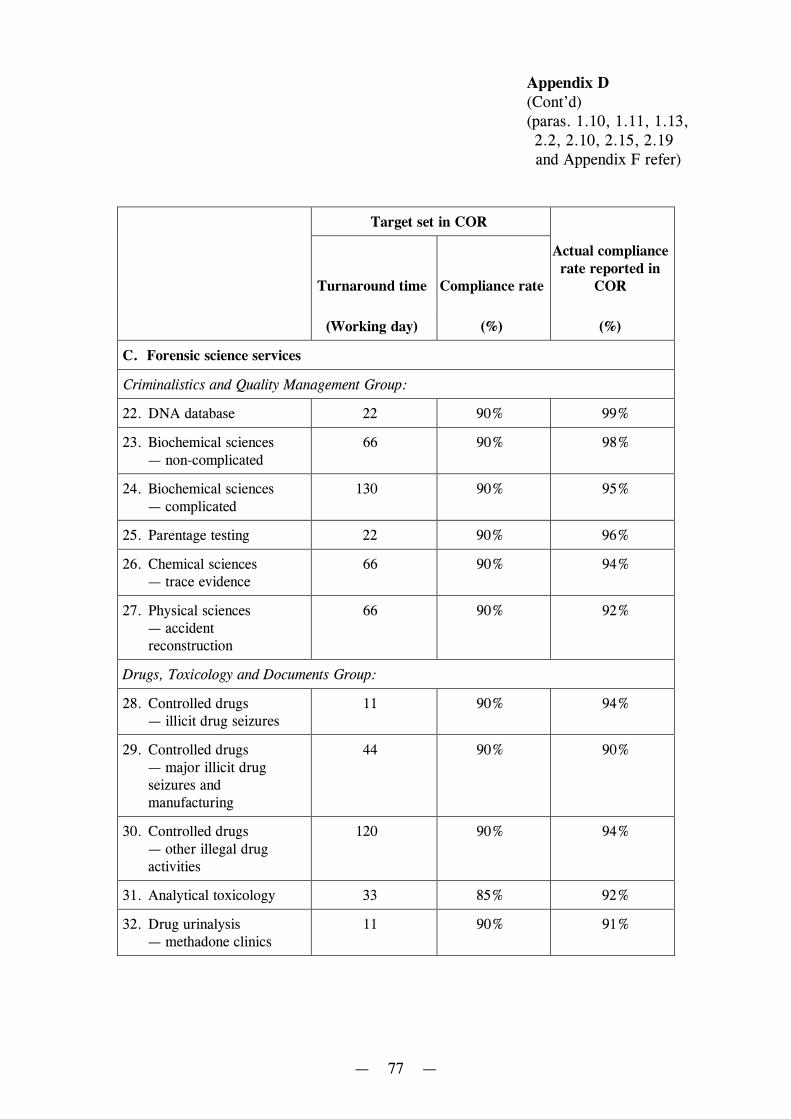
Appendix D(Cont’d)(paras. 1.10, 1.11, 1.13,2.2, 2.10, 2.15, 2.19and Appendix F refer)
— 77 —
Target set in COR
Turnaround time Compliance rate
Actual compliancerate reported in
COR
(Working day) (%) (%)
C. Forensic science services
Criminalistics and Quality Management Group:
22. DNA database 22 90% 99%
23. Biochemical sciences— non-complicated
66 90% 98%
24. Biochemical sciences— complicated
130 90% 95%
25. Parentage testing 22 90% 96%
26. Chemical sciences— trace evidence
66 90% 94%
27. Physical sciences— accidentreconstruction
66 90% 92%
Drugs, Toxicology and Documents Group:
28. Controlled drugs— illicit drug seizures
11 90% 94%
29. Controlled drugs— major illicit drugseizures andmanufacturing
44 90% 90%
30. Controlled drugs— other illegal drugactivities
120 90% 94%
31. Analytical toxicology 33 85% 92%
32. Drug urinalysis— methadone clinics
11 90% 91%
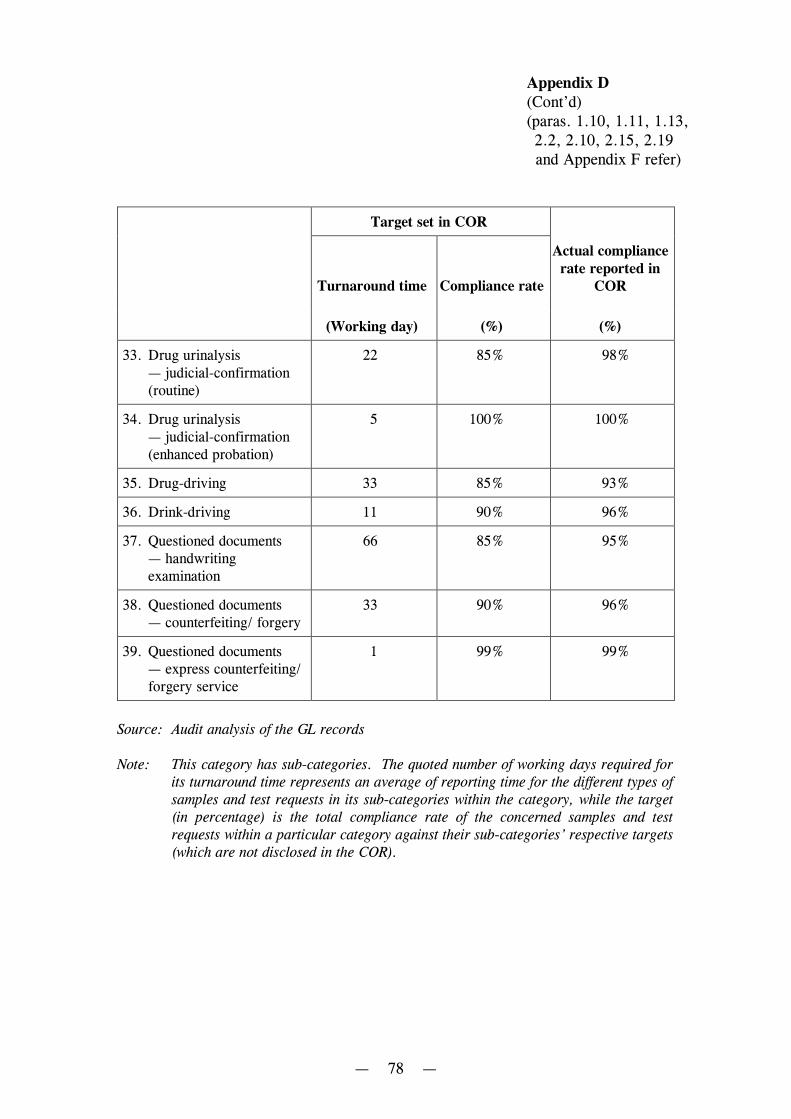
Appendix D(Cont’d)(paras. 1.10, 1.11, 1.13,2.2, 2.10, 2.15, 2.19and Appendix F refer)
— 78 —
Target set in COR
Turnaround time Compliance rate
Actual compliancerate reported in
COR
(Working day) (%) (%)
33. Drug urinalysis— judicial-confirmation(routine)
22 85% 98%
34. Drug urinalysis— judicial-confirmation(enhanced probation)
5 100% 100%
35. Drug-driving 33 85% 93%
36. Drink-driving 11 90% 96%
37. Questioned documents— handwritingexamination
66 85% 95%
38. Questioned documents— counterfeiting/ forgery
33 90% 96%
39. Questioned documents— express counterfeiting/forgery service
1 99% 99%
Source: Audit analysis of the GL records
Note: This category has sub-categories. The quoted number of working days required forits turnaround time represents an average of reporting time for the different types ofsamples and test requests in its sub-categories within the category, while the target(in percentage) is the total compliance rate of the concerned samples and testrequests within a particular category against their sub-categories’ respective targets(which are not disclosed in the COR).
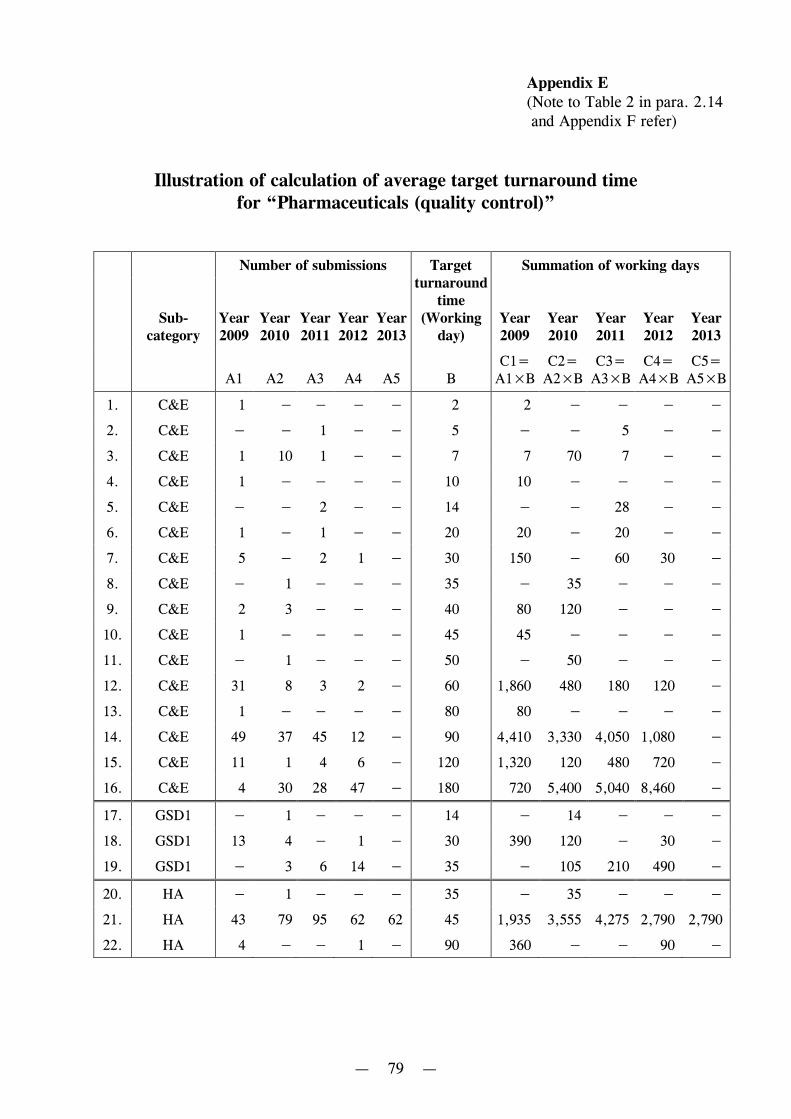
Appendix E(Note to Table 2 in para. 2.14and Appendix F refer)
— 79 —
Illustration of calculation of average target turnaround timefor “Pharmaceuticals (quality control)”
Sub-category
Number of submissions Targetturnaround
time(Working
day)
Summation of working days
Year2009
Year2010
Year2011
Year2012
Year2013
Year2009
Year2010
Year2011
Year2012
Year2013
A1 A2 A3 A4 A5 BC1=
A1×BC2=
A2×BC3=
A3×BC4=
A4×BC5=
A5×B
1. C&E 1 − − − − 2 2 − − − −
2. C&E − − 1 − − 5 − − 5 − −
3. C&E 1 10 1 − − 7 7 70 7 − −
4. C&E 1 − − − − 10 10 − − − −
5. C&E − − 2 − − 14 − − 28 − −
6. C&E 1 − 1 − − 20 20 − 20 − −
7. C&E 5 − 2 1 − 30 150 − 60 30 −
8. C&E − 1 − − − 35 − 35 − − −
9. C&E 2 3 − − − 40 80 120 − − −
10. C&E 1 − − − − 45 45 − − − −
11. C&E − 1 − − − 50 − 50 − − −
12. C&E 31 8 3 2 − 60 1,860 480 180 120 −
13. C&E 1 − − − − 80 80 − − − −
14. C&E 49 37 45 12 − 90 4,410 3,330 4,050 1,080 −
15. C&E 11 1 4 6 − 120 1,320 120 480 720 −
16. C&E 4 30 28 47 − 180 720 5,400 5,040 8,460 −
17. GSD1 − 1 − − − 14 − 14 − − −
18. GSD1 13 4 − 1 − 30 390 120 − 30 −
19. GSD1 − 3 6 14 − 35 − 105 210 490 −
20. HA − 1 − − − 35 − 35 − − −
21. HA 43 79 95 62 62 45 1,935 3,555 4,275 2,790 2,790
22. HA 4 − − 1 − 90 360 − − 90 −
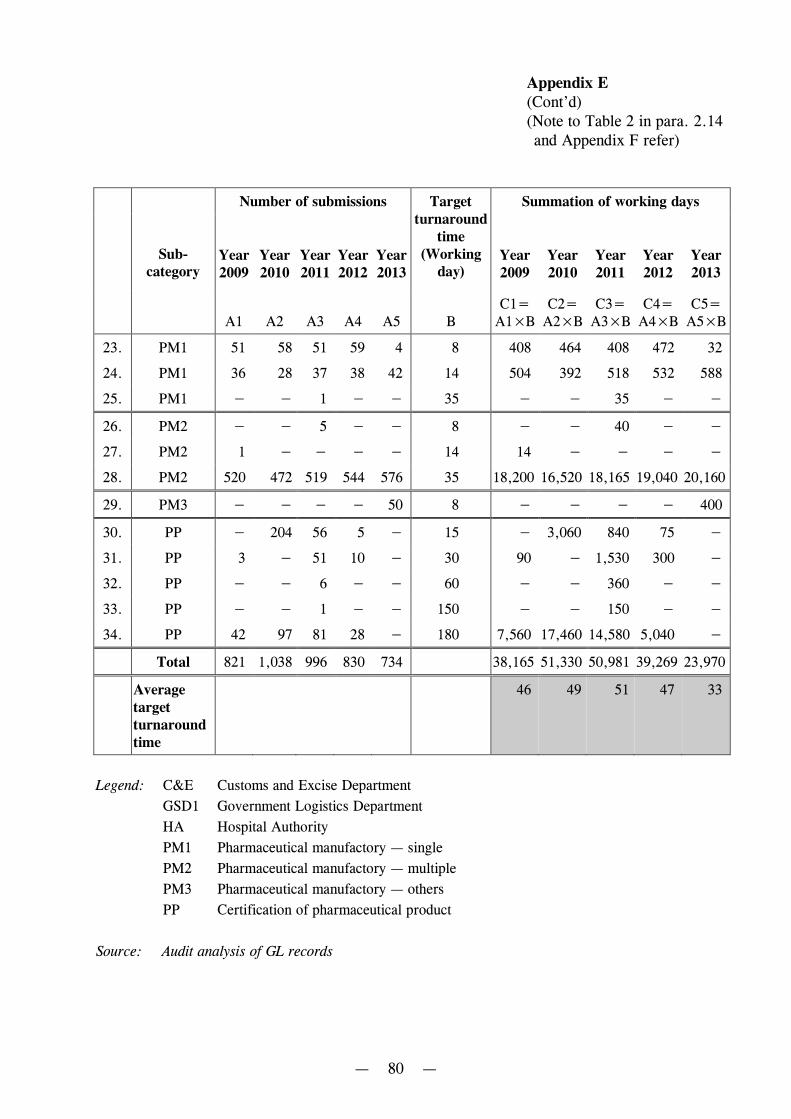
Appendix E(Cont’d)(Note to Table 2 in para. 2.14and Appendix F refer)
— 80 —
Sub-category
Number of submissions Targetturnaround
time(Working
day)
Summation of working days
Year2009
Year2010
Year2011
Year2012
Year2013
Year2009
Year2010
Year2011
Year2012
Year2013
A1 A2 A3 A4 A5 BC1=
A1×BC2=
A2×BC3=
A3×BC4=
A4×BC5=
A5×B
23. PM1 51 58 51 59 4 8 408 464 408 472 32
24. PM1 36 28 37 38 42 14 504 392 518 532 588
25. PM1 − − 1 − − 35 − − 35 − −
26. PM2 − − 5 − − 8 − − 40 − −
27. PM2 1 − − − − 14 14 − − − −
28. PM2 520 472 519 544 576 35 18,200 16,520 18,165 19,040 20,160
29. PM3 − − − − 50 8 − − − − 400
30. PP − 204 56 5 − 15 − 3,060 840 75 −
31. PP 3 − 51 10 − 30 90 − 1,530 300 −
32. PP − − 6 − − 60 − − 360 − −
33. PP − − 1 − − 150 − − 150 − −
34. PP 42 97 81 28 − 180 7,560 17,460 14,580 5,040 −
Total 821 1,038 996 830 734 38,165 51,330 50,981 39,269 23,970
Averagetargetturnaroundtime
46 49 51 47 33
Legend: C&E Customs and Excise Department
GSD1 Government Logistics Department
HA Hospital Authority
PM1 Pharmaceutical manufactory — single
PM2 Pharmaceutical manufactory — multiple
PM3 Pharmaceutical manufactory — others
PP Certification of pharmaceutical product
Source: Audit analysis of GL records
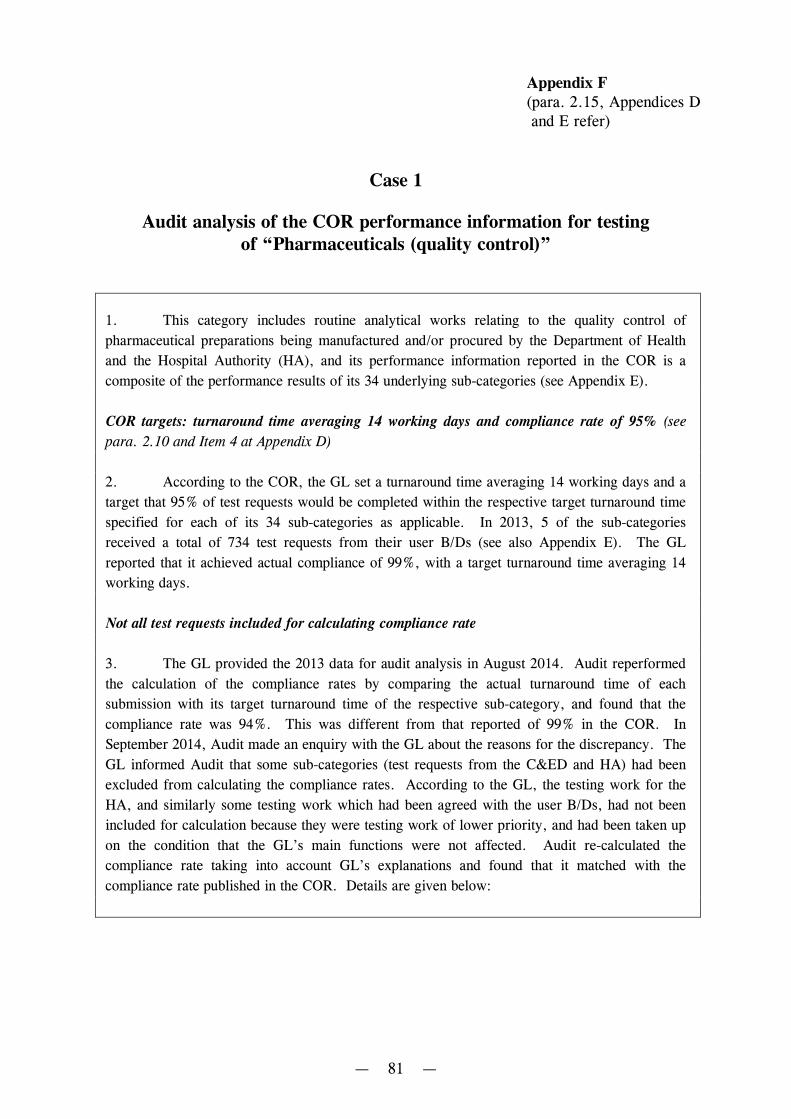
Appendix F(para. 2.15, Appendices Dand E refer)
— 81 —
Case 1
Audit analysis of the COR performance information for testingof “Pharmaceuticals (quality control)”
1. This category includes routine analytical works relating to the quality control of
pharmaceutical preparations being manufactured and/or procured by the Department of Health
and the Hospital Authority (HA), and its performance information reported in the COR is a
composite of the performance results of its 34 underlying sub-categories (see Appendix E).
COR targets: turnaround time averaging 14 working days and compliance rate of 95% (see
para. 2.10 and Item 4 at Appendix D)
2. According to the COR, the GL set a turnaround time averaging 14 working days and a
target that 95% of test requests would be completed within the respective target turnaround time
specified for each of its 34 sub-categories as applicable. In 2013, 5 of the sub-categories
received a total of 734 test requests from their user B/Ds (see also Appendix E). The GL
reported that it achieved actual compliance of 99%, with a target turnaround time averaging 14
working days.
Not all test requests included for calculating compliance rate
3. The GL provided the 2013 data for audit analysis in August 2014. Audit reperformed
the calculation of the compliance rates by comparing the actual turnaround time of each
submission with its target turnaround time of the respective sub-category, and found that the
compliance rate was 94%. This was different from that reported of 99% in the COR. In
September 2014, Audit made an enquiry with the GL about the reasons for the discrepancy. The
GL informed Audit that some sub-categories (test requests from the C&ED and HA) had been
excluded from calculating the compliance rates. According to the GL, the testing work for the
HA, and similarly some testing work which had been agreed with the user B/Ds, had not been
included for calculation because they were testing work of lower priority, and had been taken up
on the condition that the GL’s main functions were not affected. Audit re-calculated the
compliance rate taking into account GL’s explanations and found that it matched with the
compliance rate published in the COR. Details are given below:
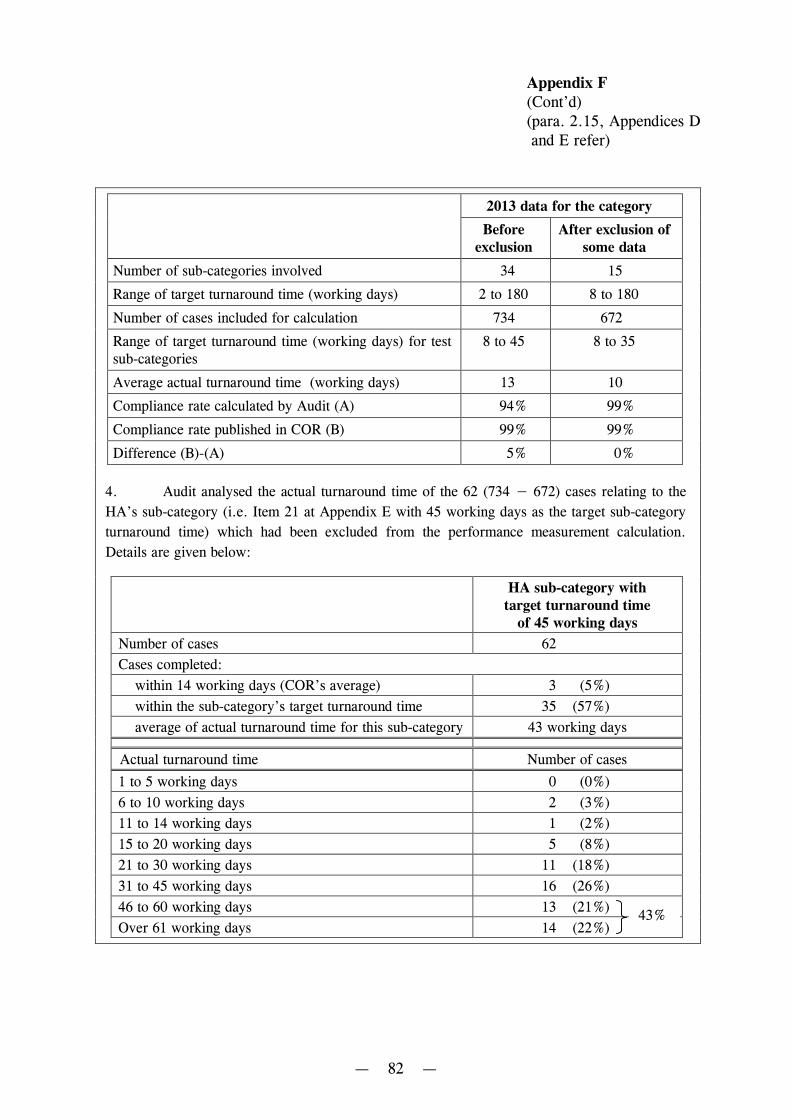
Appendix F(Cont’d)(para. 2.15, Appendices Dand E refer)
— 82 —
2013 data for the category
Beforeexclusion
After exclusion ofsome data
Number of sub-categories involved 34 15
Range of target turnaround time (working days) 2 to 180 8 to 180
Number of cases included for calculation 734 672
Range of target turnaround time (working days) for testsub-categories
8 to 45 8 to 35
Average actual turnaround time (working days) 13 10
Compliance rate calculated by Audit (A) 94% 99%
Compliance rate published in COR (B) 99% 99%
Difference (B)-(A) 5% 0%
4. Audit analysed the actual turnaround time of the 62 (734 − 672) cases relating to the
HA’s sub-category (i.e. Item 21 at Appendix E with 45 working days as the target sub-category
turnaround time) which had been excluded from the performance measurement calculation.
Details are given below:
HA sub-category withtarget turnaround time
of 45 working days
Number of cases 62
Cases completed:
within 14 working days (COR’s average) 3 (5%)
within the sub-category’s target turnaround time 35 (57%)
average of actual turnaround time for this sub-category 43 working days
Actual turnaround time Number of cases
1 to 5 working days 0 (0%)
6 to 10 working days 2 (3%)
11 to 14 working days 1 (2%)
15 to 20 working days 5 (8%)
21 to 30 working days 11 (18%)
31 to 45 working days 16 (26%)
46 to 60 working days 13 (21%)
Over 61 working days 14 (22%)43%
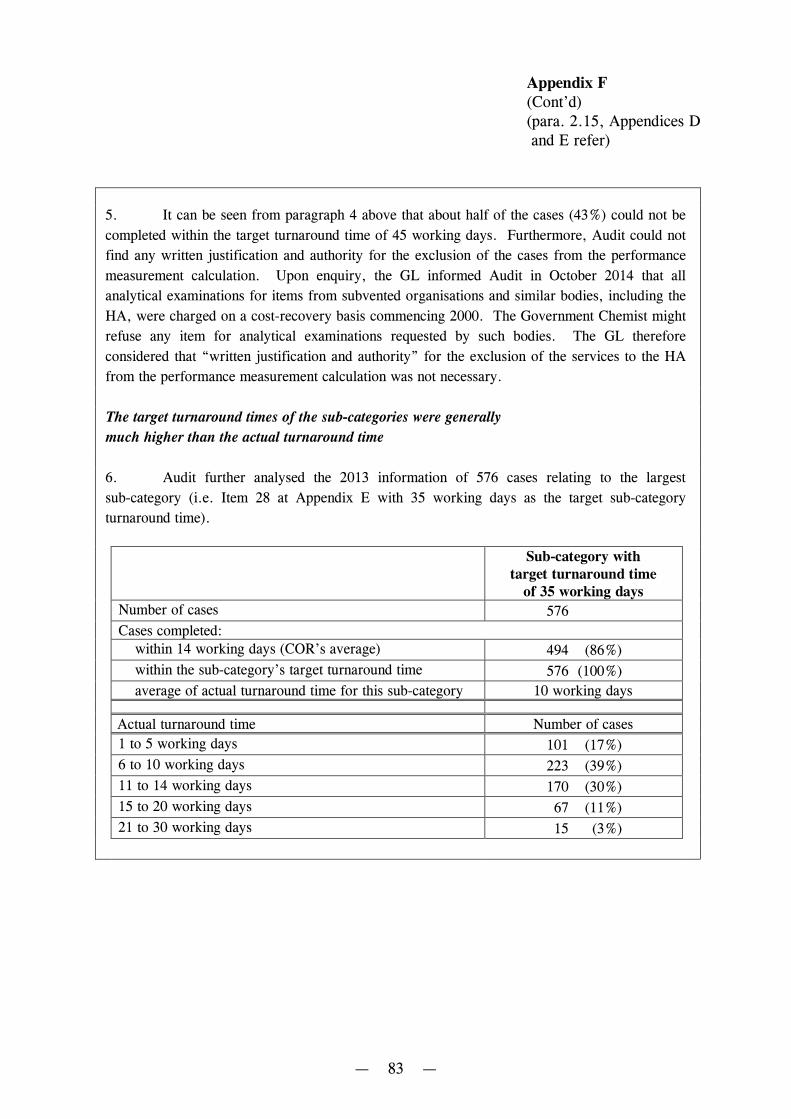
Appendix F(Cont’d)(para. 2.15, Appendices Dand E refer)
— 83 —
5. It can be seen from paragraph 4 above that about half of the cases (43%) could not be
completed within the target turnaround time of 45 working days. Furthermore, Audit could not
find any written justification and authority for the exclusion of the cases from the performance
measurement calculation. Upon enquiry, the GL informed Audit in October 2014 that all
analytical examinations for items from subvented organisations and similar bodies, including the
HA, were charged on a cost-recovery basis commencing 2000. The Government Chemist might
refuse any item for analytical examinations requested by such bodies. The GL therefore
considered that “written justification and authority” for the exclusion of the services to the HA
from the performance measurement calculation was not necessary.
The target turnaround times of the sub-categories were generally
much higher than the actual turnaround time
6. Audit further analysed the 2013 information of 576 cases relating to the largest
sub-category (i.e. Item 28 at Appendix E with 35 working days as the target sub-category
turnaround time).
Sub-category withtarget turnaround time
of 35 working daysNumber of cases 576
Cases completed:within 14 working days (COR’s average) 494 (86%)
within the sub-category’s target turnaround time 576 (100%)
average of actual turnaround time for this sub-category 10 working days
Actual turnaround time Number of cases
1 to 5 working days 101 (17%)
6 to 10 working days 223 (39%)
11 to 14 working days 170 (30%)
15 to 20 working days 67 (11%)
21 to 30 working days 15 (3%)
Appendix F(Cont’d)(para. 2.15, Appendices Dand E refer)
— 84 —
7. It can be seen from paragraph 6 above that the actual case turnaround time was muchshorter than the target 35 working days. The sub-category reported a compliance rate of 100%using the 35 working days as the turnaround compliance measure. In fact, all cases werecompleted within 30 working days and a large majority of them (97%) were completed within20 working days. However, if 14 working days as reported in the COR had been used as themeasure, the compliance rate would have dropped to 86%. Nevertheless, it seems that there isscope for the GL to shorten the target turnaround time for the sub-category to a level of lessthan 35 working days.
Turnaround time stated in the COR not used to measure the compliance rate
8. Audit noted that what was stated as average turnaround time in the COR (average of14 working days) was not what was used by the GL to measure the compliance rate. As can beseen from Appendix E, there were 734 test requests involving 5 sub-categories (Items 21, 23,24, 28 and 29) in 2013. However, the target turnaround times used to measure compliance ofthese 5 sub-categories’ turnaround time were 45, 8, 14, 35 and 8 working days respectively,and not the stated turnaround time of 14 working days mentioned in the COR (see Appendix E).The compliance rates of these 5 sub-categories were 57%, 75%, 90%, 100% and 96%respectively.
9. Upon Audit’s enquiry, the GL explained that the stated turnaround time of14 working days actually represented the average of the turnaround times of the 734 items,which had achieved target turnaround times ranging from 8 to 45 working days. While notingthat the GL did not use the 14 working days to measure the compliance rate, Audit used it as abenchmark to reperform the measurement of compliance rate of this category. Audit found thathad 14 working days been used as the benchmark to measure the turnaround time of all 734items, the actual compliance rate would have been 80%, not the 99% reported (see Item 4 atAppendix D). Even if the HA sub-category had been excluded, the actual compliance ratewould have been 87%.
Audit comments
10. Audit considers that the GL should qualify its performance targets if it intends toexclude certain classes of testing work from calculating the performance result. The GL shouldset down clearly the criteria of testing work that would be excluded from calculation. Auditalso considers that the GL should critically review and monitor the performance targetachievement and set reasonable target turnaround times for sub-categories to further improve itsservice provision. Additionally, the GL should consider revising the description of theperformance indicator to make it clear that the average turnaround time of 14 working days isnot used to measure the compliance rate of the test items, and also consider disclosing the rangeof respective target turnaround times (8 to 45 working days) actually used to measure thecompliance rate.
Source: Audit analysis of GL records
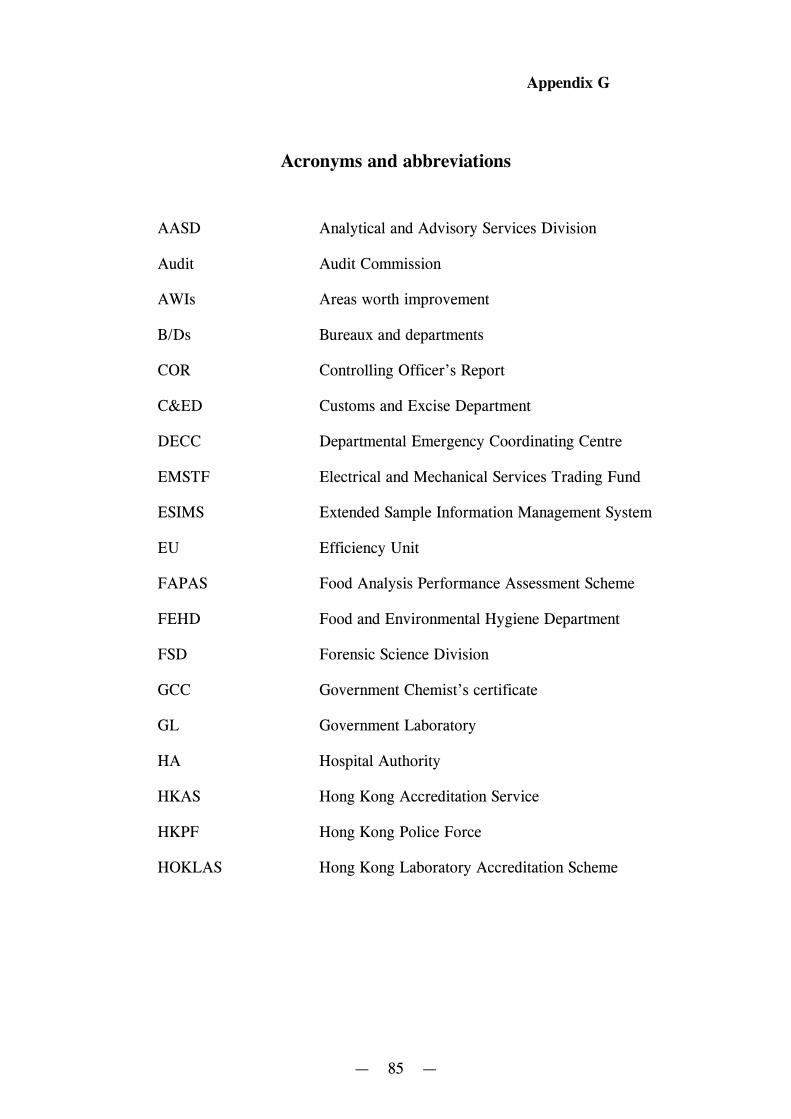
Appendix G
— 85 —
Acronyms and abbreviations
AASD Analytical and Advisory Services Division
Audit Audit Commission
AWIs Areas worth improvement
B/Ds Bureaux and departments
COR Controlling Officer’s Report
C&ED Customs and Excise Department
DECC Departmental Emergency Coordinating Centre
EMSTF Electrical and Mechanical Services Trading Fund
ESIMS Extended Sample Information Management System
EU Efficiency Unit
FAPAS Food Analysis Performance Assessment Scheme
FEHD Food and Environmental Hygiene Department
FSD Forensic Science Division
GCC Government Chemist’s certificate
GL Government Laboratory
HA Hospital Authority
HKAS Hong Kong Accreditation Service
HKPF Hong Kong Police Force
HOKLAS Hong Kong Laboratory Accreditation Scheme
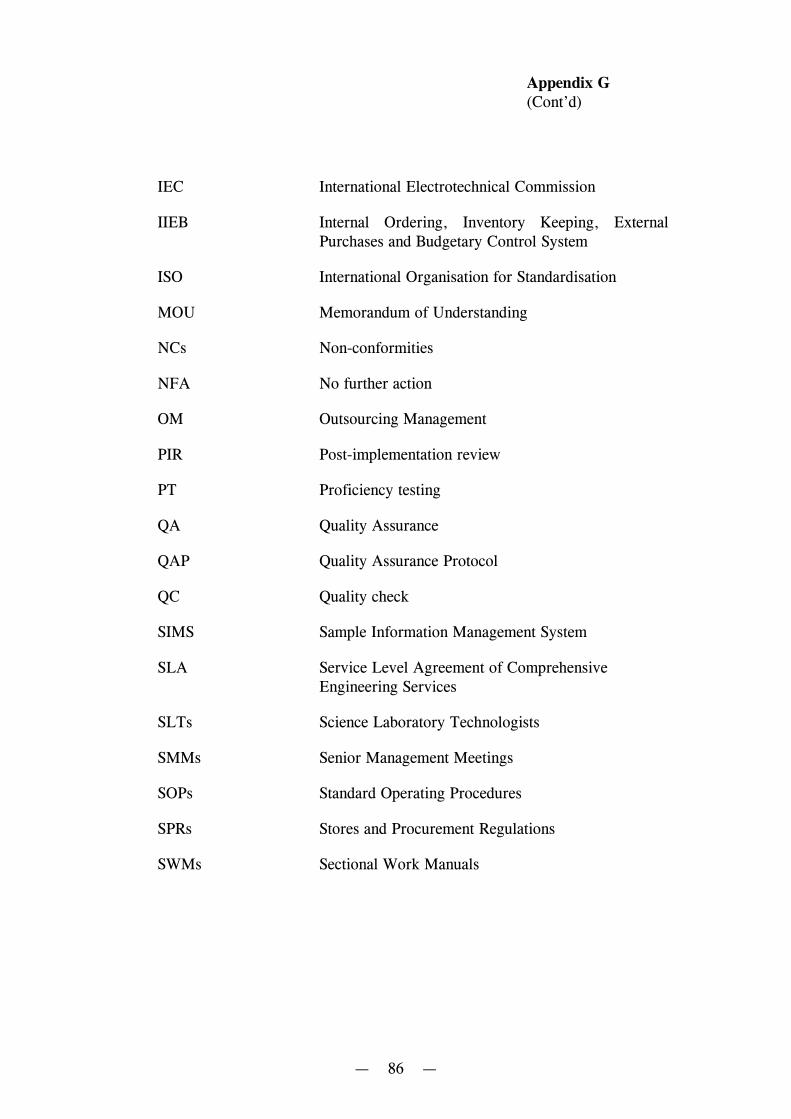
Appendix G(Cont’d)
— 86 —
IEC International Electrotechnical Commission
IIEB Internal Ordering, Inventory Keeping, ExternalPurchases and Budgetary Control System
ISO International Organisation for Standardisation
MOU Memorandum of Understanding
NCs Non-conformities
NFA No further action
OM Outsourcing Management
PIR Post-implementation review
PT Proficiency testing
QA Quality Assurance
QAP Quality Assurance Protocol
QC Quality check
SIMS Sample Information Management System
SLA Service Level Agreement of ComprehensiveEngineering Services
SLTs Science Laboratory Technologists
SMMs Senior Management Meetings
SOPs Standard Operating Procedures
SPRs Stores and Procurement Regulations
SWMs Sectional Work Manuals