Embed Size (px)
DESCRIPTION
Chapter 10. Analysis of Financial Statements. General Accounting Principles. Reliability Understandability Comparability. Primary Financial Statements. The balance sheet enumerates Assets Liabilities Equity. Assets. Current: cash and equivalents, accounts receivable, and inventory - PowerPoint PPT Presentation
Citation preview

Chapter 10
Analysis of Financial Statements

General Accounting Principles
• Reliability
• Understandability
• Comparability

Primary Financial Statements
• The balance sheet enumerates
–Assets
–Liabilities
–Equity

Assets
• Current: cash and equivalents, accounts receivable, and inventory
• Long-term: land, buildings, machinery, and equipment
• Hidden assets

Liabilities
• Current
–.Accounts Payable
–Accruals
–Notes payable
• Long-term

Equity
• Preferred stock
• Common stock
• Additional paid-in capital
• Retained earnings
• Book value
• Book value per share

The Income Statement
• Enumerates–Revenues–Expenses
• To determine–Income (earnings)–Earnings per share

Analysis of Cash Flow: Statement of Cash Flows
• Enumerates–sources of funds–uses of funds
• Determines change in the cash position
• Emphasis on the firm’s ability to generate cash
Cash Inflows
• A decrease in an asset
• An increase in a liability
• An increase in equity

Cash Outflows
• An increase in an asset
• A decrease in a liability
• A decrease in equity
Limitations of Accounting Data
• Nonmeasureable items are excluded
• Aggregations
• Biased estimates of data
• Insufficient challenges by auditors
Depreciation
• Allocation of the cost of plant and equipment over time
• Non-cash expense
• Impact on taxes and cash flow

Depreciation
• Straight-line depreciation
–Equal allocation each year
• Accelerated depreciation
–Larger proportion during the early years
Modified Accelerated Cost Recovery System (MACRS)
• Asset classified by years
3, 5, 7, 10, 15, 20 years
• The half-year convention

Corporate Losses
• Offset earnings from other years
• Carry back 3 years then
• Carry forward

Ratio Analysis
• Builds on a firm's financial statements
• Easy to understand
• Used by both equity investors and creditors
Ratio Analysis
• Facilitates Comparisons– Over time: time-series analysis– Across firms: cross-sectional
analysis
An Application of Ratio Analysis
• The following ratios use Pier I Imports 2002 financial statements
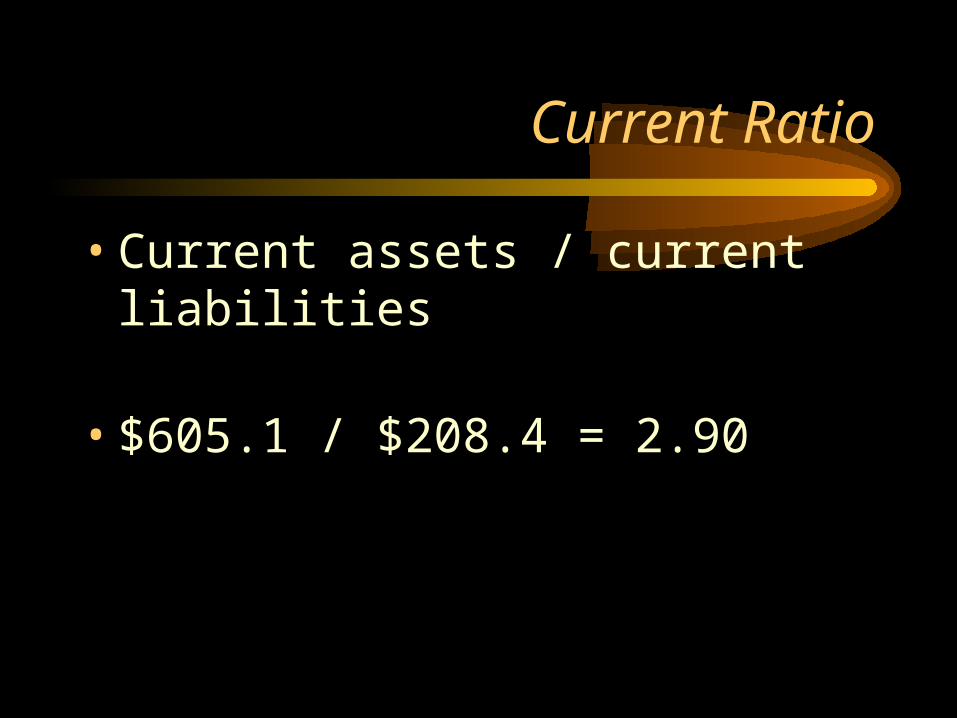
Current Ratio
• Current assets / current liabilities
• $605.1 / $208.4 = 2.90
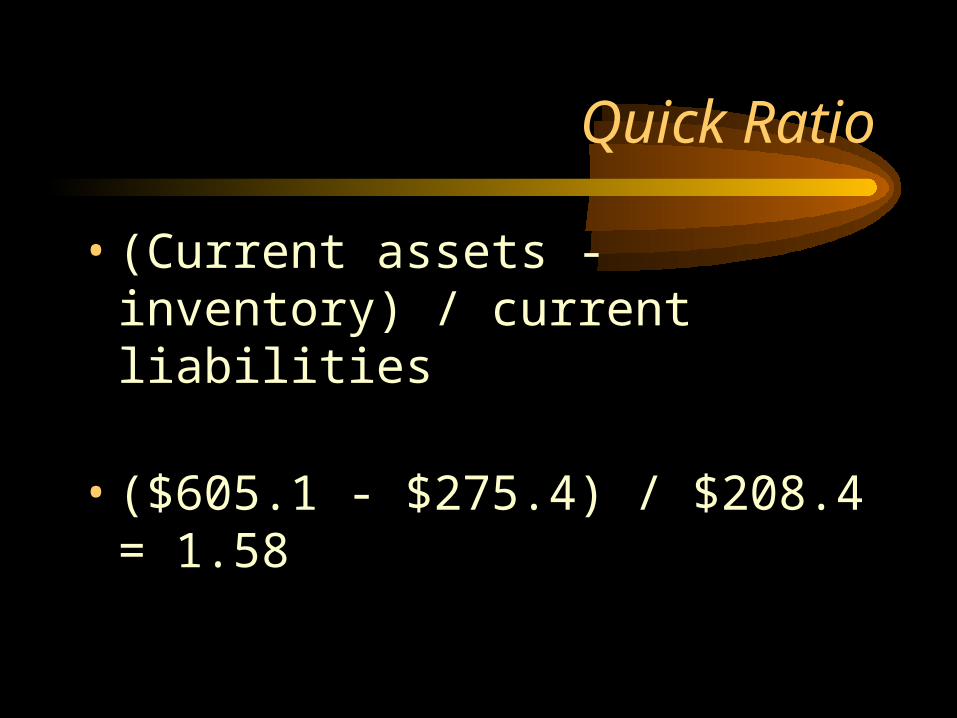
Quick Ratio
• (Current assets - inventory) / current liabilities
• ($605.1 - $275.4) / $208.4 = 1.58
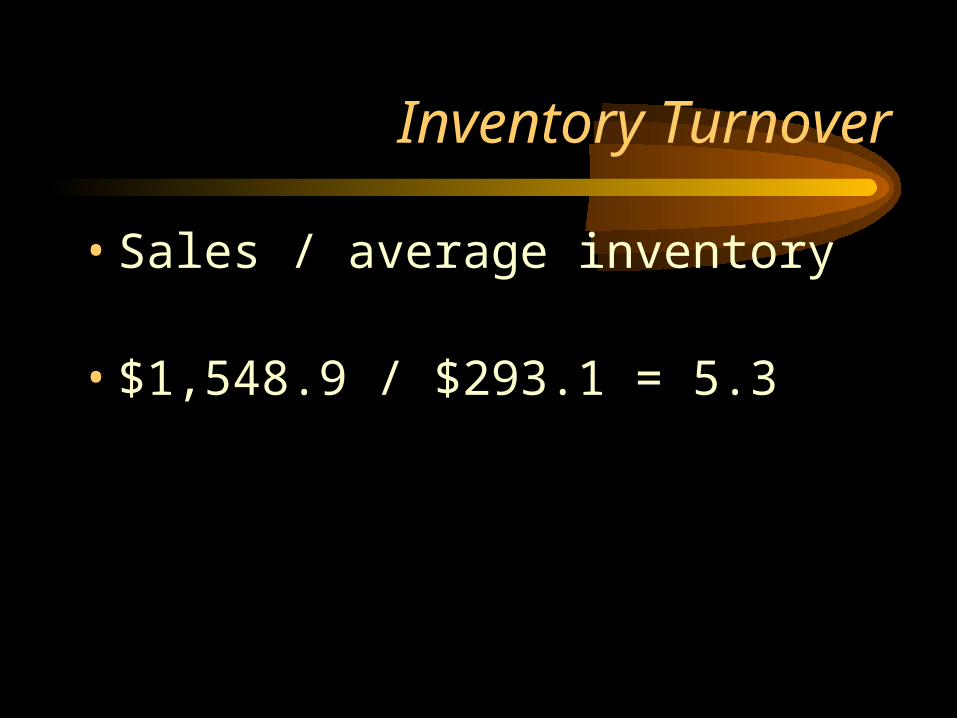
Inventory Turnover
• Sales / average inventory
• $1,548.9 / $293.1 = 5.3
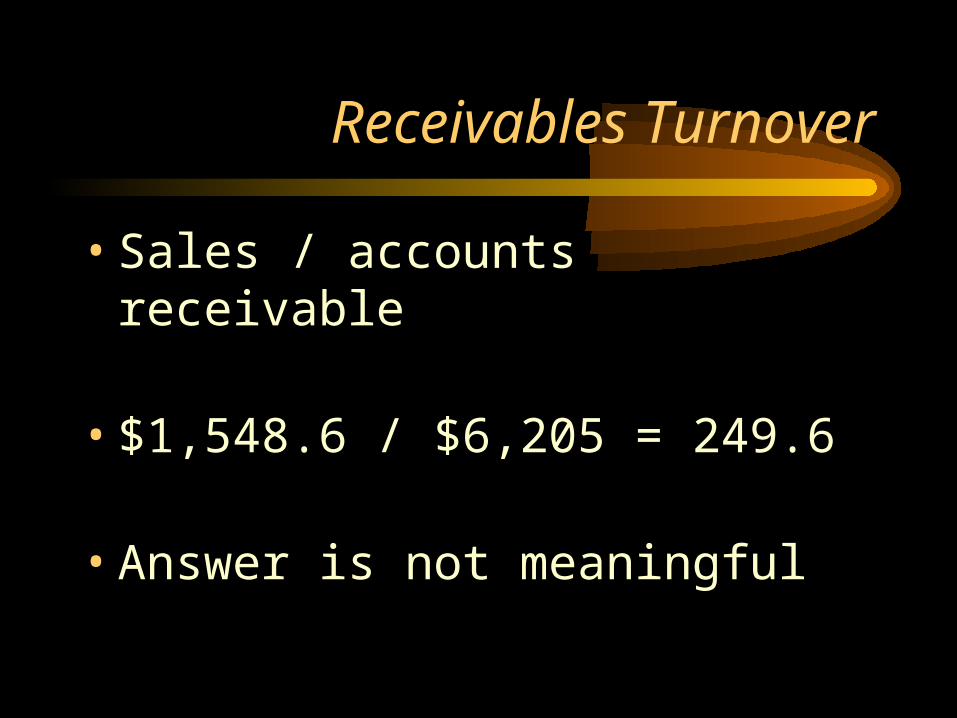
Receivables Turnover
• Sales / accounts receivable
• $1,548.6 / $6,205 = 249.6
• Answer is not meaningful
Receivables Turnover
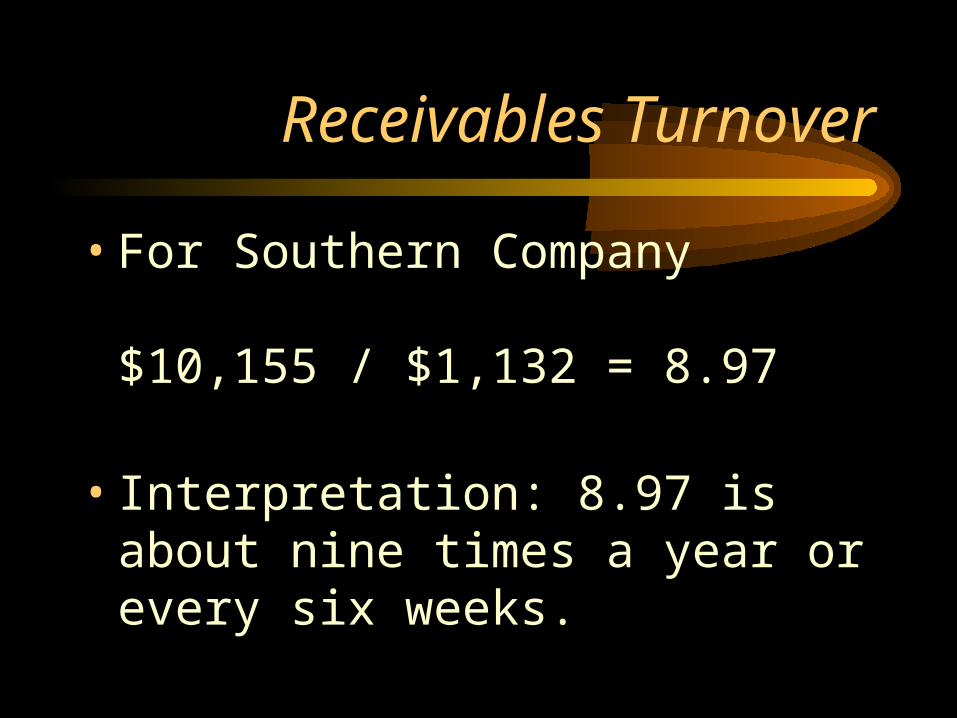
• For Southern Company
$10,155 / $1,132 = 8.97
• Interpretation: 8.97 is about nine times a year or every six weeks.
Average Collection Period(days sales outstanding)
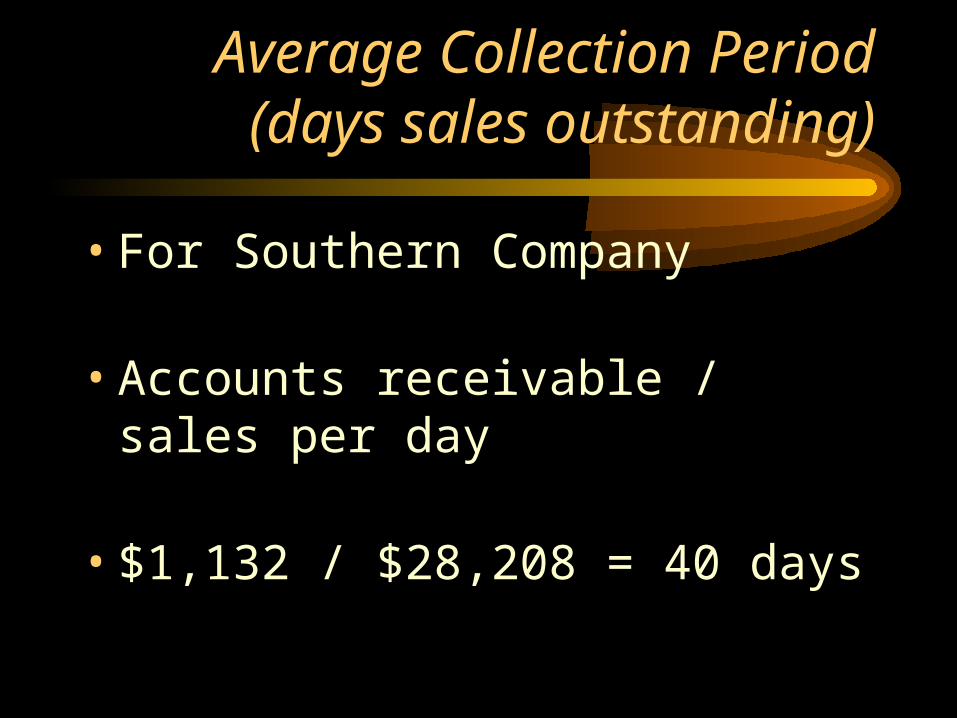
• For Southern Company
• Accounts receivable / sales per day
• $1,132 / $28,208 = 40 days

Fixed Asset Turnover
• Sales / fixed assets
• $1,159 / $209.9 = 7.38
Total Asset Turnover
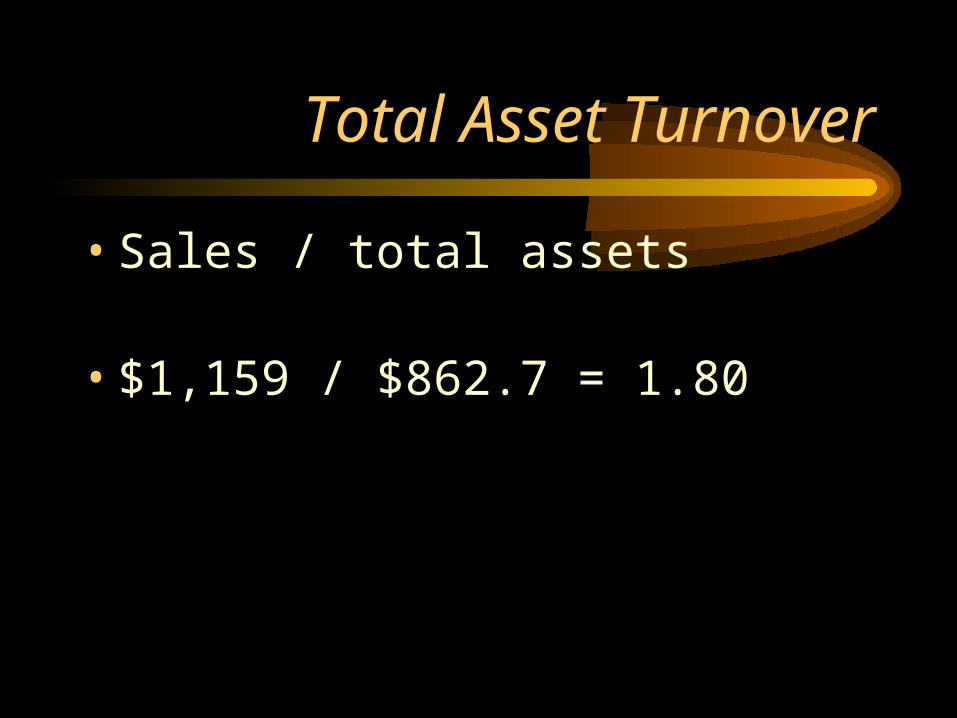
• Sales / total assets
• $1,159 / $862.7 = 1.80
Gross Profit Margin
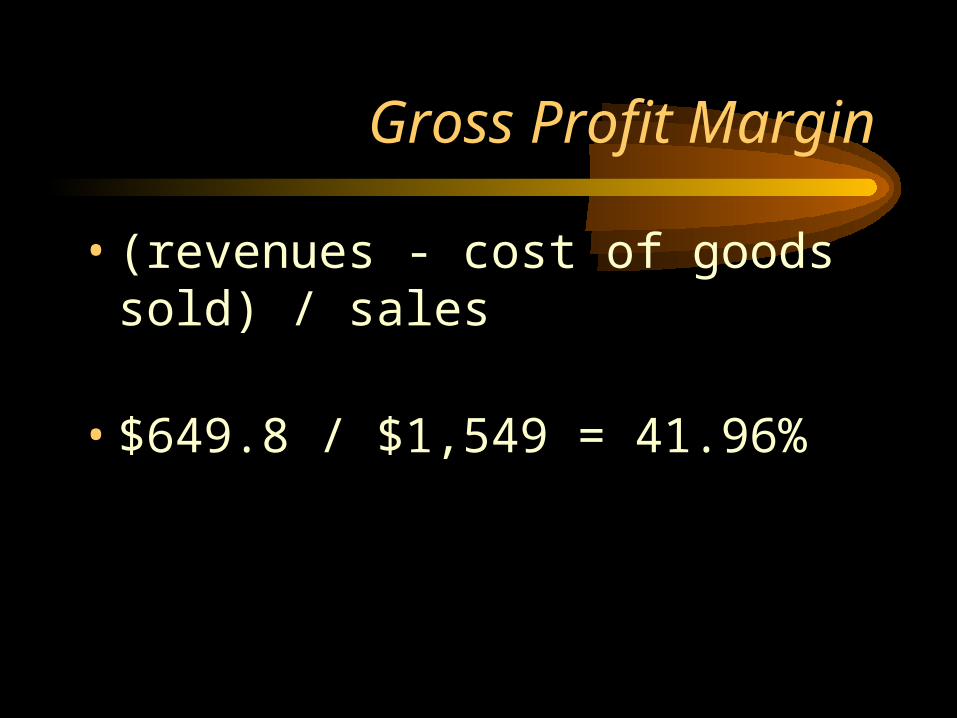
• (revenues - cost of goods sold) / sales
• $649.8 / $1,549 = 41.96%
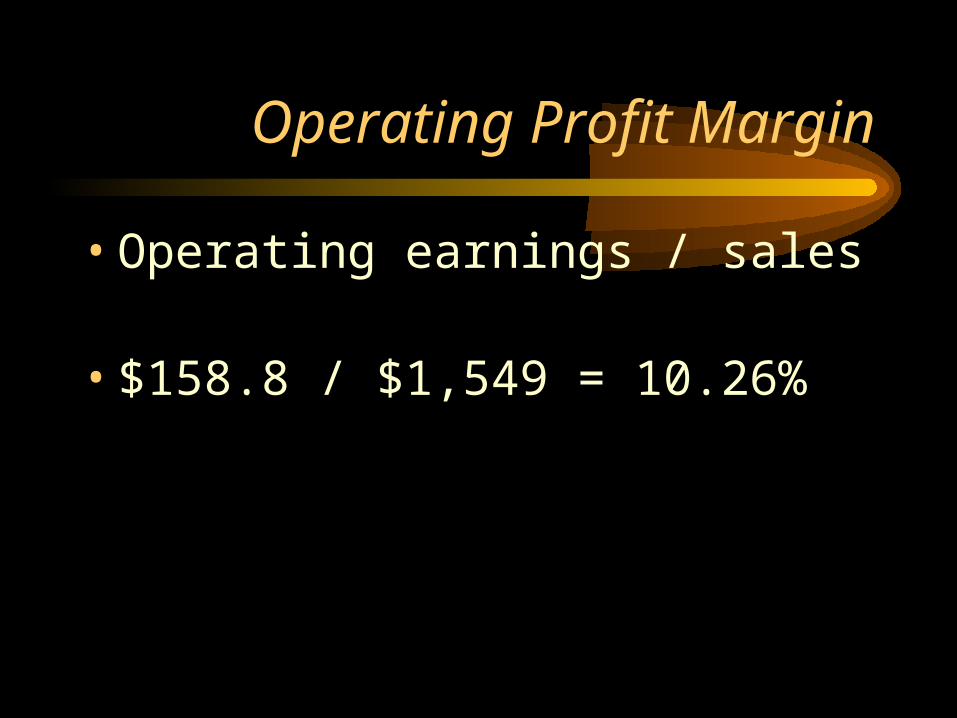
Operating Profit Margin
• Operating earnings / sales
• $158.8 / $1,549 = 10.26%
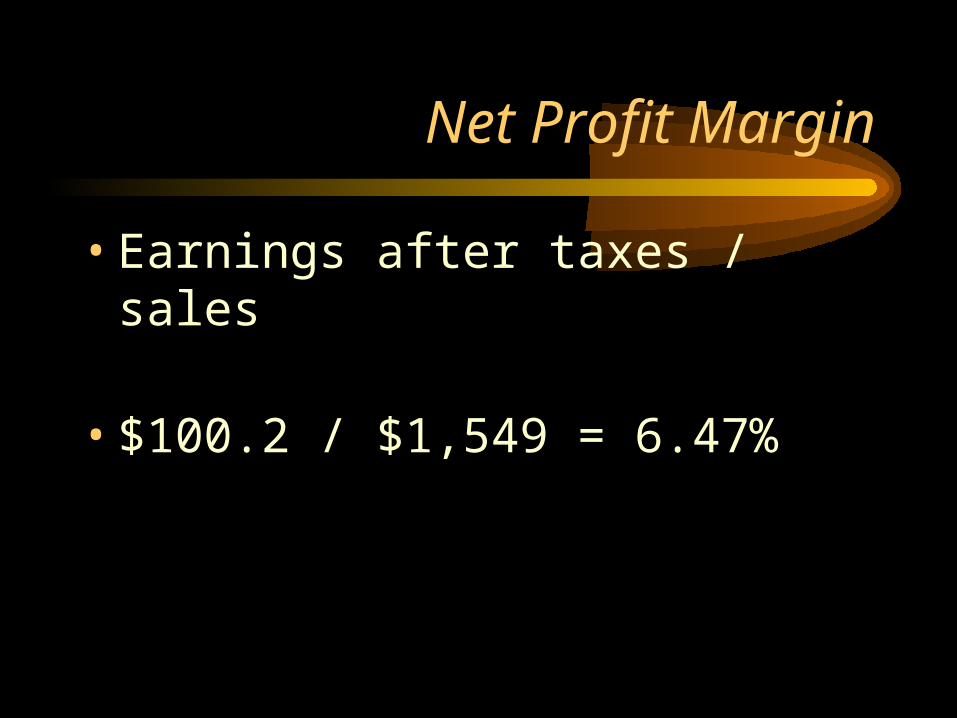
Net Profit Margin
• Earnings after taxes / sales
• $100.2 / $1,549 = 6.47%
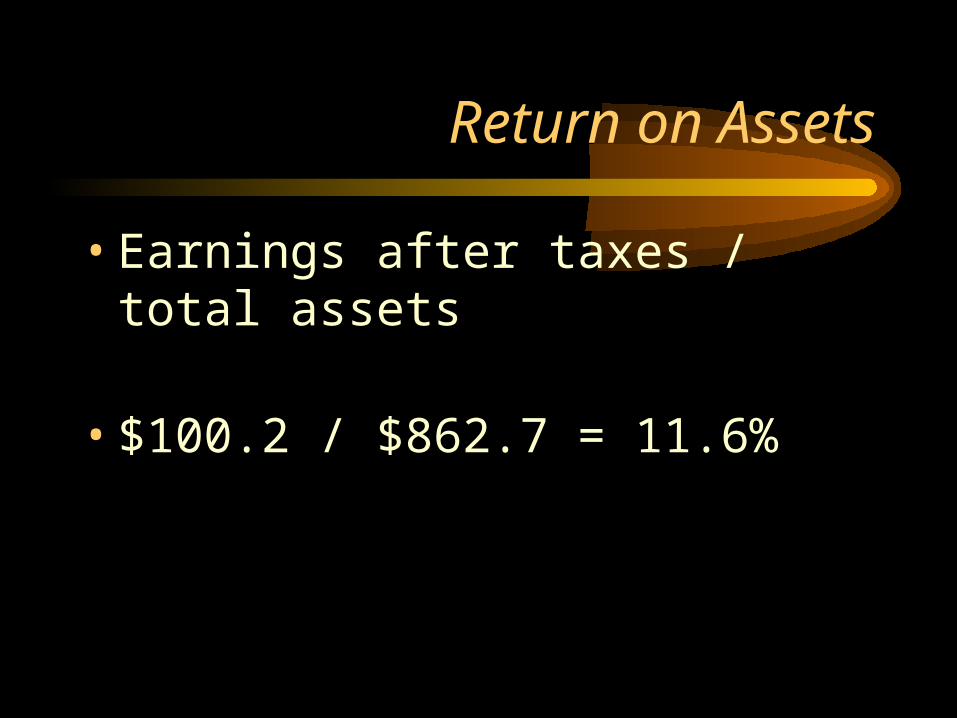
Return on Assets
• Earnings after taxes / total assets
• $100.2 / $862.7 = 11.6%
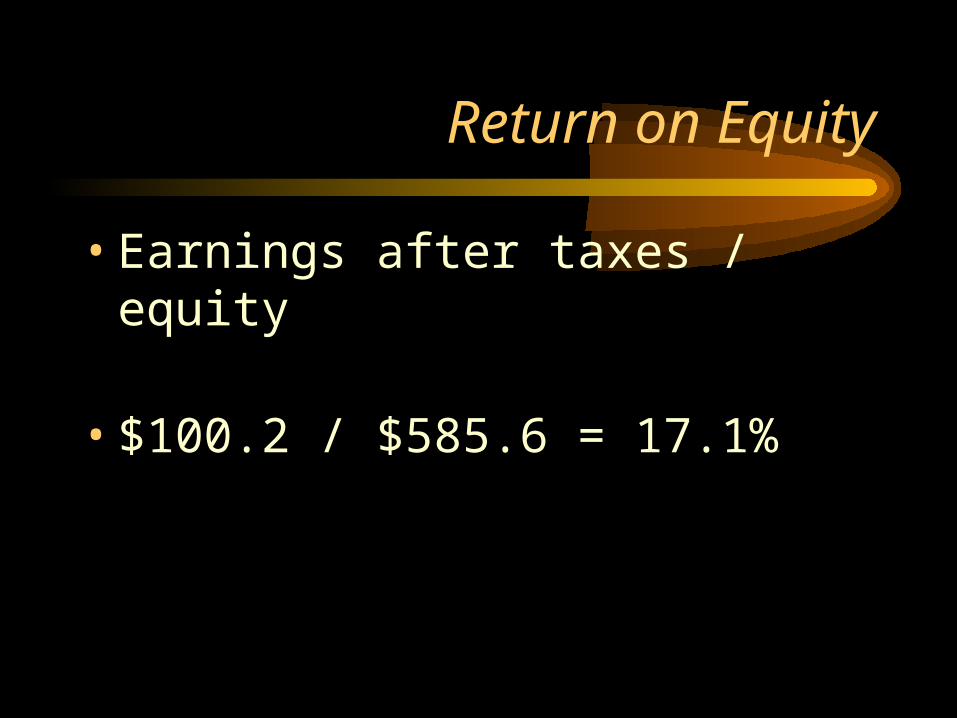
Return on Equity
• Earnings after taxes / equity
• $100.2 / $585.6 = 17.1%

Return on Common Equity
• Adjusts for preferred stock
• If no preferred, ratio is same as return on equity
Basic Earning Power
• EBIT / total assets
• $158.8 / $862.7 = 18.47%
Debt Ratio
• Debt / total assets
• $277.0 / $862.7 = 32.1%
Debt to Equity Ratio
• Debt / equity
• $277.0 / $585.7 = 47.3%
DuPont System of Analysis
• Combines
–Net profit margin
–Turnover
–Leverage
• Helps identify source of weakness
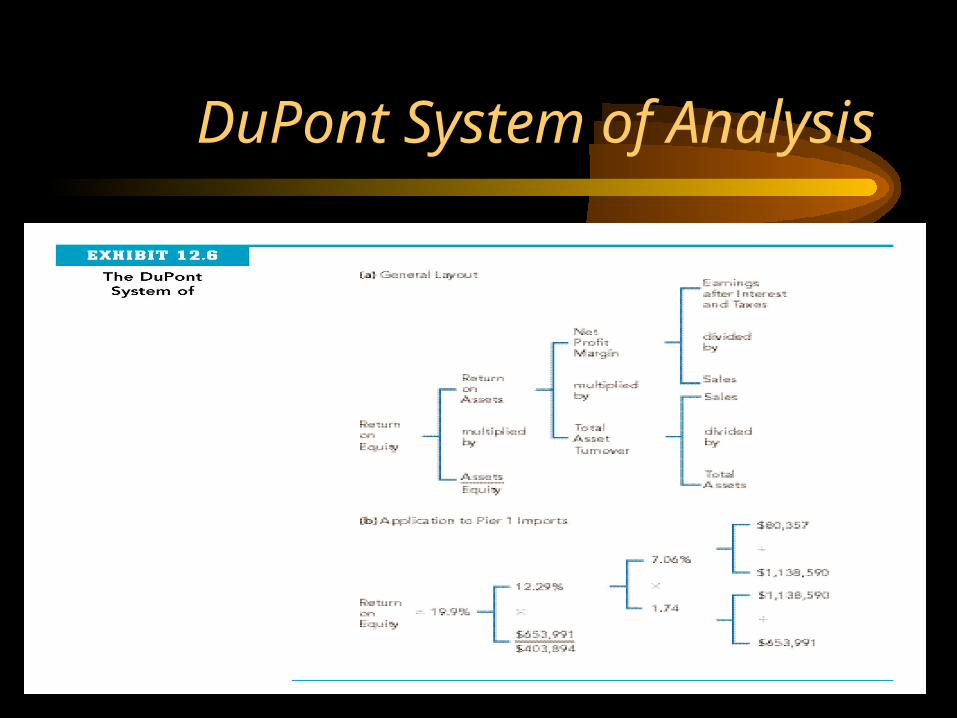
DuPont System of Analysis
Times-interest-earned
• Earnings before interest and taxes / interest
• $158,813 / $-184 = -863.1
• Interest earned exceeded interest paid.
Ratio Comparisons
• Ratios of firms within an industry– tend to have similar numerical values
– differences in numerical values are reasons for further analysis
Problems for Interpretation
• Different definitions for the same ratio
• Historical data may be outmoded
• Non-recurring items
• Internet sources differ