Embed Size (px)
Citation preview
1
Chapter 1 Satellite Remote Sensing Monitoring Technology of Forest Damages Caused by Pine Caterpillars
Chapter 1
Satellite Remote Sensing Monitoring Technology of Forest Damages Caused by Pine Caterpillars
On July 23, 1972, Landsat-1, originally named ERTS-1, was launched from Vandenburg Air Force Base in California.
The launch of Landsat-1 was the beginning of a new era in monitoring the Earth,s natural resources. Today, acquisition
of resource data from Earth-orbiting satellites is commonplace. This chapter discusses the progress and feasibility of
satellite imagery for monitoring and assessment of forest conditions, the characteristics of two satellites used for
detecting forest health presently in orbit, and applications in forest health protection in China.
1. Spectral properties of vegetation and principle of monitoring forestdamage with remote sensing
There is a typical reflectance curve for healthy vegetation. The absorption features centered at approximately
0.48 and 0.68 m represent strong chlorophyll absorption. The reflectance at 0.52-0.60 m indicates the green portion
of visible light, which is not absorbed. The strong reflectance feature extending from approximately 0.75 to 1.3 m, referred
to as the near-infrared (NIR) plateau, characterizes healthy leaf tissue. The sharp rise in the curve between 0.68 m
and the NIR plateau is referred to as the red edge. The slope and position of this red edge have been directly correlated
with leaf chlorophyll concentrations.
Chlorophyll and carotenoid concentrations may vary, and additional pigments may build up within leaves in
response to stress. Such variations can appear as subtle spectral changes in the visible and red-edge portions of
reflectance curves from vegetation in decline. The position and slope of the red edge also change as healthy leaves
progress from active photosynthesis through senescence. Such phenological and health information is an important
aspect of the remote detection and recognition of stress response (damage) in vegetation.
High reflectance values in the NIR plateau characterize healthy leaf tissue. Reflectance in this region is due to
multiple refractions occurring along cell wall-water-air interfaces as a result of differing refraction indices for these leaf
components. The studies suggest that changes in cellular health within leaves are associated with reduced reflectance
along the NIR plateau. Such spectral properties, which can be remotely detected, may provide information regarding
cellular health in vegetation over large areas.
The reflectance values in the 1.65 m and 2.20 m region can provide an accurate indication of leaf water content.
Study results suggest that spectral data from the reflective short-wave infrared (SWIR) may be very useful in detecting
various levels of water-related stress in vegetation.
Therefore the near-infrared (NIR) and short-wave infrared (SWIR) are the important spectral regions for forest
resources change. If we want to detect the forest conditions effectively, we had better choose satellite sensors that
have NIR and SWIR channels.
2. Strengths and weaknesses of remote sensing techniques in monitoringforest damage
Earth-orbiting satellites have the capacity to view and capture large areas of land in a single image, making
them an excellent tool for monitoring and assessment of land cover and land use. Another strength of satellites is
¦ Ì
¦ Ì
¦ Ì
¦ Ì
¦ Ì ¦ Ì
2
Chapter 1 Satellite Remote Sensing Monitoring Technology of Forest Damages Caused by Pine Caterpillars
that they return to the same point over the Earth,s surface at regular intervals (e.g., Landsat satellite,s return time
or temporal resolution was 16 days). Provided that cloud-free or near-cloud-free weather conditions exist, satellites
can obtain data at predictable intervals for monitoring change. The satellite data is received in digital form, ready for
computer-assisted analysis, and many Earth-orbiting satellites have spectral sensitivities in the visible, near-IR, and
thermal-IR regions of the electromagnetic spectrum(EMS). And the regions of EMS can make it easier for us to identify
different kinds of vegetation and vegetation condition.
The major weakness of the Earth-orbiting satellites in operation today, especially with regard to forest health
protection, is their relatively low spatial resolution and low temporal resolution. While present day spatial resolutions
such as Landsat TM satellite are adequate for many natural resources applications£such as analysis of land form,
land use, crop forecasting, and land cover mapping, they are still unable to resolve the fine to moderate levels of
forest damage of vital interest to forest health specialists. Generally the biowindows of forest diseases and insects
damage is less than 15 days. Consequently, use of data from Earth-orbiting satellites in forest health protection has,
to date, been limited to test and demonstration projects. Fortunately some high spatial resolution satellite will be launched
in succession in the coming years. And they can obtain data in the shorter intervals. Therefore we can be full of
hope for satellite application in forest protection.
3. Landsat and its data propertiesThe Landsat satellites have been acquiring Earth resource data since 1972 and all have been in a polar orbit.
Landsats 1, 2, and 3 returned over the same point on the Earth,s surface every 18 days, and Landsats 4, 5, and 7
returned over the same point on the Earth,s surface every 16 days. (Landsat 6 was lost in space.)
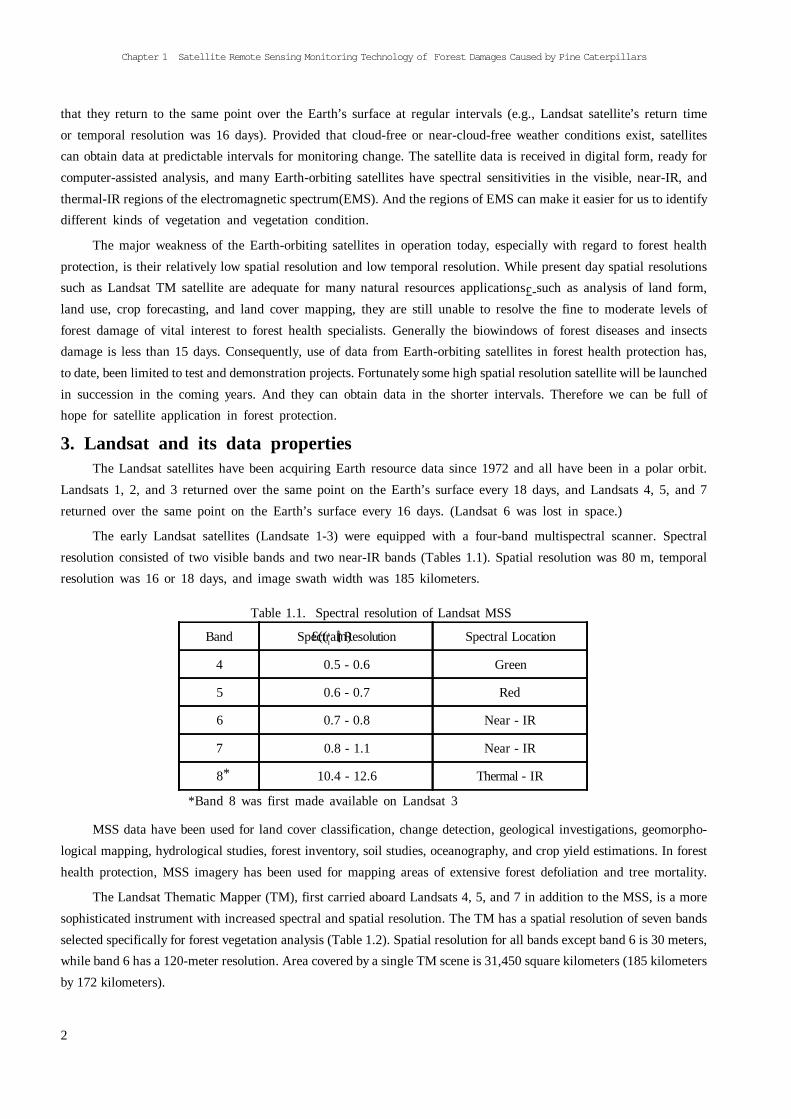
The early Landsat satellites (Landsate 1-3) were equipped with a four-band multispectral scanner. Spectral
resolution consisted of two visible bands and two near-IR bands (Tables 1.1). Spatial resolution was 80 m, temporal
resolution was 16 or 18 days, and image swath width was 185 kilometers.
Table 1.1. Spectral resolution of Landsat MSS
MSS data have been used for land cover classification, change detection, geological investigations, geomorpho-
logical mapping, hydrological studies, forest inventory, soil studies, oceanography, and crop yield estimations. In forest
health protection, MSS imagery has been used for mapping areas of extensive forest defoliation and tree mortality.
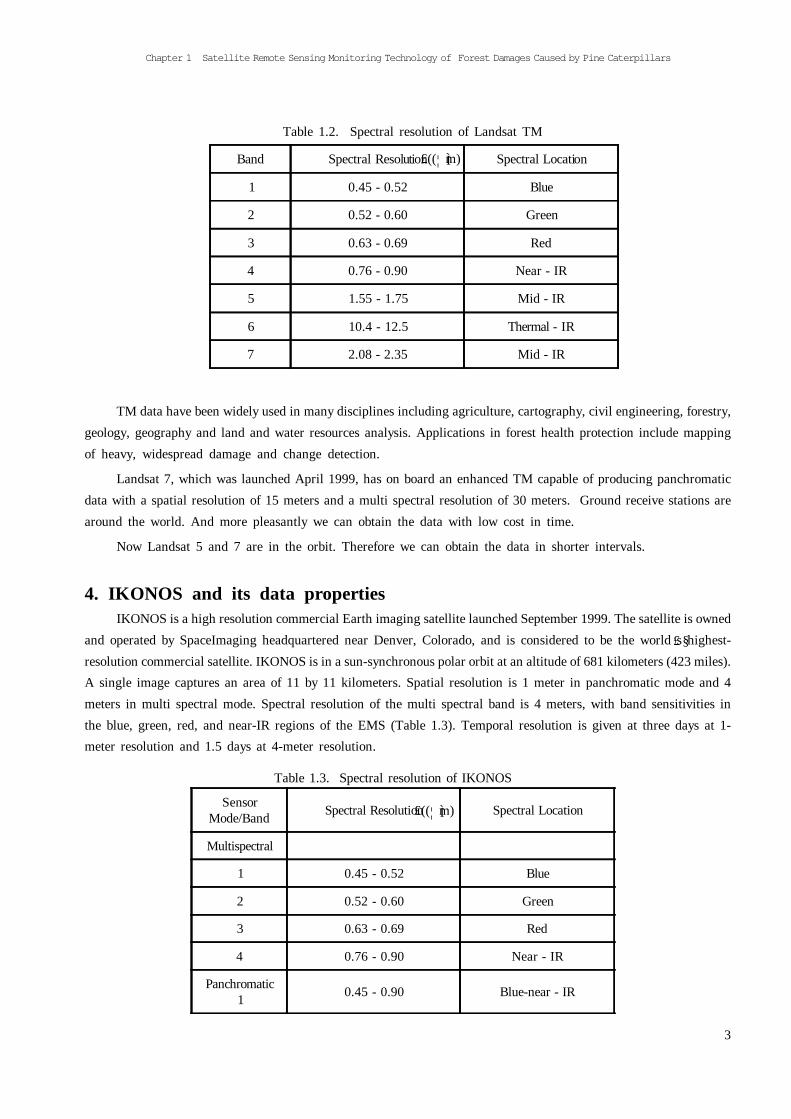
The Landsat Thematic Mapper (TM), first carried aboard Landsats 4, 5, and 7 in addition to the MSS, is a more
sophisticated instrument with increased spectral and spatial resolution. The TM has a spatial resolution of seven bands
selected specifically for forest vegetation analysis (Table 1.2). Spatial resolution for all bands except band 6 is 30 meters,
while band 6 has a 120-meter resolution. Area covered by a single TM scene is 31,450 square kilometers (185 kilometers
by 172 kilometers).
*Band 8 was first made available on Landsat 3
*
£(( m)¦ ÌBand Spectral Resolution Spectral Location
4 0.5 - 0.6 Green
5 0.6 - 0.7 Red
6 0.7 - 0.8 Near - IR
7 0.8 - 1.1 Near - IR
8 10.4 - 12.6 Thermal - IR
3
Chapter 1 Satellite Remote Sensing Monitoring Technology of Forest Damages Caused by Pine Caterpillars
TM data have been widely used in many disciplines including agriculture, cartography, civil engineering, forestry,
geology, geography and land and water resources analysis. Applications in forest health protection include mapping
of heavy, widespread damage and change detection.
Landsat 7, which was launched April 1999, has on board an enhanced TM capable of producing panchromatic
data with a spatial resolution of 15 meters and a multi spectral resolution of 30 meters. Ground receive stations are
around the world. And more pleasantly we can obtain the data with low cost in time.
Now Landsat 5 and 7 are in the orbit. Therefore we can obtain the data in shorter intervals.
4. IKONOS and its data propertiesIKONOS is a high resolution commercial Earth imaging satellite launched September 1999. The satellite is owned
and operated by SpaceImaging headquartered near Denver, Colorado, and is considered to be the world s highest-
resolution commercial satellite. IKONOS is in a sun-synchronous polar orbit at an altitude of 681 kilometers (423 miles).
A single image captures an area of 11 by 11 kilometers. Spatial resolution is 1 meter in panchromatic mode and 4
meters in multi spectral mode. Spectral resolution of the multi spectral band is 4 meters, with band sensitivities in
the blue, green, red, and near-IR regions of the EMS (Table 1.3). Temporal resolution is given at three days at 1-
meter resolution and 1.5 days at 4-meter resolution.
Table 1.2. Spectral resolution of Landsat TM
Table 1.3. Spectral resolution of IKONOS
SensorMode/Band Spectral Resolution Spectral Location
Multispectral
1 0.45 - 0.52 Blue
2 0.52 - 0.60 Green
3 0.63 - 0.69 Red
4 0.76 - 0.90 Near - IR
Panchromatic1 0.45 - 0.90 Blue-near - IR
£(( m)¦ Ì
£(( m)¦ Ì
Band Spectral Resolution Spectral Location
1 0.45 - 0.52 Blue
2 0.52 - 0.60 Green
3 0.63 - 0.69 Red
4 0.76 - 0.90 Near - IR
5 1.55 - 1.75 Mid - IR
6 10.4 - 12.5 Thermal - IR
7 2.08 - 2.35 Mid - IR
£ §
4
Chapter 1 Satellite Remote Sensing Monitoring Technology of Forest Damages Caused by Pine Caterpillars
It is anticipated that IKONOS imagery will find applications in precision farming and agriculture, mapping, natural
resources management, urban planning and zoning, oil and gas exploration, travel and tourism etc. Although it is difficult
to obtain the data now, we are confident to its application in forest health protection.
More high resolution commercial Earth imaging satellites will be in orbit in the coming years. They can promote
the application of satellite imagery in forest healthy protection.
5. Applications (pine caterpillar defoliation mapping) in ChinaIn the past ten years, forest damage caused by diseases and insects has become more and more serious and
resulted in tremendous loss in APEC members. One of the main reasons is that people can not make timely and precisely
monitoring and make long-term forecasting about forest diseases and insects so that we can not control it at the
beginning. Although people can not precisely predict the occurrence and development of the diseases and insects
on current science and technology level, we can detect the early calamity location and do our best to minimize the
loss. The following introduces a method to detect the early damage areas with TM data and make a rudimental
understanding about the process of occurrence and development of forest diseases and insects through comparing
and analyzing the recent year,s data. It is admitted that satellite imagery data can make effective monitoring for pest
origin. This opinion provides the possibility of making macroscopic monitoring about the important forest diseases
and insects with the satellite remote sensing technology and provides a new technology for prevention of damage.
At the same time, through analyzing the dynamic change of forest pest damage and the biologic property of forest
diseases and insects, people can make long-term forecast of forest diseases and insects to realize the sustainable
development of forestry.
In China, forest diseases and insects occurred vast area in recent years, 80,000 square kilometer per year, have
resulted in 5 billion yuan direct economic loss. Frequent forest diseases and insects have maintained high level and
has strong tendency to rise. Among the top ten types of forest diseases and insects, pine caterpillar disaster ranks
first. So effective monitoring and controlling of forest diseases and insects has special value in reducing the loss
of forest pest damage of our country.
In the past half century, the science of forest protection has made rapid progress. But it is a passive procedure.
Forest biological disaster control at the turn of the century is confronted with great crisis.
For the artificial forest, there are four problems to be resolved in China.
•Some serious biological disasters in history have not been controlled, for example, the continuous harm of pine-
moth Dendrolimous pinidiatrea, the continuous menace to£¢Three North Shelter Forest£¢system caused by poplar
borer Saperda calcarata, Valsa sordida and Dothiorella gregaria.
• Some secondary forest biological disasters are turning to main menace. For instance, Pine Diprionidae,s occurrence
in large scale is menacing the shelter forest of Three Gorges in Chongqing Municipality, and paper pulp industry in
south China is being threatened by the extension of pseudomnas solanacearum.
•Quarantining pests are becoming menace. Pine,s withering caused by Bursaphelenchus xylophilus through the medium
of Monochamus alternatus still continues to spread and ruin pine woods.
•With the deterioration of whole ecological environment, ecological diseases break out into disasters, as an example,
recently, plenty of city green trees have died of Valsa in northeast and north China.
5
Chapter 1 Satellite Remote Sensing Monitoring Technology of Forest Damages Caused by Pine Caterpillars
For the natural forest, there are two problems to be resolved in China.
•Natural forest not exploitation and no direct disturbing and distroyed by human being. Stable forest ecosystem has
occured disaster because of the change of the global climate. Such as the Lophodermium sp. causes the Abies death
in large belt area in Xizang Autonomous Region.
•Natural forest disturbed and destroyed by human being. The biological disasters are very serious because of the
over-exploitation in this kind of forest.
5.1 IntroductionMasson pine (Pinus massoniana Lamb ) is one of the principal timber species in south China and has a wide
distribution. Its amount of volume is more than half of the whole timber amount in south China. However, its distribution
area is often invaded by masson pine caterpillar, one of the most serious forest insects in China. Pine tree growth
is influenced and the harvest of turpentine is reduced in the low damaged forest, and trees are killed in the heavy
damaged forest. The masson pine caterpillar also has impact on human being and ecological environment. The
governments and administrative departments of these areas have utilized a great number of labor forces, materials and
financial resources to measure, protect and harness the damage caused by pine caterpillar, this has restrained the damage
from rapid infestation. As the pine caterpillar is characterized by its quick development, it is very difficult to effectively
control and predict the damage by traditional ways.
Although the damage symptoms caused by different agents may vary, analysis of the damage caused by pine
caterpillar can provide insight into other types of damage that result in needle loss. The pine caterpillar feeds on the
buds and needles of old shoots of massion pine. In severe outbreaks, it may feed on previous year,s needles. Most
feedings occur in late spring, early summer or early autumn. The partially consumed needles and other feeding debris
become caught in a web-like feeding tunnel produced by the pine caterpillar and adhere to the tree for a short time.
The feeding debris is eventually knocked off by wind and rain, and bare branches become exposed.
Remote sensing systems provide a means of discriminating, mapping and monitoring vegetation efficiently. The
overall objective of this study was to correlate various levels of forest defoliation in South China with remote sensing
data, some specific goals are as follows: (1) to determine the feasibility of using satellite-borne sensors such as Landsat
Thematic Mapper(TM) data to map, measure and monitor coniferous forest defoliation caused by the pine caterpillar
through time, (2) to describe the relationships between spectral data and defoliation (percentage of needle loss), and
(3) to determine what levels of coniferous forest defoliation can be detected.
Assessments of defoliation caused by the pine caterpillar permit monitoring of an outbreak and estimation of
the distribution and quantity of damage. Such assessments can also be used in some forest jurisdictions as a measure
of stand condition. This, in turn, is used to determine where to implement pine caterpillar control programs, to assist
harvest scheduling and to plan other silvicultural measures. Leckie D.G. et al (1987) had predicted that approximately
20% differences in defoliation can be discriminated with the best spectral bands and that there were significant
differences between four classes of defoliation for most spectral bands.
In all, satellite-borne remote sensing could acquire forest condition information over large areas periodically and
provide technical possibilities for timely monitoring of forest diseases and insects.
We have made further research in many regions of China, such as Qianshan county in Anhui Province, Jiangshan
city in Zhejiang Province, Chaoyang region in Liaoning Province, and so on. The biological property of pine caterpillar
hazard can be remarkably distinguished in these test area. These study areas are typical regions with frequent pine
caterpillar hazard.
6
Chapter 1 Satellite Remote Sensing Monitoring Technology of Forest Damages Caused by Pine Caterpillars
5.2 Universal management of remote sensing data5.2.l Data collection
Landsat,s TM5 and TM7 data can be obtained from Remote Sensing Satellite Ground Station of Chinese Academy
of Sciences. In order to reduce the difference caused by phenology, data with close phonological period is often of
first choice.
5.2.2 Data pre-processAt first, we make precise geographic calibration and registration to the yearly data. To keep the precision in
one pixel, ground control points from the newest 1:10,000 topographic map were chosen. Meanwhile, DGPS can also
be used to achieve ideal result.
5.2.3 Data normalization To facilitate the comparison and analysis, normalization has been done to the yearly TM data.
5.2.4 Disaster information extractionAccording to previous experience, during the slow growing season of plant, because of the withering of herbs
and defoliation of forest, the green biomass will reduce, and this make the detection of forest disaster more convenient.
The stress index is an ideal parameter to identify the green biomass difference.
5.3. Data analysis and results in Anhui Province5.3.1 Data analysis
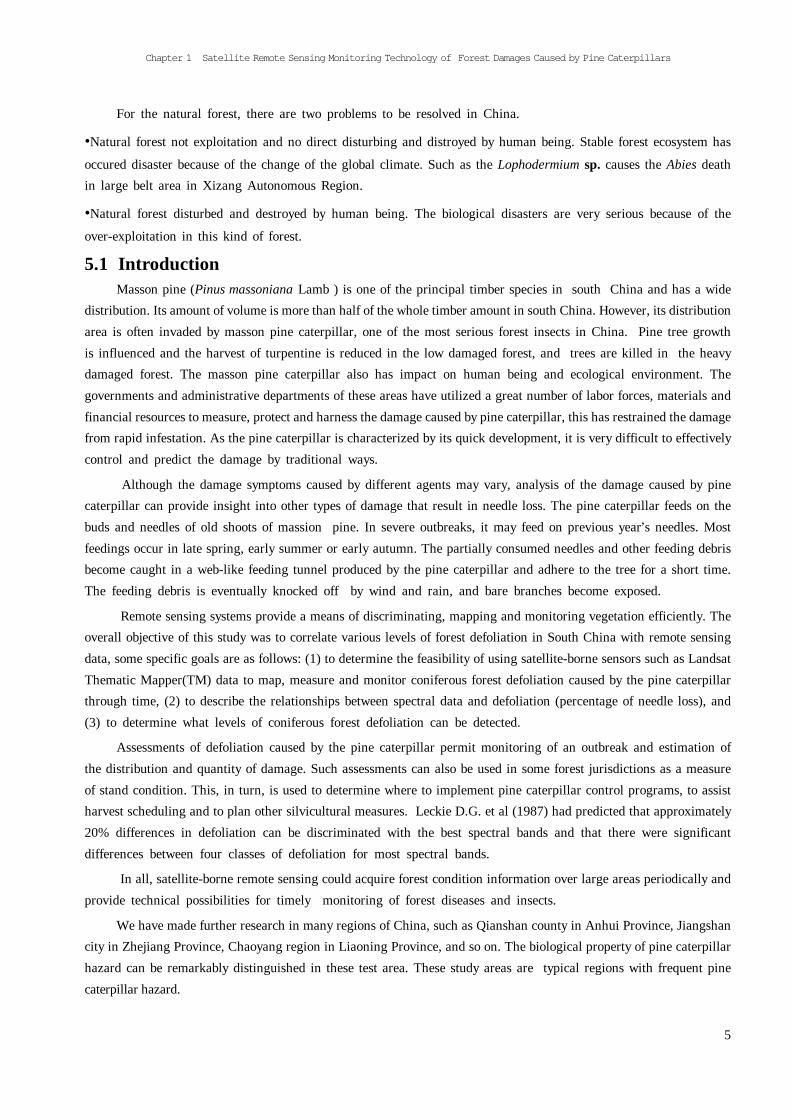
TM image data of November 15, 1993, December 7,1995 and October 22, 1996 are selected respectively.
To understand the methodology of extracting forest damage information from TM data, we selected the data
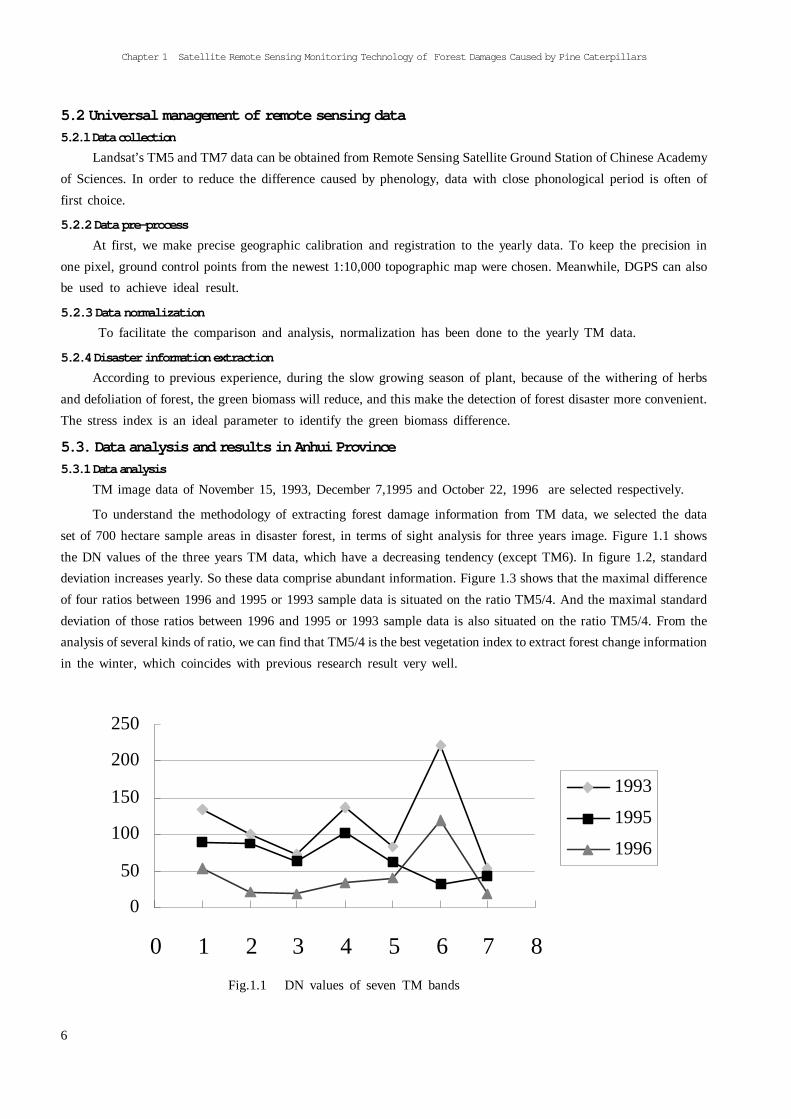
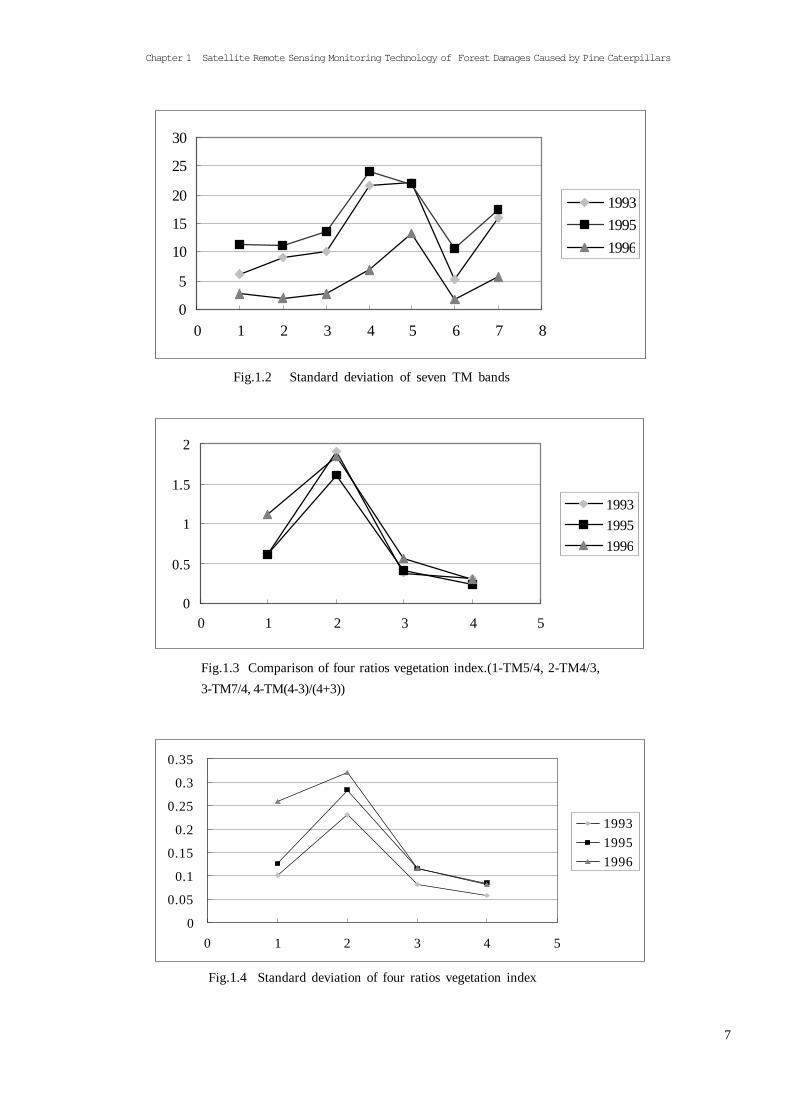
set of 700 hectare sample areas in disaster forest, in terms of sight analysis for three years image. Figure 1.1 shows
the DN values of the three years TM data, which have a decreasing tendency (except TM6). In figure 1.2, standard
deviation increases yearly. So these data comprise abundant information. Figure 1.3 shows that the maximal difference
of four ratios between 1996 and 1995 or 1993 sample data is situated on the ratio TM5/4. And the maximal standard
deviation of those ratios between 1996 and 1995 or 1993 sample data is also situated on the ratio TM5/4. From the
analysis of several kinds of ratio, we can find that TM5/4 is the best vegetation index to extract forest change information
in the winter, which coincides with previous research result very well.
0
50
100
150
200
250
0 1 2 3 4 5 6 7 8
1993
1995
1996
Fig.1.1 DN values of seven TM bands
7
Chapter 1 Satellite Remote Sensing Monitoring Technology of Forest Damages Caused by Pine Caterpillars
0
5
10
15
20
25
30
0 1 2 3 4 5 6 7 8
199319951996
Fig.1.2 Standard deviation of seven TM bands
0
0.5
1
1.5
2
0 1 2 3 4 5
199319951996
Fig.1.3 Comparison of four ratios vegetation index.(1-TM5/4, 2-TM4/3,
3-TM7/4, 4-TM(4-3)/(4+3))
0
0.05
0.1
0.15
0.2
0.25
0.3
0.35
0 1 2 3 4 5
199319951996
Fig.1.4 Standard deviation of four ratios vegetation index
8
Chapter 1 Satellite Remote Sensing Monitoring Technology of Forest Damages Caused by Pine Caterpillars
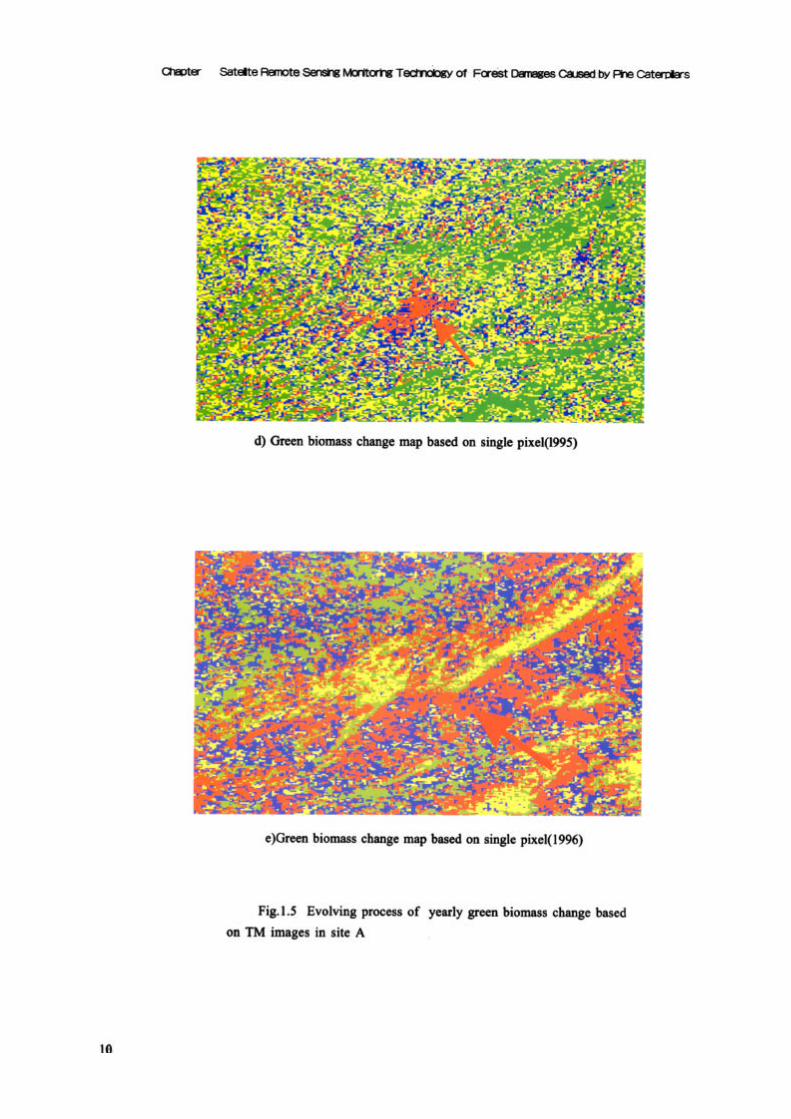
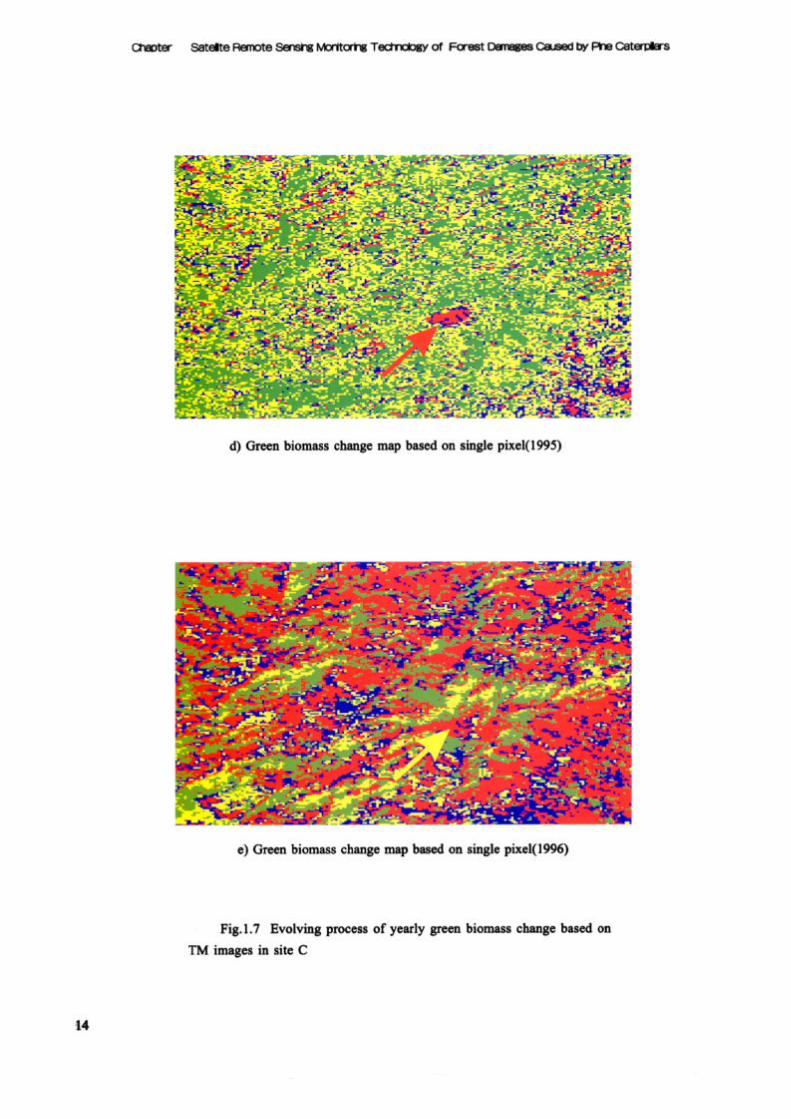
5.3.2 Early damaged area To make a clear illustration of the feasibility and validity of satellite remote sensing techniques in monitoring
forest insects and diseases, we have chosen TM images of three regions and made automatic classification to them,
this has formed an actual description of the spectrum change of the hazard regions during four years. (see Fig. 1.5,
Fig. 1.6, Fig. 1.7)
From forenamed three groups of images, we can find that the occurrence and development of forest diseases
and insects is a process from point to surface. Satellite remote sensing data can actually record this gradual change
process. The areas of three hazard regions in the 1995 image are very small. But after three generations of the pine
caterpillar, the hazard rapidly diffused in vast region in 1996. Therefore, if the start points of pests can be detected
timely and precisely, the disaster in vast areas will not occur and the damage loss will be reduced.
5.3.3 Post-classification processTo improve classification precision and get rid of the non-forest change information, we took the filtering process
to the analysis results based on the pixel and removed the non-forest change information with GIS data, finally, we
got the change image map of forest health change of the whole county. (see Fig. 1.7 and Fig. 1.8)
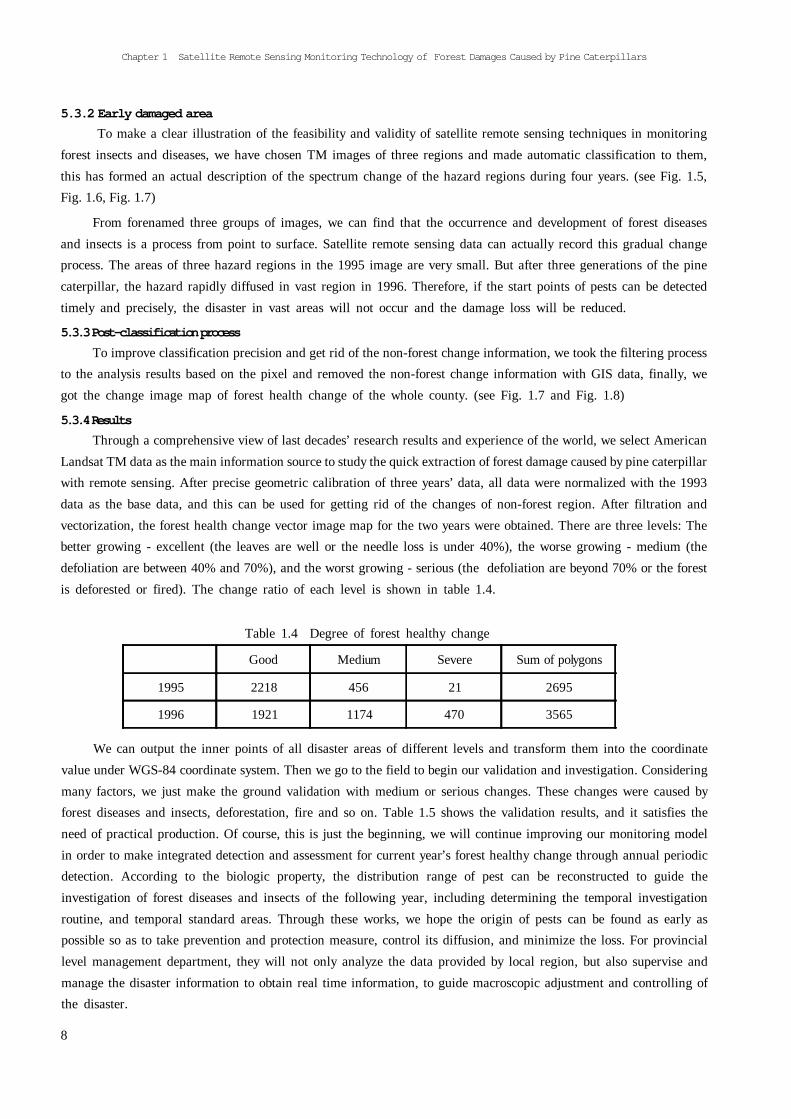
5.3.4 ResultsThrough a comprehensive view of last decades, research results and experience of the world, we select American
Landsat TM data as the main information source to study the quick extraction of forest damage caused by pine caterpillar
with remote sensing. After precise geometric calibration of three years, data, all data were normalized with the 1993
data as the base data, and this can be used for getting rid of the changes of non-forest region. After filtration and
vectorization, the forest health change vector image map for the two years were obtained. There are three levels: The
better growing - excellent (the leaves are well or the needle loss is under 40%), the worse growing - medium (the
defoliation are between 40% and 70%), and the worst growing - serious (the defoliation are beyond 70% or the forest
is deforested or fired). The change ratio of each level is shown in table 1.4.
Good Medium Severe Sum of polygons
1995 2218 456 21 2695
1996 1921 1174 470 3565
We can output the inner points of all disaster areas of different levels and transform them into the coordinate
value under WGS-84 coordinate system. Then we go to the field to begin our validation and investigation. Considering
many factors, we just make the ground validation with medium or serious changes. These changes were caused by
forest diseases and insects, deforestation, fire and so on. Table 1.5 shows the validation results, and it satisfies the
need of practical production. Of course, this is just the beginning, we will continue improving our monitoring model
in order to make integrated detection and assessment for current year,s forest healthy change through annual periodic
detection. According to the biologic property, the distribution range of pest can be reconstructed to guide the
investigation of forest diseases and insects of the following year, including determining the temporal investigation
routine, and temporal standard areas. Through these works, we hope the origin of pests can be found as early as
possible so as to take prevention and protection measure, control its diffusion, and minimize the loss. For provincial
level management department, they will not only analyze the data provided by local region, but also supervise and
manage the disaster information to obtain real time information, to guide macroscopic adjustment and controlling of
the disaster.
Table 1.4 Degree of forest healthy change


15
Chapter 1 Satellite Remote Sensing Monitoring Technology of Forest Damages Caused by Pine Caterpillars
Fig.1.8 Forest health change map of Qianshan County of Anhui Province in 1995£¨Green¡ªealthy forest,
Yellow¡ªaround 30 of needle loss percentage, Blue¡ªaround 50 of needle loss percentage, Red¡ªLarger than
70 of needle loss percentage)

16
Chapter 1 Satellite Remote Sensing Monitoring Technology of Forest Damages Caused by Pine Caterpillars
Fig.1.9 Forest health change map of Qianshan county of Anhui Province in 1996(Green¡ªhealthy
forest,Yellw¡ªaround 30 of needle loss percentage, Blue¡ªaround 50 of needle loss percentage,
Red¡ªLarger than 70 of needle loss percentage)

17
Chapter 1 Satellite Remote Sensing Monitoring Technology of Forest Damages Caused by Pine Caterpillars
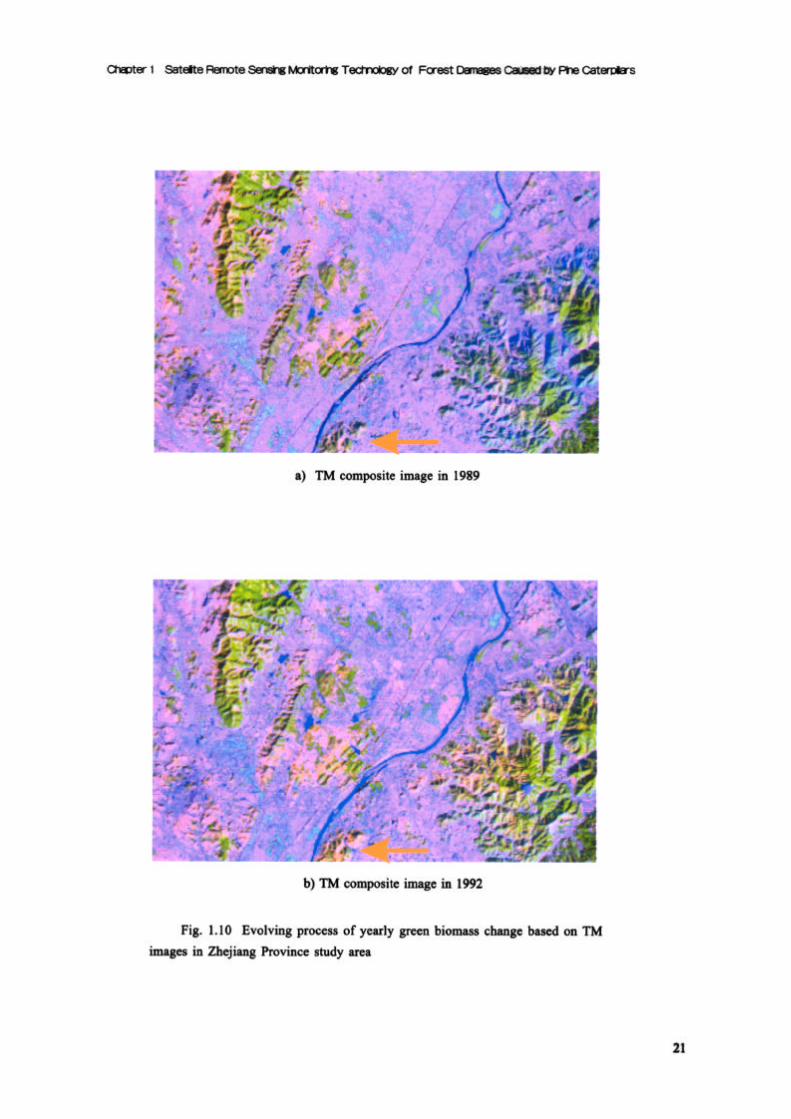
5.4 Data analysis and results in Zhejiang study areas in southeast ChinaThe research was conducted at the pine forest located in Jiangshan City, Zhejiang Province in southeast China.
Half of the city is covered by masson pine distributed in hillsides.
The city is mainly covered by immature stands of different densities and suffered varying levels of defoliation
by pine caterpillar from August to September in 1992.
5.4.1 Remote sensing data acquisition Four Landsat-5 TM half scenes covering the region described above were obtained and they were acquired
on November 29, 1989, November 21, 1992, October 20, 1992, and October 26, 1994 respectively. The 1994 and 1989
data sets represent conditions that the forest was not damaged by the insects, whereas the 1992 data sets were acquired
during major defoliation caused by pine caterpillar. Although the 1992 data were acquired one to two months after
what is considered to be the peak of the infestation, it is not long enough for vegetation to recover yet and the
defoliation were still quite evident.
The above data sets can also be divided into two groups of which the October data sets stand for conditions
in growing season and the November data sets stand for conditions in non-growing season. For every group of data
sets, solar azimuth and elevation were similar. And it is assumed that vegetation was at phenologically comparable
states for both groups of data sets. Ancillary data, such as 1:10,000 topographic map (partly) and 1:25000 forest maps
made in 1989 were used to exclude the disturbances.
5.4.2 Ground survey A total of 702 field plots were sampled in March 1993. The plots were stratified by high versus low elevation£¬
high versus low canopy closures and high versus low damage levels. Selected plots were required to support individual
pine stands with minimum stand size of one hectare. It was later determined that 321 plots did not meet the design
criteria of overstory homogeneity and were thus withheld from further analysis.
The stand ages of the above plots typically ranged from 5 to 22 years, the tree heights from 2 to 8 meter,
the diameter at breast height from 5 to 12 centimeters, and the crown class from 1 to 4. There were about 5 to 10
whorls in each plot. Ground cover under canopy varied greatly with herbs or shrubs being predominant.
Table 1.6 Stand types of constant damage region in study area
A total of four types of pine stands located in the regions with constant damage were selected(see Table 1.6)
and they were chosen to represent a gradient from low to high levels of forest damage. A ground survey was conducted
from March to April, 1993. Three hundred and eighty one quadrates(100m¡Á100m) were selected in building the
monitoring model, and they are the training areas for carrying out inventory of pine forest stand and damage. The
quadrates locations were marked on a configuration map (1:10,000 scale topographic maps). Since losing needles is
one of the major symptoms of the forest infested by the pine caterpillar, the percentage of needle loss was estimated
by visual interpretation with an accuracy of about 10% in each quadrate. Meanwhile the plot,s other information such
as crown closure, diameter at breast height, average tree height, crown class and understory compositions are all
investigated and recorded. All the plots were positioned in field by measurement with the positioning error less than
20 meters.
Stand types Canopy closure Understory coverage(%)
1 £¾0.45 ¡ Ý50
2 £¾0.45 £¼50
3 £¼0.45 ¡ Ý50
4 £¼0.45 £¼50
18
Chapter 1 Satellite Remote Sensing Monitoring Technology of Forest Damages Caused by Pine Caterpillars
5.4.3 Image pre-processingFour subsets of images representing the study area were extracted from TM scenes acquired. In order to alleviate
the confusion of multi-temporal spectral radiance differences, the 1992 data sets were normalized against the October
1994 and the November 1989 data sets respectively using a series of bright or dark ground targets. To normalize data,
the digital number(DN) values of all bands were extracted from all targets for four data sets. The 1992 values were
regressed against the 1994 and the 1989 values and a linear relationship were obtained. The regression equation was
used to convert the 1992 DNs into values comparable to 1994 and 1989 values. All ground targets for normalization
were presumed to have undergone minimal amounts of reflectance change between the acquisition of the two group
of data sets. The TM data were rectified to Transverse Mercartor grid using a nearest neighbor resampling method.
A 3¡Á3 kernel of pixels surrounding the center of each plot was extracted from the TM data sets. Digital numbers
for these nine pixels were used to derive an average for each plot.
5.4.4 Data analysisThere are in TM sensor seven bands of which band 2, band 3 and band 4 are respectively green reflectance
region, red strongly absorbed region and near-infrared strongly reflectance region of healthy vegetation. In particular,
band 3 and band 4 form a sharp contrast between absorption and reflection and both of them are important bands
for detecting chlorophyll concentration, estimating leaf area index and biomass. Moreover, Band 5 and band 7 in the
mid-infrared spectrum can sensitively discriminate differences of temperature and water content in vegetation. When
pine forest is invaded by pine caterpillar, the needles will be reduced and there will be exposed barks, branches and
twigs. Under these circumstances, the digital numbers of band 2 and band 4 will decrease and the values of band
1, band 3, band 5 and band 7 will increase correspondingly. All of the above facts constitute the theoretical basis
for detecting forest damage with TM data sets.
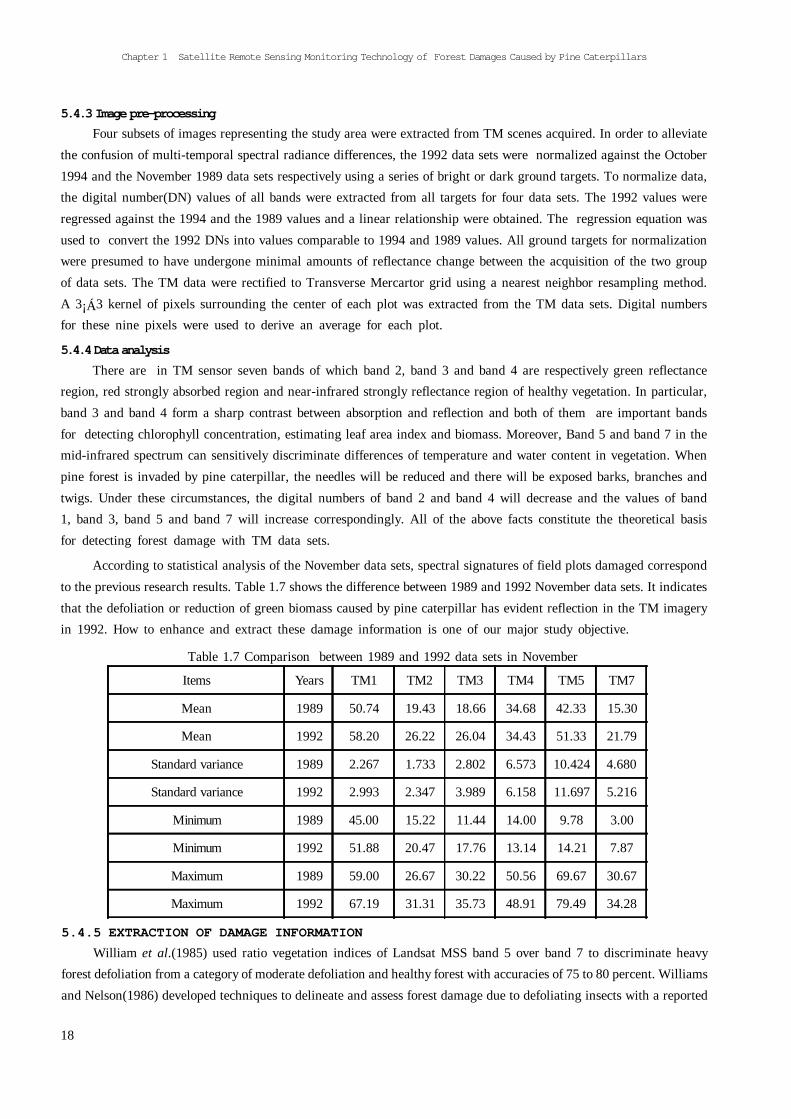
According to statistical analysis of the November data sets, spectral signatures of field plots damaged correspond
to the previous research results. Table 1.7 shows the difference between 1989 and 1992 November data sets. It indicates
that the defoliation or reduction of green biomass caused by pine caterpillar has evident reflection in the TM imagery
in 1992. How to enhance and extract these damage information is one of our major study objective.
Table 1.7 Comparison between 1989 and 1992 data sets in November
Items Years TM1 TM2 TM3 TM4 TM5 TM7
Mean 1989 50.74 19.43 18.66 34.68 42.33 15.30
Mean 1992 58.20 26.22 26.04 34.43 51.33 21.79
Standard variance 1989 2.267 1.733 2.802 6.573 10.424 4.680
Standard variance 1992 2.993 2.347 3.989 6.158 11.697 5.216
Minimum 1989 45.00 15.22 11.44 14.00 9.78 3.00
Minimum 1992 51.88 20.47 17.76 13.14 14.21 7.87
Maximum 1989 59.00 26.67 30.22 50.56 69.67 30.67
Maximum 1992 67.19 31.31 35.73 48.91 79.49 34.28
5.4.5 EXTRACTION OF DAMAGE INFORMATIONWilliam et al.(1985) used ratio vegetation indices of Landsat MSS band 5 over band 7 to discriminate heavy
forest defoliation from a category of moderate defoliation and healthy forest with accuracies of 75 to 80 percent. Williams
and Nelson(1986) developed techniques to delineate and assess forest damage due to defoliating insects with a reported
19
Chapter 1 Satellite Remote Sensing Monitoring Technology of Forest Damages Caused by Pine Caterpillars
90 percent classification accuracy for delineating insect-damaged and healthy forest. Vogelmann and Rock(1988)
evaluated Landsat TM data for its ability to detect and measure damage to spruce-fir stands and their study indicated
that TM band 5/4 and 7/4 ratios correlated well with ground observation of forest damage defined as percentage of
foliage loss.
Change detection using multi-temporal data had previously been employed primarily for the evaluation of land
cover changes associated with urbanization(Christenson and Lachowski, 1976; Wickware and Howarth, 1981; Estas et
al., 1982), desertification(Coiner, 1980; Robinove et al., 1981) and coastal zone monitoring(Weismiller et al., 1977; Hong
and Iisaka, 1982). Specific applications of change detection to monitor defoliation include Nelson(1983), who evaluated
image differencing, rationing, and vegetative index differencing of Landsat MSS data for detecting defoliation due to
gypsy moth. That study concluded that the vegetative index differencing and an MSS 5 ratio gave the best indication
of forest canopy change, with accuracies of about 78 percent. Vogelmann and Rock(1989) used multi-temporal Landsat
TM band 4 image differencing with single-date band 3 and 5 data to distinguish between high and low levels of
defoliation of hardwood forests caused by the Pear Thrips.
5.4.5.1 Extraction of defoliation in non-rowing season with single-date TM dataIn south China, deciduous forest usually drop foliage in early to middle November and herbage vegetation has
also faded at this moment. Because the understory vegetation is mainly deciduous broadleaf trees and herbage,
the effects of understory vegetation on spectral contribution can be neglected. Analysis of the plots data showed
that when canopy closure of the stand(dense pine forest) is greater than 0.45, TM ratios 5/4, 7/4 and (4-5)/(4+5) were
found to be strongly correlated with defoliation at the 0.05 level of confidence. Especially, ratio TM 5/4 is the best
vegetation index to distinguish four damage levels: healthy pine stand, light damaged stand, moderate damaged stand
and heavily damaged stand(0%-30%-50%-70%-100%). As for sparse canopy(canopy closure<0.45), it is difficult to
distinguish defoliation differences with single-date TM data sets.
5.4.5.2 Extraction of defoliation in growing season with single-date TM data In order to probe into effects on spectral reflectance of understory vegetation, we used TM data sets in October
during whcich all vegetation are green to find the way for differentiating defoliation. Firstly, we divided dense pine
forest into two categories in terms of the presence or absence of understory vegetation, here £¢presence£¢ was defined
as greater than 50 percent shrub vegetated cover. While ratio TM 5/4 is still an effective vegetation index to detect
damage changes for the latter, only ratio TM 4/3 can be used to measure differences of defoliation for the former
case. As for sparse canopy, it is still a difficult problem with single-date TM data.
5.4.5.3 Extraction of damage with multi-temporal TM dataImage differencing or delta detecting (ID) is a technique whereby changes in brightness values between two
or more data sets are determined by cell-by-cell subtraction of co-registered image data sets. The subtraction
(differencing) produces an image data set where positive and negative values represent areas of change.
(1) Monitoring damage during vegetation,s non-growing period Because the understory vegetation such as the
broadleaf trees and the herbs have dropped leaves or become yellow and faded in late November in the study area£¬it
can be considered that spectral contribution of understory vegetation is very little and can be neglected. By analyzing
various transformations £¨K-T, K-L, IHS£©and their combinations, it can be concluded that ratio TM5/4 is an effective
parameter to reflect the level of forest damage when the closure of understory vegetation is small. Analysis of the
difference of TM5/4 between the two years showed that ¦¤TM5/4 (difference of TM5/4 between the two years) can
be used to assess four levels of needle loss damage. Result of variance analysis showed that the difference is obvious.
(2) Monitoring damage during vegetation,s growth period As the understory vegetation is still vigorous in
October, spectral contributions from understorey vegetation will gradually increase with the decrease of crown leaves
20
Chapter 1 Satellite Remote Sensing Monitoring Technology of Forest Damages Caused by Pine Caterpillars
of the top layer and the ability to monitor damage caused by forest disease and insects using remote sensing method
will decrease. As some plots were covered with cloud on Oct. 26, 1994, only 367 of plots are used for analysis. It
can be shown that only three levels of needle loss can be assessed by ¦¤TM4/3(the difference of TM4/3 between
the two years). Result of variance analysis showed that the difference is obvious.
It is still an urgent important problem how to get rid of or lessen the disturbance of the understory vegetation
and to build effective models for monitoring damages.
5.4.5.4 Building remote sensing monitoring model of pine caterpillars Because visual method were used in the surveying of the damage, there will be errors. So it is reasonable to
consider that the value of TM5/4(x) of a plot whose damage percentage is y% is the powered average of TM5/4 values
of the known plots whose damage values and TM5/4 values are yi% and Xi respectively. Non-parametric regression
method can be applied to study the relation between y and x.
(1) Non-parametric regression method to build the relation between y and x. Suppose that the regression relation
in which we are interested is f(y)=E(x|y),¬ where y¡ÊR1 and f(y) is usually estimated by non-parametric kernel regression
method whose form can be described as following:
where K(x) is called the kernel function and is usually a probability density function; hn>0 is called the width
(1)
function and a good selection is hn=2.345¡Ád¡Án-1/5, where d is the stand error. Formula (1) is called the non- parametric
regression estimation of f(y). K(x) can have many forms and in this paper it takes the following form:
(2)
(2) Emulating the above non-parametric regression curve using parameter model. Usually twenty one values
of needle loss (y%) are taken respectively as 0%, 5%,¬... 100%. And the corresponding values of f(y) can be obtained
through formula (1) as fn(0), fn(5), ...fn(100). The Logist curve :
(3)
can be used to emulate the above twenty one points.
Relation between needle loss (y) and TM5/4 (x) can be obtained from (3) as following:
(4)
and this formula can be used to calculate the damage.
22
Chapter 1 Satellite Remote Sensing Monitoring Technology of Forest Damages Caused by Pine Caterpillars
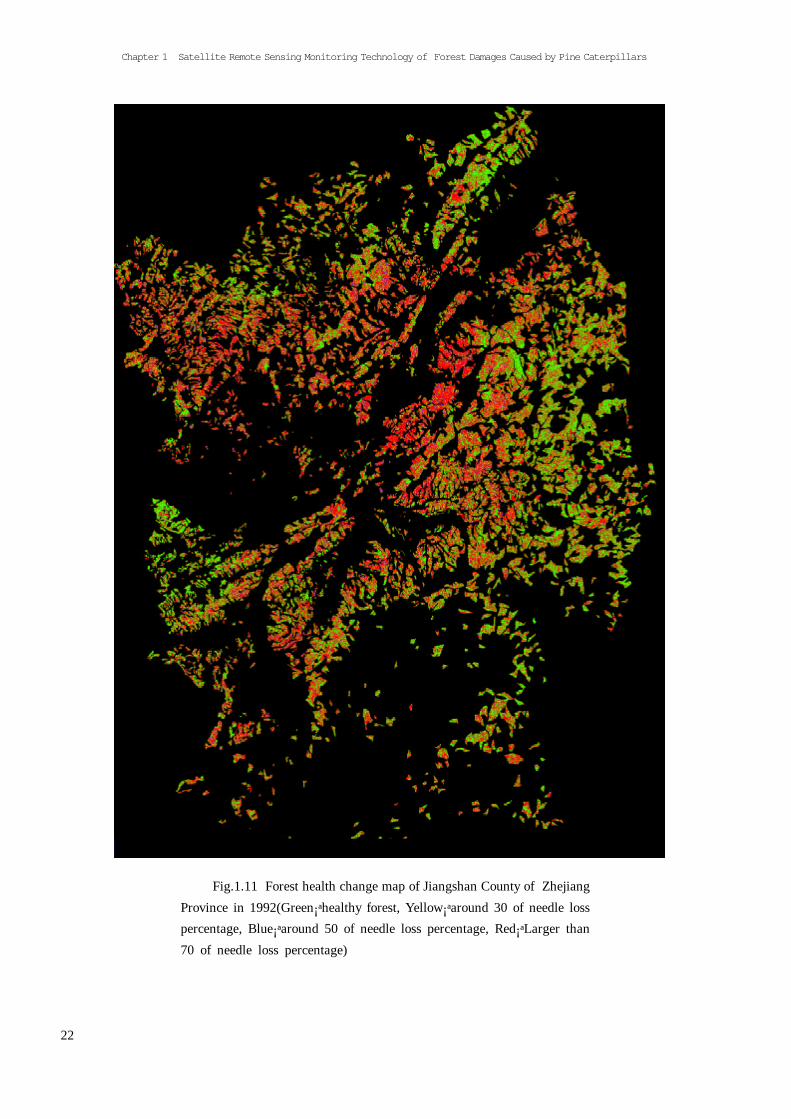
Fig.1.11 Forest health change map of Jiangshan County of Zhejiang
Province in 1992(Green¡ªhealthy forest, Yellow¡ªaround 30 of needle loss
percentage, Blue¡ªaround 50 of needle loss percentage, Red¡ªLarger than
70 of needle loss percentage)


25
Chapter 1 Satellite Remote Sensing Monitoring Technology of Forest Damages Caused by Pine Caterpillars
5.7 Technical methodologyIn order to have large scale monitoring, the Landsat TM data is chosen as main data resource. Through nearly
ten years of study and probation in Heilongjiang, Zhejiang, Anhui and Liaoning provinces in China, a series of
methodology has been obtained to rapidly analyze and process the remote sensing data, preliminary models assessing
forest damage have been established. The main flow of the technology is demonstrated by figure 1.14.
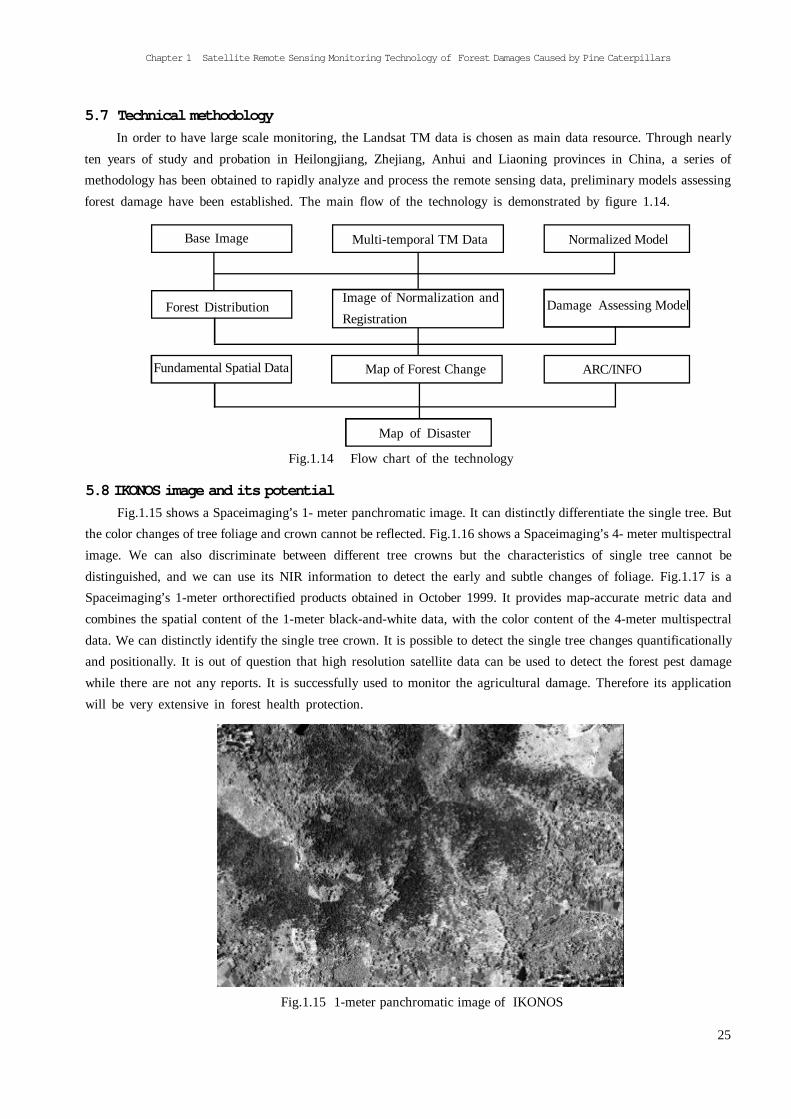
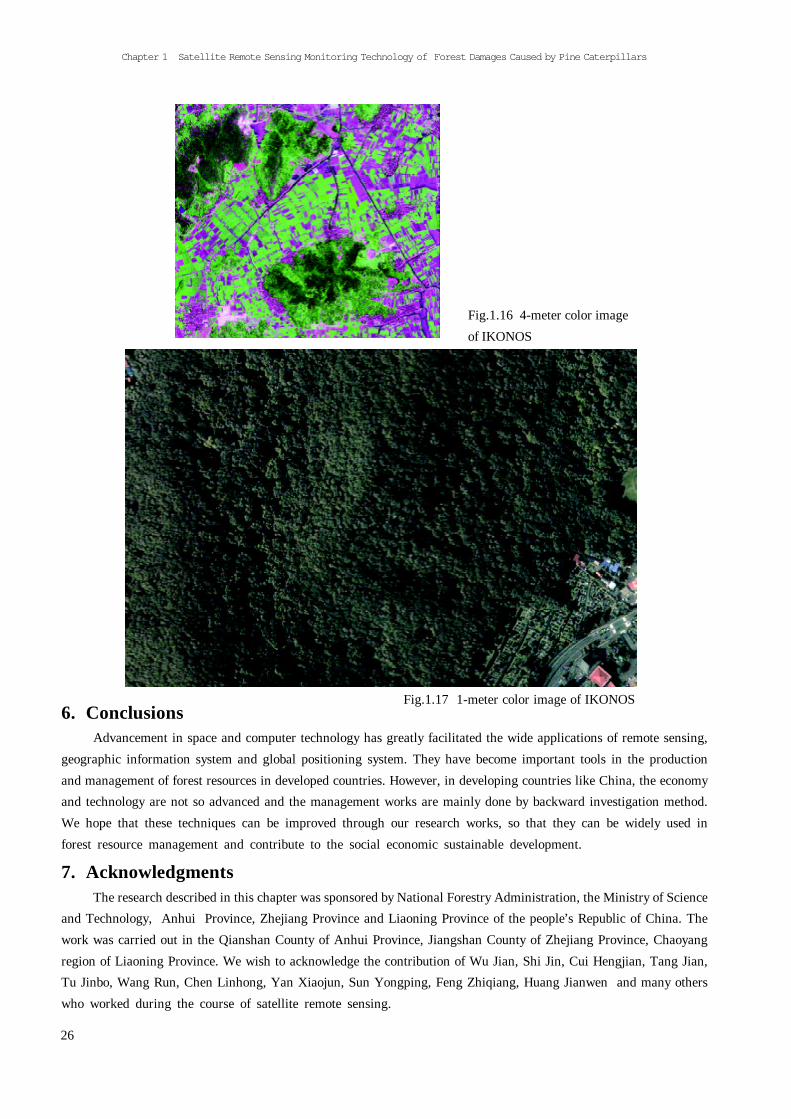
5.8 IKONOS image and its potentialFig.1.15 shows a Spaceimaging,s 1- meter panchromatic image. It can distinctly differentiate the single tree. But
the color changes of tree foliage and crown cannot be reflected. Fig.1.16 shows a Spaceimaging,s 4- meter multispectral
image. We can also discriminate between different tree crowns but the characteristics of single tree cannot be
distinguished, and we can use its NIR information to detect the early and subtle changes of foliage. Fig.1.17 is a
Spaceimaging,s 1-meter orthorectified products obtained in October 1999. It provides map-accurate metric data and
combines the spatial content of the 1-meter black-and-white data, with the color content of the 4-meter multispectral
data. We can distinctly identify the single tree crown. It is possible to detect the single tree changes quantificationally
and positionally. It is out of question that high resolution satellite data can be used to detect the forest pest damage
while there are not any reports. It is successfully used to monitor the agricultural damage. Therefore its application
will be very extensive in forest health protection.
Fig.1.14 Flow chart of the technology
Fig.1.15 1-meter panchromatic image of IKONOS
Base Image Multi-temporal TM Data Normalized Model
Forest DistributionImage of Normalization and
RegistrationDamage Assessing Model
ARC/INFOMap of Forest ChangeFundamental Spatial Data
Map of Disaster
26
Chapter 1 Satellite Remote Sensing Monitoring Technology of Forest Damages Caused by Pine Caterpillars
6. ConclusionsAdvancement in space and computer technology has greatly facilitated the wide applications of remote sensing,
geographic information system and global positioning system. They have become important tools in the production
and management of forest resources in developed countries. However, in developing countries like China, the economy
and technology are not so advanced and the management works are mainly done by backward investigation method.
We hope that these techniques can be improved through our research works, so that they can be widely used in
forest resource management and contribute to the social economic sustainable development.
7. AcknowledgmentsThe research described in this chapter was sponsored by National Forestry Administration, the Ministry of Science
and Technology, Anhui Province, Zhejiang Province and Liaoning Province of the people,s Republic of China. The
work was carried out in the Qianshan County of Anhui Province, Jiangshan County of Zhejiang Province, Chaoyang
region of Liaoning Province. We wish to acknowledge the contribution of Wu Jian, Shi Jin, Cui Hengjian, Tang Jian,
Tu Jinbo, Wang Run, Chen Linhong, Yan Xiaojun, Sun Yongping, Feng Zhiqiang, Huang Jianwen and many others
who worked during the course of satellite remote sensing.
Fig.1.16 4-meter color image
of IKONOS
Fig.1.17 1-meter color image of IKONOS