Embed Size (px)
Citation preview

hapter 1 ntroduction
Chapter 3 Base Year and Future Em
issions
An inventory of regional emissions from all stationary, area and mobile sources is a requirement for the State Implementation Plan. Base year emissions are projected into
the future using approved growth factors for each source category. These emissions assist in projecting the level of reductions needed to attain standards in the future.

In This Chapter Introduction 3-1
Emissions in the base year and attainment years
Emission Inventories 3-1 Stationary sources, mobile sources, and uncertainties in the inventory
Base Year Emissions 3-10 2012 emissions inventory

Future Emissions 3-17 Demographic growth and baseline emission projections
Impact of Growth 3-27 Growth contribution to future emissions
Top Ten Source Categories 3-29 The most significant emission sources


Chapter 3: Base Year and Future Emissions
Introduction This chapter summarizes criteria pollutant emissions that occurred in the Basin during the 2012 base year as well as projected emissions for the years 2019, 2022, 2023, 2025, and 2031. A more detailed description of emissions and methodologies is presented in Appendix III. The 2012 base year emissions inventory reflects actual and estimated emissions subject to adopted regulations with current compliance dates as of 2012, whereas future baseline emissions inventories are based on economic projections and adopted regulations with both current and future compliance dates. A list of District and CARB rules and regulations that are part of the base year and future year baseline emissions inventories is presented in Appendix III. The District continues to implement rules that are incorporated in the 2016 AQMP future baseline emissions inventories.
The emissions inventory is divided into two major source classifications: stationary and mobile sources. The 2012 base year point source emissions are based principally on reported data from facilities using the District’s Annual Emissions Reporting Program. The area source emissions are estimated jointly by CARB and the District using established inventory methods. The on-road emissions are calculated using CARB’s EMFAC 2014 model and the travel activity data provided by the Southern California Association of Governments (SCAG) from their adopted 2016 Regional Transportation Plan / Sustainable Communities Strategy (RTP/SCS). CARB provides emission inventories for off-road equipment which includes construction and mining equipment, industrial and commercial equipment, lawn and garden equipment, agricultural equipment, ocean-going vessels, commercial harbor craft, locomotives, cargo handling equipment, pleasure craft, and recreational vehicles. Aircraft emissions are based on an updated analysis by the District, developed in conjunction with the airports in the region. The future emission forecasts are primarily based on demographic and economic growth projections provided by SCAG. In addition, emission reductions resulting from District regulations amended or adopted by December 2015 and CARB regulations adopted by November 2015 are included in the future baseline projections.
This chapter summarizes the major components of developing the base year and future baseline inventories. More detailed information, such as CARB’s and the District’s emission reductions resulting from adopted rules and regulations since the 2012 AQMP, growth factors, and demographic trends, are presented in Appendix III. In addition, the top source categories contributing to the 2012, 2019, 2022, 2023, 2025, and 2031 emission inventories are identified in this chapter. An understanding of the highest emitting source categories leads to the identification of potentially more effective control strategies for improving air quality.
Emission Inventories
Two inventories are prepared for the 2016 AQMP for the purpose of regulatory and SIP performance tracking, including transportation conformity 1: an annual average inventory and a summer planning inventory. Baseline emissions data presented in this chapter are based on average annual daily
1 Transportation conformity is required under CAA Section 176(c) to ensure that federally supported highway and transit project activities “conform” to the purpose of the SIP. More details are provided in Chapter 4.
3-1

Final 2016 AQMP
emissions (i.e., total annual emissions divided by 365 days) and seasonally adjusted summer planning inventory emissions. The 2016 AQMP uses annual average day emissions to estimate the cost-effectiveness of PM2.5 control measures and to perform PM2.5 modeling and analysis. The summer planning inventory emissions are developed to capture the emission levels during the high ozone season and are used to perform ozone modeling and analysis, estimate the cost-effectiveness of ozone control measures, and to report emission reduction progress as required by the federal and California Clean Air Acts.
Detailed information regarding the emissions inventory development for the base year and future years, the emissions by major source category in the base year and future baseline emission inventories are presented in Appendix III. Attachments A and B to Appendix III list the annual average and summer planning emissions by major source category for 2012, 2019, 2021, 2022, 2023, 2025, and 2031. Attachment C to Appendix III has the top VOC and NOx point source categories that emitted greater than or equal to 10 tons per year in 2012. Attachment D to Appendix III contains the on-road emissions by vehicle class and pollutant. Attachment E to Appendix III shows emissions associated with the combustion of diesel fuel for various source categories.
Stationary Sources
Stationary sources can be divided into two major subcategories: point and area sources. Point sources are permitted facilities with one or more emission sources at an identified location (e.g., power plants, refineries). These facilities generally have annual emissions of 4 tons or more of either Volatile Organic Compounds (VOC), Nitrogen Oxide (NOx), Sulfur Oxide (SOx), or total Particulate Matter (PM), or annual emissions of over 100 tons of Carbon Monoxide (CO). Facilities are required to report their criteria pollutant emissions pursuant to Rule 301 and selected air toxics to the District on an annual basis, subject to audit, if any of these thresholds are exceeded. The 2012 annual reported emissions are used to update the stationary source inventory. Area sources consist of many small emission sources (e.g., residential water heaters, architectural coatings, consumer products and permitted sources that are smaller than the above thresholds) which are distributed across the region and are not required to individually report their emissions. There are about 400 area source categories for which emission estimates are jointly developed by CARB and the District. The emissions from these sources are estimated using activity information and emission factors. Activity data are usually obtained from survey data or scientific reports (e.g., Energy Information Administration (EIA) reports for fuel consumption other than natural gas fuel, Southern California Gas Company for natural gas consumption, paint suppliers under Rule 314 and District databases). The emission factors are based on rule compliance factors, source tests, manufacturer’s product or technical specification data, default factors (mostly from AP-42, U.S. EPA’s published emission factor compilation), or weighted emission factors derived from the point source facilities’ annual emissions reports. Additionally, the emissions over a given area may be calculated using socioeconomic data.
Appendix III has more detail regarding emissions from specific source categories such as architectural coatings, dairy cattle, oil and gas production operations, gasoline dispensing facilities, and green waste composting. Since the 2012 AQMP was finalized, new area source inventory updates include:
1-3-2

Chapter 3: Base Year and Future Emissions
• Architectural Coatings Category: Over 60 area sources in this category were updated based on information provided as part of SCAQMD Rule 314 – “Fees for Architectural Coatings” annual reports.
• Oil and Gas Production Category: The emission estimation methodology for this area source category was revised to incorporate U.S. EPA’s oil and gas production inventory model modified with California-specific emission factors and technologies.
• Gasoline Dispensing Facilities Category: The emission estimation methodology for this area source category was revised to include CARB staff’s updated emission factors and activity data.
• Dairy Cattle: Ammonia and VOC emissions from dairy farms were revised based on the animal head count data reported to the Santa Ana Regional Water Quality Control Board.
• LPG Combustion Categories: The emissions from this category were revised based on the LPG consumption estimation for the Basin. The fraction of California LPG use in the Basin was estimated based on GHG data reported to the CARB. The statewide total LPG consumption was retrieved from State Energy Data (2013).
• Commercial and Industrial Natural Gas Combustion Categories: 2012 actual natural gas consumption data were used, instead of the projection from the 2012 AQMP.
• Composting Waste Disposal: Ammonia and VOC emissions expected from compostable mulch were added in this category.
• REgional CLean Air Incentives Market (RECLAIM) NOx emissions: The future baseline was revised to include the 12 tons per day of RECLAIM Trading Credits (RTCs) reduction by December 2022 that was approved in December 2015.
Mobile Sources Mobile sources consist of two subcategories: on-road sources and off-road sources. On-road vehicle emissions are calculated with CARB’s EMFAC 2014 model and the travel activity data provided by SCAG from their adopted 2016 RTP/SCS. Spatial distribution data from Caltrans’ Direct Travel Impact Model (DTIM4) are used to place the emissions at the proper time and place. Off-road emissions are calculated using CARB’s category specific inventory models.
On-Road CARB’s EMFAC 2014 model has undergone extensive revisions from the previous version (EMFAC 2011) to make it more user-friendly, flexible, and to allow incorporation of larger amounts of data demanded by the current regulatory and planning processes. In addition to the model structural changes, other changes include:
• Revision of heavy-duty diesel (HD Diesel) truck emission rates: The emission factors for heavy heavy-duty diesel trucks were also updated using new test data on newer trucks (Model Year 2007 and newer) that more accurately represent the effectiveness of the control equipment used to meet the more stringent 2007 and 2010 emission standards.
• Incorporation of natural gas vehicles for select vehicle classes: Emission factors for natural gas powered solid waste collection vehicles and urban buses are now included in EMFAC 2014 as these classes of vehicles have sufficient penetration of natural gas engines to warrant separate treatment.
3-3

Final 2016 AQMP
• Accounting for federal and California regulations and standards adopted post-2010: The adopted regulations and standards include the State’s Advanced Clean Car Program, the April 2014 amendment to the Truck and Bus Regulation, the Tractor-Trailer Greenhouse Gas Regulation and the federal HD Greenhouse Gas Regulation.
• Socio-econometric modeling of population and VMT: EMFAC 2014 incorporates the use of socioeconomic regression model forecasting methods to predict new vehicle sales and Vehicle Miles Traveled (VMT) growth trends. This allows the use of State and national economic indicators, fuel prices, and regional human population and vehicle ownership characteristics as parameters to more accurately predict vehicle sales and VMT trends.
More detailed information on the changes incorporated in EMFAC 2014 can be found at http://www.arb.ca.gov/msei/categories.htm.
Figure 3-1 compares the on-road emissions estimated using EMFAC 2011 in the 2012 AQMP and EMFAC 2014 used in the 2016 AQMP, respectively for milestone years 2012, 2023, and 2031. It should be noted that the comparison for 2012 reflects changes in methodologies, whereas the comparison for 2023 and 2031 also includes adopted rules and updated growth projections since the release of EMFAC 2011, which was the basis of the 2012 AQMP on-road emissions.
For 2012, EMFAC 2014’s newer methodologies show higher emissions of NOx and VOCs. For the future years 2023 and 2031, in general, the emissions are lower in EMFAC 2014 as compared to EMFAC 2011. The lower emissions can be attributed to additional rules and regulations, more stringent standards, and updates to the heavy-duty emission factors.
Also evident in Figure 3-1 is the change in the rate of emission reductions. The rate of change in the emissions in the early years (2012 to 2023) is significantly larger than that shown further in the later years (2023–2031). This is due to the implementation of the rules and regulations, most of which will be fully implemented by 2023 (e.g., CARB’s Truck and Bus rule requires all trucks to meet the 2010 standards by 2023). The effect of the rules and regulations are significant, showing reductions of about 70 percent NOx emissions and close to 60 percent VOC emissions between 2012 and 2023, even with increases in fleet population. More modest reductions are predicted from continued fleet turnover, but fleet growth is beginning to outpace the emissions benefits of fleet turnover in the later years. Further emission reductions will require fleets to adopt the use of even cleaner equipment than the current standards require.
1-3-4

Chapter 3: Base Year and Future Emissions
FIGURE 3-1
COMPARISON OF ON-ROAD EMISSIONS ESTIMATED USING EMFAC 2011 IN THE 2012 AQMP AND EMFAC 2014 IN THE
2016 AQMP. VOC AND NOX EMISSIONS REPRESENT SUMMER PLANNING AND SOX & PM2.5 ARE ANNUAL AVERAGE
INVENTORY.
138.4
285.2
2.1 14.6
162.4
293.1
2.01 14.4
0.0
50.0
100.0
150.0
200.0
250.0
300.0
350.0
VOC NOx SOx PM2.5
Emis
sion
s (t
ons/
day)
2012
2012 AQMP 2016 AQMP
69.5
116.7
1.9 11.1
67.788.0
1.7 10.20.0
50.0
100.0
150.0
200.0
250.0
300.0
350.0
VOC NOx SOx PM2.5
Emis
sion
s (t
ons/
day)
2023
2012 AQMP 2016 AQMP
54.092.7
1.9 11.949.5 65.0
1.4 9.90.0
50.0
100.0
150.0
200.0
250.0
300.0
350.0
VOC NOx SOx PM2.5
Emis
sion
s (t
ons/
day)
2031
2012 AQMP 2016 AQMP
3-5

Final 2016 AQMP
Off-Road Emissions from off-road vehicle categories are primarily based on estimated activity levels and emission factors. Separate emission estimation models have been developed for the many categories of off-road equipment. More information on these models can be found at the following link: http://www.arb.ca.gov/msei/categories.htm. Several of these models have been updated since the release of the 2012 AQMP. The major updates include:
• Locomotives: The emissions model methodology for the freight locomotive category was completely revised. In addition, activity was updated using data from the Surface Transportation Board and Federal Highway Administration’s Freight Analysis Framework. Population information was derived from the Association of American Railroads’ population data.
• Ocean Going Vessels: New lower growth projections were developed and incorporated into the model using more recent information from the Federal Highway Administration’s Freight Analysis Framework model and other forecasts performed for the San Pedro Bay Ports. NOx control factor calculations were updated to more appropriately represent the engine Tier levels.
• Commercial Harbor Craft: The vessel turnover rate methodology was improved to better reflect the observed age distribution. A more representative reduced turnover rate is used, which improves consistency with other off-road emissions model methodologies.
• Pleasure Craft and Off-Highway Recreational Vehicles: New survey information and DMV data were used to update the population and activity, and new emissions testing data were used to update the emission factors in newly developed models for these two categories.
• Cargo Handling Equipment: The model was updated to use growth factors consistent with those developed for ocean going vessels.
• Farm Equipment: The inventory was completely revised resulting in a new inventory based on updated equipment population, equipment age distribution, activity, load factors, and turnover practices.
• Aircraft: The aircraft emissions inventory is updated for the 2012 base year based on the 2012 aircraft activity data and latest calculation methodologies. A total of 43 airports were identified as having aircraft operations within the District boundaries including commercial air carrier, air taxi, general aviation, and military aircraft operations. The sources of activity data included airport operators and Federal Aviation Administration’s (FAA) databases. The emissions calculation methodology was based on the application of FAA’s Emissions and Dispersion Modeling System (EDMS) model for commercial airports with detailed aircraft activity data (by aircraft make and model). For other airports and aircraft types (e.g., general aviation, air taxi, military), the total number of aircraft operations was used in conjunction with the U.S. EPA’s latest average emission factors by major aircraft type (e.g., general aviation, air taxi, military). For commercial air carrier operations, SCAG’s 2040 aircraft operations forecasts from the SCAG’s 2016 Regional Transportation Plan (RTP) was used.
1-3-6

Chapter 3: Base Year and Future Emissions
The revised 2016 AQMP incorporated the 2040 emissions forecast (based on SCAG’s latest forecasts) with interim years interpolated between 2012 and 2040.
Figure 3-2 shows a comparison between the off-road baseline emissions in the 2012 AQMP and the 2016 AQMP for the milestone years 2012, 2023, and 2031. Overall, the updates to the off-road categories result in lower emissions than those used in the 2012 AQMP. It should be noted that the comparison for 2012 reflects changes in methodology, but the comparison for the rest of the years also includes adopted rules and updated growth projections since the release of off-road inventory in the 2012 AQMP. Similar to what is shown for the on-road category, the rate of reductions in emissions of NOx and VOC is significantly larger in early years (2012 to 2023) compared to the rate seen in the later years (2023 to 2031). This is the result of the rules and regulations adopted at the State and federal levels for most of the off-road categories. As most will be fully implemented by 2023, only modest reductions will be achieved as a result of continued fleet turnover beyond 2023. Without additional rules or programs for further reductions, growth in emissions from increases in vehicle population outweighs the emissions benefits associated with fleet turnover to newer equipment. As projected for the on-road fleet, further emission reductions will require off-road fleets to use even cleaner equipment than current standards require.
3-7

Final 2016 AQMP
FIGURE 3-2
COMPARISON OF OFF-ROAD EMISSIONS BETWEEN 2012 AQMP AND 2016 AQMP. VOC & NOX – SUMMER PLANNING; SOX & PM2.5 – ANNUAL AVERAGE INVENTORY
137.7
168.5
6.3 9.0
126.3
164.6
6.1 8.10.0
50.0
100.0
150.0
200.0
VOC NOx SOx PM2.5
Emis
sion
s (t
ons/
day)
2012
2012 AQMP 2016 AQMP
107.7
132.9
5.8 6.6
89.9
117.1
5.6 5.60.0
20.040.060.080.0
100.0120.0140.0160.0180.0
VOC NOx SOx PM2.5
Emis
sion
s (t
ons/
day)
2023
2012 AQMP 2016 AQMP
95.9
119.8
7.7 5.8
80.699.6
6.7 5.20.0
20.040.060.080.0
100.0120.0140.0160.0180.0
VOC NOx SOx PM2.5
Emis
sion
s (t
ons/
day)
2031
2012 AQMP 2016 AQMP
1-3-8

Chapter 3: Base Year and Future Emissions
Uncertainties in the Emissions Inventory
An effective AQMP relies on a complete and accurate emissions inventory. Over the years, significant improvements have been made to quantify emission sources for which control measures are developed. Increased use of continuous monitoring and source testing has contributed to the improvement in point source inventories. Technical assistance to facilities and auditing of reported emissions by the District have also improved the accuracy of the emissions inventory. Area source inventories that rely on average emission factors and regional activities have inherent uncertainty. Industry-specific surveys and source-specific studies during rule development have provided much-needed refinement to these emissions estimates. Mobile source inventories are also continuously updated and improved. As described earlier, many improvements are included in the on-road mobile source model EMFAC 2014, which estimates emissions from trucks, automobiles, and buses. Improvements and updates are included in the off-road models for locomotives, ocean going vessels, commercial harbor craft, pleasure craft and off-highway recreational vehicles, cargo handling equipment, and farm equipment. Overall, the 2016 AQMP inventory is based on the most current data and methodologies, resulting in the most accurate inventory available.
Relative to future growth, there are many challenges inherent in making accurate projections, such as where vehicle trips will occur, the distribution between various modes of transportation (such as trucks and trains), as well as estimates for population growth and the number and type of jobs. Forecasts are made with the best information available; nevertheless, there is uncertainty in emissions projections. AQMP updates are generally developed every three to four years, thereby allowing for frequent updates and improvements to the inventories.
Gridded Emissions
For air quality modeling purposes, the domain extends to Southern Kern County in the north, the Arizona border to the east, northern Mexico to the south and more than 100 miles offshore to the west. The modeling area is divided into a grid system comprised of 4 km by 4 km grid cells. Both stationary and mobile source emissions are allocated to individual grid cells within this system. In general, the modeling emissions data features daily emissions. Variations in temperature, hours of operation, speed of motor vehicles, or other factors are considered in developing gridded motor vehicle emissions. The “gridded” emissions data used for both PM2.5 and ozone modeling applications differ from the annual average day or planning inventory emission data in two respects: (1) the modeling region covers larger geographic areas than the Basin; and (2) emissions represent day-specific instead of average or seasonal conditions. Emission inventories are generated for both the PM2.5 and ozone modeling applications. For PM2.5, the annual average day is used, which represents the characteristic of emissions that contribute to year-round particulate impacts. The summer planning inventory focuses on the warmer months (May through October) when evaporative VOC emissions and more sunlight, play an important role in ozone formation.
3-9

Final 2016 AQMP
Base Year Emissions
2012 Emission Inventory
Table 3-1A compares the summer planning emissions between the 2012 base year in the 2016 AQMP and the projected 2012 emissions in the Final 2012 AQMP by major source category for VOC and NOx. Table 3-1B compares the annual average emissions between the 2012 base year in the 2016 AQMP and the projected 2012 emissions in the Final 2012 AQMP for SOx and PM2.5. It should be noted that the comparison for 2012 reflects updates in methodology, differences between growth projections and actual data, and adopted rules since the release of the 2012 AQMP. Specifically, the growth projection employed in the 2012 AQMP did not fully capture the impact of the economic recession which occurred between 2008 and 2010.
Overall, there is a minor net decrease in VOC emissions in the 2016 AQMP inventory as compared to the 2012 AQMP projections. Estimates of stationary source VOC emissions have decreased by approximately 12 percent, but mobile VOC source emissions have increased by 5 percent. NOx emissions remain unchanged between the 2016 AQMP inventory and the 2012 projection. As in the VOC category, stationary source NOx emissions have been revised downward and mobile source emissions have been revised slightly upward. Of note in the stationary source categories are the emission changes associated with the architectural coatings, RECLAIM categories, natural gas and LPG combustion sources, and farming operations. Architectural coatings emissions were updated for the 2016 AQMP using information provided as part of SCAQMD Rule 314 – “Fees for Architectural Coatings” annual reports, resulting in the lower emission estimate. The RECLAIM emissions cap was used to project the NOx emissions in the 2012 AQMP inventory, while in 2012, the actual emissions were lower than the cap by 7 tons per day (TPD). Use of additional actual reported information in lieu of projected emissions (used in the 2012 AQMP to estimate the 2012 emissions) explain the majority of the remaining emission differences. Refer to Appendix III for details.
For the mobile source category, the updates described earlier to the on-road emissions model EMFAC 2014 resulted in the 17 percent and 3 percent increase in VOC and NOx emissions, respectively. Updates to several of the off-road category emission estimates resulted in the 8 percent decrease in VOC emissions and a modest 2 percent decrease in NOx emissions. Updates were completed for locomotives, ocean going vessels, cargo handling equipment, commercial harbor craft, farming equipment, pleasure craft, and off-highway recreational vehicles.
Estimates of SOx emissions are 23 percent lower in the 2016 AQMP emissions inventory than 2012 projections. This is largely due to the difference in the use of actual reported information in lieu of projected emissions in the RECLAIM sources. Estimates of direct PM2.5 from stationary and mobile sources are modestly lower in the 2016 AQMP leading to a decrease of 7 percent. This revised estimation is largely due to changes in the emissions estimates from miscellaneous stationary processes and decreases in off-road vehicle emissions.
Table 3-2 shows the 2012 annual average and summer planning emissions inventory by major source category. Stationary sources are subdivided into point (e.g., chemical manufacturing, petroleum production, and electric utilities) and area sources (e.g., architectural coatings, residential water heaters,
1-3-10

Chapter 3: Base Year and Future Emissions
consumer products, and permitted sources smaller than the emission reporting threshold – generally 4 tpy). Mobile sources consist of on-road (e.g., passenger cars and heavy-duty trucks) and off-road sources (e.g., trains and ships). Entrained road dust is also included.
Figure 3-3 characterizes relative contributions by stationary and mobile source categories. On- and off-road sources continue to be major contributors for each of the five pollutants. Overall, total mobile source emissions account for almost 60 percent of the VOC and 90 percent of the NOx emissions for these two ozone-forming pollutants and 95 percent of the CO emissions. The on-road mobile category alone contributes over 30 percent of the VOC and 56 percent of the NOx emissions. For directly emitted PM2.5, mobile sources represent 34 percent of the emissions with another 13 percent due to vehicle-related entrained road dust. Stationary sources emit the majority of the SOx emissions with the point source category contributing 50 percent of the SOx emissions in the Basin. Area sources play a major role in VOC emissions, emitting about 3.5 times more than point sources. Area sources, including sources such as commercial cooking, are the predominant source of directly emitted PM2.5 emissions (42 percent).
Figure 3-4 shows the fraction of the 2012 inventory by responsible agency for VOC, NOx, SOx, and directly emitted PM2.5. U.S. EPA and CARB have primary authority to regulate emissions from mobile sources. U.S. EPA’s authority applies to aircraft, locomotives, ocean going vessels, and some categories of on- and off-road mobile equipment. CARB has authority over the remainder of the mobile sources, and consumer products. SCAQMD has authority over most area sources and all point sources. As can be seen in Figure 3-4, most of the NOx and VOC emissions in the District are from sources that fall under the primary jurisdiction of U.S. EPA and CARB. For example, almost 90 percent of the NOx and over 75 percent of the VOC emissions are from sources primarily under CARB and U.S. EPA control. Conversely, 56 percent of the SOx emissions and 66 percent of the directly emitted PM2.5 emissions are from sources under SCAQMD control. NOx and VOC are important precursors to ozone and PM2.5 formation, and SOx along with directly emitted PM2.5, contribute to the region’s PM2.5 nonattainment challenges. This illustrates that actions at the local, State, and federal level are needed to ensure the region attains the federal ambient air quality standards.
3-11

Final 2016 AQMP
TABLE 3-1A Comparison of VOC and NOx Emissions By Major Source Category of
2012 Base Year in 2016 AQMP and Projected 2012 in Final 2012 AQMP Summer Planning Inventory (tpd1)
SOURCE CATEGORY
2012 AQMP
2016 AQMP
% Change
2012 AQMP
2016 AQMP
% Change
VOC NOx
STATIONARY SOURCES
Fuel Combustion 12.9 11.4 -12% 29.4 27.9 -5%
Waste Disposal 12.1 14.1 17% 1.5 2.3 50%
Cleaning and Surface Coatings 41.7 35.6 -15% 0 0 0%
Petroleum Production and Marketing
40.2 29.2 -27% 0 0 0%
Industrial Processes 13.8 10.8 -21% 0 0 0%
Solvent Evaporation:
Consumer Products 86.6 86.5 0% 0 0 0%
Architectural Coatings 21.5 13.3 -38% 0 0 0%
Others 2.0 2.4 17% 0 0 0%
Misc. Processes 9.7 7.8 -20% 15.5 14.5 -6%
RECLAIM SOURCES 0 0 0% 27.2 19.6 -28%
Total Stationary Sources 240 211 -12% 74 65 -13%
MOBILE SOURCES
On-Road Vehicles 138.4 162.4 17% 285.2 293.1 3%
Off-Road Vehicles 137.7 126.3 -8% 168.5 164.6 -2%
Total Mobile Sources 276 289 5% 454 458 1%
TOTAL 516 500 -3% 528 522 -1%
1 Values may not sum due to rounding errors
1-3-12

Chapter 3: Base Year and Future Emissions
TABLE 3-1B Comparison of SOx and PM2.5 Emissions By Major Source Category of
2012 Base Year in 2016 AQMP and Projected 2012 in 2012 AQMP Annual Average (tpd1)
SOURCE CATEGORY
2012 AQMP
2016 AQMP
% Change
2012 AQMP
2016 AQMP
% Change
SOx PM2.5
STATIONARY SOURCES
Fuel Combustion 1.9 1.9 -1% 5.6 5.6 1%
Waste Disposal 0.4 0.5 20% 0.2 0.2 -13%
Cleaning and Surface Coatings 0 0 0% 1.5 1.4 -5%
Petroleum Production and Marketing
0.6 0.4 -26% 1.6 1.5 -6%
Industrial Processes 0.02 0.1 400% 6.7 6.4 -6%
Solvent Evaporation:
Consumer Products 0 0 0% 0 0 0%
Architectural Coatings 0 0 0% 0 0 0%
Others 0 0 0% 0 0 0%
Misc. Processes 1.0 0.5 -47% 32.5 28.8 -11%
RECLAIM SOURCES 11.8 6.9 -42% 0 0 0%
Total Stationary Sources 16 10 -34% 48 44 -9%
MOBILE SOURCES
On-Road Vehicles 2.1 2.0 -2% 14.6 14.4 -1%
Off-Road Vehicles 6.3 6.1 -2% 9.0 8.1 -10%
Total Mobile Sources 8 8 -2% 24 23 -5%
TOTAL 24 18 -23% 72 66 -7%
1 Values may not sum due to rounding errors
3-13

Final 2016 AQMP
TABLE 3-2
Summary of Emissions By Major Source Category: 2012 Base Year Average Annual Day and Summer Planning (tpd1)
SOURCE CATEGORY Annual Average
Summer Planning
VOC NOx CO SOx PM2.5 NH3 VOC NOx
STATIONARY SOURCES
Fuel Combustion 11 28 49 2 6 9 11 28
Waste Disposal 13 2 1 0 0 5 14 2
Cleaning and Surface Coatings
34 0 0 0 1 0 36 0
Petroleum Production and Marketing
29 0 5 0 2 0 29 0
Industrial Processes 10 0 0 0 6 9 11 0
Solvent Evaporation:
Consumer Products 87 0 0 0 0 0 87 0
Architectural Coatings 13 0 0 0 0 0 13 0
Others 2 0 0 0 0 1 2 0
Misc. Processes 13 21 54 1 29 38 8 15
RECLAIM SOURCES 0 19 0 7 0 0 0 20
Total Stationary Sources 212 70 109 10 44 63 211 65
MOBILE SOURCES
On-Road Vehicles 158 317 1328 2 14 18 162 293
Off-Road Vehicles 100 153 686 6 8 0 126 165
Total Mobile Sources 258 470 2014 8 23 18 289 458
TOTAL 470 540 2123 18 66 81 500 522
1 Values may not sum due to rounding errors 2 Includes entrained road dust
1-3-14

Chapter 3: Base Year and Future Emissions
FIGURE 3-3
RELATIVE CONTRIBUTION BY SOURCE CATEGORY TO 2012 EMISSION INVENTORY
(VOC & NOX – SUMMER PLANNING; CO, SOX, & PM2.5 – ANNUAL AVERAGE INVENTORY VALUES ARE ROUNDED TO
NEAREST INTEGER AND MAY NOT SUM DUE TO ROUNDING)
point, 6%area, 17%
Architectural Coating & Consumer
Product,20%on-road , 33%
off-road, 25%
VOC Emissions: 500 tons/day
point, 5%area, 7%
on-road , 56%
off-road, 32%
NOx Emissions: 522 tons/day
point, 1% area, 4%
on-road , 63%
off-road, 32%
CO Emissions: 2123 tons/day
point, 50%
area, 6%
on-road , 11%
off-road, 33%
SOx Emissions: 18 tons/day
point, 12%
area, 42%on-road ,
22%
off-road, 12%
road dust, 13%
Directly Emitted PM2.5 Emissions: 66 tons/day
3-15

Final 2016 AQMP
FIGURE 3-4
2012 EMISSION INVENTORY AGENCY PRIMARY RESPONSIBILITY
(VOC & NOX – SUMMER PLANNING; SOX, & PM2.5 – ANNUAL AVERAGE INVENTORY. VALUES ARE ROUNDED TO
NEAREST INTEGER AND MAY NOT SUM DUE TO ROUNDING)
U.S. EPA, 4%
CARB, 73%
SCAQMD, 23%
VOC Emissions: 500 tons/day
U.S. EPA, 19%
CARB, 69%
SCAQMD 12%
NOx Emissions: 522 tons/day
U.S. EPA, 33%
CARB, 11%
SCAQMD, 56%
SOx Emissions: 18 tons/day
U.S. EPA, 6%
CARB, 28%
SCAQMD 66%
Directly Emitted PM2.5 Emissions: 66 tons/day
1-3-16

Chapter 3: Base Year and Future Emissions
Future Emissions Inventory Development
Inventories were developed for 2012, 2019, 2022, 2023, 2025, and 2031. Year 2012 is the base-year for the attainment demonstrations. Years 2023 and 2031 are the attainment years for the federal 8-hour ozone standards of 80 ppb (revoked) and 75 ppb, respectively. The 2022 inventory was developed to show attainment for the revoked 1-hour ozone standard (120 ppb). The 2019 and 2025 inventories were used to demonstrate attainment for the federal 24-hour and annual PM2.5 standards, respectively.
Future-year stationary source emissions are divided into RECLAIM and non-RECLAIM emissions. Future NOx and SOx emissions from RECLAIM sources are estimated based on their allocations as specified by District Rule 2002 –Allocations for NOx and SOx. The forecasts for non-RECLAIM emissions were derived using: (1) emissions from the 2012 base year, (2) expected controls after implementation of District rules adopted by December 2015 and CARB rules adopted as of November 2015, and (3) activity growth in various source categories between the base and future years.
Demographic growth forecasts for various socioeconomic categories (e.g., population, housing, employment by industry), developed by SCAG for their 2016 RTP/SCS, were used. Industry growth factors for 2012, 2017, 2018, 2019, 2020, 2021, 2022, 2023, 2025, 2026, 2031, and 2037 are also provided by SCAG, and interim years are calculated by linear interpolation. Table 3-3 summarizes key socioeconomic parameters used in the 2016 AQMP for emissions inventory development.
In this chapter, the inventories for 2019, 2022, 2023, 2025, and 2031, the 8-hour ozone, 1-hour ozone, along with the annual and 24-hour PM2.5 attainment target years are discussed.
3-17

Final 2016 AQMP
TABLE 3-3 Baseline Demographic Forecasts in the 2016 AQMP and the Final 2012 AQMP
CATEGORY 2012 2023 2023 %
GROWTH FROM 2012
2031 2031 %
GROWTH FROM 2012
Population (Millions)
15.9 17.1 7% 17.9 12%
Housing Units (Millions)
5.1 5.7 10% 6.0 16%
Total Employment (Millions)
6.7 7.8 16% 8.2 23%
Daily VMT (Millions)
380 407 7% 409 8%
Current forecasts indicate that this region will experience a population growth of 7 percent between 2012 and 2023, with a 7 percent increase in vehicle miles traveled (VMT) and a population growth of 12 percent by the year 2031 with an 8 percent increase in VMT.
As compared to the projections in the 2012 AQMP, the current 2023 projections in the 2016 AQMP predict a population of about 200,000 fewer people (2.8 percent less), 100,000 more total employment (1.2 percent more), and 11 million miles more in the daily VMT forecast (2.7 percent more).
Summary of Future Baseline Emissions
To illustrate trends in the future baseline emissions inventories, emissions data by source categories (point, area, on-road mobile and off-road mobile sources) and by pollutant are presented in Tables 3-4A through 3-4E for the years 2019, 2022, 2023, 2025, and 2031. Baseline inventories are projected future emissions that reflect already adopted rules and regulations, but not additional controls proposed in the 2016 AQMP. This is in contrast to the 2012 base year emission inventory, which captures the actual 2012 emissions and is used as a basis for the projection of future inventories. Tables 3-4 provide annual average, as well as summer planning inventories. Emissions inventories for 2021, the “moderate” annual PM2.5 attainment deadline and milestone years for the Reasonable Further Progress (RTP) analysis (2024, 2027, 2028, 2029 and 2030) can be found in Appendix III.
Without any additional control measures, VOC and NOx emissions are expected to decrease due to existing regulations, such as controls for on- and off-road equipment, new vehicle standards, and the RECLAIM program. However, consistent with what was shown earlier with the mobile source categories, the emissions of SOx and PM2.5 show increases after 2022, when most of the rules and regulations will be fully implemented. Increases in emissions due to increase in population and activity outpace the emission reductions from introducing newer and cleaner equipment and vehicles. Figure 3-5 illustrates the relative contribution to the 2031 inventory by source category. A comparison of Figures 3-3 and 3-
1-3-18

Chapter 3: Base Year and Future Emissions
5 indicates that the on-road mobile category continues to be a major contributor to CO and NOx emissions. However, because of the implementation of most of the mobile source rules and regulations by 2023, 2031 on-road mobile sources account for much less of the VOC, NOx, and CO emissions as compared to 2012: about 14 percent of total VOC emissions compared to 33 percent in 2012; about 30 percent of total NOx emissions compared to 56 percent in 2012; and about 26 percent of total CO emissions compared to 63 percent in 2012. For directly emitted PM2.5, mobile sources will represent 23 percent of the emissions with another 14 percent due to vehicle-related entrained road dust, a reduction from the mobile source contribution in the base-year. It is projected that stationary sources will emit the majority of the SOx emissions with the point source category, contributing 55 percent of the SOx emissions in the Basin. In 2031, area sources will play even a larger role in VOC emissions, emitting more than point sources and mobile sources combined. Area sources will become the major contributor to VOC emissions from 37 percent in 2012 to 55 percent in 2031 and are projected to remain as the predominant source of directly emitted PM2.5 emissions (49 percent). See Figures 3-7 through 3-30 for the highest-ranking source categories for 2012, 2019, 2022, 2023, 2025, and 2031.
Figure 3-6 shows the fraction of the 2031 inventory by responsible agency for VOC, NOx, SOx, and directly emitted PM2.5. In 2031, a larger fraction of the NOx and VOC emissions will fall under the SCAQMD control. However, the majority of VOC and NOx emissions will remain primarily under CARB and EPA jurisdiction. The fraction of SOx emissions that fall under SCAQMD control will remain largely unchanged from the 2012 base-year inventory. However, the increasing contribution of area and point sources towards direct PM2.5 emissions in 2031 will result in a larger fraction of emissions falling under SCAQMD control.
3-19

Final 2016 AQMP
FIGURE 3-5 RELATIVE CONTRIBUTION BY SOURCE CATEGORY TO 2031 EMISSION INVENTORY
(VOC & NOX – SUMMER PLANNING; CO, SOX, & PM2.5 – ANNUAL AVERAGE INVENTORY - VALUES ARE ROUNDED TO
NEAREST INTEGER AND MAY NOT SUM DUE TO ROUNDING)
point, 9%
area, 25%
Architectural Coating & Consumer Product,
30%
on-road , 14%
off-road, 22%
VOC Emissions: 362 tons/day
point, 11%
area, 12%
on-road , 30%
off-road, 47%
NOx Emissions: 214 tons/day
point, 3%area, 7%
on-road , 26%
off-road, 64%
CO Emissions: 1118 tons/day
point, 48%
area, 7%on-road ,
8%
off-road, 37%
SOx Emissions: 18 tons/day
point, 14%
area, 49%
on-road , 15%
off-road, 8%
road dust, 14%
Directly Emitted PM2.5 Emissions: 65 tons/day
1-3-20

Chapter 3: Base Year and Future Emissions
FIGURE 3-6
2031 EMISSION INVENTORY AGENCY RESPONSIBILITY
(VOC & NOX – SUMMER PLANNING; SOX & PM2.5 – ANNUAL AVERAGE INVENTORY. VALUES ARE ROUNDED TO
NEAREST INTEGER AND MAY NOT SUM DUE TO ROUNDING)
U.S. EPA, 5%
CARB, 59%
SCAQMD, 36%
VOC Emissions: 362 tons/day
U.S. EPA, 30%
CARB, 48%
SCAQMD 21%
NOx Emissions: 214 tons/day
U.S. EPA, 37%
CARB, 8%
SCAQMD, 55%
SOx Emissions: 18 tons/day
U.S. EPA, 5%
CARB, 18%
SCAQMD 77%
Directly Emitted PM2.5 Emissions: 65 tons/day
3-21

Final 2016 AQMP
TABLE 3-4A
Summary of Emissions By Major Source Category: 2019 Baseline (24-hr PM2.5 attainment year) Average Annual Day and Summer Planning (tpd1)
SOURCE CATEGORY ANNUAL AVERAGE
SUMMER
PLANNING
VOC NOx CO SOx PM2.5 NH3 VOC NOx
STATIONARY SOURCES
Fuel Combustion 11 23 48 2 6 9 11 23
Waste Disposal 14 2 1 1 0 6 16 2
Cleaning and Surface Coatings 42 0 0 0 2 0 43 0
Petroleum Production and Marketing 21 0 5 0 2 0 21 0
Industrial Processes 12 0 1 0 7 9 13 0
Solvent Evaporation:
Consumer Products 88 0 0 0 0 0 88 0
Architectural Coatings 12 0 0 0 0 0 12 0
Others 2 0 0 0 0 1 3 0
Misc. Processes2 13 14 56 1 31 35 7 10
RECLAIM Sources3 0 23 0 6 0 0 0 23
Total Stationary Sources 214 62 111 10 47 60 213 59
MOBILE SOURCES
On-Road Vehicles 82 167 639 2 11 14 86 155
Off-Road Vehicles 79 124 697 5 6 0 98 133
Total Mobile Sources 161 291 1336 7 17 14 184 289
TOTAL 376 353 1447 17 64 74 398 347
1 Values are rounded to nearest integer and may not sum due to rounding 2 Includes entrained road dust 3 Includes 2015 RECLAIM NOx shaves
1-3-22

Chapter 3: Base Year and Future Emissions
TABLE 3-4B
Summary of Emissions By Major Source Category: 2022 Baseline (1-hr ozone attainment year) Average Annual Day and Summer Planning (tpd1)
SOURCE CATEGORY Annual Average
Summer Planning
VOC NOx CO SOx PM2.5 NH3 VOC NOx
STATIONARY SOURCES
Fuel Combustion 11 22 49 2 6 9 11 22
Waste Disposal 15 2 1 1 0 6 17 3
Cleaning and Surface Coatings 45 0 0 0 2 0 47 0
Petroleum Production and Marketing 20 0 5 0 2 0 20 0
Industrial Processes 12 0 1 0 7 9 13 0
Solvent Evaporation:
Consumer Products 90 0 0 0 0 0 90 0
Architectural Coatings 12 0 0 0 0 0 12 0
Others 2 0 0 0 0 1 3 0
Misc. Processes2 13 13 56 1 31 35 7 10
RECLAIM Sources3 0 15 0 6 0 0 0 15
Total Stationary Sources 220 53 112 10 48 60 220 50
MOBILE SOURCES
On-Road Vehicles 68 125 498 2 10 13 71 117
Off-Road Vehicles 74 113 715 5 6 0 92 120
Total Mobile Sources 142 238 1213 7 16 13 163 237
TOTAL 362 290 1325 17 64 73 383 287
1 Values are rounded to nearest integer and may not sum due to rounding 2 Includes entrained road dust 3 Includes 2015 RECLAIM NOx shaves
3-23

Final 2016 AQMP
TABLE 3-4C
Summary of Emissions By Major Source Category: 2023 Baseline (1997 8-hr ozone attainment year) Average Annual Day and Summer Planning (tpd1)
SOURCE CATEGORY Annual Average
Summer Planning
VOC NOx CO SOx PM2.5 NH3 VOC NOx
STATIONARY SOURCES
Fuel Combustion 11 22 49 2 6 9 11 22
Waste Disposal 15 2 1 1 0 6 17 3
Cleaning and Surface Coatings 46 0 0 0 2 0 47 0
Petroleum Production and Marketing 20 0 5 0 2 0 20 0
Industrial Processes 13 0 1 0 8 9 14 0
Solvent Evaporation:
Consumer Products 90 0 0 0 0 0 90 0
Architectural Coatings 12 0 0 0 0 0 12 0
Others 2 0 0 0 0 1 3 0
Misc. Processes2 13 13 56 1 32 35 7 10
RECLAIM Sources3 0 15 0 6 0 0 0 15
Total Stationary Sources 222 52 112 10 48 60 220 50
MOBILE SOURCES
On-Road Vehicles 65 94 465 2 10 13 68 88
Off-Road Vehicles 73 110 721 6 6 0 90 117
Total Mobile Sources 137 204 1186 7 16 13 158 205
TOTAL 359 257 1298 17 64 72 379 255
1 Values are rounded to nearest integer and may not sum due to rounding 2 Includes entrained road dust 3 Includes 2015 RECLAIM NOx shaves
1-3-24

Chapter 3: Base Year and Future Emissions
TABLE 3-4D
Summary of Emissions By Major Source Category: 2025 Baseline (annual PM2.5 attainment year) Average Annual Day and Summer Planning (tpd1)
SOURCE CATEGORY Annual Average
Summer Planning
VOC NOx CO SOx PM2.5 NH3 VOC NOx
STATIONARY SOURCES
Fuel Combustion 11 22 50 2 6 9 11 22
Waste Disposal 16 2 1 1 0 6 18 3
Cleaning and Surface Coatings 47 0 0 0 2 0 49 0
Petroleum Production and Marketing 19 0 5 0 2 0 20 0
Industrial Processes 13 0 1 0 8 9 14 0
Solvent Evaporation:
Consumer Products 91 0 0 0 0 0 91 0
Architectural Coatings 12 0 0 0 0 0 12 0
Others 3 0 0 0 0 1 3 0
Misc. Processes2 13 13 56 1 32 35 7 9
RECLAIM Sources3 0 15 0 6 0 0 0 15
Total Stationary Sources 224 52 112 10 49 60 223 49
MOBILE SOURCES
On-Road Vehicles 58 85 403 2 10 12 61 79
Off-Road Vehicles 71 104 731 6 5 0 87 110
Total Mobile Sources 129 189 1134 7 15 12 148 190
TOTAL 353 241 1247 17 64 72 372 239
1 Values are rounded to nearest integer and may not sum due to rounding 2 Includes entrained road dust 3 Includes 2015 RECLAIM NOx shaves
3-25

Final 2016 AQMP
TABLE 3-4E
Summary of Emissions By Major Source Category: 2031 Baseline (2008 8-hr ozone attainment year) Average Annual Day and Summer Planning (tpd1)
SOURCE CATEGORY Annual Average
Summer Planning
VOC NOx CO SOx PM2.5 NH3 VOC NOx
STATIONARY SOURCES
Fuel Combustion 11 22 51 2 6 9 11 22
Waste Disposal 16 2 1 1 0 6 19 3
Cleaning and Surface Coatings 50 0 0 0 2 1 52 0
Petroleum Production and Marketing 18 0 5 0 2 0 18 0
Industrial Processes 13 0 1 0 8 9 14 0
Solvent Evaporation:
Consumer Products 94 0 0 0 0 0 94 0
Architectural Coatings 13 0 0 0 0 0 13 0
Others 3 0 0 0 0 1 3 0
Misc. Processes2 13 11 56 1 33 36 7 9
RECLAIM Sources3 0 15 0 6 0 0 0 15
Total Stationary Sources 231 51 113 10 50 61 231 50
MOBILE SOURCES
On-Road Vehicles 47 69 309 1 10 12 49 65
Off-Road Vehicles 66 94 766 7 5 0 81 100
Total Mobile Sources 114 163 1074 8 15 12 130 165
TOTAL 345 214 1188 18 65 73 362 214
1 Values may not sum due to rounding 2 Includes entrained road dust 3 Includes 2015 RECLAIM NOx shaves
1-3-26
Chapter 3: Base Year and Future Emissions
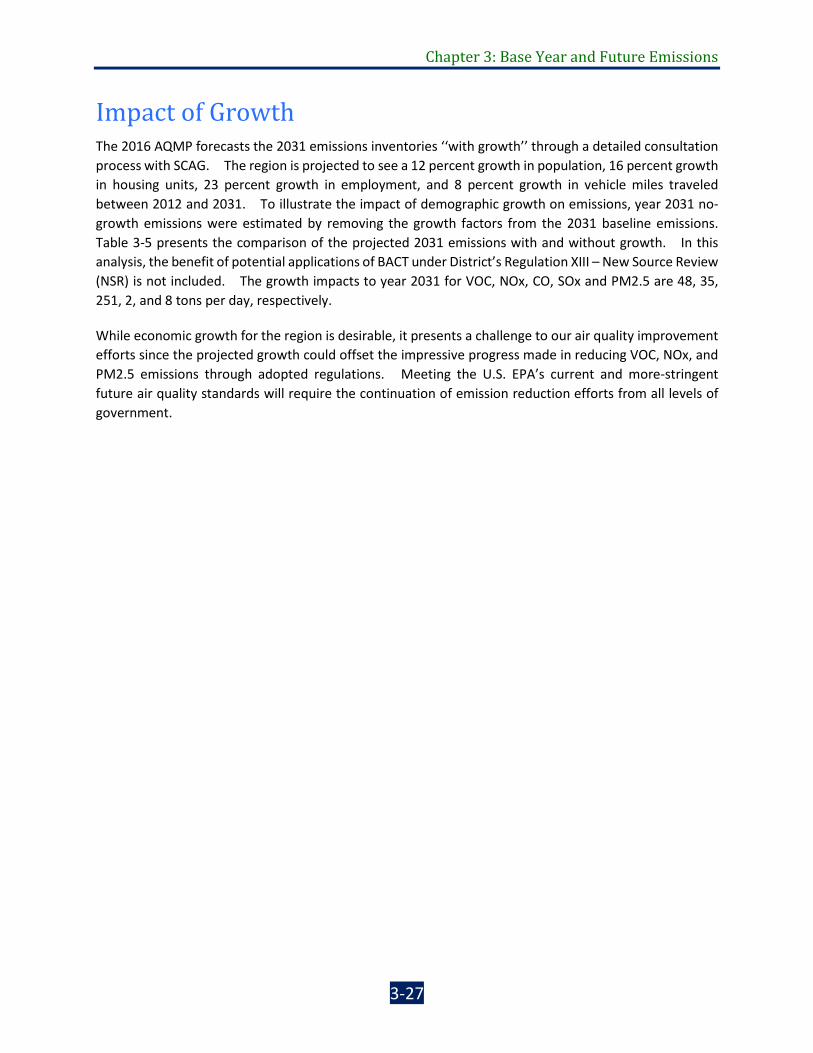
Impact of Growth The 2016 AQMP forecasts the 2031 emissions inventories ‘‘with growth’’ through a detailed consultation process with SCAG. The region is projected to see a 12 percent growth in population, 16 percent growth in housing units, 23 percent growth in employment, and 8 percent growth in vehicle miles traveled between 2012 and 2031. To illustrate the impact of demographic growth on emissions, year 2031 no-growth emissions were estimated by removing the growth factors from the 2031 baseline emissions. Table 3-5 presents the comparison of the projected 2031 emissions with and without growth. In this analysis, the benefit of potential applications of BACT under District’s Regulation XIII – New Source Review (NSR) is not included. The growth impacts to year 2031 for VOC, NOx, CO, SOx and PM2.5 are 48, 35, 251, 2, and 8 tons per day, respectively.
While economic growth for the region is desirable, it presents a challenge to our air quality improvement efforts since the projected growth could offset the impressive progress made in reducing VOC, NOx, and PM2.5 emissions through adopted regulations. Meeting the U.S. EPA’s current and more-stringent future air quality standards will require the continuation of emission reduction efforts from all levels of government.
3-27

Final 2016 AQMP
TABLE 3-5
Growth Impact to 2031 Emissions1 in Tons per Day
WITH GROWTH VOC NOx CO SOx PM2.5
Point 30 21 34 9 9
Area 201 29 80 1 32
Road Dust 0 0 0 0 9
On-Road 47 69 309 1 10
Off-Road 66 94 766 7 5
Total 345 214 1188 18 65
NO GROWTH VOC NOx CO SOx PM2.5
Point 24 20 31 8 8
Area 178 32 78 1 28
Road Dust 0 0 0 0 8
On-Road 46 51 299 1 9
Off-Road 49 76 519 5 4
Total 297 179 927 16 57
IMPACT OF GROWTH VOC NOx CO SOx PM2.5
Point 6 1 3 0 1
Area 23 -3 2 0 4
Road Dust 0 0 0 0 1
On-Road 1 18 10 0 1
Off-Road 18 19 237 2 1
Total 48 35 251 2 8
1Annual Average Inventory
1-3-28

Chapter 3: Base Year and Future Emissions
Top Ten Source Categories (2012, 2019, 2022, 2023, 2025, and 2031) The rankings of the top ten source contributors to the emissions inventories for specific years for VOC, NOx, SOx and PM2.5 are listed and briefly discussed in this section. The summer planning inventories for VOC and NOx, along with the annual average inventories for SOx and PM2.5 for 2012, 2019, 2022, 2023, 2025, and 2031 are shown in Figures 3-7 to 3-30.
Figures 3-7 to 3-12 provide the top ten categories for each of the six inventory years for VOCs. Two of top four categories are on-road mobile sources in the 2012 inventory, but none of the on-road categories are found in the top four categories for 2023, 2025 or 2031. This demonstrates the effect of more-stringent on-road standards in the future. Consumer products, and off-road equipment remain as high-emitting categories over time. The coatings and related processes category becomes much more significant in future years. The top 10 categories account for 78 percent of the total VOC inventory in 2012 and continue to account for over 72 percent through 2031.
NOTE: Figures 3-7, and 3-14 through 3-30 have been updated from the Draft Plan to reflect the latest emission inventory values (e.g., aircraft NOx and SOx, paved road dust PM2.5).
FIGURE 3-7
TOP TEN EMITTER CATEGORIES FOR VOC IN 2012 (SUMMER PLANNING)
87
6860
44 43
22 2219 13 11
0
30
60
90
120
VOC
Emis
sion
s (t
ons/
day)
3-29

Final 2016 AQMP
FIGURE 3-8
TOP TEN EMITTER CATEGORIES FOR VOC IN 2019 (SUMMER PLANNING)
FIGURE 3-9
TOP TEN EMITTER CATEGORIES FOR VOC IN 2022 (SUMMER PLANNING)
88
48
30 3023 22
15 14 13 12
0
30
60
90
120
VOC
Emis
sion
s (t
ons/
day)
90
46
25 25 2418 14 13 12 12
0
30
60
90
120
VOC
Emis
sion
s (t
ons/
day)
1-3-30

Chapter 3: Base Year and Future Emissions
FIGURE 3-10
TOP TEN EMITTER CATEGORIES FOR VOC IN 2023 (SUMMER PLANNING)
FIGURE 3-11
TOP TEN EMITTER CATEGORIES FOR VOC IN 2025 (SUMMER PLANNING)
90
46
25 24 23 17 15 13 12 11
0
30
60
90
120
VOC
Emis
sion
s (t
ons/
day)
91
46
25 21 20 16 15 12 12 10
0
30
60
90
120
VOC
Emis
sion
s (t
ons/
day)
3-31
Final 2016 AQMP
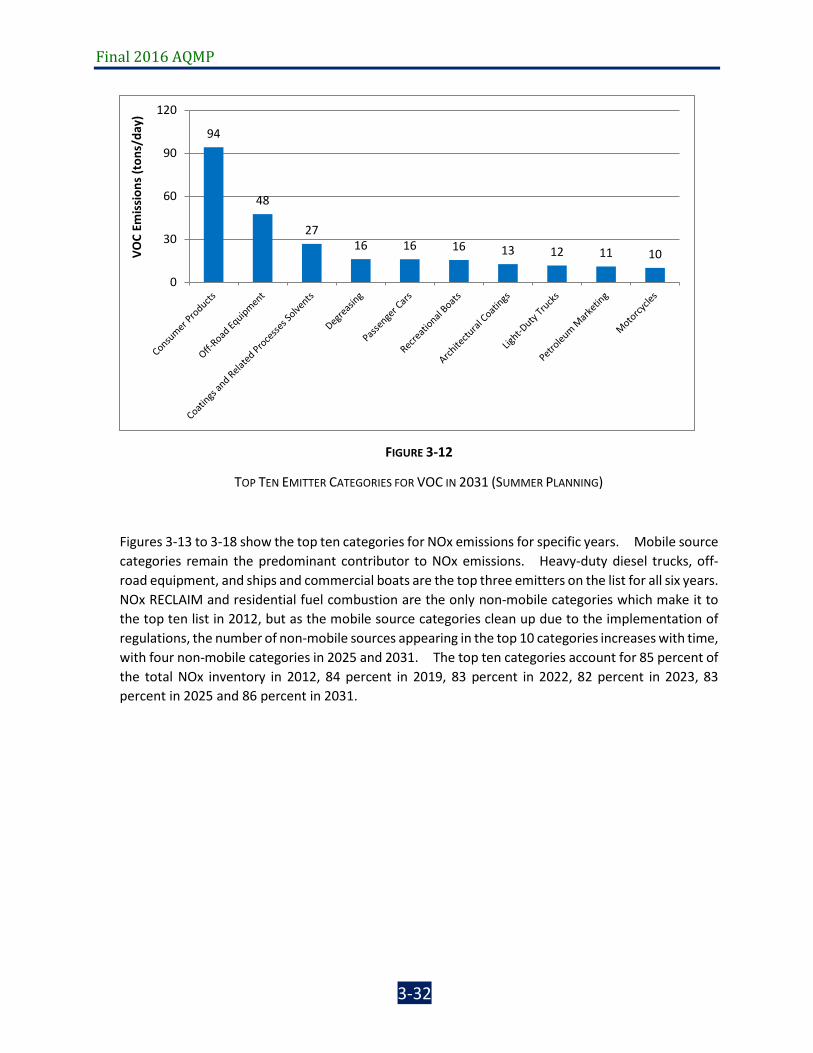
FIGURE 3-12
TOP TEN EMITTER CATEGORIES FOR VOC IN 2031 (SUMMER PLANNING)
Figures 3-13 to 3-18 show the top ten categories for NOx emissions for specific years. Mobile source categories remain the predominant contributor to NOx emissions. Heavy-duty diesel trucks, off-road equipment, and ships and commercial boats are the top three emitters on the list for all six years. NOx RECLAIM and residential fuel combustion are the only non-mobile categories which make it to the top ten list in 2012, but as the mobile source categories clean up due to the implementation of regulations, the number of non-mobile sources appearing in the top 10 categories increases with time, with four non-mobile categories in 2025 and 2031. The top ten categories account for 85 percent of the total NOx inventory in 2012, 84 percent in 2019, 83 percent in 2022, 82 percent in 2023, 83 percent in 2025 and 86 percent in 2031.
94
48
2716 16 16 13 12 11 10
0
30
60
90
120
VOC
Emis
sion
s (t
ons/
day)
1-3-32

Chapter 3: Base Year and Future Emissions
FIGURE 3-13
TOP TEN EMITTER CATEGORIES FOR NOX IN 2012 (SUMMER PLANNING)
FIGURE 3-14
TOP TEN EMITTER CATEGORIES FOR NOX IN 2019 (SUMMER PLANNING)
147
73
47 42 3727 20 20 19 14
0
50
100
150
200
NO
x Em
issi
ons
(ton
s/da
y)
87
5438
23 18 17 16 15 13 10
0
50
100
150
200
NO
x Em
issi
ons
(ton
s/da
y)
3-33

Final 2016 AQMP
FIGURE 3-15
TOP TEN EMITTER CATEGORIES FOR NOX IN 2022 (SUMMER PLANNING)
FIGURE 3-16
TOP TEN EMITTER CATEGORIES FOR NOX IN 2023 (SUMMER PLANNING)
67
4535
17 16 15 13 10 10 10
0
50
100
150
200
NO
x Em
issi
ons
(ton
s/da
y)
43 4334
17 15 15 12 10 9 9
0
50
100
150
200
NO
x Em
issi
ons
(ton
s/da
y)
1-3-34

Chapter 3: Base Year and Future Emissions
FIGURE 3-17
TOP TEN EMITTER CATEGORIES FOR NOX IN 2025 (SUMMER PLANNING)
FIGURE 3-18
TOP TEN EMITTER CATEGORIES FOR NOX IN 2031 (SUMMER PLANNING)
42 39 3218 15 14 10 10 9 9
0
50
100
150
200
NO
x Em
issi
ons
(ton
s/da
y)
4133 29 20 15 11 10 9 9 7
0
50
100
150
200
NO
x Em
issi
ons
(ton
s/da
y)
3-35

Final 2016 AQMP
Figures 3-19 to 3-23 show the top source categories for SOx emissions in the years 2012, 2019, 2022, 2023, 2025 and 2031. The emission levels of SOx are relatively low. Therefore, only the categories that emit more than 0.5 tons per day of SOx are ranked and listed. The top five high emitting source categories remain the same in all years. SOx RECLAIM and Ships & Commercial Boats are the most significant contributors. The top categories represent 81 percent, 79 percent, 79 percent, 79 percent, 80 percent and 81 percent of the total SOx inventory in 2012, 2019, 2022, 2023, 2025, and 2031, respectively.
FIGURE 3-19
TOP EMITTER CATEGORIES FOR SOX 0.5 TPD AND OVER IN 2012 (ANNUAL AVERAGE)
6.9
4.6
1.5 1.2 0.8
0
2
4
6
8
10
SOx
Emis
sion
s (t
ons/
day)
1-3-36

Chapter 3: Base Year and Future Emissions
FIGURE 3-20
TOP EMITTER CATEGORIES FOR SOX 0.5 TPD AND OVER IN 2019 (ANNUAL AVERAGE)
FIGURE 3-21
TOP EMITTER CATEGORIES FOR SOX 0.5 TPD AND OVER IN 2022 (ANNUAL AVERAGE)
6.1
3.11.8
1.30.7
0
2
4
6
8
10SO
x Em
issi
ons
(ton
s/da
y)
6.1
3.4
2.01.4
0.7
0
2
4
6
8
10
SOx
Emis
sion
s (t
ons/
day)
3-37

Final 2016 AQMP
FIGURE 3-22
TOP EMITTER CATEGORIES FOR SOX 0.5 TPD AND OVER IN 2023 (ANNUAL AVERAGE)
FIGURE 3-23
TOP EMITTER CATEGORIES FOR SOX 0.5 TPD AND OVER IN 2025 (ANNUAL AVERAGE)
6.1
3.5
2.01.4
0.6
0
2
4
6
8
10
SOx
Emis
sion
s (t
ons/
day)
6.1
3.6
2.21.4
0.6
0
2
4
6
8
10
SOx
Emis
sion
s (t
ons/
day)
1-3-38

Chapter 3: Base Year and Future Emissions
FIGURE 3-24
TOP EMITTER CATEGORIES FOR SOX 0.5 TPD AND OVER IN 2031 (ANNUAL AVERAGE)
Figures 3-25 to 3-30 show the top ten source categories in specific years for directly emitted PM2.5. Commercial cooking, paved road dust, and residential fuel combustion are the top three highest emitting categories for all six years. The top ten categories represent 72 percent of the total directly emitted PM2.5 inventory in 2012 and 2019, and 73 percent in 2023 through 2031.
6.1
4.2
2.41.5
0.5
0
2
4
6
8
10SO
x Em
issi
ons
(ton
s/da
y)
3-39

Final 2016 AQMP
FIGURE 3-25
TOP TEN EMITTER CATEGORIES FOR DIRECTLY EMITTED PM2.5 IN 2012 (ANNUAL AVERAGE)
FIGURE 3-26
TOP TEN EMITTER CATEGORIES FOR DIRECTLY EMITTED PM2.5 IN 2019 (ANNUAL AVERAGE)
10.4
7.7 7.2
5.0 4.73.9
2.7 2.4 2.2 1.7
0.0
3.0
6.0
9.0
12.0
15.0
PM2.
5 Em
issi
ons
(ton
s/da
y)
11.6
8.26.6
4.9
2.9 2.9 2.8 2.4 2.2 1.8
0.0
3.0
6.0
9.0
12.0
15.0
PM2.
5 Em
issi
ons
(ton
s/da
y)
1-3-40

Chapter 3: Base Year and Future Emissions
FIGURE 3-27
TOP TEN EMITTER CATEGORIES FOR DIRECTLY EMITTED PM2.5 IN 2022 (ANNUAL AVERAGE)
FIGURE 3-28
TOP TEN EMITTER CATEGORIES FOR DIRECTLY EMITTED PM2.5 IN 2023 (ANNUAL AVERAGE)
12.0
8.4
6.54.9
3.1 2.8 2.5 2.5 2.2 1.7
0.0
3.0
6.0
9.0
12.0
15.0
PM2.
5 Em
issi
ons
(ton
s/da
y)
12.1
8.5
6.54.9
3.1 2.8 2.6 2.4 2.2 1.7
0.0
3.0
6.0
9.0
12.0
15.0
PM2.
5 Em
issi
ons
(ton
s/da
y)
3-41

Final 2016 AQMP
FIGURE 3-29
TOP TEN EMITTER CATEGORIES FOR DIRECTLY EMITTED PM2.5 IN 2025 (ANNUAL AVERAGE)
FIGURE 3-30
TOP TEN EMITTER CATEGORIES FOR DIRECTLY EMITTED PM2.5 IN 2031 (ANNUAL AVERAGE)
12.3
8.6
6.54.9
3.2 2.8 2.6 2.2 2.2 1.7
0.0
3.0
6.0
9.0
12.0
15.0
PM2.
5 Em
issi
ons
(ton
s/da
y)
12.8
8.8
6.54.8
3.3 2.9 2.8 2.2 2.0 1.8
0.0
3.0
6.0
9.0
12.0
15.0
PM2.
5 Em
issi
ons
(ton
s/da
y)
1-3-42
![SOUTH COAST AIR QUALITY MANAGEMENT DISTRICT FINAL ...€¦ · Quality Management District (SCAQMD) Regulations and improve in-Basin (South Coast Air Basin [Basin]) power reliability,](https://img.pdfslide.us/doc/110x75/5f860f505bc6182863561c78/south-coast-air-quality-management-district-final-quality-management-district.jpg)