Embed Size (px)
Citation preview

2016 AQMP WHITE PAPER
PM Controls
OCTOBER 2015
SOUTH COASTAIR QUALITYMANAGEMENT DISTRICT
SOUTH COAST AIR QUALITY MANAGEMENT DISTRICTGOVERNING BOARD
CHAIRMAN: WILLIAM A. BURKE, Ed.D.
Speaker of the Assembly Appointee
VICE CHAIRMAN: DENNIS YATESMayor, Chino
Cities of San Bernardino County
MEMBERS:MICHAEL D. ANTONOVICH
Supervisor, Fifth DistrictCounty of Los Angeles
BEN BENOITMayor, Wildomar
Cities of Riverside County
JOHN J. BENOITSupervisor, Fourth District
County of Riverside
JOE BUSCAINOCouncilmember, 15th District
City of Los Angeles Representative
MICHAEL A. CACCIOTTICouncilmember, South Pasadena
Cities of Los Angeles County/Eastern Region
JOSEPH K. LYOU, Ph.D.Governor’s Appointee
JUDITH MITCHELLCouncilmember, Rolling Hills Estates
Cities of Los Angeles County/Western Region
SHAWN NELSONSupervisor, Fourth District
County of Orange
DR. CLARK E. PARKER, SR.Senate Rules Appointee
MIGUEL A. PULIDOMayor, Santa Ana
Cities of Orange County
JANICE RUTHERFORDSupervisor, Second DistrictCounty of San Bernardino

South Coast Air Quality Management District
Barry R. Wallerstein, D.Env. Executive Officer
Philip M. Fine, Ph.D.
Deputy Executive Officer Planning, Rule Development & Area Sources
Jill Whynot
Assistant Deputy Executive Officer Planning, Rule Development & Area Sources
Authors
Tracy Goss, P.E. – Planning and Rules Manager Michael Laybourn – Air Quality Specialist
Jong Hoon Lee, Ph.D. – Air Quality Specialist
Contributors
Kalam Cheung, Ph.D. – Air Quality Specialist Shoreh Cohanim – Air Quality Specialist
Kevin Durkee – Senior Meteorologist Scott Epstein, Ph.D. – Air Quality Specialist
Susan Yan – Air Quality Specialist Elaine Chang, DrPH – Deputy Executive Officer (retired)
Jean Ospital, DrPH – Health Effects Officer (retired)
Reviewers
Barbara Baird, J.D. – Chief Deputy Counsel Patti Whiting – Staff Specialist

Table of Contents INTRODUCTION ....................................................................................................................................................... 1
BACKGROUND ......................................................................................................................................................... 2
PM2.5 and Precursors ......................................................................................................................................... 2
Trends in PM2.5 Levels ....................................................................................................................................... 4
ASSESSING FUTURE CONTROL STRATEGIES ............................................................................................................. 6
Emission Sources of PM2.5 ................................................................................................................................. 6
Control Effectiveness ........................................................................................................................................... 7
RECOMMENDATIONS - PATH TO PM2.5 ATTAINMENT IN THE 2016 AQMP ............................................................. 9
Control Strategy .................................................................................................................................................. 9
Co-Benefits from the Ozone NOx Strategy .................................................................................................... 10
Co-Benefits from Climate Change or Air Toxic Control Programs ................................................................. 10
Outreach and Incentive Programs ................................................................................................................ 11
Additional Measures for PM2.5 Attainment ................................................................................................. 11
CONTINUING RESEARCH AND SCIENTIFIC STUDIES .............................................................................................. 12
SUMMARY ............................................................................................................................................................. 12
LIST OF ACRONYMS AND ABBREVIATIONS AB Assembly Bill APCD Air Pollution Control District AQMD Air Quality Management District AQMP Air Quality Management Plan Basin South Coast Air Basin BC Black Carbon CAA Clean Air Act CARB California Air Resources Board CHC Commercial Harbor Craft CMAQ Community Multi-scale Air Quality model DPM Diesel Particulate Matter EC Elemental Carbon GHG Greenhouse Gas MATES Multiple Air Toxics Exposure Study NAAQS National Ambient Air Quality Standards NH3 Ammonia NOx Nitrogen Oxides OC Organic Carbon OGV Ocean-Going Vessels PM Particulate Matter PM2.5 Particulate Matter with a dynamic diameter less than or equal to 2.5 microns PM10 Particulate Matter with a dynamic diameter less than or equal to 10 microns ppm Parts Per Million RACM Reasonably Available Control Measure RACT Reasonably Available Control Technology RECLAIM REgional CLean Air Incentives Market SCAQMD South Coast Air Quality Management District SB Senate Bill SIP Standard Implementation Plan SOA Secondary Organic Aerosol SOx Sulfur Oxides SVOC Semi-Volatile Organic Compound U.S. EPA United States Environmental Protection Agency VMT Vehicle Miles Traveled VOC Volatile Organic Compound µg/m3 Micrograms per Cubic Meter µm Micrometers

Preface The purpose of this 2016 Air Quality Management Plan (AQMP) White Paper on Particulate Matter (PM White Paper) is to provide background technical information and present the policy challenges associated with attaining the National Ambient Air Quality Standards (NAAQS) for fine particulate matter (PM2.5), with a focus on the newly adopted federal annual PM2.5 standard of 12 micrograms per cubic meter (µg/m3). Annual PM2.5 concentrations continue to decrease and the South Coast Air Basin (Basin) is projected to be near attainment of the new annual PM2.5 standard once the ozone attainment strategy is fully implemented. Several scientific and policy issues will be described, including the roles of directly emitted PM2.5 emissions and PM2.5 precursor gases, and the PM2.5 co-benefits from the ozone control program. Key to the policy discussion is the potential need for additional measures for PM2.5 given that the attainment strategy cannot rely on the “black box” advanced technology emissions reductions that have been used previously to demonstrate attainment of the ozone standard under federal Clean Air Act (CAA) Section 182(e)(5). Even though the NOx reductions for the ozone strategy will have significant PM2.5 benefits, only specific measures adopted at the time of the 2016 AQMP submittal can be credited towards the PM2.5 attainment demonstration. This PM White Paper will address these issues as well as the science behind PM2.5 formation, followed by potential PM2.5 control approaches that could be developed if additional emission reductions are needed for attainment with the PM2.5 standards. These concepts include control strategies and seasonal, episodic or geographically-focused controls.

Final PM Controls White Paper October 2015
1
1. INTRODUCTION The Basin has experienced remarkable improvement in air quality since the 1970’s as a direct result of a comprehensive, multi-year strategy of reducing air pollution from all sources. Yet the Basin is still not in attainment of current federal and state air quality standards and, in fact, still has the worst air quality in the nation for ozone. Currently, the Basin is not attaining federal ozone standards or the federal annual and 24-hour PM2.5 standards. While the 2012 AQMP was designed to bring the Basin into attainment with the 24-hour PM2.5 standard of 35 µg/m3 by 2015, with additional measures to address the 1997 8-hour ozone standard by 2023, the primary focus of the 2016 AQMP will be to demonstrate attainment of the 2008 ozone standard by 2032 and the annual PM2.5 standard by the 2021-2025 timeframe. Attaining the federal ozone standard will have the added benefit of emission reductions that will further improve PM2.5 levels. The California State ambient air quality standard is identical to the federal standard for annual PM2.5 and there is no State 24-hour PM2.5 standard. The State has very stringent PM10 standards (annual PM10 of 20 µg/m3 and 24-hour PM10 of 50 µg/m3). The State law requires the South Coast Air Quality Management District (SCAQMD) to prepare a plan to achieve and maintain the State PM10 standards, and to revise the plan with the cooperation of state and local governments. While there is no effective attainment date for the State PM standards, the State standards must be achieved as soon as practicable to protect the public health and welfare of Southern Californians. Progress towards achieving the federal PM2.5 standards would be the most expeditious approach for attaining both the federal and State PM standards even though State PM10 standards are more stringent than the federal standard. However, a coarse particle control strategy would be very different and beyond the scope of this white paper. The State PM2.5 standard requires Reasonably Available Control Measures (RACM) that will be further evaluated for their feasibility and applicability in the Basin in the 2016 AQMP. The 2016 AQMP will include a chapter discussing compliance with the federal and State CAA requirements and will be prepared to demonstrate attainment of the federal air quality standards for criteria air pollutants as expeditiously as practicable as required by the federal CAA. The purpose of this PM White Paper is to provide background technical information and present the policy challenges associated with attaining federal PM air quality standards. The focus will be primarily on the newly adopted federal annual PM2.5 standard of 12 µg/m3, but some emission control measures that can be implemented sooner will help to ensure attainment of the 24-hour PM2.5 standard of 35 µg/m3. This white paper will describe the scientific basis of PM2.5 formation including the major sources of directly emitted PM2.5 and PM2.5 precursor gases. The PM2.5 reduction co-benefits from ozone control programs and climate change strategies will also be described. Finally, potential strategies for further PM2.5 control will be considered, should additional controls be needed.

Final PM Controls White Paper October 2015
2
2. BACKGROUND
PM2.5 and Precursors
Particulate matter (PM), also known as particle pollution, is a complex mixture of microscopic solid and liquid particles suspended in air. Particles of concern are classified into two categories: inhalable coarse particles (PM10-2.5) and fine particles (PM2.5). Inhalable coarse particles are generally created by mechanical or natural processes, such as grinding, sanding, sea spray, windblown dust, and soil. Coarse particles have sizes larger than 2.5 micrometers (µm) and smaller than 10 µm in diameter. Fine particles, such as those found in smoke and haze, are 2.5 µm in diameter or smaller, and are generally formed by combustion processes or by chemical reactions that occur in the atmosphere. PM2.5 is of primary concern because, once inhaled, it can travel deeply into the respiratory tract, reaching the lungs. Scientific studies have linked increases in daily PM2.5 exposure with increased respiratory and cardiovascular hospital admissions, emergency department visits, and even deaths. Studies also suggest that long-term exposure to PM2.5 may be associated with increased rates of chronic bronchitis, reduced lung function and increased mortality from lung cancer and heart disease. People with breathing and heart problems, children, and the elderly may be particularly sensitive to PM2.5. Recently,

Final PM Controls White Paper October 2015
3
an additional particle category known as ultrafine particles (often defined as particles less than 0.1 µm) has been studied and found to have distinct chemical and toxicological properties. However, given that there are no ambient standards for ultrafine particles, and that the purpose of this white paper is to address fine particle standards, issues related to ultrafine and coarse particles are beyond the scope of this discussion.
PM in the atmosphere can be categorized as either primary or secondary particles. Primary particles are directly emitted PM from sources such as construction sites, unpaved roads, sea salt, abrasion, fuel combustion, cooking, or fires. Secondary particles are formed in complex chemical reactions that occur in the atmosphere, often aided by sunlight (known as photochemical reactions). In these reactions, precursor gases, such as volatile
organic compounds (VOCs), sulfur oxides (SOx), ammonia (NH3), and nitrogen oxides (NOx), are transformed into solid or liquid products that contribute to ambient PM levels. NOx and SOx will combine with ammonia to form ammonium sulfate or ammonium nitrate salts, which are generally solids at ambient temperatures and can dissolve into water-containing particles. VOCs react with atmospheric oxidants, producing products with lower volatility that condense and form secondary organic aerosol (SOA), another component of PM. Many
combustion processes emit both primary PM and precursor gases that ultimately form PM in the atmosphere. For example, in processes such as motor-vehicle gasoline combustion1 and wood burning, 2 SOA produced by oxidation of the emitted VOCs can exceed the amount of emitted primary organic PM2.5. Secondary particles make up the majority of ambient PM2.5 in the Basin. Basin-wide
1 Gordon, T.D., et al. Secondary Organic Aerosol Formation Exceeds Primary Particulate Matter Emissions for Light-Duty Gasoline Vehicles, Atmos. Chem. Phys. 2014, 14, 4661-4678. 2 Hennigan, C.J., et al. Chemical and physical transformations of organic aerosol from the photo-oxidation of open biomass burning emissions in an environmental chamber, Atmos. Chem. Phys. 2011, 11, 7669-7686.
“A large portion of PM2.5 in the Basin is formed from precursor gases of anthropogenic origin.”

Final PM Controls White Paper October 2015
4
average ambient PM2.5 speciation profiles3 measured during the recent Multiple Air Toxics Exposure Study (MATES) IV show that the Basin’s PM2.5 mass was comprised of four major chemical components: organic carbon (OC), ammonium nitrate, ammonium sulfates, and elemental carbon (EC) with smaller fractions of crustal particles, sea salt, and other trace elements. Elemental carbon (EC), which is similar to the short-lived climate-forcing species Black Carbon (BC), is an important component of directly emitted PM2.5 from internal combustion engines, especially diesel engines. The OC mass portion includes both primary and secondary particle material.
Trends in PM2.5 Levels The levels of PM2.5 in the Basin have been continually improving since measurements and standards were initiated in the late 1990s. These improvements occurred over a period of significant growth in the Basin’s population, vehicle miles traveled (VMT) and economic activity, and are directly attributable to the region’s air quality control program. Based on measurement data through 2013, no air monitoring station in the Basin violated the previous 1997 federal annual PM2.5 standard (15 µg/m3 for three years), and in December of 2014, U.S. Environmental Protection Agency (U.S. EPA) proposed a clean data determination finding that the Basin has met the 1997 PM2.5 standards. This is based on the form of the federal standard, known as the design value, which is the 3-year average of the annual PM2.5 average, calculated by station.
3 SCAQMD, Draft Multiple Air Toxics Exposure Study IV, October 3, 2014.

Final PM Controls White Paper October 2015
5
However, exceedances still occur above the new 2012 annual PM2.5 standard of 12 µg/m3 in the San Bernardino and Riverside County metropolitan areas, with the highest levels in Mira Loma. Los Angeles County also exceeded the new PM2.5 standard in the Central Los Angeles and East San Fernando Valley areas in 2013. This new standard requires additional reductions of directly emitted PM2.5 and PM2.5 precursor gases in order to meet the annual PM2.5 standard by the 2021-2025 statutory timeframe.
Despite significant progress, the Basin remains in nonattainment for the current 24-hour PM2.5 federal standard of 35 µg/m3. As of 2013, the 24-hour PM2.5 design value (in this case, the 3-year average of annual 98th percentile of the monitored 24-hour concentrations by station), exceeds the federal 24-hour PM2.5 standard at only one air monitoring station in Mira Loma in northwestern Riverside County. The 2012 AQMP projected attainment of
the 24-hour PM2.5 standard by the end of 2014. However, preliminary monitoring data through June of 2014 indicates that attainment of this standard is not likely to be achieved, largely because of the unanticipated air quality impacts of the severe drought conditions in California. The lack of winter storms and associated rainfall leads to dryer and thus more emissive ground surfaces as well as reduced cleansing and dilution of atmospheric particles. The drought has not only affected PM2.5 levels in Southern California; many areas across the state have experienced this reversal in long-term downward trends of PM2.5 levels.

Final PM Controls White Paper October 2015
6
In addition, a recent court decision has compelled U.S. EPA to implement PM2.5 standards according to the federal CAA, Title 1, Part D, Subpart 4 (hereafter “Subpart 4”) planning requirements specific to PM10, rather than the general pollutant planning requirements (Subpart 1). Subpart 4 provides for attainment by 2015, with potential extensions. In February 2015, the SCAQMD Governing Board approved a Supplement to the 2012 AQMP 24-hour PM2.5 State Implementation Plan (SIP) for the Basin to comply with Subpart 4 and target attainment in 2015. The Governing Board also directed SCAQMD staff to bring forward early action measures for PM2.5 to ensure progress towards attainment under continuing drought conditions. The Supplement was subsequently approved by California Air Resources Board (CARB) and has been submitted to U.S. EPA for consideration. In Summer of 2015, given the most recent ambient PM2.5 data showing that 2015 attainment was not feasible, the SCAQMD Governing Board approved a request to U.S. EPA for a reclassification of the Basin to “serious” non-attainment area for 24-hour PM2.5 with an attainment date of 2019. The 2016 AQMP will also include a “serious” area plan for PM2.5. While ozone concentrations peak in the summer months, PM levels can be high at any time of the year, but are typically higher in winter months. These higher winter values are specifically influenced by wintertime temperature inversions and stagnant conditions that reduce atmospheric dilution and trap emissions near ground level. Furthermore, sources such as wood burning have increased emissions during colder weather. Consistent with U.S. EPA guidance, seasonal, episodic, or geographical controls that focus on bringing the Mira Loma station into compliance can continue to be considered as a method to bring the Basin into attainment.
3. ASSESSING FUTURE CONTROL STRATEGIES
Emission Sources of PM2.5 As mentioned above, most PM2.5 in the Basin is formed in the atmosphere, and thus a full picture of the sources of PM2.5 must also consider precursor gases. Based on the preliminary 2016 AQMP emissions inventory for 2012, there were 581 tons of NOx emissions per day, 488 tons of VOC emissions, 66 tons of directly emitted PM2.5 emissions, and 19 tons of SOx emissions. The top 10 emission sources of directly emitted PM2.5 and its precursor gases are contained in Appendix A. On-road and off-road vehicles emit more than 85% of the total NOx emissions combined. Consumer products solvent evaporation was the single largest contributor to VOC emissions. Mobile (on- and off-road) sources collectively emit more than half of the total VOC emissions. Transportation source categories, including ships, commercial boats, aircraft trucks, and passenger cars account for more than 40% of the total SOx emissions. RECLAIM SOx sources emit more than one-third of the total SOx emissions. Service and commercial fuel combustion and residential fuel combustion are the next largest contributing SOx source categories.
“Trucks are the No. 1 source of NOx emissions that form both ground-‐level ozone and PM2.5 in the
atmosphere.”

Final PM Controls White Paper October 2015
7
Cooking is the largest emission source of directly emitted PM2.5, followed by residential fuel combustion and paved road dust. These top sources are largely uncontrolled sources of directly emitted PM2.5. The content of particles emitted from cooking, the majority of which comes from commercial under-fired charbroiling of meat, are almost all organic carbon,4 and studies have shown that commercial meat-cooking contributes more than 20% of the PM2.5 organic carbon fraction in Los Angeles air.5 Residential fuel combustion is the second largest emission source of directly emitted PM2.5, mostly in the form of wood stove and fireplace wood burning.
Control Effectiveness In the SCAQMD’s 2012 AQMP, a detailed computer air quality model (CMAQ v4.7.1) was used to estimate the regional reductions of ambient PM2.5 concentrations that result from reductions in PM precursor emissions. On a ton-per-ton basis, primary PM2.5 and SOx emissions controls were found to be the most effective in reducing PM2.5 mass concentrations, compared to NOx emissions controls. VOC emissions reductions had the lowest effect on reducing annual PM2.5 mass concentration. As shown, this comparative effectiveness of emissions reductions is different for the 24-hour PM2.5 standard, and may also change with season and location in the Basin.
4 McDonald, J.D., et al. Emissions from charbroiling and grilling of chicken and beef. JAWMA, 2003, 53, 185-194. 5 Norbeck, J. Standardized Test Kitchen and Screening Tools Evaluation for South Coast Air Quality Management District Proposed Rule 1138; Prepared under Contract No. S-C95073 for the South Coast Air Quality Management District, El Monte, CA, by CE-CERT: University of California, Riverside, CA, 1997.
Comparative Effectiveness of Reductions To Achieve Federal PM2.5 Air Quality Standards
NOx SOx VOCs PM2.5 Annual PM2.5 Standard 1 15 0.4 10 24-hour PM2.5 Standard 1 8 0.3 15
Final PM Controls White Paper October 2015
8
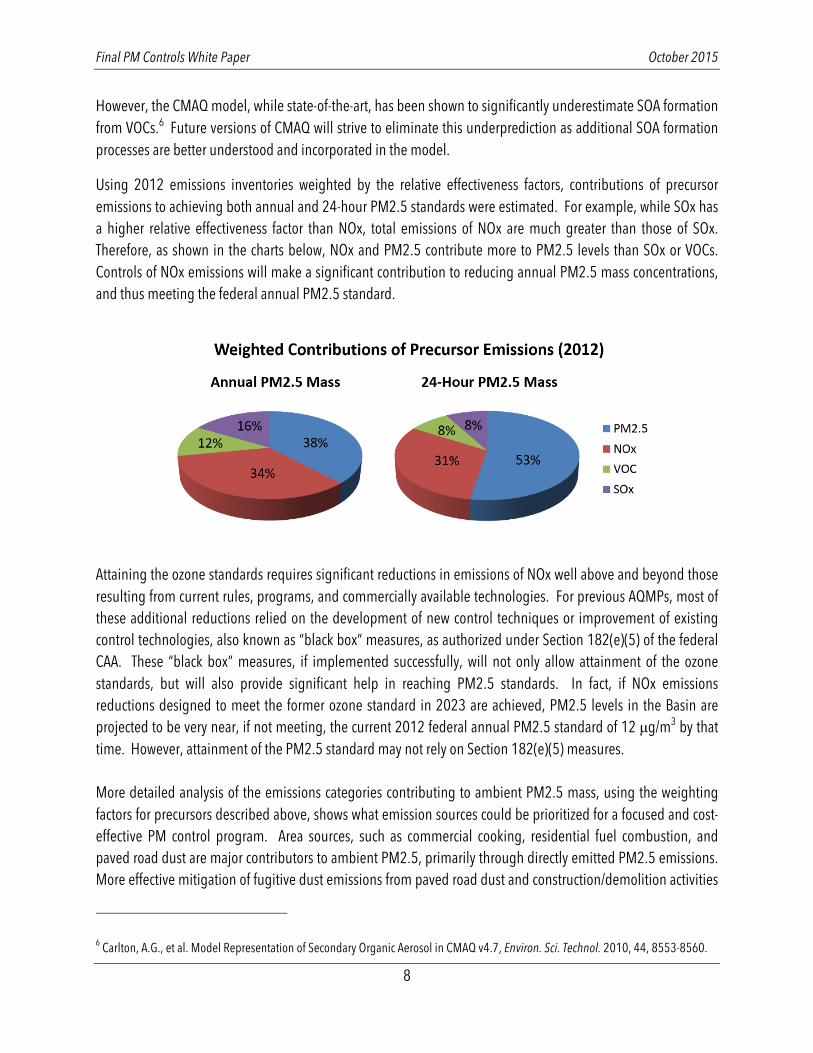
However, the CMAQ model, while state-of-the-art, has been shown to significantly underestimate SOA formation from VOCs.6 Future versions of CMAQ will strive to eliminate this underprediction as additional SOA formation processes are better understood and incorporated in the model.
Using 2012 emissions inventories weighted by the relative effectiveness factors, contributions of precursor emissions to achieving both annual and 24-hour PM2.5 standards were estimated. For example, while SOx has a higher relative effectiveness factor than NOx, total emissions of NOx are much greater than those of SOx. Therefore, as shown in the charts below, NOx and PM2.5 contribute more to PM2.5 levels than SOx or VOCs. Controls of NOx emissions will make a significant contribution to reducing annual PM2.5 mass concentrations, and thus meeting the federal annual PM2.5 standard.
Attaining the ozone standards requires significant reductions in emissions of NOx well above and beyond those resulting from current rules, programs, and commercially available technologies. For previous AQMPs, most of these additional reductions relied on the development of new control techniques or improvement of existing control technologies, also known as “black box” measures, as authorized under Section 182(e)(5) of the federal CAA. These “black box” measures, if implemented successfully, will not only allow attainment of the ozone standards, but will also provide significant help in reaching PM2.5 standards. In fact, if NOx emissions reductions designed to meet the former ozone standard in 2023 are achieved, PM2.5 levels in the Basin are projected to be very near, if not meeting, the current 2012 federal annual PM2.5 standard of 12 µg/m3 by that time. However, attainment of the PM2.5 standard may not rely on Section 182(e)(5) measures. More detailed analysis of the emissions categories contributing to ambient PM2.5 mass, using the weighting factors for precursors described above, shows what emission sources could be prioritized for a focused and cost-effective PM control program. Area sources, such as commercial cooking, residential fuel combustion, and paved road dust are major contributors to ambient PM2.5, primarily through directly emitted PM2.5 emissions. More effective mitigation of fugitive dust emissions from paved road dust and construction/demolition activities
6 Carlton, A.G., et al. Model Representation of Secondary Organic Aerosol in CMAQ v4.7, Environ. Sci. Technol. 2010, 44, 8553-8560.

Final PM Controls White Paper October 2015
9
could be evaluated. Mobile sources, both on-road and off-road, are also significant sources of PM2.5, both through directly emitted PM2.5 emissions but also precursors such as NOx.
4. RECOMMENDATIONS - PATH TO PM2.5 ATTAINMENT IN THE 2016 AQMP
Control Strategy
Through the 2007 and 2012 AQMPs, it was demonstrated that the previous control strategies employed for the PM10 and 1-hour ozone SIPs also benefited PM2.5 and 8-hour ozone reductions. Taking the same multi-pollutant approach to assess strategies for the 2016 AQMP suggests that a NOx-heavy strategy is the most efficient approach for the reduction of fine particulate matter because NOx reductions are needed for the 1-hour and 1997 8-hour ozone standards within approximately the same timeframe for the federal annual PM2.5 attainment demonstration. The PM2.5 strategy can be further augmented with targeted and cost-effective directly emitted PM2.5 and SOx controls if needed, should NOx controls from other control programs be insufficient, not timely, or do not materialize. Based on the above discussion, several attainment paths can be developed with varying degree of controls among directly emitted PM2.5 and PM precursors. Selecting the most efficient path for PM2.5 attainment takes into consideration many factors, such as the amount of total reductions needed, technology readiness, attainment deadlines, and the inter-relationship with other NAAQS pollutants such that the control strategy does not need to make drastic mid-term adjustments, thus minimizing potential control costs. The following sections describe the staff recommendations for a prioritized approach in the development of a PM2.5 attainment strategy.

Final PM Controls White Paper October 2015
10
1) Co-Benefits from the Ozone NOx Strategy
Many of the most significant directly emitted PM2.5 and PM2.5 precursor emission sources are already well controlled, but additional reductions from implementation of adopted control measures from the 2007 and 2012 AQMPs may still not be adequate for attainment of the new federal annual PM2.5 standard. PM2.5 levels will be further reduced from the additional NOx emissions reductions needed for the ozone control strategy. Preliminary 2016 AQMP analysis shows that approximately another 150 tons per day of NOx reductions needed are to meet the 1997 8-hour ozone standard by 2024. This is within the timeframe of the 2012 annual PM2.5 standard attainment deadline of 2021-2025. Preliminary projections suggest that without any additional PM controls, but with the ozone NOx strategy alone, the
Basin’s annual PM2.5 design value would be very near the standard of 12 µg/m3 in 2023. Given the goal of developing the most efficient and cost-effective path to meeting all clean air standards, and given that these NOx reductions are needed for ozone attainment anyway, the most desirable path is to control NOx emissions, not only from point and area sources, but primarily from mobile sources that fall under state and federal jurisdiction. Significant reductions are needed from on-road vehicles, off-road engines, ships, and locomotives to achieve the necessary NOx reductions to meet the federal ozone standards. Retrofitting heavy duty diesel trucks to alternative clean fuel may help to reduce directly emitted PM2.5 and NOx emissions. The 2016 AQMP will capture the anticipated NOx reductions from the ozone plan, as well as anticipated concurrent reductions of VOCs, SOx, and directly emitted PM2.5 from zero tailpipe emission technologies or efficiency measures that reduce vehicle trips/vehicle miles traveled.
2) Co-Benefits from Climate Change or Air Toxic Control Programs
SCAQMD staff recognizes, to the extent available under the U.S. EPA’s PM2.5 implementation rule, that there are several near-term measures that are being pursued by CARB under the AB 32 Scoping Plan, including reductions in short-lived climate forcers such as BC. Comprised of microscopic particles emitted from incomplete combustion of biomass, wood, and fossil fuels, BC is a major contributor to global climate change and also a primary component of diesel particulate matter (DPM). Cutting BC emissions would immediately result in reduction of the rate of warming, as well as PM2.5 benefits. Identifying the most promising control measures or mitigation options to address BC emissions reductions in the areas of stationary and mobile sources, residential wood combustion, and open biomass burning will provide climate change as well as PM2.5 benefits in the near term.

Final PM Controls White Paper October 2015
11
Air toxic control programs reducing DPM or toxic metals would also contribute to PM2.5 reductions. Despite significant decreases in air toxics exposure over the past couple of decades, the recent SCAQMD MATES IV results continue to show unacceptably high risk of exposure to DPM, representing two-thirds of the overall air toxic cancer risk. This result emphasizes that continuous efforts towards reducing DPM emissions are needed at local, state, and federal levels and via cooperation with the ports, airports, and other stakeholders. Alternative fueled vehicles with significant zero emission miles traveled, along with coordinated land use and transportation planning with the goal of reducing VMT, will contribute to reduction of DPM, GHG, as well as NOx emissions. Toxic metals emitted from industrial processes can cause risks to public health and the environment. SCAQMD staff will continue to develop and propose new rules or amend existing rules by strengthening requirements to reduce toxic metal emissions and exposure from various metal industry sources. These measures, although not developed for SIP purposes, will achieve concurrent reductions in directly emitted PM2.5 and can be quantified and credited toward needed SIP reductions.
3) Outreach and Incentive Programs Other programs supporting PM control measure implementation are also important to ensure expected emission reductions are being realized. These programs include outreach and incentive programs. SCAQMD staff utilizes a variety of tools to raise public awareness and understanding of the significance and health effects of particle pollution and thus, the importance of PM controls to protect public health. Enhanced public outreach should continue to be pursued by various means, including targeted and focused communications campaigns, community workshops, educational brochures and videos, and other digital media formats to educate the community on the continuing efforts to achieve the required PM reductions. Incentive funding for stationary sources can be pursued and best applied where controls are cost-effective, but not necessarily affordable by the affected sources, especially when controls are considered for smaller businesses. Such incentive funds can be used to subsidize low-emitting equipment purchases either by businesses or the public. Funding for such incentive programs can originate from state and federal grants, penalties/settlements, and other sources.
4) Additional Measures for PM2.5 Attainment
Since the federal CAA does not allow for reliance on future technologies (i.e., “black box,” Section 182(e)(5) measures) in the PM2.5 attainment plan, portions of NOx controls that are part of the ozone attainment strategy may be not eligible for inclusion as SIP measures for PM2.5 purposes. For this reason, additional measures to ensure attainment will need to be evaluated and implemented if needed. Potential control concepts based on the Reasonably Available Control Technology (RACT) or RACM analysis for PM2.5 and its precursors as part of the 2016 AQMP will be evaluated for their feasibility and applicability for this air basin. Any additional measures needed to meet the RACT/RACM requirements could be further developed for inclusion in the 2016 AQMP.

Final PM Controls White Paper October 2015
12
Based on the PM2.5 formation potentials described above, if additional reductions are still needed for timely PM2.5 attainment demonstration, additional SOx and/or directly emitted PM2.5 measures should be a first priority. Examples of such measures can be found in Appendix B. In developing the PM2.5 strategy, geographic, seasonal, and episodic controls should also be considered as they minimize compliance costs while targeting emissions reductions when and where they are needed. Examples of these measures are also contained in Appendix B. Such targeted measures will have even greater benefits for avoiding exceedances of the 24-hour PM2.5 standard given that the exceedances are episodic and occur almost exclusively in the colder months. As attainment deadlines for the 24-hour standard are imminent, PM2.5 measures arising from the 2016 AQMP development process that can help to ensure timely attainment of the 24-hour PM2.5 standard should be developed and adopted as early action measures, parallel to the 2016 AQMP development.
5. CONTINUING RESEARCH AND SCIENTIFIC STUDIES Continuing research and scientific studies are needed to better quantify organic compounds and their contribution to PM2.5 formation. In the Basin, approximately 30-50% of the PM2.5 mass is composed of organic compounds. However, the organic component of PM2.5 in the Basin needs further study as certain semi-volatile organic compounds (SVOC) have not been historically inventoried, controlled or incorporated in regional air quality modeling. Continuing research and scientific studies are required to better quantify SVOC emissions and their contribution to PM2.5 formation. The role of ammonia emissions will also be examined further in the 2016 AQMP modeling analysis. Some areas within the Basin may be saturated with ammonia now or in the future relative to SOx and NOx, and thus modest ammonia controls may have little effect. Other areas may show that ammonia controls are effective in reducing ambient PM2.5. Even if large ammonia reductions may have benefits, it may not be feasible given the nature of the sources.
SUMMARY
The 2016 AQMP modeling and attainment demonstration analysis will provide refinement to the concepts in this white paper, but it is clear that an integrated approach to multiple air quality challenges will minimize control costs while achieving multiple goals. A NOx-heavy control strategy will not only provide for attainment of the ozone standards, but also provide significant co-benefits for the reduction of fine particulate matter. Concurrent targeted, strategic, and timely reductions in directly emitted PM2.5 and precursors will ensure meeting the federal annual and 24-hour PM2.5 standards by the attainment deadlines.

APPENDIX A
TOP TEN EMISSION SOURCES BY POLLUTANT

Final PM Controls White Paper October 2015
A-1
Appendix A: Top Ten Emission Sources by Pollutant1
1. NOx
Emission Sources 2012 Emissions (Tons/Day) Heavy Duty Diesel Trucks 184.1 Off-Road Equipment 67.0 Light Duty Passenger Auto (LDA) 46.8 Ships and Commercial Boats (OGV & CHC) 45.9 Light Duty Trucks (T1 & T2) 41.2 Medium Duty Trucks (T3) 30.2 Trains 21.3 Heavy Duty Gasoline Trucks 20.9 Residential Fuel Combustion 20.2 Heavy Duty Diesel Urban Buses (UB) 19.6
2. VOC
Emission Sources 2012 Emissions (Tons/Day) Consumer Products 86.5 Light Duty Passenger Auto (LDA) 64.4 Off-Road Equipment 51.6 Light Duty Trucks (T1 & T2) 42.9 Petroleum Marketing 34.4 Recreational Boats 30.4 Medium Duty Trucks (T3) 21.2 Coatings and Related Process Solvents 18.9 Heavy Duty Gasoline Trucks 14.4 Architectural Coatings and Related Solvents 13.3
1 Source: Preliminary 2016 AQMP, July 2015.

Final PM Controls White Paper October 2015
A-2
3. Directly Emitted PM2.5
Emission Sources 2012 Emissions (Tons/Day) Cooking 10.4 Residential Fuel Combustion 7.2 Paved Roads Dust 7.1 Heavy Duty Diesel Trucks 5.6 Light Duty Passenger Auto (LDA) 4.6 Off-Road Equipment 4.0 Wood and Paper 2.3 Light Duty Trucks (T1 & T2) 2.2 Mineral Processes 2.1 Construction and Demolition 1.7
4. SOx
Emission Sources 2012 Emissions (Tons/Day) RECLAIM 6.87 Ships and Commercial Boats (OGV & CHC) 4.46 Aircraft 1.42 Service and Commercial Fuel Combustion 1.15 Light Duty Passenger Auto (LDA) 0.85 Light Duty Trucks (T1 & T2) 0.51 Residential Fuel Combustion 0.49 Manufacturing and Industrial 0.45 Medium Duty Trucks (T3) 0.40 Petroleum Refining 0.36

APPENDIX B
OPPORTUNITIES FOR EMISSION REDUCTIONS TO ACHIEVE PM2.5 STANDARDS

Final PM Controls White Paper October 2015
B-1
Appendix B: Opportunities for Emission Reductions to Achieve PM2.5 Standards
This appendix describes control concepts toward achieving the federal PM2.5 standards if additional emission reductions are needed after implementation of other measures that achieve PM2.5 co-benefits and incentive programs as outlined in the PM White Paper. Examples of potential control concepts are discussed by sector. If additional reductions are needed for annual PM2.5 standard attainment, some or all of the concepts could be developed as a control measure that can be prioritized for implementation, including time and place controls, such as geographic, seasonal, or episodic controls, as well as incentive programs.
1. Cooking
The SCAQMD has implemented a very successful PM2.5 control program for chain-driven charbroilers (used at quick service restaurants), but PM2.5 emissions from under-fired charbroilers remain relatively uncontrolled, primarily due to the current high capital costs of equipment, and operation and maintenance (O&M) costs. Based on current emissions inventory, approximately 80% of PM2.5 emissions from restaurants are from under-fired charbroilers. SCAQMD is completing a study with University of California Riverside, in partnership with the U.S. EPA and other air agencies in PM2.5 nonattainment areas, to identify cost-effective and more affordable under-fired charbroiler controls. Types of devices being evaluated can be generally described as filter-based equipment, electrostatic precipitators (ESPs), catalysts, scrubbers, and other innovative technologies, some of which are nearing commercial availability. Study results are being evaluated and will be used to develop a detailed technical and economic (cost and affordability) feasibility analysis. If needed for attainment, emission control programs for under-fired charbroilers could potentially be tiered and require high efficiency (and potentially more expensive) controls for larger restaurants and possibly less efficient, less expensive, yet more affordable equipment for smaller sources. Small business incentive programs could also be explored to help offset purchase and installation costs. For example, an incentive program could be explored to help offset the control device costs to restaurants from what could otherwise be less affordable controls for directly emitted PM2.5 reductions at small business restaurants. The net result could be an overall reduction of PM2.5 pollution at a lower overall cost. SCAQMD continues to work closely with staff from the Bay Area AQMD, San Joaquin Valley APCD, and U.S. EPA Region 9 on research and demonstration projects for these control technologies.
2. Residential and Open Burning
Additional PM2.5 reductions from biomass burning were identified by the SB 656 (Sher) report and control measures were developed and implemented in conjunction with the 2007 and 2012 AQMPs. SCAQMD Rule 445 (Wood-Burning Devices) was adopted in 2008 and subsequently amended in 2013. Rule 445 established a mandatory residential wood-burning curtailment program, beginning in 2011, during winter months (November through the end of February) known as the “Check Before You Burn” program. Amendments in
Final PM Controls White Paper October 2015
B-2
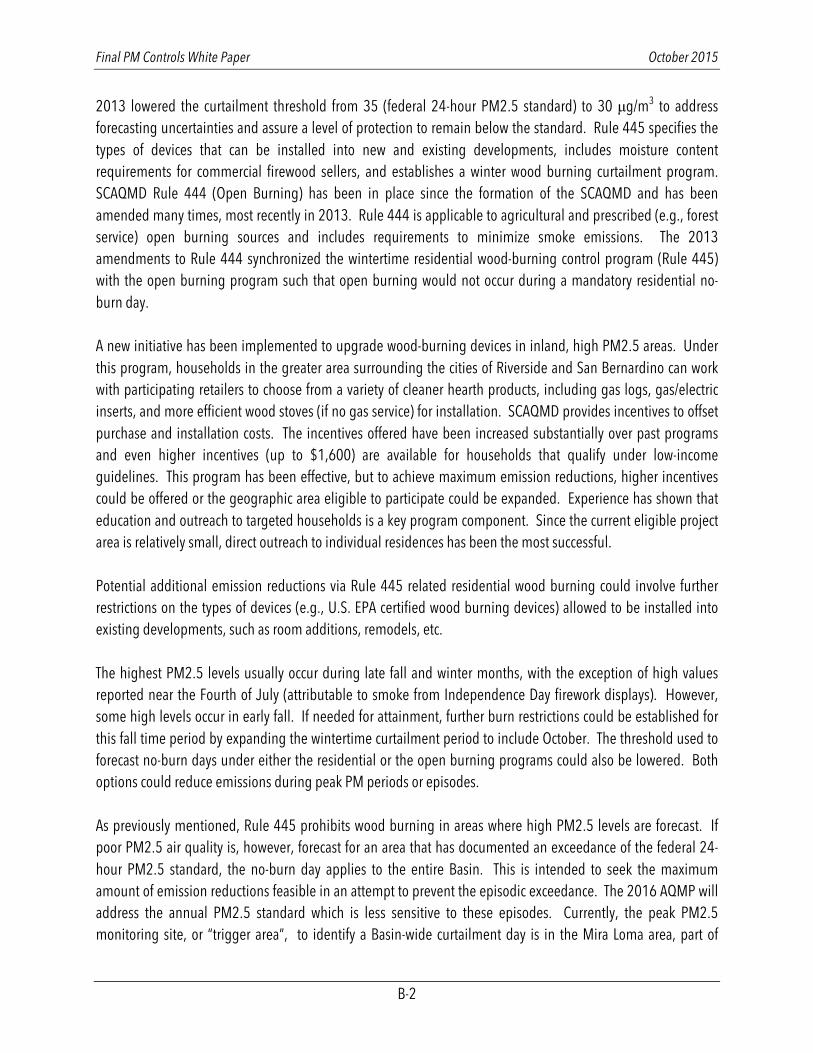
2013 lowered the curtailment threshold from 35 (federal 24-hour PM2.5 standard) to 30 µg/m3 to address forecasting uncertainties and assure a level of protection to remain below the standard. Rule 445 specifies the types of devices that can be installed into new and existing developments, includes moisture content requirements for commercial firewood sellers, and establishes a winter wood burning curtailment program. SCAQMD Rule 444 (Open Burning) has been in place since the formation of the SCAQMD and has been amended many times, most recently in 2013. Rule 444 is applicable to agricultural and prescribed (e.g., forest service) open burning sources and includes requirements to minimize smoke emissions. The 2013 amendments to Rule 444 synchronized the wintertime residential wood-burning control program (Rule 445) with the open burning program such that open burning would not occur during a mandatory residential no-burn day. A new initiative has been implemented to upgrade wood-burning devices in inland, high PM2.5 areas. Under this program, households in the greater area surrounding the cities of Riverside and San Bernardino can work with participating retailers to choose from a variety of cleaner hearth products, including gas logs, gas/electric inserts, and more efficient wood stoves (if no gas service) for installation. SCAQMD provides incentives to offset purchase and installation costs. The incentives offered have been increased substantially over past programs and even higher incentives (up to $1,600) are available for households that qualify under low-income guidelines. This program has been effective, but to achieve maximum emission reductions, higher incentives could be offered or the geographic area eligible to participate could be expanded. Experience has shown that education and outreach to targeted households is a key program component. Since the current eligible project area is relatively small, direct outreach to individual residences has been the most successful. Potential additional emission reductions via Rule 445 related residential wood burning could involve further restrictions on the types of devices (e.g., U.S. EPA certified wood burning devices) allowed to be installed into existing developments, such as room additions, remodels, etc. The highest PM2.5 levels usually occur during late fall and winter months, with the exception of high values reported near the Fourth of July (attributable to smoke from Independence Day firework displays). However, some high levels occur in early fall. If needed for attainment, further burn restrictions could be established for this fall time period by expanding the wintertime curtailment period to include October. The threshold used to forecast no-burn days under either the residential or the open burning programs could also be lowered. Both options could reduce emissions during peak PM periods or episodes. As previously mentioned, Rule 445 prohibits wood burning in areas where high PM2.5 levels are forecast. If poor PM2.5 air quality is, however, forecast for an area that has documented an exceedance of the federal 24-hour PM2.5 standard, the no-burn day applies to the entire Basin. This is intended to seek the maximum amount of emission reductions feasible in an attempt to prevent the episodic exceedance. The 2016 AQMP will address the annual PM2.5 standard which is less sensitive to these episodes. Currently, the peak PM2.5 monitoring site, or “trigger area”, to identify a Basin-wide curtailment day is in the Mira Loma area, part of
Final PM Controls White Paper October 2015
B-3
Source Receptor Area (SRA) 23 (Metropolitan Riverside County). As part of an enhanced control effort, the trigger area could be expanded to include other SRAs with elevated PM2.5 levels that have not documented exceedances of the federal 24-hour standard (annual 98th percentile concentration, averaged over 3 years). This would likely result in an increase in Basin-wide no-burn days and help to lower annual PM2.5 levels. Alternatively, if air quality modeling supported a truly targeted control program, there could be an increase in the number of no-burn days forecast solely for SRA 23 and immediate upwind areas. Possible controls for Rule 444 related open burning sources could include mandatory use of chipping/grinding or mulching as alternatives to open burning.
3. Fugitive Dust
PM derived from mechanical disruption (e.g., agriculture, construction, etc.) is primarily in the coarse (PM10-2.5) size fraction; however, entrained road dust is still one of the major directly emitted PM2.5 sources due to the region’s large number of roadways and high traffic volumes. In response, SCAQMD has adopted regulations to prevent material from being deposited on roadways and a program for efficient street sweeping equipment. For the street sweeping equipment, a testing protocol was developed and minimum pick-up efficiency and entrainment standards are in place (Rule 1186 – PM10 Emissions from Paved and Unpaved Roads, and Livestock Operations). Local jurisdictions must only procure equipment that meets applicable standards and a companion regulation (Rule 1186.1 – Less-Polluting Sweepers) also requires, in most cases, that street sweepers be powered by alternative fuels. During the development of Rule 1186, SCAQMD staff learned that street sweeping frequencies vary greatly among jurisdictions, from weekly to monthly to, in some cases, not at all. If needed for attainment, minimum street sweeping frequencies could be explored as well as enhanced cleaning on roads with higher silt loadings.
4. Ammonia Control
1) Agricultural Dairies
Livestock waste is the third largest emission source of ammonia in the Basin and is regulated by both SCAQMD Rules 223 (Emission Reduction Permits for Large Confined Animal Facilities) and 1127 (Emission Reductions from Livestock Waste). Recent research found that fresh excreted manure in the animal housing areas is the major source of ammonia emissions and each cow produces approximately 60 kilograms (kg) of manure daily.2 Prevailing winds push NOx and SOx emissions from industrial and transportation sources in the western Basin to inland areas and these gases mix with ammonia emissions from widespread sources, including approximately 100,000 head of dairy cattle and support stock in western Riverside and San Bernardino counties.
2 Final 2012 Air Quality Management Plan, Appendix IV-A, Control Measure BCM-04 – Further Ammonia Reductions from Livestock Waste, SCAQMD, February 2013.
Final PM Controls White Paper October 2015
B-4
Ammonium nitrate is the most prevalent PM compound measured at the Mira Loma air monitoring station, the only station projected to exceed federal 24-hour standard for PM2.5. If needed for attainment, seasonal or episodic approaches to control ammonia from dairy manure may be beneficial in reducing the secondarily formed air contaminants in the area. One possible approach would be to reduce ammonia emissions from fresh manure using an ammonia-reducing agent. Sodium bisulfate, when dissociated, reduces the pH and protonates ammonia, converting it to ammonium. The ammonium is then bound by sulfate to form ammonium sulfate, which is retained in the manure in its solid form. In California, sodium bisulfate has been used by dairies in northern and southern counties, including San Bernardino and Riverside counties, mainly to prevent cow lameness and nuisance flies. Theoretically, 100 pounds (lbs) of sodium bisulfate would bind 14 lbs of ammonia. This method of control was initially proposed in the 2012 AQMP for an assessment to evaluate the technical and economic feasibility of application, including episodic application. If deemed feasible and necessary, seasonal or episodic ammonia controls may be considered, for example by applying sodium bisulfate to fresh manure during high PM2.5 months or for days only when higher concentrations occurred or are anticipated to occur based on the past analyses. However, costs associated with sodium bisulfate use can be high and the need to offset the costs through an incentive program would need to be considered.
2) Anaerobic Digestion
The SCAQMD Rule 1133 series establishes requirements for composting of organic waste such as animal manure, biosolids, greenwaste, and foodwaste. As ongoing efforts at the state level for organics diversion to meet AB 32 and landfill diversion goals, AB 341 (Chesbro) has created challenges relative to controlling VOC and ammonia emissions from increased composting of greenwaste, and increasingly from foodwaste. AB 341 was approved by the legislature in 2011 to further reduce GHG emissions by diversion of organic materials away from landfills. This legislation established a goal that 75% of solid waste be reduced, recycled, or composted by 2020. This has created a statewide challenge to develop mechanisms to accommodate the state mandate while not adversely affecting air quality. Inclusive of these challenges are local air quality rules and regulations associated with composting operations/methods, permitting, and off-road vehicle use. Local air districts are working with CARB and California Department of Resources Recycling and Recovery (CalRecycle) to address these issues. According to the composting industry3, the majority of the yard trimmings and tree prunings processed (i.e., chipped and ground) in the Basin are not composted but go through a much shorter pathogen reduction process. These organic materials are used as an alternative daily cover (ADC) or for other beneficial uses at landfills or as a ground cover on commercial or public lands. The majority of mobile, point, and area source
3 Paul Ryan, Inland Empire Disposal Association, E-mail communication, November 13, 2014.

Final PM Controls White Paper October 2015
B-5
emissions from compostable materials handling through chipping and grinding are not sufficiently controlled to minimize potential emissions in the Basin. Conversely, composting is relatively well regulated through current air quality planning and rulemaking. Two legislative mandates, AB 1594 (Williams) and AB 1826 (Chesbro) approved in 2014 will help the state achieve diversion goals by 2020 through recycling of compostable organic waste materials. AB 1594 closes diversion credit for yard trimmings and prunings, including greenwaste, which is used as an ADC or for other beneficial uses at landfills. AB 1826 will drive the recycling of yard trimmings and food scraps by requiring commercial generators to sign up for composting or anaerobic digestion service for their organic waste. More organic materials are expected to be diverted in the future and consideration must be given to expansion of the organics processing industry and the emissions impact from those processes and associated equipment compared to the overall benefits of diversion. Anaerobic digestion (AD) has been identified as a technically viable method of organic waste treatment in which organic waste is transformed to renewable biogas, mainly composed of methane (CH4) and carbon dioxide (CO2), in an oxygen-free environment. Digesters can minimize emissions of ammonia, VOCs, and other odorous pollutants in well-managed operating conditions, which can contribute to reductions of PM2.5 formation. However, air quality permitting, off-road vehicle use, as well as high capital investment and O&M costs, may be a disincentive. CalRecycle is in the process of amending and creating new requirements for California Code of Regulations, Titles 14 and 27 to address these and other implementation issues. As part of this process in particular, a stand-alone set of in-vessel digestion regulations has been proposed to divert compostable organic materials from landfills to reduce GHG generation, while producing biofuels or bioenergy. Use of digesters may bring about air quality benefits (e.g., decreasing GHG, ammonia, and VOC emissions) and co-benefits of PM2.5 reduction in the Basin.

SOUTH COASTAIR QUALITYMANAGEMENT DISTRICT
SOUTH COAST AQMD • 21865 COPLEY DR • DIAMOND BAR, CA 91765 • (909) 396-2000 • 800-CUT-SMOG (288-7664)


![SOUTH COAST AIR QUALITY MANAGEMENT DISTRICT FINAL ...€¦ · Quality Management District (SCAQMD) Regulations and improve in-Basin (South Coast Air Basin [Basin]) power reliability,](https://img.pdfslide.us/doc/110x75/5f860f505bc6182863561c78/south-coast-air-quality-management-district-final-quality-management-district.jpg)