Embed Size (px)
Citation preview

ABSTRACT
CLAUDIA ECHEVERRIA MAGARIÑOS. Yarn Specifications and Performance Metrics for Short Staple Yarn Manufacturers. (Under the direction of Dr. George Hodge and Dr. William Oxenham).
Domestic yarn manufacturers must address the requirements of all the participants in the
textile and apparel supply chain in order to remain competitive and to differentiate their
products from offshore sources. The objective of this research was to better understand these
requirements through visits to companies, elaboration of case studies, discussions and
interviews with members of the supply chain.
Case studies were conducted with the participation of machinery, yarn, fabric and apparel
manufacturers, as well as research and retail organizations. Both domestic and Latin
American companies were pursued; a total of 32 company interviews were conducted
involving 64 participants. These interviews were used to map the yarn specification process
across the supply chain; identify yarn characteristics most frequently specified; identify how
the characteristics are measured and their importance as a function of the final product. The
products investigated were denim, t-shirts, socks, sheets and sewing thread made of cotton or
poly-cotton blends.
Yarn specification across the supply chain includes three basic yarn characteristics, yarn
count, yarn type (spinning system), and fiber content. Retailers put more emphasis specifying
fabric characteristics rather than yarns characteristics. Detailed yarn characteristics such as
Uster® % CV, tensile properties, and surface characteristics are usually decided at the fabric

and yarn manufacturing level, based on the fabric specifications and the requirements for an
optimum process performance.
Methods and equipment used to test fabrics and yarns are relatively standard for both
domestic and international companies. Analyses of different software used to manage
product data revealed that these are not used to their full extend and detailed yarn
characteristics are rarely incorporated into final product design.
It was also possible to identify performance metrics and several business practices that can
bring domestic yarn manufacturers closer to the retailers and to drive business success. These
practices were identified not only through discussions with yarn manufacturers, but from
feedback at the fabrication and retail levels. Good business relationships, availability,
capacity and location were found to be key drivers for success for commodity yarn producers
and it was found that they should try to reinforce relationships with the vendors rather than
directly with the retailers. Innovation and flexibility allow specialty yarn manufacturers to
have direct access to retailers and designers. Yarn quality, price and delivery can typically
be considered “order qualifying criteria” as opposed to a means of product differentiation.
ii

Yarn Specifications and Performance Metrics for Short Staple Yarn Manufacturers
by Claudia Echeverría Magariños
A thesis submitted to the Graduate Faculty of North Carolina State University
in partial fulfillment of the requirements for the Degree of
Master of Science
Textiles
Raleigh, North Carolina 2008
APPROVED BY:
Dr. George Hodge Dr. William Oxenham Co-Chair of Advisory Committee Co-Chair of Advisory Committee
Dr. Gilbert O’Neal Committee Member

ii
BIOGRAPHY
Claudia Echeverría Magariños was born in Cochabamba, Bolivia June 23, 1978. She
graduated from the Universidad Privada Boliviana (UPB) in 2001 with a B.S. degree in
Production Engineering. After graduation, she worked for five years at America Textil S.A.,
the largest textile and apparel company in Bolivia, in positions at the manufacturing,
planning and product development areas. In 2002, Claudia was transferred from the
company’s fabric mill planning department to the sewing plant, in charge of the sample
room, and was part of the team that formally established the Product Development
Department of the company. She worked in Product Development until July 2006 as a
Development Officer, in charge of Polo Ralph Lauren, Abercrombie & Fitch, and other
accounts. In the fall of 2006, with the desire of expanding her knowledge in textiles,
empower her professional career, and receiving a Fulbright Scholarship and Institute of
Textile Technology Fellowship, she decided to pursue a Master of Science in Textile
Management and Technology at North Carolina State University. After graduation, Claudia
will move to New York to start her job with Mast Industries as a Production Coordinator for
Victoria’s Secret Direct division.

iii
ACKNOWLEDGEMENTS
I would like to express my gratitude to Dr. George Hodge and Dr. William Oxenham for
their guidance, support and patience through this research process.
Obtaining this degree would have not being possible without the support of the Fulbright
Program and the Institute of Textile Technology, to whom I will always be grateful.
My special thanks to Patrice Hill and Chris Moses, for their kindness and encouragement to
all of us ITT fellows throughout these two years.
I would also like to thank Mr. Marcos Iberkleid, President of America Textil S.A and Dr. Pat
Trautman, both my inspiration to pursue a career in textiles. Thank your for your support,
your teachings and for the opportunities you gave me to develop my career.
And of course, my deepest thanks and all my love to my parents Walter and Virginia, my
sisters Ximena and Cecilia, and to other members of my family, Marcelo Magariños, Ramiro
Magariños, Sijam and Juan Carlos Darras; who despite the distance, have always been here
with me, and without whom I would not have been able to be the person I am today.
To Barry, Lina, Max and Telma, thank you guys for your friendship and support; “e-
specially” in the final stage.

iv
TABLE OF CONTENTS
LIST OF TABLES................................................................................................................ vii
LIST OF FIGURES............................................................................................................. viii
1 INTRODUCTION .......................................................................................................... 1
1.1. RESEARCH LIMITATIONS............................................................................................ 2
1.2. RESEARCH OBJECTIVES ............................................................................................. 3
1.3. RESEARCH SIGNIFICANCE .......................................................................................... 4
2 LITERATURE REVIEW .............................................................................................. 7
2.1. TEXTILES AND APPAREL IN THE U.S. ......................................................................... 7
2.1.1 T-Shirts Market................................................................................................... 10
2.1.2 Denim Market ..................................................................................................... 11
2.1.3 Sheets Market...................................................................................................... 12
2.1.4 Socks Market ...................................................................................................... 13
2.2. SUPPLY CHAIN AND THE DAMA PROJECT............................................................... 14
2.3. STANDARD TESTING METHODS ............................................................................... 18
2.3.1 American Society for Testing and Materials (ASTM) ....................................... 19
2.3.2 American Association of Textile Chemists and Colorists (AATCC)................. 20
2.3.3 International Organization for Standardization (ISO) ........................................ 21
2.4. YARN CHARACTERISTICS AND SPECIFICATIONS....................................................... 22
2.5. TESTING EQUIPMENT ............................................................................................... 26
2.5.1 Uster Technologies AG....................................................................................... 26
2.5.2 Other Companies ................................................................................................ 36
2.6. PRODUCT DATA MANAGEMENT (PDM)................................................................... 36
2.7. ORDER WINNING CRITERIA ..................................................................................... 39
2.8. PERFORMANCE METRICS ......................................................................................... 41
2.8.1 Balance Scorecard............................................................................................... 44
2.8.2 Supplier Appraisal .............................................................................................. 45
2.9. LITERATURE REVIEW CONCLUSIONS ....................................................................... 46

v
3 METHODOLOGY ....................................................................................................... 48
3.1. THEORY BUILDING PROCESS.................................................................................... 48
3.2. CASE STUDY AND SURVEY METHODOLOGIES.......................................................... 49
3.3. APPLICATION OF CASE STUDY METHODOLOGY....................................................... 53
3.3.1 Research Framework .......................................................................................... 53
3.3.2 Research Questions (Objectives) ........................................................................ 54
3.3.3 Choosing Cases................................................................................................... 55
3.3.4 Developing Research Instruments and Protocols ............................................... 57
3.3.5 Conducting Field Research ................................................................................. 58
3.3.6 Reliability and Validity in Case Research .......................................................... 60
3.3.7 Documentation and Coding ................................................................................ 61
3.3.8 Analysis............................................................................................................... 61
4 RESULTS AND DISCUSSION ................................................................................... 63
4.1. YARN SPECIFICATION PROCESS ............................................................................... 68
4.2. YARN SPECIFICATIONS AND STANDARD TESTING METHODS ................................... 82
4.3. ORDER WINING CRITERIA AND PERFORMANCE METRICS ........................................ 93
4.4. PRODUCT DATA MANAGEMENT............................................................................. 101
4.5. BUSINESS PRACTICES............................................................................................. 108
4.5.1 Quality (Qualifying Criteria) ............................................................................ 108
4.5.2 Relationship (Winning Criteria) ....................................................................... 109
4.5.3 Capacity, Availability And Location (Winning Criteria) ................................. 111
5 CONCLUSIONS AND RECOMMENDATIONS.................................................... 113
5.1. YARN SPECIFICATION PROCESS ............................................................................. 113
5.2. YARN SPECIFICATIONS AND STANDARD TESTING METHODS ................................. 114
5.3. ORDER WINING CRITERIA AND PERFORMANCE METRIC........................................ 115
5.4. PRODUCT DATA MANAGEMENT............................................................................. 117
5.5. BUSINESS PRACTICES............................................................................................. 117
5.6. RECOMMENDATIONS.............................................................................................. 118
5.7. FUTURE WORK ...................................................................................................... 118

vi
6 REFERENCES............................................................................................................ 119
7 APPENDICES............................................................................................................. 123
7.1 APPENDIX A :ASTM COMMITTEE D13 ON TEXTILES ............................................ 124
7.2 APPENDIX B :ISO COMMITTEE TC 38-TEXTILES: SUBCOMMITTEE SC 23 – FIBERS
AND YARNS........................................................................................................................ 128
7.3 APPENDIX C: 73 FINANCIAL AND NON-FINANCIAL MEASURES.............................. 130
7.4 APPENDIX D :RESEARCH QUESTIONNAIRE USED TO CONDUCT CASE STUDIES....... 133

vii
LIST OF TABLES
Table 1. 85% or more cotton, carded yarn................................................................................ 9
Table 2. 85% or more cotton, combed yarn............................................................................ 10
Table 3. Benefits of collaboration in the supply chain. .......................................................... 14
Table 4. Frequently used yarn characteristics......................................................................... 24
Table 5.Description of yarn characteristics measured with Uster® equipment.. ................... 27
Table 6.Agreement on maximum or minimum requirements for different nominal yarn counts
of ring spun yarn, 100% cotton, combed for knitting applications......................................... 34
Table 7.Weighted-factor rating approach to evaluate suppliers.. ........................................... 40
Table 8. Description of companies selected for the case studies. ........................................... 64
Table 9.Yarn properties and equipment used for testing. ...................................................... 88
Table 10.Important yarn specifications for denim.................................................................. 90
Table 11.Important yarn specifications for t-shirts................................................................. 90
Table 12.Suppliers performance indicators. ......................................................................... 101

viii
LIST OF FIGURES
Figure 1. Spectrum of complaints........................................................................................... 25
Figure 2. Classing matrix of the Uster ® Classimat. .............................................................. 31
Figure 3. Mass Variation Cotton 100%, combed, ring spun, cone, knitting........................... 32
Figure 4. Improvement in yarn evenness between 1975-2007. .............................................. 33
Figure 5. PDM system interface model. ................................................................................. 38
Figure 6. Order-Winning Criteria Model................................................................................ 41
Figure 7. The role of performance measurement in the operations process. .......................... 42
Figure 8. Principal information components, methodological controls and information
transformations of the scientific process................................................................................. 49
Figure 9. Case Research Scheme.. .......................................................................................... 52
Figure 11. Number of interviews in each link of the Textile and apparel supply chain......... 63
Figure 12. Retailer’s Product Specification Process............................................................... 69
Figure 13. Fabric characteristics consider by designers when selecting fabrics..................... 71
Figure 14. Fabric and sewing thread specifications................................................................ 74
Figure 15. . Fabric specifications sheet................................................................................... 75
Figure 16. Yarn specifications. ............................................................................................... 81
Figure 17.Yarn characteristics frequently specified across the supply chain. Sample size
n=32. ....................................................................................................................................... 84
Figure 18. Example of yarn characteristics included in a fabric testing report sent to retailers.
................................................................................................................................................. 86
Figure 19. Example of yarn spec sheet. .................................................................................. 89
Figure 20. Criteria used to select suppliers across the supply chain. (n=17).......................... 94
Figure 21. Fabric manufacturers' criteria to select suppliers. ................................................. 98
Figure 22. Supplier selection criteria across the supply chain................................................ 99
Figure 23. Yarn data store in fabric libraries. ....................................................................... 103
Figure 24. Starfish: Choosing yarn type. .............................................................................. 105
Figure 25.. Starfish: Choosing yarn count. ........................................................................... 106

ix
Figure 26. CYROS® visualizes different degrees of washing effect in denim fabric.
............................................................................................................................................... 108

1
1 INTRODUCTION
In order to remain competitive and to be able to differentiate their products from off shore
sources, domestic yarn manufacturers must address the requirements of all the participants in
the textile and apparel supply chain. Unfortunately, the communication and collaboration
along the supply chain is limited, and yarn manufacturers are far removed from the final
consumer.
The objective of this research was to better understand these requirements through visits to
companies, elaboration of case studies, discussions and interviews with members of the
supply chain, and by identifying yarn specifications and performance metrics that are
important to yarn buyers and the other participants of the textile and apparel supply chain.
Based on the research findings, domestic yarn manufactures will be able to target the yarn
characteristics and specifications that will allow them to get the orders and remain
competitive.
There are many ways to specify yarns and yarn is often considered as a generic input to the
fabric production process, but has a large impact on the suitability of the final product. This
research also evaluated how product data management systems for garments and fabrics
incorporate the complexity of the yarn in the design of the final products.

2
Performance measures play three simultaneous roles: as an objective, as a metric or
measurement tool, and as a reward mechanism and they are used to support the decision
making process (Loch & Kavadias, 2008).
This project identified what are the performance metrics that companies in the textile and
apparel supply chain consider when evaluating supplier’s performance, these do not only
include technical specifications, but financial, delivery, and service.
The researched focus was on domestic manufacturers of cotton and poly/cotton yarns for
applications such as jeans, t-shirts, sheets, socks and sewing thread. A summary of relevant
data regarding U.S. imports and exports of these final products, as well as yarn commerce, is
presented in chapter two.
1.1. Research Limitations
This research was focused on cotton and poly/cotton yarns for applications such as jeans, t-
shirts, sheets, socks and sewing thread; therefore results may not be generalized to other
products.
Data was obtained from a non-probability convenience sample of domestic and Latin
American companies, focusing on the interaction of the different components of the textile
and apparel supply chain and domestic yarn manufacturers. Although the sample is believed
to be representative, results can not be generalized to the entire population of the U.S. textile
and apparel industry.

3
Despite the effort to contact the most knowledgeable people in the areas of study at the
various companies interviewed; respondents might not have had access to all the data
required to answer the questions or have not been completely familiar with all the areas
covered by the research, and this might represent a potential inability error.
1.2. Research Objectives
The main objective of this research was to identify and better understand the requirements of
the different components of the textile and apparel supply chain in regards to yarn
specifications and performance metrics. Satisfying these requirements could allow domestic
yarn manufacturers to remain competitive and differentiate their products from off-shore
sources. Keeping that in mind, seven research objectives were formulated:
• RO1. Map the yarn specification process across the supply chain.
• RO2. Identify yarn specifications considered important to yarn manufacturers, yarn
buyers and other participants of the supply chain.
• RO3. Identify current standard testing methods and equipment used to evaluate yarn
properties.
• RO4. Identify the most important yarn specifications as a function of the final
product.
• RO5. Identify performance metrics used by yarn manufacturers, yarn buyers and
other participants of the supply chain.

4
• RO6. Define “order qualifying and order winning criteria” for domestic yarn
manufacturers that will allow them to remain competitive and differentiate their
products from offshore sources.
• RO7. Evaluate existing product data management systems as to how they
incorporate yarn characteristics into designing the final product.
1.3. Research Significance
Mapping the yarn specification process enabled the identification of links of the textile and
apparel supply chain that govern the generation of yarn specifications. This will allow yarn
manufacturers to define what type of relationships they need to promote with the companies
at these specific links.
By identifying the most important yarn specifications for the products investigated, domestic
yarn manufacturers will provide goods that address customer requirements in the textile and
apparel supply chain, and they will have the chance to incorporate this information in product
data management systems that allow going back to the fiber and yarn stages when developing
a new product.
Yarn specifications play an important role in several areas in a company. In the areas of
marketing and sales, for example, specifications are used for advertisement; especially if they
can show that their products are of a better quality compared to competitors’ products.

5
Yarn specifications are also used as a communication tool with customers, since they
describe in detail the characteristics of a product and provide the information required for
negotiating prices and contracts.
In the manufacturing area, the description of the characteristics and composition of the
materials used to produce a product allows companies to plan the production, to identify the
type of machinery and assign human resources and time required to make a product. They
also set the parameters to produce consistent products.
Specifications are required in logistics when sourcing and negotiating with suppliers.
Presentation of raw materials, transportation, lead times, storage conditions, environmental
regulations and compliances, and price, are some of the factors that will influence the
decisions made when selecting a supplier.
Knowing the performance metrics considered important to yarn buyers and the other
components of the textile and apparel supply chain, will allow yarn manufactures to target
the “order winning criteria” to remain competitive. Members of the supply chain will
recognize where domestic yarn manufacturers provide a preferred product and service.
Chapter two of this document presents a review of relevant literature including the dynamics
of U.S. textile and apparel industry and its supply chain, yarn characteristics, standard testing
methods and machinery used to measure yarn characteristics.

6
Business related issues like performance metrics and order winning criteria, are also
described in chapter two.
Chapter three provides theoretical support and a description of the methodology used to
conduct the research. And the last section of the document, chapters four and five present the
findings, conclusions and recommendations of the research.

7
2 LITERATURE REVIEW
The literature reviewed can be grouped in three main areas:
• The first area includes the status of the U.S. textile and apparel industry and the
supply chain in relation to the manufacturing, imports and exports of yarns and final
products selected for the research.
• The second area focused on yarn characteristics frequently specified in the U.S. as
well as the standard testing methods and the equipment available to measure those
characteristics. A review of product data management systems was also done at this
stage, to see how they could incorporate yarn characteristics into the product
development process.
• Finally, the third area involved the study of performance metrics as well as the
definition of winning and qualifying order criteria.
2.1. Textiles and Apparel in the U.S.
The report about world textile and apparel trade and production trends, presented by Textile
Outlook International (March – April 2007) indicates that the U.S. consumer expenditure on
clothing and footwear grew by 4.9% to $358.6 bn in 2006, following increases of 4.6% in
2004 and 5.1%in 2005.

8
Clothing stores, warehouse clubs and superstores have been the two segments of the U.S.
retailer market that have benefit the most.
The report also indicates that the imports of cotton clothing in 2006 grew by 5.2% to
13,458.5 mn sme (square meters equivalent) in terms of volume and by 5.5% to $43,411.5
mn in value terms. It was observed a decrease in the volume and value of imports of apparel
made of wool, man-made fiber, silk blends, and non-cotton vegetables fibers.
The imports of cotton knitted shirts (women’s, men’s, girl’s and boy’s combined) were the
most robust (2457.5 mn sme) and 599.2 mn sme (an annual increase of 16.9%) of cotton
hosiery. The main suppliers for clothing were China (28.9 % market share), Mexico (6.6%),
Bangladesh (5.8%) and Honduras (5%). For textiles products, the largest suppliers were
China (40.9% market share), Pakistan (9.8%), Canada (7.7%) and Mexico (6.6%).
As per the exports, the Textile Outlook International (2007) report indicated that U.S.
clothing exports fell by 3.4% to $4,317 mn in 2006. The main reason was the decrease of
exports of clothing parts and semi-finished clothing to Mexico and Caribbean Basin initiative
(CBI) countries, especially parts of brassieres, trousers and knitted t-shirts.
Foreign demand for U.S. textiles products increased by 2% in 2006 to $12,385.4 mn. Mexico
remained as the largest market for U.S. textile products, followed by Canada, Honduras and
Dominican Republic.

9
Of the top twenty markets for U.S. textile exports, the Chinese market was the fastest
growing destination in terms of value. Exports to China increased during 2006 by 30.2% due
to the demand of uncarded/uncombed cotton (absorbent fiber for personal care and surgery
applications) and nonwoven fabric.
Production, import and export statistics were collected from the Current Industrial Reports
made by the U.S. Census Bureau, for carded and combed cotton yarns. As observed in Table
1, U.S. exports represented 38% of the domestic production of carded cotton yarns. Due to
missing data (no available to date), it was not possible to calculate the total domestic
production of combed cotton yarns, but as per Table 2, exports of combed cotton yarns
represent 96% and 98% of the domestic production for the last quarters of 2007.
As per the Office of Textiles and Apparel (OTEXA), from the exports of yarn in general
made in 2007, 30% went to Honduras, 14% to Canada, 11% to Mexico and 10% to
Dominican Republic.
Table 1. 85% or more cotton, carded yarn. Source: U.S. Census Bureau U.S. Production
[thousands of Kg.] U.S. Imports
[thousands of Kg.] U.S. Exports
[thousands of Kg.] First Quarter 2007 204,938 6,640 70,136 Second Quarter 2007 199,353 5,774 72,807 Third Quarter 2007 190,602 5,206 73,960 Fourth Quarter 2007 181,515 3,971 72,769 Total 776,408 21,591 289,672

10
Table 2. 85% or more cotton, combed yarn. Source: U.S. Census Bureau U.S. Production
[thousands of Kg.] U.S. Imports
[thousands of Kg.] U.S. Exports
[thousands of Kg.] First Quarter 2007 12,991 10,059 10,439 Second Quarter 2007 xxx 9,499 11,208 Third Quarter 2007 11,190 9,563 10,764 Fourth Quarter 2007 12,174 8,217 11,968 Total xxxx 37,338 44,379
2.1.1 T-Shirts Market
As the majority of apparel items, most trade in t-shirts involves exports from developing
countries to the E.U., the U.S., and other industrialized nations. The reasons are the low cost
labor in developing countries where generally is cheaper to produce t-shirts, and the strong
demand in the markets of developed countries, where household incomes are relatively high.
(Sekhar, Nov-Dec 2007).
In 2006, the largest market for t-shirts is the E.U., followed by the U.S. which had an
estimated 17% share of global imports, valued at $4.4 bn. While the main suppliers in 2006
for the E.U. were Turkey, Bangladesh, China and India; for the U.S. Mexico supplied 15.4%
of the t-shirt imports, followed by Honduras (14.6%), El Salvador (8.8%) and Haiti (5.4%).
Gildan Activewear, Hanesbrands and Delta Apparel are leading t-shirt manufacturers which
have their headquarters in North America. As part of their supply chain strategies, they are
developing low-cost production centers abroad in order to improve their competitiveness and
gain market share in the U.S.’s intensely competitive t-shirt market. (Sekhar, Nov-Dec 2007).

11
2.1.2 Denim Market
Another report presented by Sekhar (May-June 2007) on denim fabric indicated that global
exports grew an average of 5% per annum to reach $4.3 bn in 2005. Denim has the advantage
of being durable, has a wide range of consumer appeal, there are continuous innovations in
design and style, and it can be sold at a wide range of price points.
In order of value, the top ten denim fabric exporting countries in 2005 were: China, Hong
Kong, the U.S., Italy, Turkey, Japan, India, Brazil, Spain and Pakistan, all together accounted
the 83% of total world denim exports. Curiously, most of the leaders in this market have an
abundant domestic supply of raw cotton and foreign markets which are located in close
proximity. (Sekhar, May-June 2007)
Between 2001 and 2005 U.S. denim exports have decrease 1% annually, due to the intense
competition from low cost Asian countries and the downturn in the Mexican denim apparel
industry, the U.S. main customer. The U.S. exports in most of the cases to its neighboring
countries; its competitiveness has been supported by its geographical proximity and by trade
agreements which help to combat low cost Asian manufacturers. 68% of denim fabric
exports were shipped to Mexico, during 2001-2005, and 21% were sold to Guatemala,
Canada and Colombia. As per the imports, in 2005, Mexico was largest importer of denim
with 14.6% of global imports, followed by Hong Kong 13,2% and Turkey with 10.7%.
(Sekhar, May-June 2007)

12
U.S. denim production decreased during January to September 2006 by 38% compared with
the corresponding period of 2005. The reasons were that Mexico imports decreased 27%, the
increase of imports from Italy of higher priced denim fabric used in fashionable denim
apparel and the relocation of operations of U.S. denim apparel manufacturers to South
America and China.
2.1.3 Sheets Market
The US market for cotton bed sheets offers a clear view of the low-cost revolution. Pakistan
now attracts more than 50% of the import market with China taking another 22%. U.S.
production sharply decreased in 2005 and 2006. Total U.S. imports of printed cotton bed
sheets were up 88% in volume terms in 2005, the first year without quotas, further rising
62% in January-August 2006. Non printed cotton bed sheet imports more than doubled in
volume terms in 2005 before modestly increasing 10% in the first eight months of 2006.
(Emerging Textiles, 2006)
U.S. imports from Pakistan were more than 30 million units in 2005. Imports from China
exceeded 10 million pieces in 2005. Both countries together account for more than 77% of
US imports. According to official data, domestic production of cotton and man-made fiber
sheets fell 30% in 2005 before further sliding 38% in the first quarter of 2006, while imports
were up 49.80% and 44%, respectively. The share of domestic production in the US market
fell from 73% in 2001 down to 31% in 2005 and 23.8% in the first quarter of 2006.
(Emerging Textiles, 2006)

13
2.1.4 Socks Market
The U.S. sock industry was the most competitive sector of the domestic apparel industry left
in 2004. The imports of socks grew from less than 1 million dozen pairs in 2001 to 22
million dozen pairs in 2003, while their average wholesale price dropped from $9.0 to 4.15
over the same period. U.S. sock production decreased from 207 million dozen pairs in 2001
to 166 million dozen pairs in 2003, and domestic market share has dropped from 76% in
1999 to 40% in 2004. (Bealer, 2004)
In the present, U.S. socks producers are concerned about the surge in socks from Mexico that
occurred when the North American Free Trade Agreement went into effect; the increase in
imports from Asia, and also from Honduras under the Central American Free Trade
Agreement. During the first half of 2006, 6.7% of the U.S. socks imports came from
Honduras; a year after, during the same period, imports from Honduras represented 10.2% or
12.3 million dozen pairs, of cotton, wool and man-made fiber. The reason was partly because
of duty free treatment under CAFTA. (Clark, 2007)
U.S. socks producers represented 33.2% of the total U.S. socks market in 2006 compared to a
37.9% in 2005. In the present they are requesting the government to reestablish quota limits
on Chinese and Honduran socks imports. Opponents of new restrictions to Honduran imports
would help Asian suppliers but hurt U.S. textile companies, since Central America is their
largest market for yarns. (Clark, 2008)

14
2.2. Supply Chain and the DAMA Project
The Supply chain is the process that integrates, coordinates and controls the movement of
goods, materials and information from a supplier through a series of intermediate customers
to the final consumer. (Emmett & Crocker, 2006).
Supply Chain Management (SCM) involves the management and linking of activities such as
sourcing, making, moving and selling, between suppliers and customers to the consumer in a
timely manner. It offers opportunities for competitive advantages by service differentiation
and cost leadership. (Emmett & Crocker, 2006).
In today’s markets, relationships play an important role when selling and buying products.
Some of the benefits of maintaining good relationships and collaboration in the supply chain
are shown in Table 3.
The key factors for establishing successful collaborative relationships include sharing
information, top management support, shared goals, early communication to suppliers and
supplier contribution to value. (Emmett & Crocker, 2006).
Table 3. Benefits of collaboration in the supply chain. Source: Emmett & Crocker, 2006.
Aspect Collaboration brings Forecast accuracy Increase external visibility will force better accuracy. Lead Time Reductions following sharing and joint improvements. Inventory Reduce as stock levels fall. Utilization of resources Improve in a leaner operation with less waste. Costs Reduced and improved. Service levels Increased and improved. People Trust and improved relationships.

15
In 1993 a project called DAMA (Demand Activated Manufacturing Architecture) was
initiated as part of the American Textile Partnership Program (AMTEX) sponsored by
industry, the Department of Energy, federal agencies, and universities. DAMA focused on
increasing the competitiveness of the fiber, textile, sewn products, and retail domestic
industries by developing an inter-enterprise architecture and analysis methodology for supply
chains that enables improved collaborative business across the supply chain. (Chapman and
Peternsen, 2000. LovejoyA).
DAMA’s goals included:
• Supply Chain Analysis: Complete development, validation, and transfer to industry
of the methodology for performing supply chain analysis to provide opportunity
identification, synchronization, and improved high-level business process access
leading to cost, time, and quality improvements in the U.S. textile and apparel
industry.
• Supply Chain Architecture: Develop, validate, and publish an inter-enterprise
supply chain architecture to provide current information at an inter-enterprise level,
leading to improved planning, JIT, and inventory management for all participants.

16
The project last seven years, industry determined that collaborative business practices are
necessary to provide a significant reduction in time and cost to product supply chains and the
opportunity for savings in the U.S. softgoods industry was estimated at $45 billion per year
with a realistically achievable 50% reduction in time. The vision of the project demanded
industry to focus on consumers, to develop a supply chain management process that would
be demand driven and where production had to be synchronized to replenish product at the
consumer's pull rate. The Internet was chosen as the tool used to share information
selectively and securely across the supply chain.
The results of the project are summarized in the DAMA Final Report (Chapman and
Petersen, 2000. LovejoyB, 2001):
• Supply Chain Analysis: Four textile products were selected to track and document
their production process, analyze the relationship and business processes between
companies participating in the production and also the data and information flow
generated in all the stages.
The information was gathered thought visits to plants and interviews with key
managers. As a result, process step maps for each product were developed and they
included the fiber, textile, sewn products, and retail business processes. These maps
displayed the activities necessary for the production of a product and revealed
improvement opportunities.

17
They also lead to the study of the relationship of the business processes and the
exchange of data, as a result, the Quick Response Apparel Business Model, the
Textile Industry Supply Chain Business Model, and a Logistics Process Map for
Assembly in Mexico, were created.
• Supply Chain Architecture: the textile and apparel supply chain consists of a
number of companies, which convert a raw or semi-finished supplied material (e.g.
cotton, or fiber) into a state of completion and greater value, resulting in the
production of a consumer product, sold through retail.
It was found that software programs where not enough to share corporate
information. The key architecture for collaboration across the supply chain is the
support of a common set of information available to all members of the supply chain.
The information must be timely, accurate and secure. The inter-enterprise architecture
and the Collaborative Industry Supply Chain Simulation (CISS) model were
developed to show how a single demand plan was visible to all members of the chain
and how that information would be processed and shared with each company
participating.
To validate DAMA Supply Chain Architecture, simulation tools were used to
calculate planning/production lead-time, order lead-time and inventory levels for the
various partners in the supply chain.

18
The results showed that there was a reduction of 16 days in the order lead-time using
the collaborative supply chain model versus the traditional supply chain model, which
was a 49% decrease. Also, the collaborative model reduced 137 days from the
planning / production cycle which represented a 49% decrease in time in the supply
chain. For each partner, in the collaborative model, there was a reduction in finished
goods inventory from just over 6 weeks worth of units to approximately 2.5 weeks of
inventory while providing the same level of customer service.
2.3. Standard Testing Methods
According to the terminology standards of the Textiles Committee (D13) and the Sports
Equipment and Facilities Committee (F08) of the American Society for Testing and
Materials (ASTM); a specification is defined as: A precise statement of a set of requirements
to be satisfied by a material, product, system or service that indicates the procedures for
determining whether each of the requirements is satisfied. D123,D13.
A document setting forth pertinent details of a product, such as performance, chemical
composition, physical properties and dimensions, prepared for use in, or to form the basis
for, an agreement between negotiating parts. F869,F08

19
The Non Destructive Testing Committee (E07) of the American Society for Testing and
Materials (ASTM) defines Standard as (1) a physical reference used as a basis for
comparison or calibration; (2) a concept that has been established by authority, custom, or
agreement to serve as a model or rule in the measurement of quality or the establishment of a
practice or procedure. E1316, E04.
As observed, the term standard can refer to an actual test method or to the minimum
acceptable level of performance on a particular test (Collier & Epps, 1999). In this section
we will refer to the standard test methods, to those testing procedures widely accepted to test
yarn properties.
There are many organizations in the U.S. and the rest of the world that defined terms,
established standards and developed methods to test properties of textiles along the supply
chain. Only those organizations specific to this research will be described.
2.3.1 American Society for Testing and Materials (ASTM)
ASTM is the world’s largest nongovernmental standards writing body. It consists of more
than 130 technical committees dealing with materials used in many industries besides
textiles. ASTM is international in scope and publishes an Annual Book of Standards. The
standards are released when a full consensus of all concerned parties is met. ASTM voting
members vote in proposed standards and revisions, once published; they are reviewed,
reaffirmed or withdrawn every five years. (Kadolph, 2007)

20
For fibers and yarns, considered the “dry” side of the industry, most of the standards fall
under ASTM Technical Committee D13 – Textiles, this committee typically develops test
methods dealing with fiber and yarn evaluation and properties.
ASTM Technical Committee D13 has thirty sub-committees; from those, the four highly
related to yarns are:
• D13.58 Yarns and Fibers
• D13.92 Terminology
• D13.93 Statistics
• D13.99 Coordination Committee for ISO & Foreign Textile Standards
Appendix A contains the list of ASTM standards highly related to the yarns investigated in
this research.
2.3.2 American Association of Textile Chemists and Colorists (AATCC)
AATCC typically develops standard test methods for evaluating colored or chemically
treated textile materials; they cover the “wet” side of the industry because most of the dyeing
and finishing procedures used in textiles are performed in water.
AATCC standard test methods are developed by research committees and they are approved
by three-level hierarchy before they are published in the “Technical Manual”.

21
Test methods are reviewed annually for the three years of existence after had been published;
then, they will be revised, reaffirmed or withdrawn every five years. (Kadolph, 2007)
AATCC and ASTM are both based in the U.S. and they work very closely together to keep
each organization aware of the others activities to reduce the possibility of duplication. Both
organizations periodically do joint development work. A complete list of the testing methods
offered by AATCC can be found at
http://www.aatcc.org/Technical/Test_Methods/Alpha_List.htm. Since their focus is on the
chemistry and coloration of textile materials, they offer testing methods for fiber analysis and
fabric performance, but not for yarns specifically.
2.3.3 International Organization for Standardization (ISO)
ISO coordinates many voluntary standardization organizations worldwide and addresses
many industries also. Because of the global nature of many industries, standard processes and
terminology for determining the quality and performance of materials and products are
becoming increasingly important. (Kadolph, 2007)
The Technical Committee in charge of Textiles is the TC 38. Three of the ISO/TC38
subcommittees:

22
• TC 38/SC 1 Tests for colored textiles and colorants
• TC 38/SC 2 Cleansing, finishing and water resistance tests
• TC 38/SC 20 Fabric descriptions
• TC 38/SC 23 Fibers and yarns
• TC 38/SC 24 Conditioning atmospheres and physical tests for textile fabrics
AATCC is secretariat subcommittees SC1 and SC2 and Subcommittee SC23 is secretariat by
Cotton Inc., another U.S. organization. Both work to get the United States practices and
standards approved globally.
Additionally, ISO has two programs that facilitate companies to participate in the
international trade. ISO 9000 certifies that a company meets the criteria for business-to-
business interaction. ISO 1400 enables companies to formulate, implement and audit policies
related to their impact on the environment. (Kadolph, 2007)
The list of ISO standards for textiles can be found at www.iso.org and a selection of the
standards directly related to the yarns investigated in this research is shown in Appendix B.
2.4. Yarn Characteristics and Specifications
Yarn is often considered as a generic input to the fabric production process, but has a large
impact on the suitability of the final product. The characteristics of a yarn can affect the
physical properties of the fabric such as appearance, hand, comfort, drape, durability, and

23
cost. At the same time, yarn characteristics, will influence the efficiency of the fabric
formation process.
“In order to specify a property it is also necessary at the same time to specify the method of
test” (Saville, 1999). In his book, Saville describes in detail the yarn properties and the
methods and apparatus used to measure them.
Lord (2003) and McCreight et al. (1997) focus in describing the production processes of
yarns, the different technology systems available to obtain short staple, long staple and
filament yarns, the influence of the machinery settings in the yarn characteristics, operational
factors as well as production efficiencies and quality considerations.
Kadolph, S.J. (2007) offers definitions of standards and specifications, explains the role of
quality and quality assurance techniques, such as Total Quality Management and analytical
tools, applied to the complete manufacturing process, from fiber to final product, with
emphasis in fabrics and garments.
After reviewing existent literature about yarn processing and testing, it was observed that the
yarn characteristics most frequently specified in books are:

24
Table 4. Frequently used yarn characteristics Frequently used yarn characteristics
Fiber type and content Yarn Strength
Yarn type Yarn Elongation
Yarn structure Friction Coefficient
Yarn count (Linear density) Neps count
Yarn twist Yarn Bulk
Yarn evenness (Thick and thin places) Yarn Texture (Texturizing process, crip
structure)
Yarn hairiness Yarn Finish
Quality level of the yarn is appreciated from different points of view depending on the
market and the end use. For example, a yarn with a tenacity of 17.3 [cN/tex] can be used in
knitting applications but it will break constantly if it is used for weaving, since yarns are
exposed to higher stress while weaving. Elongation on the other hand needs to be higher for a
knitting yarn than in a weaving yarn.
One can continue giving examples of how yarn properties could affect the transforming
processes from yarn to fabric and the characteristics of the fabric. If yarns are grouped in four
major categories: type of fibers, yarn structure, yarn twist and spinning system and there are
10 variations in each of these categories, by simple probability there will be 104 different
types of yarn (Behery, 2005); imagine the amount of different fabric qualities you can obtain
from them.

So at the end, when trying to establish the characteristics that define a “good yarn” the
answer will be “It all depends…”; knowing two things for sure, that the yarn and subsequent
fabrics must have an acceptable blend of performance, aesthetics and reasonable price for a
specific end use, and that the final quality measure will be “can the yarn be sold?” and even
more important “will there be repeat orders?”. (Oxenham, 2005)
Figure 1. Spectrum of complaints. Source: Lord, 2003.
“The analysis of customer’s complaints is a prime tool for keeping track of quality levels”
(Lord, 2003). Lord makes a good point by showing graphically the frequency of yarn quality
complaints for fine staple yarns (Figure 1).
It can be observed that sometimes technical issues are not as important as operational or
managerial issues, like shipping for example. Additionally, winding and yarn appearance, the
two most common complaints, are problems caused by more than one factor and not always
25

26
by a physical property of the yarn. Winding could represent many other issues, including bad
processing practices and yarn appearance could cover thin and thick places, neps, etc.
2.5. Testing Equipment
This section describes the most common equipment use in the laboratories of domestic yarn
manufacturers to control the quality of their products.
2.5.1 Uster Technologies AG
Uster Technologies is a supplier of electronic equipment to control the quality in the yarn
manufacturing process. The information contained in this section was obtained from the vast
number of articles that can be found on the website www.uster.com and Uster® application
report series. Table 5 shows the different characteristics of the yarns that can be measured
and the specific name of the Uster® equipment necessary to do it.
Although the Uster® Tensojet and the Uster® Tensorapid have the same applications of
testing tensile strength and both utilize the CRE (constant rate of extension) principle to
apply force to the tested specimen, they are two totally different instruments.
The Uster® Tensorapid uses the traditional method of pneumatic clamps with one stationary
and one moving clamp.

27
Table 5.Description of yarn characteristics measured with Uster® equipment. Source: Uster® Statistics 2007. Yarn Characteristics Description Unit Machine
Count variations (CVcb) Count variations between packages % Uster® Tester Mass variations (CVm) Coefficient of variation of mass % Uster® Tester Mass variations (CVmb) Coefficient of variation of mass between packages % Uster® Tester Imperfections (Thick/Thin/Neps) Number or thick places, thin places and neps. 1/1000 Uster® Tester
Hairiness (H) Absolute value of hairiness. Measurement of the entire fiber length Uster® Tester
Standard deviation of hairiness (SH) Standard deviation of hairiness within a package Uster® Tester Coefficient of variation of hairiness Variation of hairiness between packages % Uster® Tester Trash (Dust/Trash) Dust and trash in yarns. Counts refer to 1000 m of 1/1000 Uster® Tester Coefficient of variation of the Variation of the yarn diameter % Uster® Tester Shape Shape of the yarn-cross section/Ratio of the axes of Uster® Tester Density (D) Density of the yarn g/cm3 Uster® Tester Strength (FH) Breaking force cN Tensorapid & Tenacity (RH) Breaking force referred to the yarn count cN/Tex Tensorapid & Coefficient of variation of tenacity Variation of the individual values of tenacity % Tensorapid & Elongation (εH) Yarn elongation at breaking force % Tensorapid & Coefficient of variation of elongation Variation of the individual elongation values % Tensorapid & Work done to break (WH) Work performed during tensile testing of yarns at cNcm Tensorapid & Coefficient of variation of work done Variation of the individual values of work done to % Uster® Tensojet Weak places in the yarn/strength 0.1% of all tests have a strength below this value cN Uster® Tensojet Weak places in the yarn/elongation 0.1% of all tests have a elongation below this value % Uster® Tensojet Weak places in the yarn/strength 0.01% of all tests have a strength below this value cN Uster® Tensojet Weak places in the yarn/elongation 0.1% of all tests have a elongation below this value % Uster® Tensojet

28
The clamp speed is completely stepless and can be selected anywhere from 50 to 5000
mm/minute, this maximum speed and with a clamp distance of 50 cm, have been recognized
as a common test method. The clamp distance is also stepless, and can be set from 10 to 100
cm.
It is important to note that there are other test standards that use different speeds and clamp
distances, as a result, different strength and elongation values will occur; therefore it is very
important that when tensile tests are reported the testing parameters are also specified (speed,
clamp distance, pre-tension, etc).
The Uster® Tensojet uses a patented system of two pairs of metal and rubber coated rolls to
carry out tensile testing, this design allows the machine to operate at much higher speeds
(400 m/min) than traditional tensile testers.
The high speed has two distinct advantages:
• It more closely duplicates the stress that the yarn is subjected to in weaving.
• The larger sample size (standard test - 1000 breaks, 800 meters of yarn) is a
better predictor of yarn performance than the traditional test method (20
breaks, approximately 15 meters of yarn).

29
The clamp distance on the Uster® Tensojet is fixed at 50 cm and the selection of test speed
on the current model is 200 or 400 m/min with 400m/min being the standard test speed. Due
to its ability of measuring strength at ultra high speeds, it simulates the dynamometric stress
of a yarn during the weft insertion process allowing to forecast the weavability of the yarn.
Because of the difference in testing speeds, there will be a difference in strength and
elongation results between the Uster® Tensojet and the Uster® Tensorapid; the amount of
difference depends upon the fiber type and spinning system and it is caused by the way the
yarns physically react when different rates of force are applied to them.
Although the Uster® Tensojet and the Uster® Tensorapid yield different values, the
correlation between the two instruments is excellent. It is also important to note that test
results will also vary within any instrument if the tests are carried out under different testing
parameters (speed, clamp distance, pre-tension, etc).
The reason why somebody would choose a Uster® Tensojet and a Uster® Tensorapid largely
depends upon the type of yarn to be tested. The Uster® Tensojet, while extremely fast, is
limited in its application range. It was designed to test only staple yarns with a count range of
approximately 4/1 to 120/ Ne. and the maximum force and elongation is 50N and 70%
respectively. It is not designed to test filament yarns, highly elastic core yarns, or high
tenacity performance yarns.

30
The Uster® Tensorapid is a more versatile machine; it can test staple yarns, performance
yarns, highly elastic core yarns, and filament yarns. With specialized clamps, it can also test
yarn hank, fabric, sliver, and roving samples. Maximum force and elongation for the Uster®
Tensorapid are 1500 N and 1000% respectively. If the yarn to be tested falls outside of the
application range of the Uster® Tensojet, or wishes to perform specialized testing, the
Uster® Tensorapid would be the better choice.
Besides measuring the characteristics listed in Table 2, there are other parameters measured
to contribute to control the consistency of the yarn. There are two types of yarn faults based
on the frequency they occur:
• Frequent faults are also called imperfections and can be detected by a yarn
evenness tester.
• Seldom-occur faults happen at irregular intervals so tests need to be ran on at
least 100 Km of yarn (1000 Km for Open End yarns) in order to obtain a
reliable result.
Uster® Classimat is able to detect these faults and classify them in a system based on the
fault’s length and size, as shown in Figure 2. These data is useful to define and control
clearer settings in the winders. The percentages showed as a description of the fault sizes
refer to the mean number of fibers in a cross-section of a yarn.

Figure 2. Classing matrix of the Uster ® Classimat. Source Uster ® Application Report.
31

Based on their constant technological innovation and business strategies, they have been able
to set quality standards for fibers and yarns in the textile industry, such as the Uster®
Statistics, for example.
Uster® Statistics are a practical guide to good textile practices in the field of yarn
manufacturing. The company has compiled yarn quality control information from all over the
world and built what can be described as comparative standards. These standards help yarn
manufacturers to evaluate their performance and compare it to the average performance of
the global industry. At the same time, they are used by yarn consumers as a tool for supplier
evaluation and product specification. An example is shown in Figure 3.
Figure 3. Mass Variation Cotton 100%, combed, ring spun, cone, knitting. Source: Uster® Statistics
32

33
The company has identified that quality costs in the textile value chain represent at least 10%
of the final sale value and that companies are increasingly putting more emphasis in the
quality assurance of the entire supply chain. Figure 4 from the Uster® Statistics 2007 shows
the improvement of yarn evenness between 1957 and 2007.
Poor yarn quality can be caused by a deficient quality management system in the mill that do
not support product consistence or by failure of the yarn buyers or users to specify precise
yarn quality parameters as a function of the end use and the subsequent production processes.
Figure 3 can be read as follows: for a 20 Ne yarn, only 5% of the samples (gathered from
around the world) have a CVm of 10%. For this specific example the origin of the yarns
tested were 14% North and South America, 9% Europe, 11% Africa and 66% Asia and
Oceania
Figure 4. Improvement in yarn evenness between 1975-2007. Source: Uster® Statistics 2007.

34
Table 6.Agreement on maximum or minimum requirements for different nominal yarn counts of ring spun yarn, 100% cotton, combed for knitting applications. Source: Uster® Application Report SE-601.
Yarn Count and Twist 26 Nec 32 Nec 36 Nec 40 Nec Uster® Statistics Deviation of count (%) Max +- 2.5 +- 2.5 +- 2.5 +- 2.5 Count Variation CVb (%) Max 1.5 1.5 1.5 1.5 50% Twist multiplier alpha e Max 3.6 3.6 3.6 3.6 Variation of twist CVt (%) Max 3 3 3 3 Direction of twist Z Z Z Z
Yarn evenness and hairiness Uster eveness CV(%) Max 11.8 12.5 12.7 12.9 20% Thin places -40% (1/km) Max 37 60 91 113 20% Thin places -50% (1/km) Max 1 2 2 2 20% Thick places + 35% (1/km) Max 182 240 300 340 20% Thick places + 50% (1/km) Max 16 19 23 25 20% Neps + 140% (1/km) Max 153 200 245 272 20% Neps + 200% (1/km) Max 35 45 57 63 20% Uster hairiness Max 4.8 4.6 4.4 4.3 50%
Yarn strength and elongation Single end strength (cN/tex) conventional Min 15 15 15 15 95%
Strength variation CV(%) conventional Max 8.3 8.6 8.8 8.9 75% Single end elongation (%) conventional Min 5.2 5 4.9 4.8 75% Single end strength (cN/tex) high speed Min 16.5 16.5 16.5 16.5 95% Strength variation CV(%) high speed Max 8.6 8.9 9.1 9.3 75% Single end elongation (%) high speed Min 4.7 4.6 4.5 4.4 75%
Significant Classimat faults remaining A3+B3+C2+D2 cumulative (1/100 km) Max 14 14 14 14 50% E (1/100 km) Max 0 0 0 0 50% H2 + I2 (1/100 km) Max 0 0 0 0 50% Foreign fibers A3+B2+C1+D+E1 cumulative (1/100 km) Max 0 0 0 0 50%

35
Uster® has been able to create yarn profile rankings based on Uster® statistics and
collaboration of the partners of the company that agreed maximum or minimum requirements
for different spun yarns and nominal yarn counts as shown in Table 6 in the previous page.
The percentile value in the last column shows where does a particular yarn quality parameter
ranks within a given yarn database. For example with respect to yarn strength, a 95th
percentile ranking would indicate that 95% of the yarn samples in the same database as the
tested yarn had strength values higher than the tested yarn. Conversely, a 5th percentile
ranking with respect to strength would indicate that 95% of the samples in the same database
as the tested yarn had strength values lower than the tested yarn. While the 95th percentile
may be considered “bad” and the 5th percentile “good”, this view is too simplistic. The
overriding factor in determining yarn quality is its end use application and this point must be
taken into consideration when interpreting the Uster® Statistics.
The standard testing methods apply to Uster® products are:
• ISO 2060 Determination of yarn count. (Uster® Tester)
• ISO 2649 Determination of yarn evenness. (Uster® Tester)
• ISO 2062/ASTM D-1578 Single end tensile test (Uster® Tensorapid)

36
2.5.2 Other Companies
There are other companies that produce advanced quality control and laboratory testing
equipment for sale in the United States, some of them are:
• MESDAN S.p.a - http://www.mesdan.com
• Lawson-Hemphill - http://www.lawsonhemphill.com
• Textechno Herbert Stein GmbH & Co. KG - http://www.textechno.com
• Zweigle Textilprüfmaschinen GmbH & Co. KG - http://www.zweigle.com
2.6. Product Data Management (PDM)
When conceived in the late 1980’s, PDM was a design-centered software package used to
manage product design data, focusing in engineering and manufacturing, capturing product
data from the original release to the data’s obsolescence. The main concern was to manage
the initial release of data to manufacturing and managing the engineering change order
process initiated by manufacturing. Some vendors of this package build the PDM function
into the CAD (Computer Aided Design) system software; others use separate software that
interface with the CAD system. (Rehg & Kraebber, 2005)
PDM is a computer-based system that helps to manage and control engineering data,
engineering activities, engineering changes and product configurations. The system allows
many departments of the company to upload and share information generated in their areas
and provides support for the activities of product teams and for techniques that aim to
improve engineering workflow and engineering process. (Stark, 2000)

37
PDM systems store and organize CAD (Computer Aided Design) but have also other
functions. The most important is to control a coorporation’s master ingenieering bill of
materials (BOM), which contains all the information of the individual parts and materials
used to make the product. . (Rehg & Kraebber, 2005)
As per Stark (2000), the basic components of a PDM system are:
• Information warehouse in which engineering information is stored. This
information can be description of products and parts such as engineering drawings,
CAD data, circuit layouts, flow charts, and test results, bills of materials, field data
and word-processed product specifications. It also can be traditional media such as
paper, mylar, and aperture cards, or electronic
• Information management module to control and manage the information
warehouse.
• Basic infrastructure of a networked computer environment.
• Interface module, to provide interfaces for programs such as CAD and ERP and give
to users and other programs.
• Information structure definition module, to define the structure of the information
to be managed.
• Workflow structure definition module. The workflow is made up of a set of
activities to which information can be associated; the module defines the structure of
the process to be managed.

• Information structure management module, to maintain the exact structure of all
information in the system.
• Workflow control module, to controls and coordinate the engineering process.
• System administration module, used to set up and maintain the configuration of the
system, and to assign and modify access rights.
PDM systems address the creation, flow, control and use of critical product and process data
elements. Figure 5 shows the main role of a PDM system.
Figure 5. PDM system interface model. Source: Rehg & Kraebber, 2005
38

39
2.7. Order Winning Criteria
According to Hill (2005), competitive criteria are divided in to categories, qualifying and
order-winning. The qualifying criteria provide the product or service the opportunity to
compete in a market; the qualifier factors are those that match the customer’s requirements.
On the other hand, the order-winning criteria are what make companies win orders against
competitors that also qualified to participate in the same market. Both types change within
time and from market to market.
A company can develop competitive advantages by linking the qualifiers and order-winner
factors to their operations strategies, building the bridge between the technical specifications
(dimensions) of the product or service and the business specifications (qualifiers and order-
winners).
Examples of relevant qualifiers and order-winners are: price, quality conformance, delivery
reliability, delivery speed, product or service variety, innovation, reaction to demand peaks,
and other specific customer’s needs.
When selecting suppliers qualifiers and order-winners will not be the only considerations to
take into account. Hill proposes weighted-factor rating approach, once the selection criteria is
agreed, points will be given depending on their level of importance and the each possible
supplier will be rated, as shown in Table 7.
40
Table 7.Weighted-factor rating approach to evaluate suppliers. Source: Hill, 2005. Factors Weights Supplier A Supplier B
Delivery on time 60 50 60 Delivery speed 80 40 70 Quality conformance 40 40 35 Price 30 30 20 Technical support 40 30 35
Order-winners and qualifiers
SUBTOTAL 250 190 220 Current capacity 20 20 20 Ability to increase capacity in the short term 10 0 10
Meet mid-term growth requirements 50 30 45
Operations
SUBTOTAL 80 190 220 Level of technical staff provision 50 40 45
Staff technical know-how 30 25 30 Future contributions to developing products and services
20 10 15 Technical
SUBTOTAL 100 75 90 Managerial and financial standing of the organization 70 50 60
Corporate SUBTOTAL 70 50 60
TOTAL 500 365 445
Rehg & Kraebber (2005) presents Terry Hill’s model with the winning-order criteria as the
common language linking both marketing and manufacturing areas. Figure 6 shows the five
steps of planning process, the model promotes debate about how the established
manufacturing strategies allow the company to produce the products demanded by the market
place. The order-winning criteria provide the vocabulary to describe the product market
requirements and translate them into process choices and infrastructure requisites by
manufacturing.

Figure 6. Order-Winning Criteria Model. Source: Rehg & Kraebber 2005.
Most of the criteria listed in the third column of figure 6, must be addressed by the
manufacturing area, therefore they need to now the standards and performance metrics
necessary to compare their performance to their competitor’s and to evaluate if they are ready
to provide the order-winning criteria. Rehg & Kraebber (2005)
2.8. Performance Metrics
Performance measurement is defined by Hatry (2006) as regular measurement of the results
(outcomes) and efficiency of services or programs. Regular measurement of the progress
achieving an objective is a key component of managing by results. Performance information
establishes accountability, budget proposals justifications, and resources’ utilization levels.
A performance measurement is the process of quantifying the efficiency and effectiveness of
an action, where measurement is the process of quantification and action leads to
performance. A performance measure, then, is the metric used to quantify the efficiency and
41

effectiveness of an action and a set of them make the performance measurement system.
Performance measures need to be aligned with the strategies of the company, since they are
able to influence what people do. (Neely, et al., 2005)
Figure 7, explains graphically the role of a performance measurement as a control tool
between he inputs and the outputs of an operations process.
Figure 7. The role of performance measurement in the operations process. Source: Hill, 2005.
The key dimensions of manufacturing’s performance are quality, delivery speed, delivery
reliability, price/cost, and flexibility. Quality related measures do not only refer to the
conformance to specifications of a product, with the development of the Total Quality
Management (TQM) philosophy customer satisfaction concepts have been included under
this dimension. Just in Time (JIT), Optimized Production Technology (OPT, minimization of
42

43
throughput times) and ABC Costing System are tools that help to define what would be the
best measures to apply for delivery speed, delivery reliability and price/cost dimensions. As
per the flexibility dimension, operational measures should be taken into account; this
includes modification flexibility (design changes made in a component in a finite time), re-
routing, and volume and material flexibility.(Hill, 2005)
An empirical study of performance measurement in manufacturing firms was conducted by
Gosselin (2005), showing that despite the suggestions made in literature, manufacturing
companies still put more emphasis on financial measures when designing their performance
measurement system, rather than incorporate non-financial measures. A list of the seventy-
three performance measurements used to conduct this study can be found in Appendix C
Net profit, gross profit margin, total sales department, amount of raw material inventory,
cost per unit produce and others represented the first eleven measures mentioned by the
companies that participated in Gosselin’s study. The first non-financial measure was the
number of worker injuries in twelfth place.
Gosselin’s study conclusions were that the performance metrics most commonly used in
companies are usually the same, even if the company has balance score cards or integrated
performance metrics systems. Companies where the decision-making process pertaining to
the management of divisions is decentralized tend to use more non-financial measures than
centralized organizations.

44
Those companies in an unstable environment would tend to use financial measures but also
non-financial measures related to customers and employees.
Finally, Gosselin’s study concludes that companies defined as prospectors, very dynamic
looking for market opportunities, capable of large investment in research and development
areas; tend to put more emphasis in non-financial measures related to customers, products,
employees and quality. Companies defined as defenders, operate in narrow product-market
domain, producing high volumes and low product variety; use financial measures more
frequently.
2.8.1 Balance Scorecard
Graham (2000) defines a company’s scorecard as a collection of performance measures that
provide information on performance, and describes several models to create a scorecard.
Kaplan and Norton’s Balance Scorecard Model includes four categories of data: customer
measures, financial measures, internal measures and innovation/growth measures. The
internal measures include productivity, efficiency, internal quality, industry-specific metrics,
supplier partner performance, etc.
Graham also mentions the Baldrige Award Model, including customer-focused results,
financial and markets results, human resource results, supplier and partner results and
organizational effectiveness results. This model is good for organizations that are labor-
intensive and spend a lot of money in on outside suppliers and contractors.

45
Dicover Financial Services Scorecard, The Scorecard Structure of a Leading Securities Firm,
and the Military Scorecard Designs are other examples of models used to build scorecards.
Whatever are the metrics the company decided to use, they need to be linked to the
company’s overall goals. Measures are based in two types of metrics: counting (which are
more objective and less time consuming) and judgment (rating, ranking, specific criteria and
opinions).
2.8.2 Supplier Appraisal
Emmett & Crocker (2006), define supplier appraisal as the action of selecting and measuring
suppliers in order to asses those more suitable for potential long-term collaboration. The
approval criteria used by procurement departments include:
• Technical competence.
• Managerial competence (how well run is the company)
• Financial stability.
• Reliability.
Supplier performance can be measured by comparing it to:
• A standard.
• Performance on a previous order.
• Another’s supplier performance.

46
To insure continuous improvement of a supplier, it is necessary to control or audit its
ongoing performance. In a collaborative relationship, these audits should identify areas for
improvement for mutual benefit, rather than a tool to find faults that provide a negotiation
lever.
2.9. Literature Review Conclusions
The literature reviewed concerning the status of the U.S. textile and apparel industry in
regards of cotton yarn manufacturing and final products selected for this research showed
that domestic industry is highly affected by imports from Asia and Central America, that has
caused a considerable shrinkage of the textile and apparel industry in the U.S. and has forced
companies to either shut down operations or initiate operations in neighbor countries taking
advantage of trade agreements.
Information about standard testing methods and standardization organizations was found and
revealed that although there are specific testing methods and equipment to measure yarn
characteristics, there are a few sources that set standard specifications or values for each yarn
characteristic. The reason might be there is a considerable amount of fabric qualities that can
be obtained by changing one simple yarn characteristic and at the end when trying to
establish the characteristics that define a “good yarn” the answer will be “It all depends of the
type of final product…”

47
The majority of Product Data Management systems focused on the management of data of
complex products, with many components, it was not possible to identify examples of
applications for yarns, maybe due to their simple data structure.
Finally, it was possible to identify and define the performance metrics and winning-order
criteria that will help to develop the following chapters.

48
3 METHODOLOGY
3.1. Theory Building Process
To obtain in depth knowledge of the dynamics and business practices of the actual textile and
apparel industry that will allow us to accomplish the objectives of the present research,
information needs to be collected from all the different components of the supply chain. The
purpose of building a theory based on the information collected during the research is to
make it useful and applicable in the future.
According to Handfield and Melnyk (1998), theory is the vehicle that links data to
knowledge; without theory, empirical research merely becomes “data-dredging”; therefore
the theory-building process serves to differentiate science from common sense. Figure 8
shows a map of the stages that usually occur in the scientific process.
The three pillars on which science is built are: observation, induction and deduction.
Observations are specific and unique items of information; they can become empirical
generalizations by performing measurements, sample summarization and parameter
estimations. Empirical generalizations in turn, can become theories via concept formation,
proposition formation and proposition arrangement. A theory is a more general type of
information that after applying logical deduction is transformed into hypotheses. These
hypotheses become new observations via interpretation, instrumentation, scaling and
sampling. These new observations will become empirical generalizations again and the

hypotheses they came from may then be tested for conformity to them. The results of the
testing will be a decision that either accept or reject the truth of the hypotheses. Once again
by logical deduction the theory will be confirmed, modified or rejected.
Figure 8. Principal information components, methodological controls and information transformations of the scientific process. Source: The Logic of Science in Sociology by Wallace, 1971 (as cited in Handfield & Melnyk ,1998)
3.2. Case Study and Survey Methodologies
After reviewing available research methodology literature and studying examples of Case
Study and Survey research in the areas of in Operations Management and Supply Chain
49

50
Management, it was found that they can be used as complementary tools to conduct a
research of exploratory nature as the present one.
Case Study research methodology allows flexibility of data collection and the chance to
validate it by triangulating information obtained at different links of the supply chain. It is
also useful to map the field been investigated and to identify and describe the critical
variables (Seuring, 2005).
A case study is an empirical methodology that typically uses multiple methods and tools for
data collection from a number of entities by a direct observer in a single, natural setting that
considers temporal and contextual aspects of the contemporary phenomenon under study, but
without experimental controls or manipulations. The methods and tools employed include
both quantitative and qualitative approaches: financial data, interviews, memoranda,
questionnaires, organization charts, etc. (Meredith, 1998)
On the other hand, survey research involves the collection of information from individuals
(through mailed questionnaires, telephone calls, interviews, etc.) about themselves or about
the social unit to which they belong by using a structured format. Survey research is usually a
quantitative method that requires standardized information in order to define or describe
variables, or to study relationships between variables. The information is gathered via a
sample, which is a fraction of the population. (Gimenez, 2005)

51
Case studies and surveys differ in the research purpose for which they are normally used.
Case studies are appropriate for exploring new areas of research, identifying key variables or
linkages between variables and generating hypotheses (theory building), because they
provide the type of knowledge that cannot be gathered purely from the statistical analysis
formatted questionnaires. Surveys instead are a very useful in the "hypotheses testing" stage
of theories developed in the previous stages of research. For these reason, they can be
considered as complementary tools. (Gimenez, 2005)
Forza (2002) explains in detail all the necessary steps and considerations to carry out a
survey research; Voss,Tsikriktsis and Frohlich (2002) did the same but for case study
research. Although both methodologies are complementary, but due to the number of
companies that will be contacted in the time frame for this research, it has been decided to
apply only case study research methodology, which still gives the opportunity to propose
hypotheses and test them. The sequence of steps to follow is show in Figure 9.

Figure 9. Case Research Scheme. Source: Based on Voss,Tsikriktsis and Frohlich (2002).
52

3.3. Application of Case Study Methodology
This section describes the steps taken to conduct this research based on the case study
methodology proposed by Voss,Tsikriktsis and Frohlich (2002).
3.3.1 Research Framework
This research was developed under the framework given by the U.S. textile and apparel
supply chain. It was desired to identify what are the relationships that yarn manufacturers and
the other components of the supply chain maintain and also determine how big is the lack of
communication that keeps yarn manufacturers far removed from the retailers, and what are
the variables that describe these dynamics.
Figure 10. Textile and Apparel Supply Chain.
By mapping the specification process across the supply chain and understanding the actual
business practices it was possible to identify what are the characteristics of the yarns and the
53

54
services that domestic yarn manufacturers should be providing in order to differentiate their
products from offshore sources and remain competitive.
3.3.2 Research Questions (Objectives)
Domestic yarn manufacturers must address the requirements of all the participants in the
textile and apparel supply chain in order to remain competitive and to differentiate their
products from offshore sources. The objective of this research was to better understand these
requirements through visits to companies, elaboration of case studies, discussions and
interviews with members of the supply chain.
Previous researches related to the competitiveness of U.S. textile and apparel industry
approached the problem from a business, marketing and supply chain point of view. (Allen,
2006; Berdine, 2007; Nowell, 2005; Cesca, 2005). In order to contribute to the
competitiveness of the U.S. textile and apparel industry, this research focused in two specific
areas within the supply chain: the yarn specification process and the performance metrics
used across the supply chain.
After defining the research framework and the results desired to be obtained from the
research, the following objectives were formulated:

55
• RO1. Map the yarn specification process across the supply chain.
• RO2. Identify yarn specifications considered important to yarn manufacturers, yarn
buyers and other participants of the supply chain.
• RO3. Identify current standard testing methods and equipment used to evaluate yarn
properties.
• RO4. Identify the most important yarn specifications as a function of the final
product.
• RO5. Identify performance metrics used by yarn manufacturers, yarn buyers and
other participants of the supply chain.
• RO6. Define “order qualifying and order winning criteria” for domestic yarn
manufacturers that will allow them to remain competitive and differentiate their
products from offshore sources.
• RO7. Evaluate existing product data management systems as to how they
incorporate yarn characteristics into designing the final product.
3.3.3 Choosing Cases
In order to guaranty the validity of the results and to avoid observer bias, companies from
most of the links of the supply chain were contacted. The main sources used included:
• Company members of the Institute of Textile Technology.
• Textile Connect directory: http://www.textileconnect.com
• Cotton Inc. directories:

56
• http://www.cottoninc.com/EFS/EFSSourcingDirectory/index.cfm?p=yarn
• http://www.cottoninc.com/EFS/EFSSourcingDirectory/index.cfm?p=fabric
• Cotton U.S. Sourcing Program: www.cottonusasourcing.com
• Davison's Textile Blue Book: http://www.textilebluebook.net
• Honduran Manufacturers Association
The selection of the companies was made based on the type of products they produce or
commercialize. Yarn manufacturers producing cotton and poly-cotton yarns were selected; as
well as manufacturers producing sewing thread, socks, and fabrics for jeans, t-shirts, and
sheets all made of cotton and poly-cotton blends. Garment manufacturing and retailers
producing and commercializing the products described were also included.
It was desired to incorporate in the sample companies that were in the same category but
aiming different markets. For example, a yarn manufacturer producing specialty yarns and
another producing commodity yarns. The purpose was to obtain disconfirming and
exceptional information that will cover different business practices. The same selection
criteria were applied for the retailers. Regarding the cut and sew companies, they were
contacted after talking to the retailers and researching directories to see if the ones chosen
where supplying to the retailers interviewed.
The geographical location of the companies was also considered during the selection; giving
priority to the ones located in North Carolina, South Carolina and Georgia, in order to make

57
easier the collection of data. It was necessary to conduct interviews by phone due to the
location of the retailers and the cut and sew companies.
3.3.4 Developing Research Instruments and Protocols
In case study research, the most common instruments to obtain data are structured interviews,
personal observation, informal conversations, attendance to conferences, surveys and review
of archival sources. Protocols include the instruments, procedures and rules necessary to
conduct the cases and also indicate where the information needs to be sought.
Voss,Tsikriktsis and Frohlich (2002).
Interviews were the instrument selected to gather data; a copy of the set of questions that
were used as guideline to conduct them can be found in Appendix D. All the questions
applied to yarn and fabric manufacturers. Some of them had to be ignored or modified when
interviewing other participants of the supply chain, and these modifications were taking into
account when analyzing the data.
Special care was put when wording the questions of the questionnaire so that the information
obtained were consistent with the respondent's level of understanding, not all the
interviewees were experts in yarn manufacturing. The correct formulation of the questions
can avoid getting unreliable and biased responses due to the lack of understanding or
misinterpretation.

58
The questionnaire contained open-ended questions (allows answering in any way chosen)
and closed question (limiting respondents to a choice among given alternatives). Once
formulated, a reiterative process of revisions and modifications occurred until professors and
industry people approved the final version of the questionnaire as the definitive to be used in
the interviews.
As per the protocol, the first approach to the selected companies was made by e-mail, giving
a brief explanation of the purpose and objectives of the research, as well as information about
the researcher and the university; it was believed that this could increase the confidence of
the interviewees on the project and obtain a higher response rate. After the first try by e-
mail, phone calls were made to confirm if the e-mail was received and to set an appointment
in case they wanted to participate in the research.
3.3.5 Conducting Field Research
As per the theory-building process presented by Handfield and Melnyk (1998), theory is the
vehicle that links data to knowledge; without theory, empirical research merely becomes
“data-dredging”; therefore the theory-building process serves to differentiate science from
common sense. Therefore the field research was conducted in two stages, the first one to
make the observations and not necessarily create hypothesis, but define the dynamics of the
textile and apparel supply chain and the yarn specification process. The interviews conducted
in the second stage helped to confirm the findings of the first stage.

59
Face to face interviews were conducted seeking out the person or group of persons who were
most knowledgeable about the areas researched. Usually the first person to be contacted was
the CEO or the manager of an area because they could open the doors within the
organization, provide enough support for the research and know who else to get involved.
Ideally a person representing one of the following areas participated: Merchandising,
Sourcing, Production, Quality Control, Product Development or Design.
In some cases interviews needed to be conducted by phone using the same guideline shown
in Appendix D.
As mentioned before, the interviews were conducted in two phases. In the first one, the
exploratory stage, sixteen companies/research organizations were interviewed to:
• Identify and define the variables to be studied.
• Postulate relationships amongst those variables.
• Justify the reasons why were those relationships presumed.
• Define the conditions or environment in which those relationships develop.
Phase two included another group of sixteen companies/research organizations, but this time
focusing in yarn manufacturers and fabric manufacturers, links where the yarn specifications
play a more important role.

60
3.3.6 Reliability and Validity in Case Research
The reliability and validity of the tools and procedures used to conduct the research were
evaluated after the interviews were conducted, keeping in mind that they should accomplish
the following requirements, explained by Voss,Tsikriktsis and Frohlich (2002).
Construct validity represents how adequate are the operational measurements selected for
the concepts being studied. Construct validity can be tested by:
• Observing whether predictions made about relationships to other variables are
confirmed.
• Using multiple sources of evidence, (similar results are evidence of convergent
validity).
• Seeing if a construct as measured can be differentiated from another, (evidence of
discriminant validity).
• Seeking triangulation that might strengthen construct validity.
Internal validity was dictated by how well can a casual relationship can be establish, and by
which certain conditions are shown to lead to other conditions, as distinguished from false
relationships. The key to establish internal validity is to understand what the theoretical
relationship is and why it happens and qualitative data often provides the answers. Multiple
cases have higher external validity than single cases.

61
External validity means whether the findings of a study can be generalized beyond the
immediate case study.
Reliability is the degree of confidence in obtaining the same results if the study is repeated
following the methodology use to conduct it.
3.3.7 Documentation and Coding
As part of the protocol, interviews were writing up as soon as possible after they were
conducted to maximize recall and facilitate follow-up and filling of gaps in the data. The
questions used as guidelines were formulated based on the research objectives. Therefore, the
answers obtained were grouped based on the objectives they covered. By comparing each
group with previous observations in the same category, it was possible to identify concepts,
relationships, trends and measures for future analysis.
3.3.8 Analysis
Initially, case studies were analyzed individually looking for answers to accomplish the
objectives and highlighting exceptional practices, understanding their role within the supply
chain and capturing the point of view of the company regarding yarn specifications.
Then companies were group according to the link of the supply chain that they belonged to,
comparing them to find similarities or differences within the group. Then an analysis
between groups was made, looking for a pattern, explanation and causality, and to draw valid
conclusions from it.

62
The second phase of interviews was conducted to verify the assumptions made based on the
results of the first phase.

4 RESULTS AND DISCUSSION
Case studies were conducted with the participation of machinery, yarn, fabric and apparel
manufacturers, as well as research and retail organizations. Both domestic and Latin
American companies were pursued; a total of 32 company interviews were conducted
involving 64 participants. The products investigated were denim, t-shirts, socks, sheets and
sewing thread made of cotton or poly-cotton blends.
Figure 11 shows the number of companies interviewed at each link of the textile and apparel
supply chain and Table 8 provides information about the interviewees and their main
activities.
Figure 11. Number of interviews in each link of the Textile and apparel supply chain.
63

Table 8. Description of companies selected for the case studies.
Machinery Manufacturers Description
MM1 Manufacturer of fiber preparation, carding and drawing equipment.
MM2 Manufacturer of weaving machines and accessories, winders for spinning, electronic boards, full fashion and technical textiles knitting machines.
MM3 Manufacturer of novel spinning technology. MM4 Manufacturer of electronics for quality control for the textile industry. Yarn
Manufacturers Description
YM1
Manufacturers of fine-count, combed yarns made from extra long staple cotton. They use exclusively American Supima®-Cotton. Their yarns are sold in 15 countries, mainly in NAFTA-countries, Central- and South America and Singapore. They aim a high end, specialty market.
YM2
One of the largest yarn manufacturers in the U.S. They produce cotton, polyester and blends spun yarns for weaving, knitting, hosiery, industrial, military and home furnishing markets. They have manage do develop manufacturing processes and engineer yarns that allow them to produce the widest range of yarn counts in the market and specialty fibers.
YM3
Producers of ring spun specialty yarns. Combed cotton heather yarns remain the significant product; however they also offer novelty yarns and yarns of various fibers, including rayon and polyester.
YM4
Producers of cotton, synthetic and blended yarns manufactured both in ring, and open-end spinning systems. Plied yarns are available in the full count range and in both spinning types. Slub yarns, nub yarns and core spun yarns are also available.
YM5
Producers of long staple worsted, short staple open end, short staple and air-jet spun yarns. They are especially known for their dyed acrylic yarns, but they can also spin yarns and blends made from polyester, rayon, wool, and specialty performance fibers. The person contacted had previous experiences in cotton yarns manufacturing.
Fabric Manufacturers
Description
FM1
Leading supplier of denim to top denim apparel brands. Operates in the US, Mexico, Turkey and India. Expansion initiatives are underway in Central America and China to provide broader service and flexibility to customers worldwide.
64

Table 8 (continued)
FM2 Textile manufacturer of woven cotton, poly/cotton, polyester and various blended greige goods.
FM3 Textile manufacturing company. Dobby and plain woven greige fabrics for apparel, furnishing and industrial applications, from cotton and poly-cotton blends.
FM4 Contract knitter.
FM5
One of the world's largest manufacturers of thread and yarns for apparel, non apparel, embroidery, and technical textile applications as well as for the consumer distributor market. Their manufacturing and service centers are located within 50 countries. Although they are embroidery thread manufacturers, they were placed in this category because their products are intermediate products, used to make the products selected for the research.
Cut and Sew Description
CS1 Bolivian vertically integrated company, from yarn to garment. Offering apparel full package services for knit products for U.S., Argentinean, Brazilian and Spanish retailers.
CS2 Honduran vertically integrated company, from fabric to garment. Offering apparel full package services for knit products for U.S. retailers.
CS3 Mexican vertically integrated company, from yarn to garment. Offering apparel full package services for knit and woven products for their own brands and U.S. retailers.
Finishing & Dyeing Description
FF1
Small lots color development, dyeing and finishing services, including full package custom color standards. Wet finish development (enzymes, stones, bleaching, softeners), garment dyeing and finishing techniques.
Retailers Description
RR1
Company whose wholesale and retailer business consists of the design, sourcing, marketing and distribution of their collection brands and also has licensing business of product, international and home licensing activities.
RR2
Specialty retailer of casual apparel for men, women, and kids. Its stores offer casual sportswear apparel, including knits and wovens as well as personal care products and accessories. They operate stores in the United States, Canada, and the United Kingdom. Also sells its products through Web-based stores, as well as through a catalogue.
65

66
Table 8 (continued)
RR3
Retailer that operates across the country specialized in an extensive collection of bras, panties, sleepwear, hosiery and more. The catalog and direct (.com) division reaches more than 390 million customers each year through their web site, which is one of the fastest growing and profitable e-commerce destinations on the Internet.
RR4
Consultant and free lance to apparel industry with years of experience in pre-production technical design issues, training in garment fit and sizing, pattern drafting and grading, client-factory liaison and factory review.
RR5 Apparel agent for retailers RR1 and RR2 of this group.
RR6 One of the world's largest specialty retailers. They operate four of the most recognized apparel brands in the world. They consume 1% of the world’s cotton crops.
RR7
Direct merchant work directly with mills and manufacturers, eliminating the markups of middlemen. Their products are traditionally styled clothing for the family, soft luggage, and products for the home. They offer products through catalogs, on the Internet and in their Inlet stores.
RR8 Retailer that operates in the United States and Puerto Rico, one of the largest apparel and home furnishing sites on the Internet, and the nation's largest general merchandise catalog business in 2007.
Research & Development
Centers Description
RS1
Research organization focused to promote cotton applications. From agricultural, fiber and textile research, market information and technical services, to advertising and public relations, fashion forecasts and retail promotions.
RS2
World's leading not-for-profit professional association for the textile design, materials, processing, and testing industries. Promotes application of colorants, chemicals, and polymers in the Textile Industry.
RS3 A recognized provider of solutions for the sewn products and related soft goods industries specializing in technology development and supply chain improvement
RS4
Research organization assisting the hosiery industry to compete in a global environment through training, R & D, testing, E-commerce and new product development.

67
Table 8 (continued)
RS5
Research organization that offers centralized technical support , helps textile companies to remain competitive, manufacture quality products, and maintain a well-trained workforce by providing testing services, product prototyping, and sample production in several areas.
RS6
Company that delivers technology solutions to the textile industry and is committed to provide software and services that enable customers to save money by streamlining their R&D processes and make money by bringing better products to market faster.
The information collected during the interviews as well as the corresponding analyses are
presented in this chapter in the following five sections:
Yarn Specification Process: describes the interaction between the links composing the
supply chain, the steps taken and considerations made at each link regarding product
specification and identifies the stage where yarn specifications are generated. The questions
of the questionnaire in Appendix D that apply to this section are: 1,2,7,10 and 11.
• Yarn Specifications and Standard Testing Methods: summarizes the yarn
specifications most frequently used across the supply chain, the application and
importance given to them at each link, and the equipment and standard methods used
to test them. It also provides the most important yarn specifications to be considered
as a function of the type of product and its final use. The results and the analysis
presented in this section correspond to the answers obtained for questions 3 to 12 of
the questionnaire.

68
• Order Winning Criteria and Performance Metrics: identifies what are the criteria
used to select suppliers, what are the performance metrics used to evaluate them and
how can they be used for product differentiation purposes. Questions 13, 14,15,16
and 17 applied to this section.
• Product Data Management: identifies the software and tools available across the
supply chain to manage product data, and shows how they incorporate yarn
characteristics into the design of the final product. Questions 11 and 12 are related to
this section.
• Business Practices: is a summary of examples discussed with yarn manufacturers
and feedback from fabrication and retail levels, about practices which appear to drive
success for yarn manufacturers and bring them closer to the retailers.
4.1. Yarn Specification Process
The product specification process starts at the retailer’s end. Six retailers, one agent and one
apparel consultant (n=8) were interviewed. Four of them described their procedures to define
what are the styles selected for a specific season, how are the fabrics and colors selected,
their product development process an how they go from the design to the productions stage.

69
Figure 12. Retailer’s Product Specification Process. Source: Courtesy Parametric Technology Corporation (www.ptc.com)

70
In order to control the design, product development and production stages, these companies
use specialized product data management (PDM) or product lifecycle management software
(PLM). Conversations with a supplier of a fifth retailer interviewed, confirmed that this
retailer uses PDM software too.
There are many software companies offering PLM and PDM packages for the apparel
industry, Apparel Magazine published in May 2007 a complete report ranking different
PLM/Product Development software providers. Parametric Technology Corporation (PTC) is
one of the companies offering PLM software, Figure 12 shows the sequence of the steps
taken into account when developing an apparel product and matches the description of the
process explained by the four retailers.
Business plans are formulated at the seasonal concept stage considering brand placement,
target markets, financial goals, sales and production strategies, government and trade
regulations. Within this framework, designers, merchandisers and product development
teams will research and identify the concepts, colors, materials and silhouettes necessary to
support the business plans.
For this research, designers attend yarn and fabric trade shows to identify trends. Retailer
RR2 not only sends their associates to the shows but also promote visits to the mills of their
suppliers for designers and product development teams, they even invite mills to show their
products and this way RR2 can identify new fabrications and on site developments.

The line development stage is where specific actions are taken to accomplish the business
plans. Merchandising plans will bring specific numbers for sale price, production volumes
and cost, demand forecasts, etc.
Systems to track the products at subsequent stages will be designed to accomplish the goals
in a defined timeframe. The styles to conform a fashion line will be selected as well as the
materials they will be made of. Fabric and yarn findings of the design and product
development teams are brought together to prioritized and defined core fabrics, their specific
attributes and esthetics so that the product development team has clear interpretation of the
designer’s wishes.
Figure 13 shows the fabric characteristics that designers evaluate when selecting fabrics. The
results were gathered from the interviews conducted at the retailer stage (n=8).
DESIGNERS CONSIDERATIONS WHEN EVALUATING FABRICS
0 1 2 3 4 5 6 7 8
Color
Drape
Fiber Content
Price
Weight
Hand
Looks
Figure 13. Fabric characteristics consider by designers when selecting fabrics.
71

72
More specific fabric and yarn characteristics start being defined at the style definition and
sourcing/costing stages, where an iterative process of sample submits between the retailer
and the vendors, as well as comments and modifications occur previous to the final approval
for production regarding product looks, construction, fabrics, trims, colors, measurements,
fit, labels and packing. This approval process was also described by the cut and sew
companies interviewed (CS1, CS2, CS3). Sourcing, merchandising and product development
teams discuss key vendors for specific allocation of fabric development and production.
The product development teams of the six retailers interviewed communicate the product
specifications to their vendors or suppliers, by means of a document called tech. pack. An
example of fabric and sewing thread specifications for a jersey t-shirt is shown in Figure 14,
provided by retailer RR2. Retailers RR1, RR2 and RR3, have similar technical packages
because all three use the same PDM software. In this example the selected fabric was
developed and approved in a previous season and pulled from the company’s records to be
used in the present season, therefore the yarn characteristics specified are: yarn count, fiber
content and yarn type (spinning system).
Ideally, when a new fabric needs to be developed, a swatch and a specification sheet are sent
to the garment suppliers known also as vendor or CMT companies (Cut-Make-Trim). Three
CMT companies were interviewed; all three located outside the U.S. supplying to some of
the retailers previously mentioned and all three vertically integrated (CS1, CS2 and CS3).

73
Two of them manufacture from the yarn to the final product, the third one buys yarn from
U.S. manufacturers to make their own fabric, cut and sew it. Vendors CS1 and CS2
commented that most of the time, they will get a fabric swatch only. Figure 15, is an example
of a fabric specification sheet, it was provided by vendor CS1.
Once the technical packages are completed, and the merchandisers have decided the price
they are willing to pay per garment and how many they want to produce; the sourcing
department will send this information to either their agents or directly to their key vendors to
obtain quotes. Four of the retailers interviewed contact the vendors directly and the other two
through agents (RR1 and RR2).
Retailers refer as an agent: to the company that acts as a mediator between them and the
vendor. Vendor: is the company in charge of manufacturing the garments and mills: are the
factories manufacturing fabrics or yarns.
The retailers that use agents’ services (RR1 and RR2) indicated that it makes it easier for
them to obtain the goods so they can focus on design, brand management and merchandising
areas, and that agents have better structured supply chains. The retailer will buy the garments
from the agent and the agent is responsible for quality and delivery issues. Agents do not
own the production either, the receive a commission from the vendor and make money
selling the garments to the retailers, so whenever they are charged back they just charge back
the vendor.
.

Figure 14. Fabric and sewing thread specifications. Source: Company RR2
74

75
Figure 15. . Fabric specifications sheet. Source: Company CS1.

76
On the other hand, retailers that contact vendors directly commented that it gives them more
control over the production stages; they save money by avoiding the agent’s fees, and it
allows them to better control and negotiate prices; it also requires a developed quality
assurance program on the retailer’s side
As seen in Figures 14 and 15, at the retailer’s level, the product specifications focus on the
fabric characteristics rather than the yarn characteristics. Retailers RR1, RR3, RR6 and RR8
explained that if they request other specific yarn characteristics, it would be when they are re-
sourcing the fabric with alternate sources to duplicate the quality of the existing source. They
normally do not get into highly detailed specifications as hairiness, twist multiples, staple
length, tensile strength as they rely on the fabric development testing and garment testing to
gauge the results of the performance of the fabric. If the fabric passes all of the standard
fabric testing such as pilling after laundering, random tumble pilling, appearance retention
after launderings, etc.; they know that the overall quality of the yarn that was used was
sufficient or exceeded their requirements for quality standards for their consumers. They will
get in contact with the mills only if there is a quality problem that needs to be investigated.
Retailer RR4 commented that for products aiming niche markets, made of special and
expensive materials they will specified in much more detail, but for cotton and poly-cotton,
considered commodity items, they have several suppliers for the same product, quality is
assumed and other are the factors influencing the supplier selection.

77
The majority of the retailers commented that when they tried to specified commodity yarns in
more detail, they have received complaints from their vendors indicating that that was
decreasing their flexibility, forcing them to buy yarn from a source that was not as efficient
as their already established suppliers.
Vendors are the owners of the final product; they are in charge of looking for fabric suppliers
based in the specifications received form the retailers or agents. The three vendors
interviewed are vertically integrated. Two of them manufacture from the yarn to the final
product, the third one buys yarn from U.S. manufacturers to make their own fabric, cut and
sew it.
Having all the manufacturing processes integrated allows these companies to develop the
fabrics based on the specifications received from their customers, and also considering the
requirements of the manufacturing processes. Their product development teams coordinate
with the manufacturing areas things like the type of fabric dye required for special printing
techniques, or to obtain specific distressed looks; the type of feel hand the customer wants,
etc.
The responsibility of translating these requirements into fabric and yarn characteristics relays
on the fabric and yarn manufacturing areas. When the fabric requires to be made of specialty
yarns like very fine or coarse counts, special blends, slub patterned, heathers, or made of
special fibers; they source the yarn externally, in some cases from U.S. yarn manufacturers.

78
When the vendor is not vertically integrated they will pass the fabric specification sheet
directly to the fabric manufacturers they work with. Four fabric and one sewing thread
domestic manufacturers were interviewed at this stage. The denim and the sewing thread
manufacturers make products for most of the retailers previously interviewed, two of them
make fabric for bedding and bottoms and the last one is a knitting contractor; covering all the
products selected for the research.
Four of the companies interviewed at this stage make their own yarn, and they also buy yarn
from domestic yarn manufacturers when either they can not cover their own demand or when
they do not have the equipment to manufacture it themselves. Once again, fabric and yarn
manufacturers are responsible of specifying the yarn characteristics relays on the fabric and
yarn manufacturers.
It was observed during the visits to the plants of some of the companies and the R&D
departments of some retailers (FM1, CS1, RR1 and RR3) that most of the time fabrics are
submitted in garment for approval, allowing the designers to evaluate the look, hand and
distress effects in the final product. Simultaneously a fabric hanger and a spec sheet are sent.
The yarn specifications provided for the products selected for this research are basically the
same: count, type and content for the fabric yarns and specific codes indicating the supplier
for the sewing thread as shown previously in Figure 13. Detailed yarn characteristics such as
Uster % CV, hairiness, tensile and elongation properties remain recorded in the libraries and
data management systems of the yarn manufacturers.

79
Special notes must be made for denim fabrics and sewing thread. In both cases the retailers
nominate the supplier in the technical package. The fabric manufacturer FM1, indicated that
actual fashion trends required engineered design of denim fabrics, specific slub patterns
(width, length and frequency) on filling and warp yarns give a specific character to a fabric;
usually customized for every brand or retailer, therefore specific fabric codes are specified in
the technical packages.
The importance of the look of the fabric has brought together designers, fabric and yarn
manufacturers into the development process, and the yarn characteristics specified in this
case are pretty detailed.
The sewing thread manufacturer (FM5) has developed a program to work with the designers
to help them understand the properties of the sewing threads and how to select the best one as
a function of the final product. With so much production made in Asia, if the sewing thread
type and the composition is not specified, vendors automatically order spun polyester,
because is cheaper and shinier, but this is not the optimum yarn for all fabrics and sewing and
embroidery machines. Therefore, besides the color, the specific type and manufacturer code
needs to be specified.
Three of the yarn manufacturers that participated in the research (YM1, YM3 and YM4)
produce specialty yarns, YM2 is considered a large cotton yarn manufacturer and YM5 is
recognized for its synthetic yarns. The three specialty yarn manufacturers maintain a closer

80
relationship with the retailers compared to the other two; they contact them directly and
occasionally will participate in the development process.
Interviewees representing the five companies in the group of fabric manufacturers said that
they are knowledgeable enough to specify detailed yarn characteristics. The interviews with
the yarn manufacturers confirmed that there are still some other fabric manufacturers that
need their technical advice defining the best suitable yarn characteristics for their products.
Based on experience, yarn manufacturers YM1 and YM5 will select the most appropriate
yarn for a specific application and send a first sample shipment to their clients, then, a fine-
tuning process will occur until the customer feels comfortable with the results. At this point
the yarn specs will be set. Figure 16 shows the most complete specification sheet obtained
from the interviews to the companies at this stage.
Machinery manufacturers (MM1 and MM3) think that yarn specifications are important to
design the machines and define the operation settings. They work together with yarn
manufacturers and fiber suppliers in the presentation of new fibers or cotton varieties and
their application on final products.
Presently only a few fabric and yarn manufacturers can afford a Research and Development
department. Yarn, machinery and fiber manufacturers use three of the research organizations
interviewed to develop new products and to learn about machinery settings, product
performance and specifications, and testing.

81
Figure 16. Yarn specifications. Source: Company FM1.

82
These three research organizations have fully equipped textile laboratories and companies
use that service mainly to control the quality of the products they are receiving from their
suppliers.
Research organizations act like a liaison between the textile manufacturing side of the supply
chain and the retailers. RS1 for example helps textile manufacturers to find the best final
application for their new developments and how to present it to their customers. For some
socks manufacturers working with the organization RS4 has been the only way to reach
retailers and a good way to have access to latest technology and training. The interviewee at
RS4, indicated that retailers highly appreciate the impartiality of these organizations, that is
why they will come to them when looking for new suppliers or evaluating actual ones. From
the point of view of the retailers interviewed, they based their quality standards on those
developed by the organization RS2 and apply some business and manufacturing models
developed by RS3.
4.2. Yarn Specifications and Standard Testing Methods
All case study participants were asked to indicate what where the yarn characteristics
frequently specified in the industry when either sourcing or selling yarns. Figure 17 shows
the number of responses obtained for each yarn characteristic. Absolutely all the companies
interviewed (n=32) indicated yarn count, fiber content and yarn type (ring spun, open end, air
jet, combed or carded). At the retailer side as well as at one of the research organization these
were the only three mentioned.

83
After identifying the yarn characteristics most frequently specified, the testing methods and
equipment used to measure them were investigated. At the retail level, the majority of their
testing and verification is done in garment or finished fabric. All six retailers request their
suppliers to send the samples from product development and production to designated
independent laboratories.
The laboratories test the fabrics under the specifications requested by the retailers and sent a
testing report to the retailer and the supplier. Five of them use AATCC standards testing
methods and one of them is switching to ISO because is more convenient for their suppliers
offshore. All six use the service of one of the laboratories mentioned.
Two retailers shared examples of suppliers that have been working with them for years, and
in order to speed up the testing process, the retailer has certified the supplier’s testing
laboratory.
The interview with the research organization RS4, revealed that in the hosiery industry,
AATCC, ASTM and ISO standards are used, but in many cases only as references.
Traditional testing methods needed to be modified due to the size of the hosiery products, the
number of fiber types, blends and the different fabric structures used to make a sock. A
hosiery consortium of hosiery manufacturers, suppliers, retailers, testing labs, North Carolina
State University College of Textiles, the North Carolina Manufacturing Extension
Partnership (NCMEP), the Carolina Hosiery Association (CHA), The Hosiery Association

(THA), The American Association of Textile Chemists and Colorists (AATCC) and The
Hosiery Technology Center (HTC) worked to establish standard methods for testing fit,
abrasion and colorfastness of hosiery products.
YARN CHARACTERISTICS FREQUENTLY SPECIFIED ACROSS THE SUPPLY CHAIN
0 1 2 3 4 5 6 7 8 9 10 11 12 13 14 15 16 17 18 19 20 21 22 23 24 25 26 27 28 29 30 31 32
Polyester Elongation
Organic
Navel Type (Rotor Spinning)
Moisture Content
Lot Identification
Density of Cone
Fiber Micronaire
Slub Pattern
Price
Lead Time
Friction Coefficient
# Splices
Hairiness
Elongation
Color
# Neps
Cone Size/Presentation
Finish (wax or others)
Evenness
Strength
Twist
Type
Count
Content
Figure 17.Yarn characteristics frequently specified across the supply chain. Sample size n=32.
84
85
An example of the page that includes yarn specifications in a typical fabric testing report sent
to retailers is shown in Figure 18, it was provided by retailer RR2 and it was found that RR1,
RR2, RR3 and RR6 receive similar reports. It can be observed the yarn count and fiber
content are the only two characteristics tested for yarns.
Although retailers RR2 and RR8 have the capability of testing basic yarn characteristics at
their facilities, and all the others can do it at external laboratories, they normally do not do
yarn testing. Based on the interviews and visits to companies it was observed that yarn
manufacturers do the majority of the yarn testing (not machinery of fabric manufacturers)
because they have the equipment and it is usually updated. Buying this equipment is too
expensive and not that necessary for the fabric manufacturers. They rely on information from
the key mills that furnish all pertinent yarn specification information. Detailed yarn
specifications like CV%, strength, evenness, etc, are requested only if there is a quality
problem or because they want to reproduce the product in other factories and make the
product to look the same in the shelves at the stores.

86
Figure 18. Example of yarn characteristics included in a fabric testing report sent to retailers. Source: RR2.

87
Product development teams at the retailer level recognize the influence of yarn specifications
in the quality of their products. RR1, RR3 and RR6, commented that not everything depends
on the yarn, there are other processes in between that will affect the quality and the esthetics
of the fabrics. Finishes process can modify the looks, durability and other properties of the
fabrics. In some cases yarn quality issues can be covered by an appropriate finish and in
other an inadequate finish can decrease the strength and performance of the yarn and the
fabric. At the end, retailers would care about the overall performance of the final products.
The vertically integrated vendors and fabric manufacturers interviewed, have fully equipped
laboratories able to measure any type of yarn characteristic. The contractor knitter
interviewed is the only one that outsources testing services.
The thirteen companies from the yarn, fabric and cut and sew links were asked to list the yarn
characteristic they measure, the standard testing method and the equipment they use for
testing. Seven of them responded and all confirmed to be using ASTM standards. Six of them
failed to identify specific ASTM standard testing methods although they test the same yarn
properties tested by the seventh company. They mentioned several Uster® indicators and
measurement parameters considered as standards for them.
The summary of the answers are in Table 9. Although more than one machine was mentioned
to measure the same yarn characteristic, it is noticeable that Uster ® equipment is used in the
majority of the plants. Methods and equipment used to test yarns are relatively standard for
both domestic and international companies.

88
Table 9.Yarn properties and equipment used for testing. Yarn Characteristic Equipment N=7
Single end Tensile Strength & Elongation Instron 1
Single end Tensile Strength & Elongation Textechno Statimat-M 1
Single end Tensile Strength & Elongation Uster Tensojet 4
Single end Tensile Strength & Elongation CV% Uster Tensojet 3
Skein Break Scott Tester 3
Yarn Twist Mesdan Twistmatic 4
Friction (Yarn to Metal) Lawson-Hemphill Friction
Tester
2
Friction (Yarn to Metal) Mesdan Friction Meter 1
Identification of Periodic Mass & Hairiness
Defects
DS65 ILE tester 1
Identification of Periodic Mass & Hairiness
Defects
Uster Tester 3 2
Identification of Periodic Mass & Hairiness
Defects
Uster Tester 4 2
Yarn Appearance Board 1
Yarn Evenness DS65 ILE tester 1
Yarn Evenness Uster Tester 3 2
Yarn Evenness Uster Tester 4 2
Yarn Hairiness Uster Tester 3 2
Yarn Hairiness Uster Tester 4 2
Yarn Mass CV% DS65 ILE tester 1
Yarn Mass CV% Uster Tester 4 1
Yarn Count Scale 3
Yarn Count Uster Tester 3 2
Yarn Count CV% Uster Tester 4 1
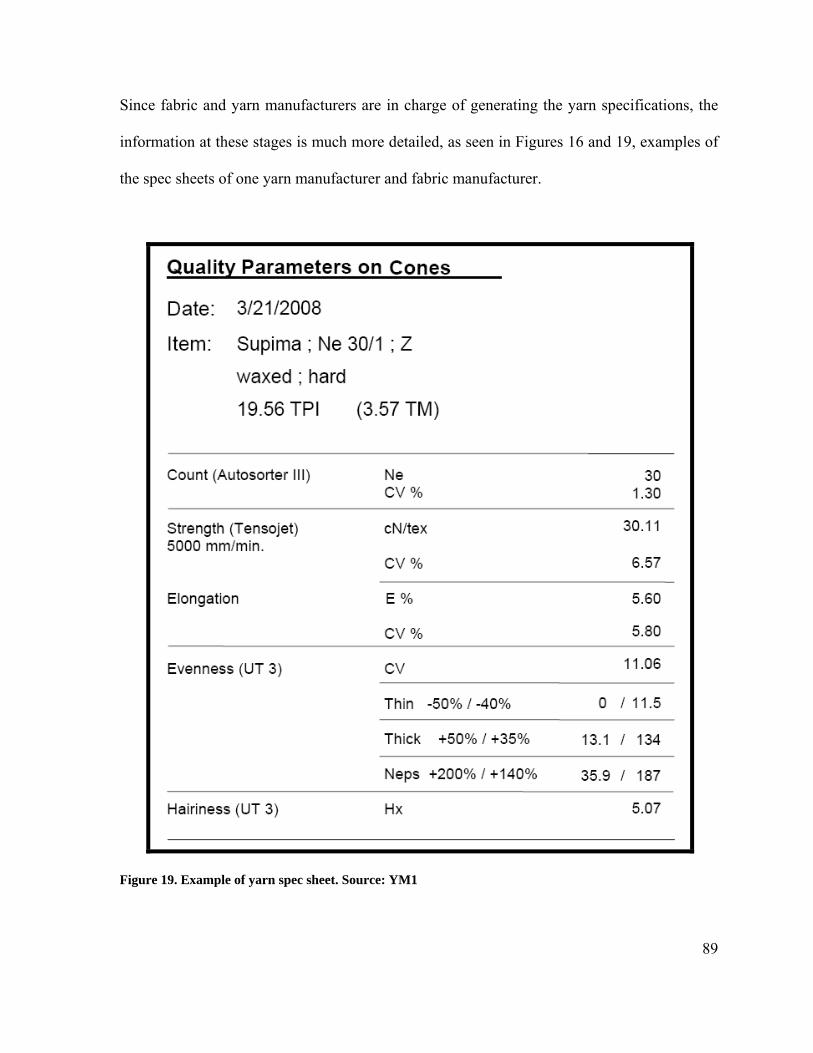
Since fabric and yarn manufacturers are in charge of generating the yarn specifications, the
information at these stages is much more detailed, as seen in Figures 16 and 19, examples of
the spec sheets of one yarn manufacturer and fabric manufacturer.
Figure 19. Example of yarn spec sheet. Source: YM1
89

90
Additionally, companies were asked to identify what where the most important yarn
specifications they would consider for specific applications. The following tables summarize
the answers of yarn and fabric manufacturers regarding denim and t-shirts.
Table 10.Important yarn specifications for denim. Yarn Specification FM=1 YM = 5
Strength 1 3 Count 1 2 Runability 1 2 Slub Pattern 1 2 Consistency 1 1 OCV% 1 1 Mentioned by FM, omitted by YMs: Cost 1 0 Delivery 1 0 Size 1 0 Twist 1 0 Important from the point of view of YMs, no relevant for FMs: Hairiness 0 1 Evenness 0 3 Table 11.Important yarn specifications for t-shirts.
Yarn Property FM = 4 YM = 5Count 3 2 Finish (wax, PFD) 3 1 Twist 3 1 Evenness 1 2 Strength 1 2 Fiber Content 1 1 Mentioned by FMs, omitted by YMs: Cost 2 0 Delivery Time 2 0 Yarn Type 2 0 Mass CV% 1 0 Important from the point of view of YMs, no relevant for FMs: # Neps 0 1 Coefficient friction 0 1 Dyeability 0 1 Elongation 0 1

91
Tables 10 and 11 show how yarn and fabric manufacturers differ in their appreciation of yarn
characteristics, there is also difference among the yarn manufacturers, that is why some
characteristics were mentioned only by one of the five yarn manufacturers interviewed.
In Table 10 for example, only three of the five yarn manufacturers agreed that strength was
important and then the other characteristics where mentioned by two or even only one yarn
manufacturer. There are also yarn characteristics that the denim manufacturer considers
important but were not mentioned by any of the yarn manufactures. Finally, three of the five
manufacturers indicated that evenness is very important, but is not for the denim
manufacturer. In the case of t-shirts something similar happens. Not enough answers for
socks, sheets and sewing thread were obtained to allow a comparison.
From additional comments made by fabric manufacturers (FM2, FM3, FM4, and CS1)
during the interviews it was observed that yarn used in commodity products is easy to obtain,
they just call a supplier, request yarn indicating the count, the content and the type. Yarn
needs to be of a quality that allows machines to run at good efficiency levels, and have a
good price.
Runability is the result of several yarn characteristics; it is difficult to define which one is the
most important without making trials in production. Yarns do not need to be perfect, a
smoother yarn is good but evenness is not the only characteristic that will contribute to the
runability.
92
Three of the five yarn manufactures (YM1, YM2, and YM5) as well as fabric manufacturers
FM2 and the vendor CS1 were concerned about the consistency of the product. The break
strength and consistency between lot and lot are critical factors. CV% values, IPI, hairiness
and other detailed yarn characteristics, are usually tested at the fabric manufacturing stage
when there are quality problems or when the supplier is new. These three yarn manufacturers
are required to send the yarn certifying the quality and the change of lots if necessary, but the
main testing points for yarns are the looms and knitting machines.
From the interviews with the yarn manufacturers, it was observed that detailed yarn
specifications are used for internal controls only. Their testing data is recorded and the
systems used to manage it allow yarn manufacturers to track a problem and identify
specifically the part of the processes where it was originated. Variations in the yarn
characteristics may not cause a quality problem to the customer but can cause operational
problems at the mill. These data is use for optimization of opening, carding, drawing and
spinning machines.
One of the yarn manufacturers (YM1) indicated that one of their customers, a large retailer,
will specify in detail the yarn characteristics, will test and monitor every single property and
offer a quick feedback; maybe not knowing exactly how those characteristics affect the fabric
but using the data to control the consistency of the supplier.
In the case of poly-cotton blends, they are usually a bit more detailed because they include
luster level and tenacity.

93
A executive interviewed at the organizations RS1, commented that fabric and yarn
manufacturers understand that the important yarn characteristics to specify are those that will
influence the look and hand feel of the fabric; they also know that the evaluation of these
characteristics can be very subjective, and specifications are necessary to remove the
subjective aspect when evaluating a yarns.
Based on the answers given by retailers RR1, RR2, RR3 and RR4, a retailer will give yarn
specifications only if they want to assure the consistency of their products. These
specifications were generated at the mill that got approved as a fabric supplier, and that after
negotiations decided to supply a complete program, in that case they need to provide yarn
specifications that the retailer will use as their standard and run periodical tests (usually twice
a year) to check the consistency of the product. This is common for core fabrics (those that
are part of the collection, season after season), for fashion items, they will not do it.
4.3. Order Wining Criteria and Performance Metrics
Once it was determine what links of the supply chain are in charge of generating the
specifications and which specifications are the most important to be considered, it was
necessary to study how can we use this information to help yarn manufacturers to remain
competitive and differentiate their products from offshore sources.

All thirty two companies were asked to indicate what were the criteria used to select
suppliers. Seventeen companies answered, revealing that quality was the most important
factor, followed by price and delivery (Figure 20).
CRITERIA USED TO SELECT SUPPLIERS
0% 10% 20% 30% 40% 50% 60% 70%
Export Capabilities
Flexibility
Technology and Skills
Reputation
Responsiveness
Value
Versatility
Innovation
Integrity/Ethics
Location
Consistency
Financial Stability
Availability
Capacity
Relationship
Delivery
Price
Quality
Figure 20. Criteria used to select suppliers across the supply chain. (n=17). 94

95
Note that quality and consistence are the only two aspects related to product characteristics;
the others involve logistics and business related practices.
From the visits and interviews it was observed that Quality is assumed if you are in business
today. Without the right quality, price is of no consequence. Successful companies have been
able to achieve their own standards, the ones required as a function of the end use of the
product, at the lowest cost possible. Quality is not always evaluated based on a specification
sheet or a testing report, instead, the accumulation of positive results from previous
experiences with the supplier. Retailer RR1 believes that degree of development of the
quality program or the quality controls at a yarn mill reflects the quality of the product and
this is something that they consider very important when selecting suppliers. If retailer RR2
decides to run a core fabric in big volumes, they request the vendor to tell them who is the
yarn supplier and then they will go to evaluate their facilities and their quality program.
Regarding price, it is not just about the yarn price, it is about the yarn price and the finished
fabric price. For retailers, to simply look at the yarn price, over simplifies the study. They
really have to look at the entire supply chain of a specific garment program before they
commit to yarn/fabric for any order. A yarn supplier might be the lowest priced, but if the
price of the finished fabric is too high due to mill inefficiency or cross regional duties then
the spinner loses the order. Most of the interviewees commented that they will look for low
prices without compromising the quality; that prices need to be competitive but not the
cheapest.

96
Retailers RR2 and RR6 commented that Delivery issues are more serious than performance
issues when deciding when to stop working with a supplier. Lead times and the capability of
meeting quoted delivery dates and volumes are highly appreciated and monitored.
When there is a collaborative relationship between supplier and buyer, problems like late
delivery can be forgiven according to retailer RR6. Vendors and retailers appreciate
companies that can offer technical advise not only about their expertise in a specific process,
but that understand and help them understand who yarn characteristics can help to prevent
problems in subsequent process.
Five of the six retailers interviewed mentioned that a vendor needs to assure the retailer that
the volumes they can produce are enough to cover a complete program. This is critical for the
commodity core products discussed in this research; this is why capacity is important when
selecting suppliers. Large companies can offer economies of scale and usually keep their
machinery and technology updated. Retailer RR6 mentioned several examples of dropping
off suppliers because they were overbooked or did not have the technical skills to make a
good product. Capacity is related to the financial stability of the supplier, customers keep in
mind if the supplier is able to obtain credit to buy raw materials and delivery order on time.
Availability is the key to generate continued sales according to yarn manufacturer YM2 and
vendor CS3; the more places people can buy your products, the more sales you'll make.
Availability is limited in the U.S. because they are only a few companies left making the
products selected for this research.
97
Yarn manufacturer YM2 sustains that making commodity yarns is not a secret; anybody can
do it in any place in the world. Consistency in the quality of the product as well as on the
delivery times and prices is what differentiate yarn suppliers.
Finally, only one yarn manufacturer (YM2) and absolutely all the retailers commented that
they consider location as an advantage. A yarn manufacturer would ideally have to be close
or within the same region as the fabric manufacturer. Likewise, one would want the fabric
mill ideally in the same region as the cut/sew partner.
Since this research focuses in domestic yarn manufacturers, the criteria to select suppliers
across the supply chain (n=32) was compared to the criteria that fabric manufacturers used to
select yarn suppliers (n=5) (Figure 21). It is observed that fabric manufacturers appreciate the
following criteria more than the overall supply: Quality, Delivery, Relationship, Availability,
Consistency, Reputation and Flexibility.

FABRIC MANUFACTURERS CRITERIA TO SELECT SUPPLIERS
0% 20% 40% 60% 80% 100%
Export Capabilities
Flexibility
Technology and Skills
Reputation
Responsiveness
Value
Versatility
Innovation
Integrity/Ethics
Location
Consistency
Financial Stability
Availability
Capacity
Relationship
Delivery
Price
Quality
FMSupply Chain
Figure 21. Fabric manufacturers' criteria to select suppliers.
To be able to determine if yarn manufacturers are aiming their efforts in the right direction
they were asked to indicate why they think they have been chosen as suppliers.
98

The answers were compared to the fabric manufacturers’ answers regarding the criteria they
use to select suppliers. Note the difference on the areas of focus between yarn and fabric
manufacturers. (Figure 22) Remember that this is a comparison between the answers of the
five yarn manufacturers interviewed and the five fabric manufacturers. It can be observed
that technical support and reputation are considered as a business strength by yarn
manufacturers, but they are not appreciated in the same way by fabric manufacturers.
FM: WHAT CRITERIA DO YOU USE TO SELECT SUPPLIERS? YM: WHY DO YOU THINK YOU WERE SELECTED AS A SUPPLIER?
0% 20% 40% 60% 80% 100%
Responsiviness
Technical Support
Capacity
Flexibility
Innovation
Integrity/Ethics
Reputation
Consistency
Financial Stability
Availability
Relationship
Delivery
Price
Quality
REASONS WHY YM THINK THEYARE CHOSENCRITERIA THAT FM USE TOSELECT SUPPLIERS
YM FOCUS
FM FOCUS
Figure 22. Supplier selection criteria across the supply chain.
99

100
Once the criteria to select suppliers were defined, the next question to be answered was how
are they evaluating their suppliers? What indicators do they use? Are there any performance
metrics systems being used?
Literature findings indicated suggestions made to manufacturing companies about putting
more much emphasis on non-financial measures in comparison to financial measures in their
performance measurement system, have not been followed. That net profit, gross profit
margin, total sales department, amount of raw material inventory, cost per unit produce and
others represented the first eleven measures mentioned by the companies. (Gosselin, 2005).
According to the findings of this research this is not the case when it comes to evaluate
suppliers. For this evaluation, time related indicators are the most used. Ten of the thirty-two
companies contacted answered this question. Four of the six responses to “meeting quoted
delivery dates” were given by fabric manufacturers and a vertically integrated vendor. Only
one retailer and one yarn manufacturer mentioned to use this performance indicator.
Based on the answers obtained, it was noticed that companies are missing structured
performance metrics systems. Different responses were obtained from people working in the
same company but at different areas.

101
Table 12.Suppliers performance indicators. SUPPLIERS PERFORMANCE INDICATORS
FINANCIAL Annual renew pricing 1 Credit worthiness 1 Price Variations 2 TIME RELATED Lead Time 4 Meeting quoted delivery date 6 Sample turnaround time 1 PRODUCT RELATED Conformance to specs 3 Processability 2 Product performance 2 Quality claims 3 Size of cones 1 Soil grassy 1 LOGISTICS Backorders 1 Damage in transport 1 Errors in paperwork 1 Short shipments 3 Truck turaround time 1
4.4. Product Data Management
The objective of this section was to identify the software and tools available in the industry to
manage product data and to see how they incorporate yarn characteristics into the design of
the final product.
From the interviews it could be observed that only basic yarn characteristics are considered
into the design and product development at the retailer’s side, as shown in the example of the
technical package specification sheet in Figure 14, the driving factors are fabric swatches,
hand, weight, content, and drape of fabric.

102
Product development and sourcing teams can build a product using known characteristics of
specific yarn counts or types, but normally at the design level designers refer to finished
fabric specs and physical fabric standards for decision making.
As explained in section 4.1. of this chapter, retailers use PDM (Product Data Management)
and PLM (Product Lifecycle Management) software to support the product development
process but they have the disadvantage of focusing on garments. They failed to incorporate
the details of the textile components: fabric, yarn and fiber.
All the retailers interviewed, as well as the vendors and only one fabric manufacturer
confirmed to have digital libraries that can be linked to PDM or PLM packages, where they
record the fabric characteristics, knit-down designs, testing results, fabric approvals, etc. So
when the time to look for a new fabric development comes, before starting from scratch they
search these databases looking for similar fabrics.

Figure 23. Yarn data store in fabric libraries. Source: RR1.
Large retailers like RR1, give access to their key vendors and mills to these systems, so they
can fill the fabric and yarn specs directly from the factories, or use the library as a guide to
develop or reproduce fabrics. The main benefit is that they can communicate with suppliers
across the world and contribute to the uniformity and consistency of their products. But this
is just a data base resource, is not a software program that will allow you to determine what
could be the best yarn characteristics to achieve expected quality and fabric characteristics.
At the yarn manufacturer level, it was observed that product data is recorded whether in
laboratory software or some sort of data base. Data is used to track a problem and identify
specifically the part of the processes where it was originated.
103

104
Variations in the yarn characteristics may not cause a quality problem to the customer but
can cause operational problems at the mill. These data is used for optimization of opening,
carding, drawing and spinning machines, not to be incorporated in the design of the final
product.
Two software programs that incorporate yarn characteristics into the design of fabrics were
found during the research but can not be classified as PDM.
The first one is called Starfish. Developed by Cotton Technology International (1998). It is a
computer program simulator that models the key elements of production and processing
cotton circular knitted fabrics and it calculates their expected performance. The predictions
provided by the program are usually within one standard deviation of the average measured
values obtained from comparable fabrics in routine production. The parameters that can be
chosen as input are fabric types, yarn types and settings for wet processing. The outputs are
knitting specifications and finish fabric properties projections the following figures show
screen shots of the yarn parameters that can be changed for the simulation.

Figure 24. Starfish: Choosing yarn type. Source: Cotton Technology International.
105

106
Figure 25.. Starfish: Choosing yarn count. Source: Cotton Technology International.

107
The other program founded is called CYROS®, a yarn-to-fabric computer simulation system
that allows an existing yam to be "scanned" and the digitized information is fed into a
software program that generates a technically correct fabric structure, knit or woven.
Different yarn qualities and/or manufacturing parameters can be evaluated in a fabric
construction without the expense of making the fabric. CYROS® was originally conceived to
be a quality control tool early on, but its role has expanded to manufacturing as well. (Cotton
Inc., 1999)
CYROS® development was defined by the following considerations (CIS Technologies
GmbH, 2001):
• Spun yarn shows irregularities. These thickness variations affect the strength
performance and the visual appearance of the final fabric, produced with the yarn.
• The quality control of the yarn is therefore an essential task in both yarn production
and fabric production
• There are testing devices that measure the yarn thickness by capacitive or optical
sensors. But they only do statistical analysis of the data. The calculated OCV% -
values as a mean for the variation are useful but very often not significant enough to
predict the visual appearance of the fabric. Therefore, yarn board tapering or sample
production of woven or knitted fabrics is very common. This is time consuming and
expensive.

Figure 26. CYROS® visualizes different degrees of washing effect in denim fabric. Source: www.cis.de
4.5. Business Practices
This section describes several practices which appear to drive success for yarn manufacturers
and bring them closer to retailers; they were identified through not only discussions with yarn
manufacturers, but from feedback at the fabrication and retail levels.
4.5.1 Quality (Qualifying Criteria)
On of the vertically integrated companies interviewed in Central America (CS2), buys yarn
from Pakistan and the U.S. Pakistani yarn is usually 7.5% cheaper than American despite the
trade agreements. Seventy percent of their production is made with American yarn. They
recognized its superior quality compared to the Pakistani yarn and that is why they use
American yarn for tops, where you need better hand feel and clean look, and Pakistani yarn
for bottoms.
108

109
On the other hand, a retailer of high end products (RR2) indicated that the yarn quality they
see coming from their vendors in China and India is quite superior to the domestic yarns.
They have tried without success, to duplicate that quality working together with the yarn
suppliers here in the U.S. and the vendors in Central America that buy American yarn. They
said that American yarn manufacturers have positioned themselves for commodity type
products and that their quality won’t let them compete in high end markets.
4.5.2 Relationship (Winning Criteria)
Yarn manufacturer YM1 and fabric manufacturer FM1, both leaders in their markets, have
maintained their reputation and their sales working with the supply chain to be sure that the
previous and subsequent processes are also the best possible so that the final product results
of a premium quality. A executive at YM1 commented that it would not be worth it to put a
lot of effort doing quality yarns or fabrics, if subsequent process, such as finishing or sewing,
are going to decrease that quality. Both companies work with their clients trying to improve
the general performance of the supply chain.
Based on the opinions of the interviewees at the research organization RS1, the agent RR5,
the vendor CS1, specs were generated to produce fast, at an efficient cost and to assure
consistency; but by sending a spec sheet to all the suppliers around world will not always
guarantee retailers to get what they want.
110
The advantage that yarn and fabric manufacturers have when they have been working with a
retailer for years, is that they got to know their way of thinking, what they want and what
they like, they understand the retailer’s requirements and quality standards. This knowledge
and a strong relationship allows yarn and fabric manufacturers to modify their products but
still their customers, or develop new products, innovate, with high probability of being
approved.
Some machinery (MM5), yarn (YM1, YM3 and YM4) and fabric manufacturers (FM1)
started contacting the retailers directly and developing collaborative relationships. The
machinery manufacturer took advantage of their reputation in the market and created a
certification program for yarn manufacturers using their equipment. The machinery
manufacturer has developed informative programs for retailers to explain them how yarn
affect the quality of the fabric, they show retailers who their equipment contribute to monitor
and improve the quality of yarns and what are the companies using this equipment and which
ones are certified by the company. It is a win-win procedure. The executive interviewed at
RS1 and a Quality Control associate of retailer RR3, agreed that retailer’s sourcing and
design departments that have people knowledgeable about textiles are more likely to make
quick and appropriate decisions.
The three yarn manufacturers and the fabric manufacturers work closely with designers to
translate their concepts into real products, this approach allows them to be the preferred
supplier and allow their name to appear in the technical packages sent around the world.

111
4.5.3 Capacity, Availability And Location (Winning Criteria)
Three of the five domestic yarn manufacturers interviewed produce specialty yarns
(Supima® cotton or heathers). They differentiated themselves from the big volume producers
and offshore sources by specializing in specific cotton yarns and by accepting small orders
that the large companies did not want to take; they do not have a minimum volume order
when a new client request yarns.
Two of them are aware of the shortening fashion cycles and consider that immediate
availability is an important factor for success. They have modified their manufacturing
processes to increase their flexibility and they design their yarns focusing on functionality,
trying to make “multipurpose” yarns, any improvement or innovation to be applicable to final
uses.
Based on the interviews, it seems that retailers have set sourcing strategies looking at the
entire supply chain and each link within that chain to produce the right product at the right
price at the right time. They set regional strategies; therefore, the presence of a yarn
manufacturer in that region is very important. Two retailers (RR6 and RR8) recognized the
success of one of the yarn manufacturers interviewed, the commented about it aggressiveness
to be closer to their clients and be able to supply the volumes required in that region.
Retailer RR1, RR2 and RR6, work with yarn manufacturers in those regions to maintain a
certain level of business and keep them meaningful and efficient. Reviews of duty, quotas,
freight transit and times are also very important.

112
As an example, vendor CS1 received a $3.18/lb quote for U.S. yarn and $5.45/lb for Peruvian
yarn, both of similar quality. The buyer, located in South America had to choose the Peruvian
despite the price, due to the lead times offered by the U.S. supplier.
Retailer RR6 recognized the capability of U.S. yarn manufacturers to decrease their
production costs, but they complaint about their attitude when it comes to provide something
different to their product offer. Another problem is the time domestic manufacturers take to
make samples, offshore sources offer a seven day lead time for sampling, which includes the
shipping time. Domestic manufacturers offer twenty-day lead times or more.

113
5 CONCLUSIONS AND RECOMMENDATIONS
The conclusions of this research are presented under the same five sections in which the
results and analysis were presented in chapter four.
5.1. Yarn Specification Process
Domestic yarn manufacturers must address the requirements of all the participants in the
textile and apparel supply chain in order to remain competitive and to differentiate their
products from offshore sources. The objective of this project was to better understand these
requirements through discussions with members of the supply chain.
To accomplish the first research objective: RO1:Map the yarn specification process across
the supply chain; case studies were conducted with the participation of machinery, yarn,
fabric and apparel manufacturers, as well as research and retail organizations. Both domestic
and Latin American companies were pursued, and a total of 32 company interviews were
conducted. The products investigated were denim, t-shirts, socks, sheets and sewing thread.
All made of cotton or poly-cotton blends.
By studying the interaction between the links of the supply chain, the steps taken and
considerations made at each link when specifying yarns, it was possible to identify that for
the commodity products investigated, all the participants of the supply chain rely on yarn and
fabric manufacturers to create the right yarn specifications.

114
Retailers and vendors focus on fabric specifications and will specify yarns only when there is
a limited number of suppliers, the yarn is quite expensive or rare, or to control the
consistency of their suppliers of core fabrics.
5.2. Yarn Specifications and Standard Testing Methods
Guided by the following research objectives:
• RO2. Identify yarn specifications considered important to yarn manufacturers, yarn
buyers and other participants of the supply chain.
• RO3. Identify current standard testing methods and equipment used to evaluate yarn
properties.
• RO4. Identify the most important yarn specifications as a function of the final
product.
It was found that yarn count, fiber content and yarn type (ring spun, open end, air jet, combed
or carded) are the most yarn characteristics frequently specified across the supply chain.
Detailed yarn characteristics such as Uster® %CV, tensile properties, and surface
characteristics are of interest of the mills to accomplish fabric specifications and to increase
process performance.
Methods and equipment used to test fabrics and yarns are relatively standard for both
domestic and international companies, the reason is that a specific company has a large

115
portion of the textile testing machinery market in the east hemisphere, so domestic and
international manufacturers have this equipment. Another reason is that the international
companies supply goods to American retailers; therefore, they have to operate under the
standards given by these retailers, which in general, are used to use AATCC and ASTM
standard testing methods.
There is a visible difference between what yarn and fabric manufacturers consider as
important yarn characteristics for specific products. Results presented in Section 4.2.of
chapter 4, showed that a denim manufacturer considers yarn strength an important yarn
characteristics to be consider, but only three of the five yarn manufacturers interviewed
indicated that yarn strength was important. In the case of t-shirts, fabric manufacturers
indicated that cost and delivery were yarn properties to be considered, none of the yarn
manufacturers mentioned those two characteristics.
5.3. Order Wining Criteria and Performance Metric
The research objectives to satisfy under this section were:
• RO5. Identify performance metrics used by yarn manufacturers, yarn buyers and
other participants of the supply chain.
• RO6. Define “order qualifying and order winning criteria” for domestic yarn
manufacturers that will allow them to remain competitive and differentiate their
products from offshore sources.

116
Performance metrics currently used to evaluate suppliers emphasize time related issues, such
as lead times, meeting quoted delivery dates and sampling time. Time related indicators are
the most commonly used to evaluate suppliers. Fabric manufacturers and a vertically
integrated vendors, measure the performance of their suppliers according to their records of
meeting quoted delivery dates, only one retailer and one yarn manufacturer mentioned to use
this performance indicator. Based on the answers obtained, it was noticed that companies are
missing structured performance metrics systems. Different responses were obtained from
people working in the same company but at different areas.
Quality, price and delivery were identified as qualifying criteria for yarn suppliers, without
satisfying these three requirements, domestic yarn manufacturers can not compete in the
market. The criteria that allow yarn manufacturers to win orders, remain competitive and
differentiate their products are: good customer relationships, capacity, availability, financial
stability, product consistency and geographical location.
Offshore vertically integrated vendors as well as domestic fabric manufacturers consider
buying domestic yarn that they can not produce either because technological limitations or to
avoid decreasing productivity, this will be the case for fine counts, heathers and special
blends.

117
5.4. Product Data Management
RO7. Evaluate existing product data management systems as to how they incorporate yarn
characteristics into designing the final product.
Analyses of different software used to manage product data revealed that detailed yarn
characteristics are rarely incorporated into final product design. Yarn testing data is
important for yarn and fabric manufacturers to set the machines and to monitor them instead.
5.5. Business Practices
Several practices were identified which appear to drive success for yarn manufacturers.
These practices were identified through not only discussions with yarn manufacturers, but
from feedback at the fabrication and retail level. Development of relationships with retailers
and a mixed of capacity, availability and geographical location were found to be key drivers
for success among niche and commodity yarn producers.
The contribution of these research to the existing body of knowledge was to consider
opinions from all the components of the supply chain and to obtain an in depth knowledge of
the dynamics of the yarn specifications process through a multiple case study analysis. The
findings will help yarn manufacturers to focus their efforts in the yarn characteristics and
business practices identified as important for the other components of the supply chain.

118
5.6. Recommendations
• Yarn manufacturers should take advantage of being in charge of what needs to be
specified, it is in their hands to determine the best quality yarn to fit a specific quality
of the final product.
• There is available software to manage “product data" but detailed yarn specifications
are not included because the data structure is simple. Trying to develop product data
management systems for yarns is questionable since they will not be used to its full
capacity.
5.7. Future Work
• Future research should explore in more detail cases where domestic yarns have been
preferred instead of yarn coming from offshore sources.
• Future research should be done to study the same factors but applied to technical
textiles or high performance apparel, since these are areas in which the U.S. industry
is still strong.

119
6 REFERENCES
Allen, R. M. (2006) Increasing the economic competitiveness of the U.S. textile industry : an investigation of niche market strategies Thesis. North Carolina State University. ASTM Committee on Terminology (2000) . ASTM dictionary of engineering, science, & technology. 9th Edition. West Conshohocken, PA: ASTM. ASTM International (2007). Annual Book of ASTM Standards. Volume 07.01 and 07.02. West Conshohocken, PA: ASTM. Bealer, RJ (2004). Hosiery Sector Files Safeguard Petition. Textile World 154 (8):14 Behery H.M. (2005). Effect of yarn factors on fabric hand. In Behery H.M. (Ed) Effect of mechanical and physical properties on fabric hand. pp: 219-238. Boca Raton, FL.: CRC Press. Berdine, M.P. (2007) Measuring trough competitive advantage. Thesis. North Carolina State University. Brown, M.G. (2000). Winning Score: How to Design and Implement Organizational Scorecards. Portland, OR: Productivity Press. . Cesca, L. A. (2006) Economic Competitiveness in the Global Textile Supply Chain: Examination of Logistics Cost Structures. Thesis. North Carolina State University. Chapman, L & Petersen, M. (2000). Demand Activated Manufacturing Architecture (DAMA), Model for Supply Chain Collaboration. Sandia National Laboratories. Albuquerque, NM. CIS Technologies GmbH (2001). The beginning. . Retrieved April 14, 2008, from http://www.cis.de/newpage1.htm Clark, E. (10/1/2007). U.S. Socks Producers Seek Honduran Relief. WWD: Women's Wear Daily. 194 (69): 21. Collier, B.J. & Epps, H.H. (1999). Textile testing and analysis. Upper Saddle River, NJ : Prentice Hall. Cotton Incorporated (July, 1999) Press Release: Fiber Processing. Retrieved April 14, 2008, from http://www.cottoninc.com/pressreleases/?articleID=168

120
Cotton Incorporated (2003) Lifestyle Monitor Fall 2003. Entering the Comfort Zone: A Cotton Sheet Primer. Retrieved April 14, 2008, from http://www.cottoninc.com/LifestyleMonitor/LSMFall03/?Pg=9 Cotton Technology International (1998), Starfish 6.0 for Windows. Stockport, UK: Cotton Technology International. Emerging Textiles (2006) US Cotton Bed Sheet Market swallowed by Pakistan and China. Retrieved April 14, 2008, from http://www.emergingtextiles.com/?q=art&s=061101-Home&r=free&i=samplearticle Emmett, S. & Crocker, B. (2006). The Relationship-Driven Supply Chain. Burlington, VT. Gower Publishing Company. Forza, C. (2002) Survey Research in Operations Management: A Process-Based Perspective. International Journal of Operations & Production Mangement. 22(2):152-194. Gimenez, C. (2005). Case Studies and Surveys in Supply Chain Management Research: Two Complementary Methodologies. In Kotzab H, Seuring S and others (Ed.), Research Methodologies in Supply Chain Management (pp. 315-330). Heidelberg ; New York : Physica-Verlag. Gosselin, M. (2005) An empirical study of performance measurement in manufacturing firms. International Journal of Productivity and Performance Management. 54 (5/6): 419-443. Handfield, R.B. & Melnyk, S.A. (1998) The scientific theory-building process: a primer using the case of TQM. Journal of Operations Management. 16 (4): 321-339. Hatry,H.P. (2006). Performance Measurement. 2nd Edition. Washington, DC. The Urban Institute Press. Hill, T. (2005) Operations Management. 2nd Edition. New York, NY: Palgrave Macmillan. Kadolph, S. J. (2007) Quality Assurance for Textiles & Apparel, 2nd Edition. New York, NY: Fairchild Publications. Loch, C. & Kavadias, S. (2008). Handbook of New Product Development Management. Burlington, MA. Elsevier Ltd. Lord, P.R. (2003). Handbook of yarn production. Boca Raton, FL : CRC Press LLC.

121
LovejoyA , J. An Introduction to the DAMA Project. Retrieved May 28, 2008, from http://www.techexchange.com/thelibrary/Dama/Dama_Intro.html LovejoyB , J. (2001) DAMA Final Report. Retrieved May 28, 2008, from http://www.techexchange.com/thelibrary/Dama/Dama_Final.html McCreight D.J., Feil R.W., Booterbaugh J.H. and Backe E.E. (1997). Short staple yarn manufacturing. Durham, N.C. : Carolina Academic Press. Meredith, J. (1998) Building operations management theory through case and field research. Journal of Operations Management. 16 (4): 441-454. Neely, A., Gregory, M., Platts, K. (2005) Performance measurement system design. International Journal of Operations & Production Management. 25 (12): 1228-1263. Nowell, C.H. (2005). Market Competitiveness in the Global Textile Supply Chain: Examination of Supply Chain Configurations. Thesis. North Carolina State University Office of Textiles and Apparel (OTEXA) (2008). Export Market Report by Group: Yarn Retrieved April 14, 2008, from http://otexa.ita.doc.gov/exports/grp3.htm Oxenham, W. (2005). Yarn quality: beauty is in the eyes of the beholder. Indian Journal of Fiber and Textile Research. 30 (4): 353-354. Rehg, J.A. & Kraebber H.W. (2005). Computer-Integrated Manufacturing. Upper Saddle River, NJ : Pearson Prentice Hall. Saville, B. P. (1999). Physical testing of textiles. Boca Raton, FL : CRC Press LLC. Sekhar, U (May-June 2007). Denim Fabric: Global Trade and Leading Players. Textile Outlook International. 129: 65-88. Sekhar, U (November-December 2007). World Trade in T-Shirts. Textile Outlook International. 132: 12-33. Seuring, S. (2005). Case study research in supply chains: an outline and thre examples. In Kotzab H, Seuring S and others (Ed.), Research Methodologies in Supply Chain Management (pp. 235-250). Heidelberg ; New York : Physica-Verlag. Stark, J. (March 3, 2000). Product Data Management (PDM). Retrieved October 21, 2007, from http://www.johnstark.com/pd78.html Textile Outlook International (March-April 2007). World Textile and Apparel Trade and Production Trends. Textile Outlook International. 128: 17-88.

122
U.S. Census Bureau (2008). Current Industrial Reports (CRI) MQ313A – Textiles. Retrieved April 14, 2008, from http://www.census.gov/industry/1/mq313a074.pdf Uster Technologies AG (2007). Uster® Statistics 2007. Version 1.0 CD Uster Technologies AG (2008). Uster® Intelligent Sourcing. Retrieved March 14, 2008, from http://www.uster.com/UI/News.aspx?id=002 Uster Technologies AG (2007). Application Report Series. SE562 - SE586 - SE601 - SE604. Voss, C.; Tsikriktsis, N. and Frohlich, M. (2002) Case Research in operations Management. International Journal of Operations & Production Management. 22(2):195-219.

123
7 APPENDICES

7.1 Appendix A :ASTM Committee D13 on Textiles
This is a selection of the ASTM Standards highly related to the yarns investigated in this
research. The list of sub-committees and the complete list of standards under their
jurisdiction can be found at:
www.astm.org/cgi-
bin/SoftCart.exe/COMMIT/SUBCOMMIT/D13.htm?L+mystore+btfk1314+1206149595
The complete standards can be found in volumes 07.01 and 07.02 of the Annual Book of
ASTM Standards (2007).
Sub-committee D13.58: Yarns and Fibers
• D76-99(2005) Standard Specification for Tensile Testing Machines for Textiles
• D204-02 Standard Test Methods for Sewing Threads
• D861-07 Standard Practice for Use of the Tex System to Designate Linear Density of
Fibers, Yarn Intermediates, and Yarns
• D1059-01 Standard Test Method for Yarn Number Based on Short-Length Specimens
• D1244-98(2005) Standard Practice for Designation of Yarn Construction
• D1422-99 Standard Test Method for Twist in Single Spun Yarns by the Untwist-
Retwist Method
• D1423-02 Standard Test Method for Twist in Yarns by Direct-Counting
• D1577-07 Standard Test Methods for Linear Density of Textile Fibers
124

125
• D1578-93(2006)e1 Standard Test Method for Breaking Strength of Yarn in Skein
Form
• D1907-07 Standard Test Method for Linear Density of Yarn (Yarn Number) by the
Skein Method
• D2255-02(2007) Standard Test Method for Grading Spun Yarns for Appearance
• D2256-02 Standard Test Method for Tensile Properties of Yarns by the Single-Strand
Method
• D2258-99(2005) Standard Practice for Sampling Yarn for Testing
• D2259-02(2006) Standard Test Method for Shrinkage of Yarns
• D2260-03 Standard Tables of Conversion Factors and Equivalent Yarn Numbers
Measured in Various Numbering Systems
• D2494-02 Standard Test Method for Commercial Mass of a Shipment of Yarn or
Manufactured Staple Fiber or Tow
• D2645-07 Standard Tolerances for Yarns Spun on the Cotton or Worsted Systems
• D3108-07 Standard Test Method for Coefficient of Friction, Yarn to Solid Material
• D3412-07 Standard Test Method for Coefficient of Friction, Yarn to Yarn
• D3888-07 Standard Terminology for Yarn Spinning Systems
• D4848-98(2004) Standard Terminology of Force, Deformation and Related
Properties of Textiles
• D4849-02b(2007) Standard Terminology Relating to Yarns and Fibers
• D5344-99(2005) Standard Test Method for Extension Force of Partially Oriented
Yarn

126
• D6197-99(2005) Standard Test Method for Classifying and Counting Faults in Spun
Yarns in Electronic Tests
• D6587-00(2006) Standard Test Method for Yarn Number Using Automatic Tester
• D6612-00(2006) Standard Test Method for Yarn Number and Yarn Number
Variability Using Automated Tester
Sub-committee D13.92: Terminology
• D123-07 Standard Terminology Relating to Textiles
Sub-committee D13.93: Statistics
• D2904-97(2002) Standard Practice for Inter-laboratory Testing of a Textile Test
Method that Produces Normally Distributed Data
• D2905-97(2002) Standard Practice for Statements on Number of Specimens for
Textiles
• D2906-97(2002) Standard Practice for Statements on Precision and Bias for Textiles
• D3777-97(2002) Standard Practice for Writing Specifications for Textiles
• D4270-95(2001) Standard Guide for Using Existing Practices in Developing and
Writing Test Methods
• D4271-88(2001) Standard Practice for Writing Statements on Sampling in Test
Methods for Textiles
• D4467-94(2001) Standard Practice for Inter-laboratory Testing of a Textile Test
Method That Produces Non-Normally Distributed Data

127
• D4697-95(2001) Standard Guide for Maintaining Test Methods in the User's
Laboratory
• D4853-97(2002) Standard Guide for Reducing Test Variability
• D4854-95(2001) Standard Guide for Estimating the Magnitude of Variability from
Expected Sources in Sampling Plans
• D4855-97(2002) Standard Practice for Comparing Test Methods

7.2 Appendix B :ISO Committee TC 38-Textiles: Subcommittee SC 23 – Fibers and
Yarns
This is a selection of the list of current standards published by the ISO Textile Subcommittee
SC 23 Fibers and Yarns. The standards selected are directly related to the type of yarns
investigated in this research.
• ISO 2:1973 Textiles: Designation of the direction of twist in yarns and related
products.
• ISO 1139:1973 Textiles: Designation of yarns.
• ISO 1144:1973 Textiles: Universal system for designating linear density (Tex
System)
• ISO 2060:1994 Textiles: Yarn from packages: Determination of linear density (mass
per unit length) by the skein method.
• ISO 2061:1995 Textiles: Determination of twist in yarns: Direct counting method.
• ISO 2062:1993 Textiles: Yarns from packages: Determination of single-end breaking
force and elongation at break.
• ISO 2947:1973 Textiles: Integrated conversion table for replacing traditional yarn
numbers by rounded values in the Tex System.
• ISO 6741-1:1989 Textiles: Fibers and yarns: Determination of commercial mass of
consignments: Part 1: Mass determination and calculations.
128

129
• ISO 6741-2:1987 Textiles: Fibers and yarns: Determination of commercial mass of
consignments: Part 2: Methods for obtaining laboratory samples.
• ISO 6741-3:1987: Textiles: Fibers and yarns: Determination of commercial mass of
consignments: Part 3: Specimen cleaning procedures.
• ISO/TR 6741-4:1987 Textiles: Fibers and yarns: Determination of commercial mass
of consignments: Part 4: Values used for the commercial allowances and the
commercial moisture regains.
• ISO 6938:1984 Textiles: Natural fibers: Generic names and definitions.
• ISO 6939:1988 Textiles: Yarns from packages: Method of test for breaking strength
of yarn by the skein method.
• ISO/TR 8091:1983 Textiles: Twist factor related to the Tex System.
• ISO 8159:1987 Textiles: Morphology of fibers and yarns: Vocabulary
• ISO 10290:1993 Textiles: Cotton yarns: Specifications
• ISO 16549:2004 Textiles: Unevenness of textile strands: Capacitance method.
• ISO 17202:2002 Textiles: Determination of twist in single spun yarns:
Untwist/retwist method.

7.3 Appendix C: 73 Financial and Non-financial Measures
An empirical study of performance measurement in manufacturing firms was conducted by
Gosselin (2005), showing that despite the suggestions made in literature, manufacturing
companies still put more emphasis on financial measures when designing their performance
measurement system, rather than incorporate non-financial measures. A list of the seventy-
three performance measurements used to conduct this study can be found in Appendix C
Net profit, gross profit margin, total sales department, amount of raw material inventory,
cost per unit produce and others represented the first eleven measures mentioned by the
companies that participated in Gosselin’s study. The first non-financial measure was the
number of worker injuries in twelfth place.
MEASURE CATEGORY
1 Net profit Production Information 2 Gross profit margin Revenues and Profits 3 Total sales of revenues Revenues and Profits 4 Profit before tax Financial Ratio 5 Cost of goods sold Revenues and Profits 6 Total expenses Financial Ratio 7 Total costs by department Financial Ratio 8 Amount of raw material inventory Production Information 9 Cost per unit produced Production Information 10 Amount of finished good inventory Production Information 11 Total operating cash flows Financial Ratio 12 Number of worker injuries Employee Data 13 Total net cash flows Financial Ratio 14 Inventory turnover ratio Production Information 15 Rate of incidence of injuries Employee Data 16 Backlog in the delivery schedule Order and Delivery
130

131
17 Number of customer complaints Quality 18 Account receivable turnover Production Information 19 Amount of work in process inventory Production Information 20 Length of time from order delivery Order and Delivery 21 Materials price variance Variance Labor & Material 22 Number of units produced Production Information 23 Rate of production capacity or resources used Production Information 24 Amount of material scrap produced Production Information 25 Return on sales Financial Ratio 26 Number of employee hours Employee Data 27 Number of units of finished goods in the inventory Production Information 28 Number of customer orders received Order and Delivery 29 Rate of incidence of production defects Employee Data 30 Labor efficiency variance Variance Labor & Material 31 Level of absenteeism Employee Data 32 Number of machine or plant hours used Non-financial Ratio 33 Return on investment (ROI) Return on Investment 34 Total of cash receipts Financial Ratio 35 Number of customer orders completed Order and Delivery 36 Number of unit of material components in the
inventory Production Information 37 Current ratio Financial Ratio 38 Total sales per region Customer and Product Sales 39 Cost reduction resulting from quality product
improvement Quality 40 Total of cash disbursements Financial Ratio 41 Unit of output per hours of labor used Non-financial Ratio 42 Total sales per employee Account Receivable 43 Number and length of down time Production Information 44 Market share Quality 45 Cost quality Quality 46 Return on equity (ROE) Return on Investment 47 Number of warranty claims Customer and Product Sales 48 Customer satisfaction: survey ratings Return on Investment 49 Materials quantity variance Variance Labor & Material 50 Labor rate variance Variance Labor & Material 51 Number of doubtful accounts receivable Account Receivable 52 Amount of training expenses Employee Data 53 Total sales per sale representative Customer and Product Sales 54 Unit of output per machine hours used Non-financial Ratio 55 Number of new employees Employee Data 56 Number of employee hours per shift Non-financial Ratio 57 Percentage of key staff turnover Employee Data 58 Number of new products Customer and Product Sales

132
59 Tonnage of production waste produced Non-financial Ratio 60 Quantity of energy consumed Non-financial Ratio 61 Number of new customers Customer and Product Sales 62 Cost per damaged unit produced Customer and Product Sales 63 Unit of output per unit of raw materials used Non-financial Ratio 64 Time-to-market for new products Customer and Product Sales 65 Number of new customer contacts Customer and Product Sales 66 Earnings per share Stock Market Measures 67 Average sales order Customer and Product Sales 68 Number of lines or products Customer and Product Sales 69 Stock price Stock Market Measures 70 Unit of output per square foot used Non-financial Ratio 71 Number of removed products Customer and Product Sales 72 Price-earnings ratio Stock Market Measures 73 Rate of products removal Customer and Product Sales

7.4 Appendix D :Research Questionnaire used to conduct Case Studies
1) Please indicate if your company supplies machinery/yarn/fabric/garments for the
following product categories:
Product
Jeans Bedding (Sheeting) Sewing Thread
T-Shirts Hosiery
2) Please mark the links of the supply chain that your company maintains relationship with.
Describe the interaction.
3) What are the yarn characteristics commonly specified when selling/buying yarns?
Characteristics Characteristics Characteristics
Type Elongation Friction Coefficient
Count Hairiness Presentation
Content Evenness Delivery Time
Twist # Neps Quantity
Strength # Splices Price
Other:
133

134
4) What standard testing methods do you use?
STD METHODS
ASTM AATCC ISO
OTROS
5) Please indicate the yarn property tested, the std method and the equipment used for
testing 6) Please list the most important yarn characteristics for the following products. If possible,
indicate recommendable spec range and comment how they affect the product.
Property Jeans Property T-Shirts
Property Bedding Property Hosiery
7) Who decides what needs to be specified, your company or your client? 8) Do you use Uster statistics? 9) Do you generate specification sheets? 10) Are these spec sheets available to the customer? Or a modified version? 11) How do you manage the product data? 12) Do you know if you clients use PDM, do they incorporate your specs in theirs? 13) What criteria are used to select suppliers? 14) How to you evaluate the performance of your suppliers? 15) Why do you think your customers prefer you as a supplier? 16) Do you know how your clients evaluate your performance? 17) Could you please mention the most common complaints you receive from your
customers?