Embed Size (px)
Citation preview

AYISI VALENTINE F17/8244/04 © 2009 1
CHAPTER 1
1.0 BACKGROUND TO SCADA
1.1 INTRODUCTION.
What is SCADA?
The acronym SCADA stands for Supervisory Control and Data Acquisition.
SCADA is an industrial monitoring measurement and control system. It consists of a central
station, field data gathering elements (RTUs) and a collection of standard and/or custom software
used to monitor and control remotely located data elements.
Contemporarily SCADA system exhibit predominantly open loop control characteristics and
utilize predominantly long distance communication.
Similar system to SCADA systems are routinely seen in factories, treatment plants etc. These are
often referred to as distributed control systems (DCS). They have similar functions to SCADA
systems, but the field data gathering or control units are usually located within a more confined
area. Communications may be via a local area network (LAN), and will normally be reliable and
high speed integrated. A DCS system usually employs significant amounts of closed loop
control. SCADA systems on the other hand generally cover larger geographic areas, and rely on
a variety of communication systems that are normally less reliable than a LAN.
Supervisory refers to the actual seeing and monitoring of the system. Control is the real
operation. It involves the sending and receiving of commands. Data acquisition is the most
important part of SCADA system. It involves the collection of data. Data collected includes:
• Measurements i.e. voltage, frequency, current and reactive power.
• Indications i.e. ON or OFF switches, auto or manual transformers, open or closed CBs.
• Alarms i.e. for system operation
AYISI VALENTINE F17/8244/04 © 2009 2
1.2 HOW SCADA WORKS
In most SCADA systems, the master unit sequentially scans the remote terminal units (RTUs),
by sending a message to each RTU to inquire whether the RTU has anything to report. If it does,
the RTU will send a message back to the master, and the data received will be put into the
memory of the computer for processing. The scan of all RTUs in the systems will be completed
in approximately 2s. However, in the event of trouble at a remote station, a message will be sent
from the remote unit to the master. The normal scan will be interrupted long enough for the
master to receive the message and provide an alarm so that the master unit can automatically
perform predetermined control actions. In any event, in most cases, the status of all stations
equipped with RTUs can be monitored every few seconds, providing the operations at the control
center with-up-to-date reviews of the system conditions.
POWER LINE
…..
…..
FIGURE 1.1 GENERAL SCADA SYSTEMS SCHEMATIC
CENTRAL
STATION
TRANSFORMER 1
TRANSFORMER N
RTU 1
RTU X
RTU 1
RTU Y
AYISI VALENTINE F17/8244/04 © 2009 3
1.3 SCADA ARCHITECTURES
SCADA systems have evolved in parallel with the growth and sophistication of modern
computing technology. The following sections will provide a description of the following three
generations of SCADA systems:
• First Generation – Monolithic
• Second Generation – Distributed
• Third Generation – Networked
1.3.1 Monolithic SCADA Systems
When SCADA systems were first developed, the concept of computing in general centered on
“mainframe” systems. Networks were generally non-existent, and each centralized system stood
alone. As a result, SCADA systems were standalone systems with virtually no connectivity to
other systems. The Wide Area Networks (WANs) that were implemented to communicate with
remote terminal units (RTUs) were designed with a single purpose in mind–that of
communicating with RTUs in the field and nothing else. In addition, WAN protocols in use
today were largely unknown at the time. The communication protocols in use on SCADA
networks were developed by vendors of RTU equipment and were often proprietary. In addition,
these protocols were generally very “lean”, supporting virtually no functionality beyond that
required scanning and controlling points within the remote device. Also, it was generally not
feasible to inter-mingle other types of data traffic with RTU communications on the network.
Connectivity to the SCADA master station itself was very limited by the system vendor.
Connections to the master typically were done at the bus level via a proprietary adapter or
controller plugged into the Central Processing Unit (CPU) backplane.
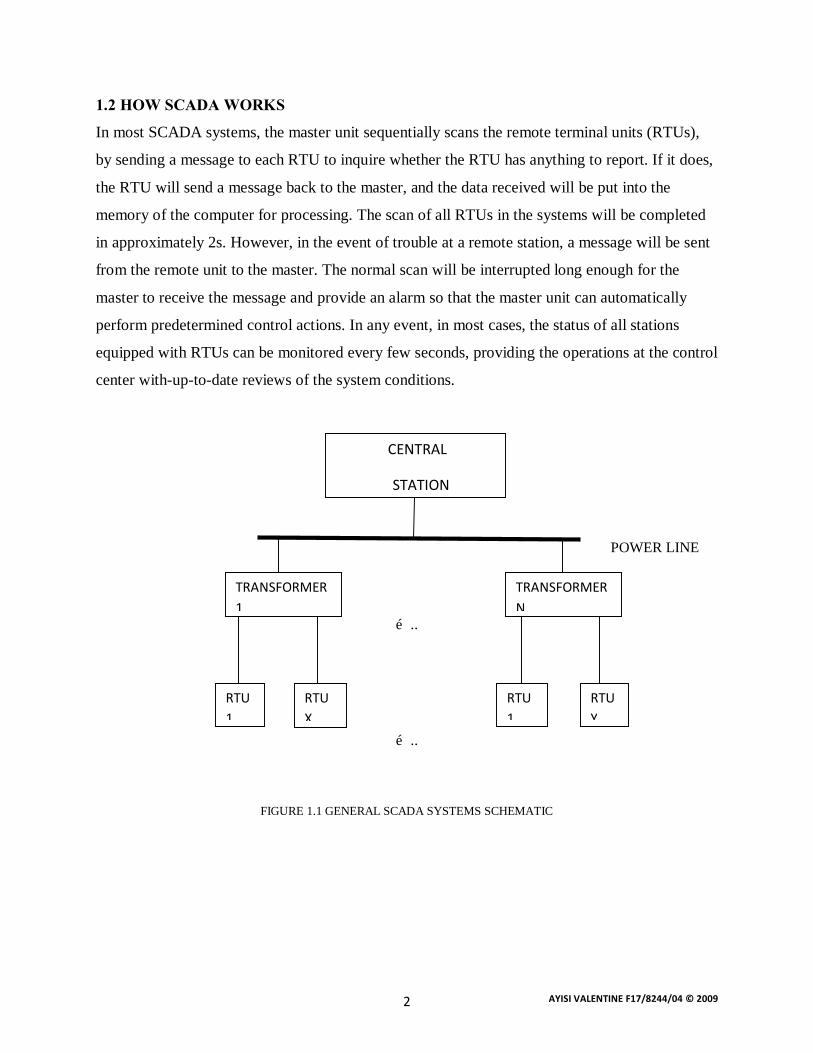
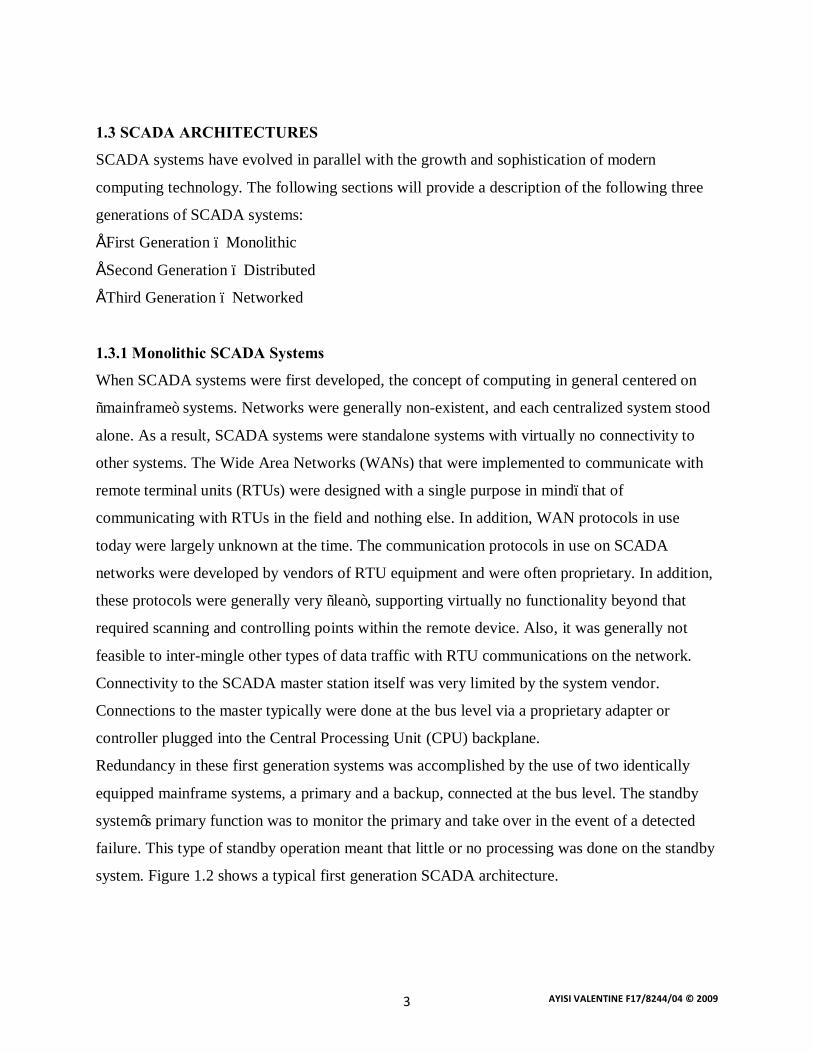
Redundancy in these first generation systems was accomplished by the use of two identically
equipped mainframe systems, a primary and a backup, connected at the bus level. The standby
system’s primary function was to monitor the primary and take over in the event of a detected
failure. This type of standby operation meant that little or no processing was done on the standby
system. Figure 1.2 shows a typical first generation SCADA architecture.
AYISI VALENTINE F17/8244/04 © 2009 4
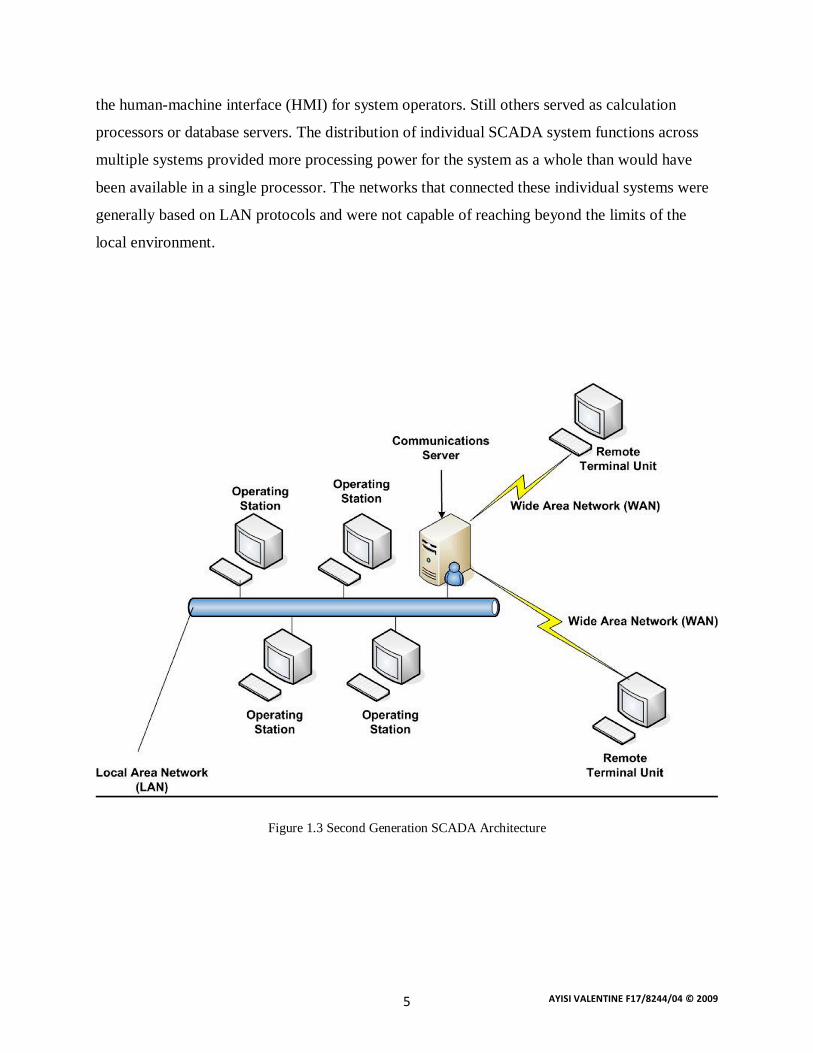
1.3.2 Distributed SCADA Systems
The next generation of SCADA systems took advantage of developments and improvement in
system miniaturization and Local Area Networking (LAN) technology to distribute the
processing across multiple systems. Multiple stations, each with a specific function, were
connected to a LAN and shared information with each other in real-time. These stations were
typically of the mini-computer class, smaller and less expensive than their first generation
processors.
Figure 1.2 First generation SCADA architecture
Some of these distributed stations served as communications processors, primarily
communicating with field devices such as RTUs. Some served as operator interfaces, providing
AYISI VALENTINE F17/8244/04 © 2009 5
the human-machine interface (HMI) for system operators. Still others served as calculation
processors or database servers. The distribution of individual SCADA system functions across
multiple systems provided more processing power for the system as a whole than would have
been available in a single processor. The networks that connected these individual systems were
generally based on LAN protocols and were not capable of reaching beyond the limits of the
local environment.
Figure 1.3 Second Generation SCADA Architecture
AYISI VALENTINE F17/8244/04 © 2009 6
1.3.3 Networked SCADA Systems
The current generation of SCADA master station architecture is closely related to that of the
second generation, with the primary difference being that of open system architecture rather than
a vendor controlled, proprietary environment. There are still multiple networked systems, sharing
master station functions. There are still RTUs utilizing protocols that are vendor-proprietary. The
major improvement in the third generation is that of opening the system architecture, utilizing
open standards and 13 protocols and making it possible to distribute SCADA functionality across
a WAN and not just a LAN.
Open standards eliminate a number of the limitations of previous generations of SCADA
systems. The utilization of off-the-shelf systems makes it easier for the user to connect third
party peripheral devices (such as monitors, printers, disk drives, tape drives, etc.) to the system
and/or the network. As they have moved to “open” or “off-the-shelf” systems, SCADA vendors
have gradually gotten out of the hardware development business. These vendors have looked to
system vendors such as Compaq, Hewlett-Packard, and Sun Microsystems for their expertise in
developing the basic computer platforms and operating system software. This allows SCADA
vendors to concentrate their development in an area where they can add specific value to the
system–that of SCADA master station software.
The major improvement in third generation SCADA systems comes from the use of WAN
protocols such as the Internet Protocol (IP) for communication between the master station and
communications equipment. This allows the portion of the master station that is responsible for
communications with the field devices to be separated from the master station “proper” across a
WAN. Vendors are now producing RTUs that can communicate with the master station using an
Ethernet connection.
AYISI VALENTINE F17/8244/04 © 2009 7
CHAPTER 2
2.0. TECHNOLOGY BACKGROUND
2.1 SUPERVISORY AND CONTROL FUNCTIONS
2.1.0 INTRODUCTION
The SCADA system is a general hardware and software concept providing a flexible set of
functions. The actual use of the SCADA system is specified by parameters defined in the
database. This brings down system costs, increases system reliability through its well-proven
design, and makes project development and implementation safe. It further constitutes a basis for
implementing more advanced functions. They provide for further development of the control
system once it has been put into operation. This is a basic requirement since it must be possible
to add new power system components which are going to be monitored and controlled by the
control system.
This chapter gives an overview of the SCADA functions available in control systems today.
First, the collected and processed data are presented and then the basic monitoring and event
handling of these data are described.
2.1.1 Data Acquisition
The basic information with regard to the power system is collected by equipment in the various
substations and power plants. The distributed control system equipment enables remote data
acquisition. Data may also be entered manually or calculated. These data are treated exactly like
the automatically collected data.
Data acquisition operation is required to:
• Read power system measurement data from RTUs into the control computer under
program control.
• Detect and handle data error conditions due to RTU and communication system
malfunctions and noise.
AYISI VALENTINE F17/8244/04 © 2009 8
• Scale and convert analogue data into binary form directly usable by the computer
programs.
• Interface with database manager (DBM) that generates data base addresses, and
store data in database.
• Store only error free data, quality indicators should be set to denote error
conditions.
• Complete the scan in minimum possible time before the next scan begins.
1. Status indicators
The status of CBs, indicators, alarm signals and other signals is represented by means of “status
indicators”. These status indications are contact closings connected to digital input boards.
Normally there are both single (1-bit) and double (2-bit) status indications. Double indications
are normally for circuit breakers, disconnectors and other two-state and the other bit represents
the CLOSE-contact and the other bit the OPEN-contact. This facilitates detection of false and
intermediate values.
2. Measured values
Measured values of various kind e.g. voltage levels, active and reactive power flows,
temperature and tap changer positions are collected by the control system. These values then
represent the momentary state of the measuring point. Two types of values are normally
collected.
• Analog values, transformed via an A/D converter o a binary format- supported
without time tag
• Digitally coded values- supported without time tag
3. Energy values
Energy values are obtained from pulse counters. The pulse counting normally involves two
registers: a continuous counter and a time interval register. The pulse counters are frozen locally
in the controlled stations at specified point of time i.e. (when the time expires, a transfer is
AYISI VALENTINE F17/8244/04 © 2009 9
initiated from the counter to the time interval register). The generally accepted time is one hour.
Then the counter continues on for the next hour and the register content is collected as part of the
normal scanning. The frozen counter values are reported spontaneously. The included time tag is
the point of time for the freezing.
4. Commands and clock synchronization
Both single and double object commands are supported. Regulating step command is supported.
Set point command and bit string commands are also supported. Clock synchronization is
initially performed according to the procedure defined. However, if the controlling station does
not reply on ‘delay acquisition command’ the controlling station will adapt to that. The clock
synchronization is performed according to the user convention.
2.1.3 Man/Human-machine interface (MMI/HMI)
Man-machine communication is of utmost importance in modern control systems. Few functions
are fully automated, and most require man to interact with the computer system. The design of
the man-machine subsystem involves many ergonomic features that are of equal importance to
the purely technical ones.
MMI is required to provide the following capabilities and facilities:
Ø VDU Displays
The color VDU is the state-of-the-art medium for presenting information to the operator at a
console. The VDU gives the operator an efficient and flexible tool for obtaining as to the
state of the power and control systems. All the data in the system database are available for
presentation on VDU. The only requirement is the specification of a display. This is easily
achieved since it is an inherent function of the modern SCADA system.
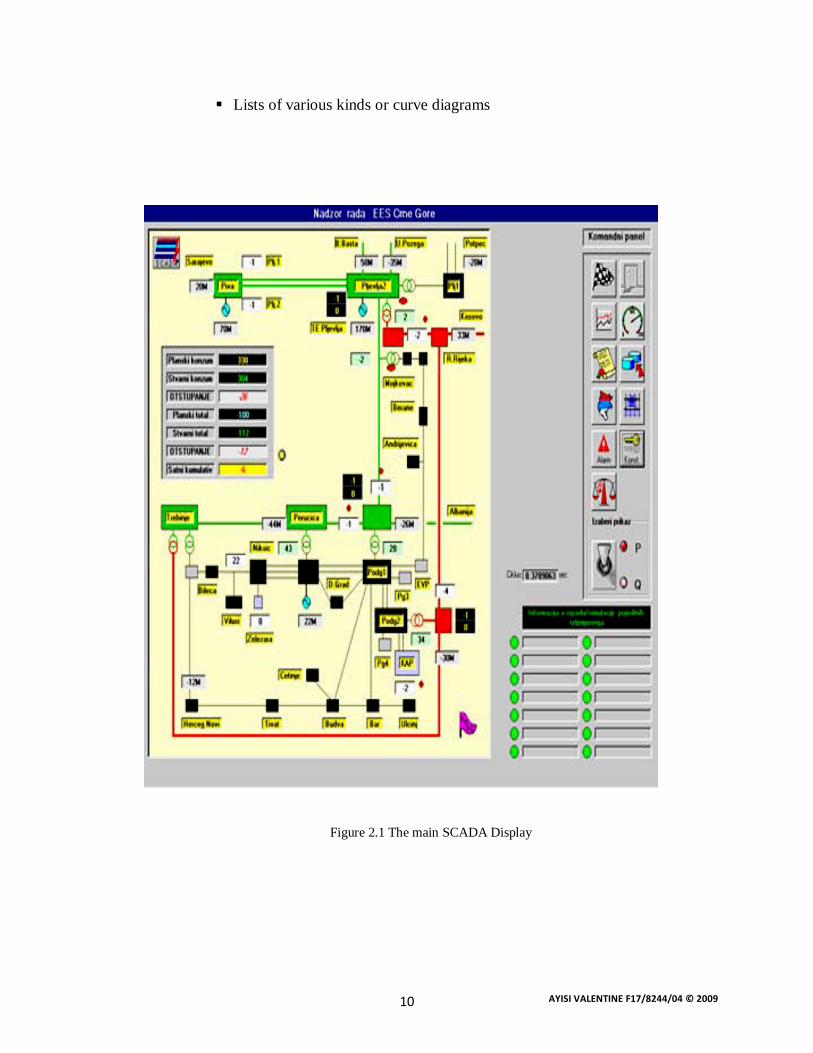
Displays objects with power information on the operator console monitor e.g.
§ Online diagrams
§ Alphanumeric tabular displays
AYISI VALENTINE F17/8244/04 © 2009 10
§ Lists of various kinds or curve diagrams
Figure 2.1 The main SCADA Display
AYISI VALENTINE F17/8244/04 © 2009 11
Ø Data entry
This is via console keyboard. Requirements include:
§ Initiation of control actions
§ Manual data entry into the data base
§ Data entry forms – for passing parameter to a program
All data entry operations may be selected by cursor from menu of options. Interrupt is serviced
from the console hardware and places the console entries into the data entry input queue.
Ø Audible alarms
The audible alarm is the system’s way of notifying the operator about an alarm situation.
Sometimes one audible alarm is shared by the entire control room but often each console has its
own audible alarm, so that activation follows the actual console authority assignment. If the
system implements different priority levels for alarms, this can also be reflected in a set of
audible alarms.
When power system goes into an emergency state an alarm condition occurs. Once it occurs, it
must be properly detected and identified. The operator should be notified with a short message
displayed on the monitor. This message must contain sufficient information to enable the
operator identify the alarm condition, evaluate its threat to security of the power system, and
decide on the corrective measure to be taken.
An important definition task is to define the alarm condition to be checked and determine where
and how to perform alarm condition detection and identification.
Ø Printer outputs
The operator normally obtains information about the state of the power system via the VDUs of
the consoles. For permanent records of the state, various output units are introduced in the
system configuration. The documents produced are used for operational follow-ups,
documentation purposes and maintenance of the control system database.

AYISI VALENTINE F17/8244/04 © 2009 12
2.1.4 Performance monitoring
Performance monitoring function is required to enhance the operational availability of the
SCADA system.
Response time is the manifestation of control system performance as seen from the operator’s
point of view. Response time is defined as the time from the request of a function until the
complete result of the function is ready. The requirements on system response time of showing
data to the operators, or of performing control commands, greatly affect the design of the system
and need to be looked into deeply.
The reason why response time is important is that long delays cause stress and are very annoying
to the operator. Stress is caused by disruption of the operator’s thought process. Humans in a
problem solving situation use the short term memory of their brains. This short-term memory is
characterized by low capacity and high volatility.
A basic requirement (and design goal) is that the availability of SCADA system, its
communication system and RTUs must be greater than the corresponding availability of the
power system network. That is, to be of value, the SCADA system must remain in operation
during power system outages, faults, and failures caused by electrical and mechanical
malfunctions or hostile environment conditions.
Basic philosophy of performance monitoring is that any single fault within the SCADA system
shall neither stop the system from operating nor disturb the power system.
AYISI VALENTINE F17/8244/04 © 2009 13
2.2 Components of SCADA system
2.2.0 Introduction.
In order for the aforementioned functions to be achieved a clear understanding of the following
factors that relates to the components becomes critical:
I. Components capabilities and limitations
II. Functional and design features (definition and evaluation)
III. Environmental and functional requirements
IV. Operational timeline and resource utilization
V. Future functional expandability requirement
Generally there are three basic components of a SCADA system; they are:-
2.2.1 Remote terminal unit (RTU)
The remote terminal units (RTUs) read status and information from the power system process,
report changes and information to the central system and execute commands received from the
central system. They have developed in steps from pure hardware units to flexible
microprocessor based units. The basic feature which has made it possible to realize a remote
terminal unit is storage of data. The collected data may then be processed in different ways
leading to advanced RTUs in terms of functional content. The RTU may serve as a filter
performing functions which refine data aimed for the central system.
The acquisition and control normally found are:
• Collection of: indications, analog values and digital values
• Collection and accumulation of energy counting pulses
• Output of: On/Off controls, Increase/decrease controls, set point values
By using the basic features, data storage and data queuing more advanced functions can be
realized.
AYISI VALENTINE F17/8244/04 © 2009 14
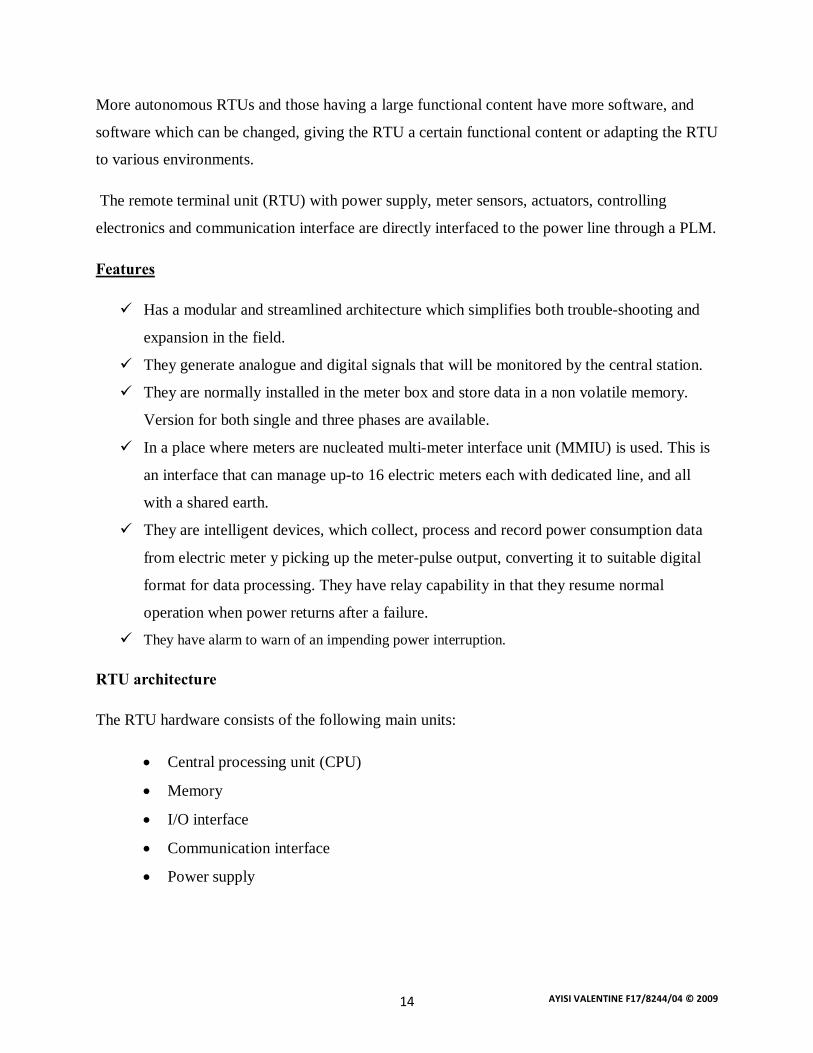
More autonomous RTUs and those having a large functional content have more software, and
software which can be changed, giving the RTU a certain functional content or adapting the RTU
to various environments.
The remote terminal unit (RTU) with power supply, meter sensors, actuators, controlling
electronics and communication interface are directly interfaced to the power line through a PLM.
Features
ü Has a modular and streamlined architecture which simplifies both trouble-shooting and
expansion in the field.
ü They generate analogue and digital signals that will be monitored by the central station.
ü They are normally installed in the meter box and store data in a non volatile memory.
Version for both single and three phases are available.
ü In a place where meters are nucleated multi-meter interface unit (MMIU) is used. This is
an interface that can manage up-to 16 electric meters each with dedicated line, and all
with a shared earth.
ü They are intelligent devices, which collect, process and record power consumption data
from electric meter y picking up the meter-pulse output, converting it to suitable digital
format for data processing. They have relay capability in that they resume normal
operation when power returns after a failure.
ü They have alarm to warn of an impending power interruption.
RTU architecture
The RTU hardware consists of the following main units:
• Central processing unit (CPU)
• Memory
• I/O interface
• Communication interface
• Power supply
AYISI VALENTINE F17/8244/04 © 2009 15
These units or hardware elements can be configured in various structures. The final structure
depends on the size of the RTU, as well as the requirements and functions implemented, i.e. the
actual use of the RTU.
Functional adaptability can be achieved as the functional content generally is determined only by
the software. Some RTU functions may require additional hardware, but a modularized concept
will support such configuration changes.
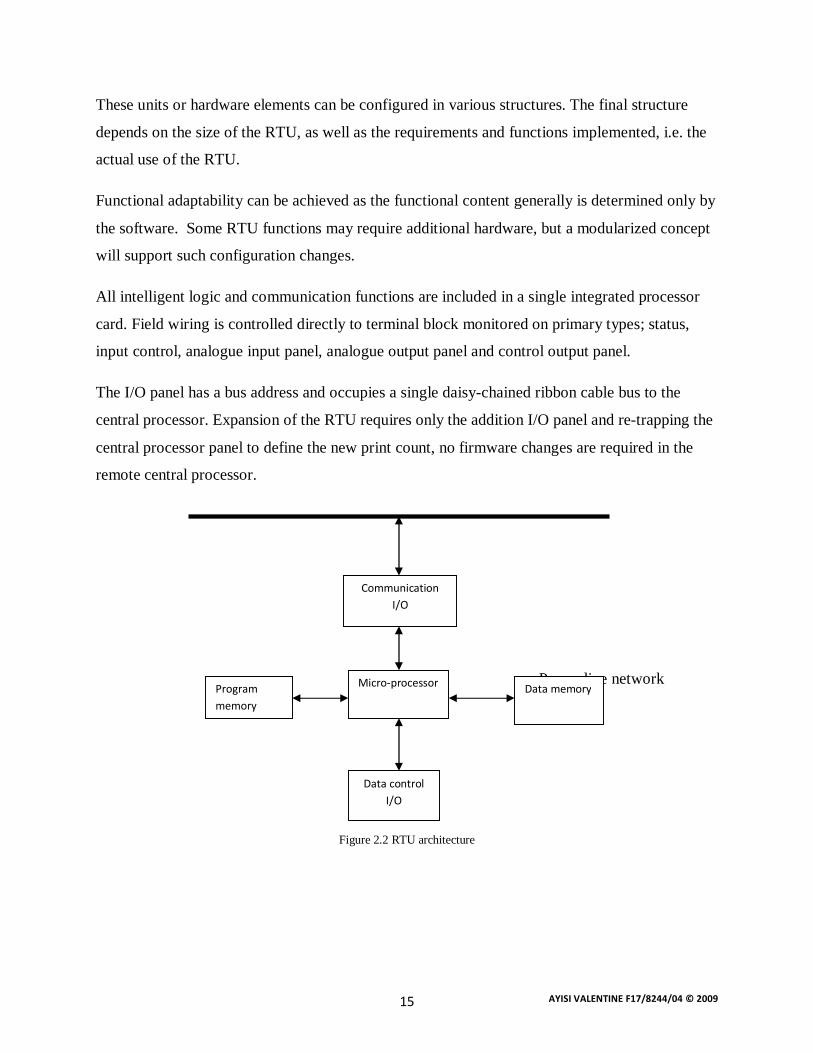
All intelligent logic and communication functions are included in a single integrated processor
card. Field wiring is controlled directly to terminal block monitored on primary types; status,
input control, analogue input panel, analogue output panel and control output panel.
The I/O panel has a bus address and occupies a single daisy-chained ribbon cable bus to the
central processor. Expansion of the RTU requires only the addition I/O panel and re-trapping the
central processor panel to define the new print count, no firmware changes are required in the
remote central processor.
Power line network
Figure 2.2 RTU architecture
Communication I/O
Micro-processor
Data control I/O
Data memory Program memory
AYISI VALENTINE F17/8244/04 © 2009 16
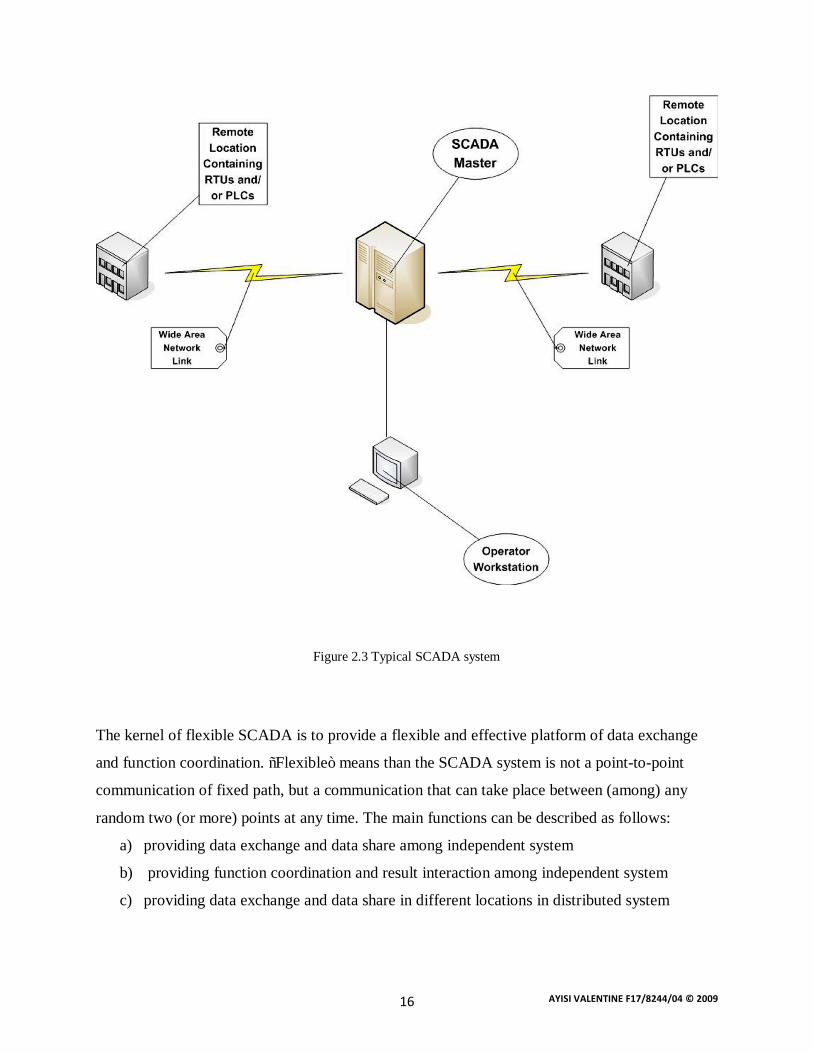
Figure 2.3 Typical SCADA system
The kernel of flexible SCADA is to provide a flexible and effective platform of data exchange
and function coordination. “Flexible” means than the SCADA system is not a point-to-point
communication of fixed path, but a communication that can take place between (among) any
random two (or more) points at any time. The main functions can be described as follows:
a) providing data exchange and data share among independent system
b) providing function coordination and result interaction among independent system
c) providing data exchange and data share in different locations in distributed system
AYISI VALENTINE F17/8244/04 © 2009 17
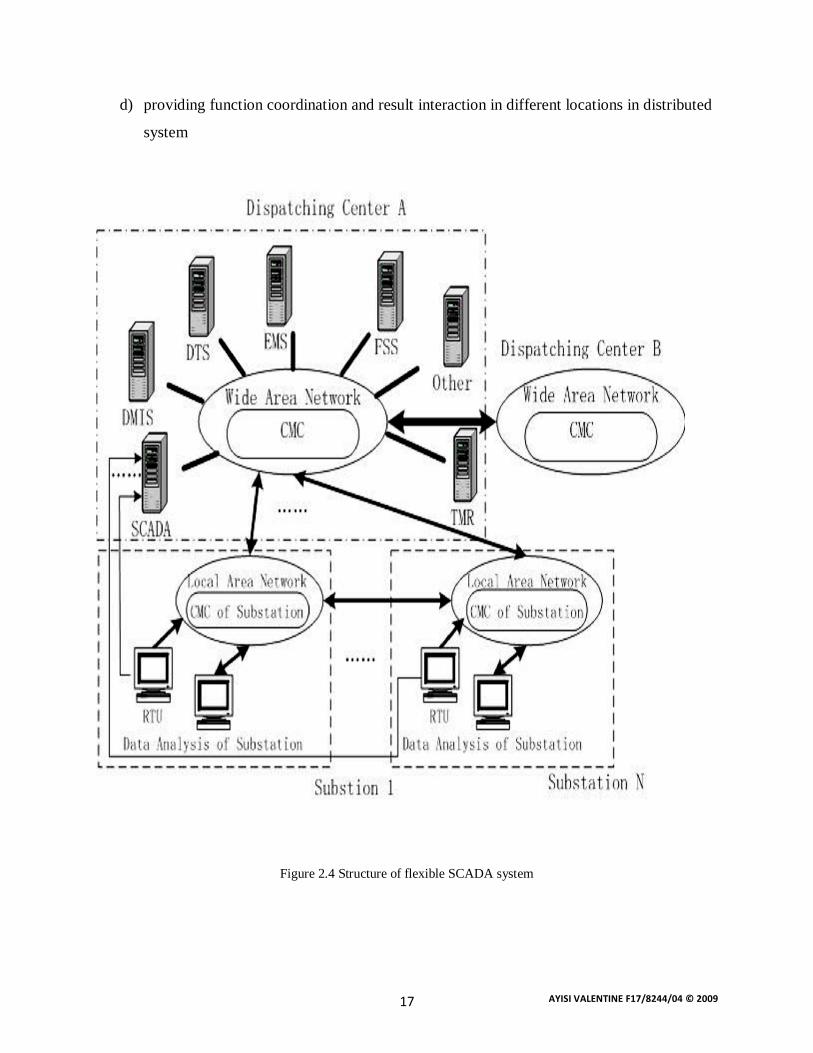
d) providing function coordination and result interaction in different locations in distributed
system
Figure 2.4 Structure of flexible SCADA system
AYISI VALENTINE F17/8244/04 © 2009 18
2.2.2 Communication network
The communications network is intended to provide the means by which data can be transferred
between the central host computer servers and the field-based RTUs. The
Communication Network refers to the equipment needed to transfer data to and from different
sites. The medium used can either be cable, telephone or radio.
The use of cable is usually implemented in a factory. This is not practical for systems covering
large geographical areas because of the high cost of the cables, conduits and the extensive labor
in installing them. The use of telephone lines (i.e., leased or dial-up) is a more economical
solution for systems with large coverage. The leased line is used for systems requiring on-line
connection with the remote stations. This is expensive since one telephone line will be needed
per site. Dial-up lines can be used on systems requiring updates at regular intervals (e.g., hourly
updates). Here ordinary telephone lines can be used. The host can dial a particular number of a
remote site to get the readings and send commands.
Remote sites are usually not accessible by telephone lines. The use of radio offers an economical
solution. Radio modems are used to connect the remote sites to the host. An on-line operation
can also be implemented on the radio system. For locations where a direct radio link cannot be
established, a radio repeater is used to link these sites.
Historically, SCADA networks have been dedicated networks; however, with the increased
deployment of office LANs and WANs as a solution for interoffice computer networking, there
exists the possibility to integrate SCADA LANs into everyday office computer networks.
The foremost advantage of this arrangement is that there is no need to invest in a separate
computer network for SCADA operator terminals. In addition, there is an easy path to integrating
SCADA data with existing office applications, such as spreadsheets, work management systems,
data history databases, Geographic Information System (GIS) systems, and water distribution
modeling systems.
AYISI VALENTINE F17/8244/04 © 2009 19
2.3 SCADA Protocols
In a SCADA system, the RTU accepts commands to operate control points, sets analog output
levels, and responds to requests. It provides status, analog and accumulated data to the SCADA
master station. The data representations sent are not identified in any fashion other than by
unique addressing. The addressing is designed to correlate with the SCADA master station
database. The RTU has no knowledge of which unique parameters it is monitoring in the real
world. It simply monitors certain points and stores the information in a local addressing scheme.
The SCADA master station is the part of the system that should “know” that the first status point
of RTU number 27 is the status of a certain circuit breaker of a given substation. This represents
the predominant SCADA systems and protocols in use in the utility industry today.
Each protocol consists of two message sets or pairs. One set forms the master protocol,
containing the valid statements for master station initiation or response, and the other set is the
RTU protocol, containing the valid statements an RTU can initiate and respond to.
In most but not all cases, these pairs can be considered a poll or request for information or action
and a confirming response.
The SCADA protocol between master and RTU forms a viable model for RTU-to- Intelligent
Electronic Device (IED) communications. Currently, in industry, there are several different
protocols in use. The most popular are International Electro-technical Commission (IEC) 60870-
5 series, specifically IEC 60870-5-101 (commonly referred to as 101) and Distributed Network
Protocol version 3 (DNP3).
2.3.1 IEC 60870-5-101
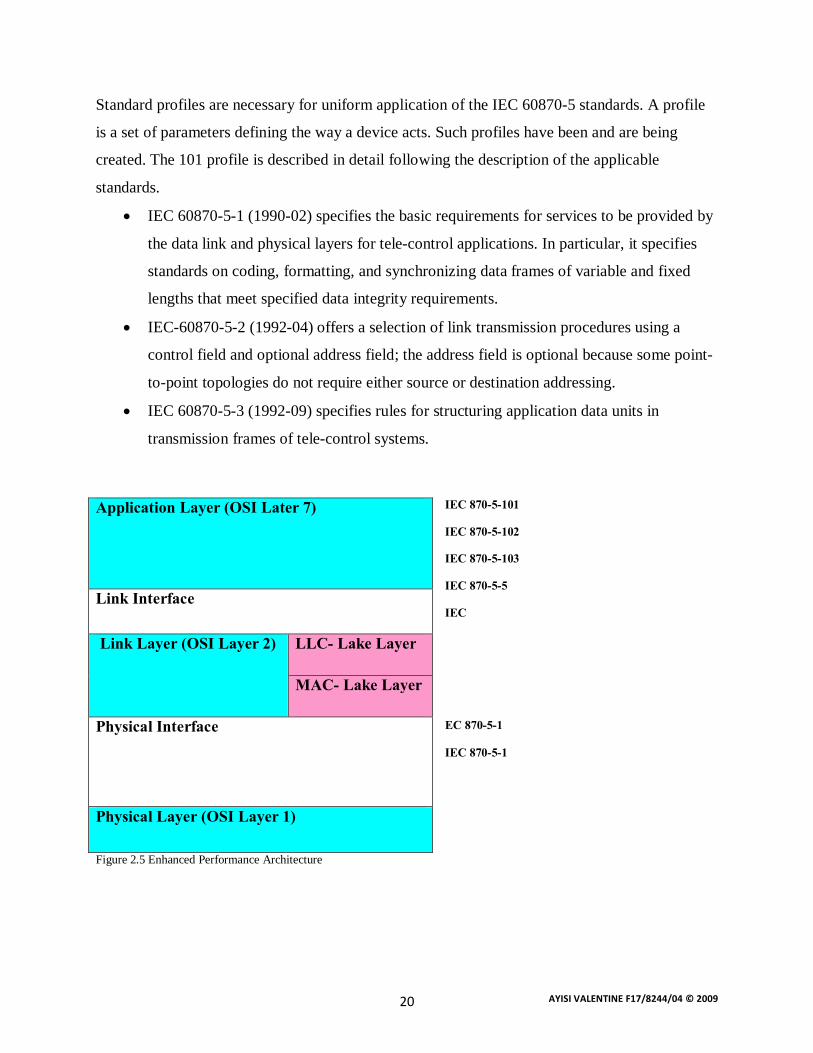
IEC 60870-5 specifies a number of frame formats and services that may be provided at different
layers. IEC 60870-5 is based on a three-layer Enhanced Performance
Architecture (EPA) reference model (see Figure 4.1) for efficient implementation within RTUs,
meters, relays, and other Intelligent Electronic Devices (IEDs). Additionally, IEC
60870-5 defines basic application functionality for a user layer, which is situated between the
Open System Interconnection (OSI) application layer and the application program.
This user layer adds interoperability for such functions as clock synchronization and file
transfers. The following descriptions provide the basic scope of each of the five documents in the
base IEC 60870-5 tele-control transmission protocol specification set.
AYISI VALENTINE F17/8244/04 © 2009 20
Standard profiles are necessary for uniform application of the IEC 60870-5 standards. A profile
is a set of parameters defining the way a device acts. Such profiles have been and are being
created. The 101 profile is described in detail following the description of the applicable
standards.
• IEC 60870-5-1 (1990-02) specifies the basic requirements for services to be provided by
the data link and physical layers for tele-control applications. In particular, it specifies
standards on coding, formatting, and synchronizing data frames of variable and fixed
lengths that meet specified data integrity requirements.
• IEC-60870-5-2 (1992-04) offers a selection of link transmission procedures using a
control field and optional address field; the address field is optional because some point-
to-point topologies do not require either source or destination addressing.
• IEC 60870-5-3 (1992-09) specifies rules for structuring application data units in
transmission frames of tele-control systems.
IEC 870-5-101
IEC 870-5-102
IEC 870-5-103
IEC 870-5-5
IEC
EC 870-5-1
IEC 870-5-1
Figure 2.5 Enhanced Performance Architecture
Application Layer (OSI Later 7)
Link Interface
Link Layer (OSI Layer 2) LLC- Lake Layer
MAC- Lake Layer
Physical Interface
Physical Layer (OSI Layer 1)
AYISI VALENTINE F17/8244/04 © 2009 21
These rules are presented as generic standards that may be used to support a great variety of
present and future tele-control applications. This section of IEC 60870-5 describes the general
structure of17 application data and basic rules to specify application data units without
specifying details about information fields and their contents.
• •IEC 60870-5-4 (1993-08) provides rules for defining information data elements and a
common set of information elements, particularly digital and analog process variables
that are frequently used in tele-control applications.
• IEC 60870-5-5 (1995-06) defines basic application functions that perform standard
procedures for tele-control systems, which are procedures that reside beyond layer 7
(application layer) of the ISO reference model. These utilize standard services of the
application layer. The specifications in IEC 60870-5-5 (1995-06) serve as basic standards
for application profiles that are then created in detail for specific tele-control tasks.
Each application profile will use a specific selection of the defined functions. Any basic
application functions not found in a standards document but necessary for defining certain tele-
control applications should be specified within the profile. Examples of such
Tele-control functions include station initialization, cyclic data transmission, and data acquisition
by polling, clock synchronization, and station configuration.
The Standard 101 Profile provides structures that are also directly applicable to the interface
between RTUs and IEDs. It contains all the elements of a protocol necessary to provide an
unambiguous profile definition so vendors may create products that interoperate fully.
2.3.2 DNP3 Protocols define the rules by which devices talk with each other, and DNP3 is a protocol for
transmission of data from point A to point B using serial communications. It has been
20 used primarily by utilities like the electric companies, but it operates suitably in other areas.
The DNP3 is specifically developed for inter-device communication involving SCADA
RTUs, and provides for both RTU-to-IED and master-to-RTU/IED. It is based on the three-layer
enhanced performance architecture (EPA) model contained in the IEC 60870- 5 standards, with
some alterations to meet additional requirements of a variety of users in the electric utility
industry.
AYISI VALENTINE F17/8244/04 © 2009 22
DNP3 was developed with the following goals:
• High data integrity. The DNP3 data link layer uses a variation of the IEC 60870-5-1
(1990-02) frame format FT3. Both data link layer frames and application layer messages may be
transmitted using confirmed service.
• Flexible structure. The DNP3 application layer is object-based, with a structure that
allows a range of implementations while retaining interoperability.
• Multiple applications. DNP3 can be used in several modes, including:
1. Polled only
2. Polled report-by-exception
3. Unsolicited report-by-exception (quiescent mode)
4. Mixture of modes 1. Through 3
It can also be used with several physical layers, and as a layered protocol is suitable for operation
over local and some wide area networks.
• Minimized overhead. DNP3 was designed for existing wire-pair data links with operating
bit rates as low as 1200 bit/s and attempts to use a minimum of overhead while retaining
flexibility. Selection of a data reporting method, such as report-by exception, further
reduces overhead.
• Open standard. DNP3 is a non-proprietary, evolving standard controlled by a users group
whose members include RTU, IED, and master station vendors, and representatives of
the electric utility and system consulting community.
A typical organization may have a centralized operations center that monitors the state of all the
equipment in each of its substations. In the operations center, a computer stores all of the
incoming data and displays the system for the human operators. Substations have many devices
that need monitoring (are circuit breakers opened or closed?), current sensors (how much current
is flowing?) and voltage transducers (what is the line potential?). That only scratches the surface;
a utility is interested in monitoring many parameters, too numerous to discuss here. The
operations personnel often need to switch sections of the power grid into or out of service. One
or more computers are situated in the substation to collect the data for transmission to the master
station in the operations center. The substation computers are also called upon to energize or de-
energize the breakers and voltage regulators.
AYISI VALENTINE F17/8244/04 © 2009 23
CHAPTER 3
METHODOLOGY
3.0 General Scope and Performance Requirements
3.1 General
This section describes the SCADA and Telecommunication system supplied to K.P.L.C. The
intent of the specification is to fully describe KPLC’s needs for the SCADA and
telecommunication system. The telecommunication system supplied satisfies KPLC’s
communication requirements for operational purposes i.e. for operational telephony and SCADA
data transmission. It consists of power line carrier (PLC), fibre optic and radio links together
with all telephone and data transmission equipment required.
Present hierarchical structure of network supervision
Real time control of the electrical network in Kenya is hierarchically structured and basically consists of
three levels.
3.1.1 Level 1: The entire 220 and 132 kV transmission system is supervised from the National
Control Centre (NCC). At 220/132 kV, 220/66 kV and 132/66kV substations the NCC also
controls the 66kV bus bar voltage. In the case of SCADA system disturbances, the 220kV and
132kV substations can also be controlled from the RCCs. The NCC located at Juja road in
Nairobi is responsible for operation of the Kenyan power system as a whole. Specifically it is
responsible for:
• Long, medium and short term planning of the future operation of the power system
• Proper function and administration of the power system
• Control and monitoring of the entire transmission and distribution networks
• Voltage control in the 220kV, 132kV network and the voltages at the in-feed points to the
66kV and 33kV networks (bus voltages)
• Security analysis of the overall network and applying control actions that achieve the
goal of the system security and economy
AYISI VALENTINE F17/8244/04 © 2009 24
• Supervision and monitoring of system and frequency and initiating corrective measures
as necessary
• Determination of spinning reserve for large and medium size power system
• Monitoring the 132kV DC tie line and control of the power purchase from Uganda
• Analysis of outages affecting the power system and equipment
• Preparation of system operation statistics
3.1.2 Level 2: Regional Control Centers
Presently four regional control centers from the second level of dispatching are sub-ordinated to
the NCC. The transmission and distribution networks starting from 66kV down to 11kV is
monitored and controlled by the respective RCCs. They are responsible for:
• The controlling and monitoring of the 66kV and 33kV substations forming the
interconnection points of the transmission network to the distribution system
• Regulation of 11kV voltage in the 66kV and 33kV substations
• Load management on the 66kV, 33kV and 11kV distribution networks
• Co-ordination of switching operations with big industrial plants owning the feeding
substations
3.1.3 Level 3: in the hierarchical structure are the load substation (KenGen or IPPs) but
important information are acquired by the network control centers.
3.2 Existing operational facilities
The facilities for operation of the network of the network at these 3 levels consisting consist of:
• The National Control Center
• Four regional control centers (RCCs) and
• The control and monitoring equipment at the substation
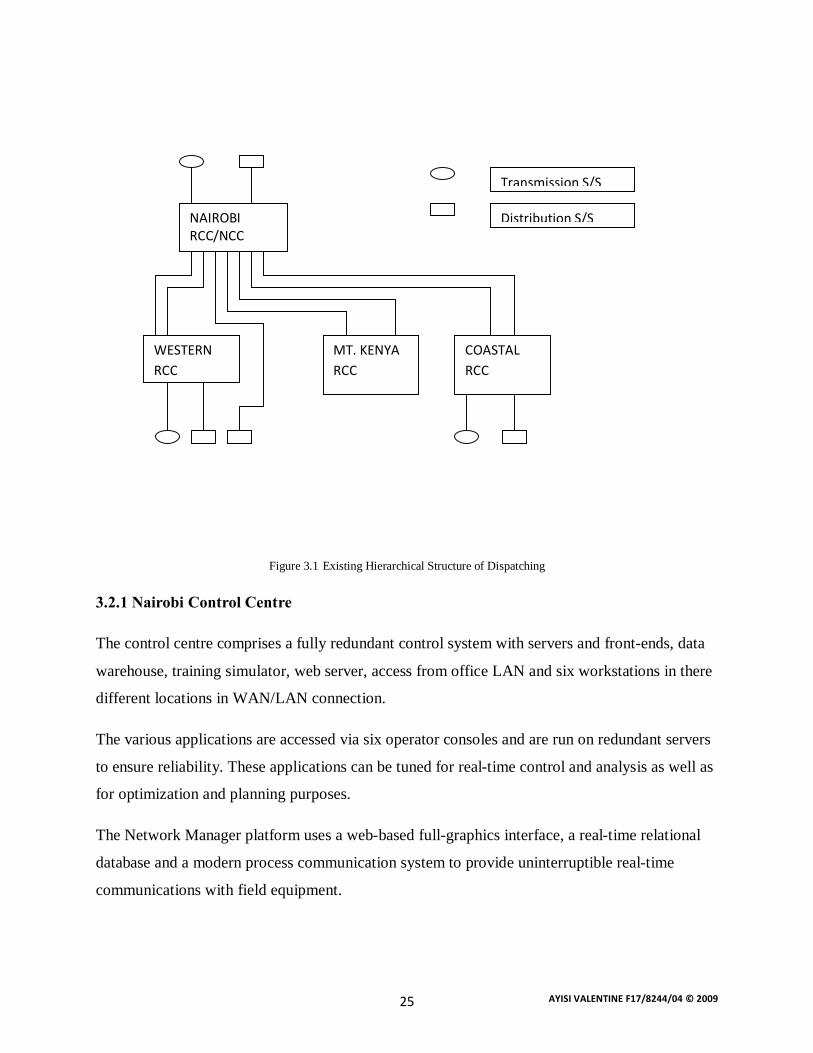
Figure 3.1 shows the levels in the operational hierarchical and the existing control centers with
their interconnections.
AYISI VALENTINE F17/8244/04 © 2009 25
Figure 3.1 Existing Hierarchical Structure of Dispatching
3.2.1 Nairobi Control Centre
The control centre comprises a fully redundant control system with servers and front-ends, data
warehouse, training simulator, web server, access from office LAN and six workstations in there
different locations in WAN/LAN connection.
The various applications are accessed via six operator consoles and are run on redundant servers
to ensure reliability. These applications can be tuned for real-time control and analysis as well as
for optimization and planning purposes.
The Network Manager platform uses a web-based full-graphics interface, a real-time relational
database and a modern process communication system to provide uninterruptible real-time
communications with field equipment.
NAIROBI RCC/NCC
COASTAL RCC
MT. KENYA RCC
WESTERN RCC
Transmission S/S
Distribution S/S
AYISI VALENTINE F17/8244/04 © 2009 26
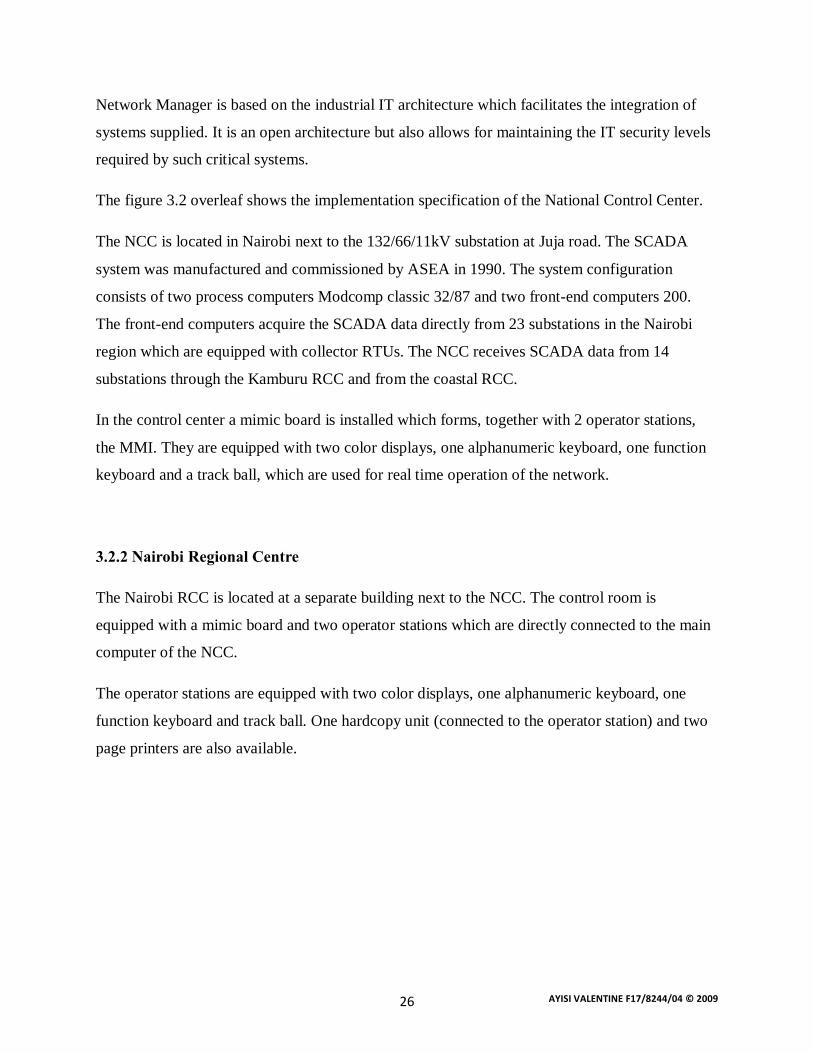
Network Manager is based on the industrial IT architecture which facilitates the integration of
systems supplied. It is an open architecture but also allows for maintaining the IT security levels
required by such critical systems.
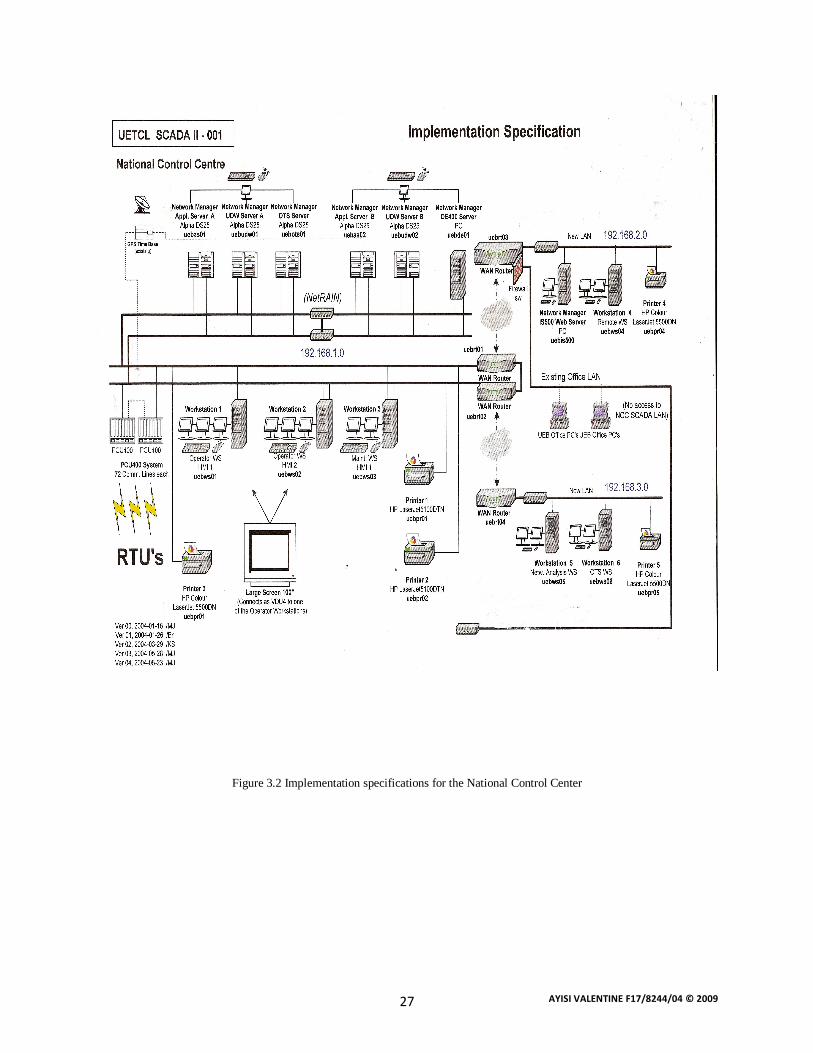
The figure 3.2 overleaf shows the implementation specification of the National Control Center.
The NCC is located in Nairobi next to the 132/66/11kV substation at Juja road. The SCADA
system was manufactured and commissioned by ASEA in 1990. The system configuration
consists of two process computers Modcomp classic 32/87 and two front-end computers 200.
The front-end computers acquire the SCADA data directly from 23 substations in the Nairobi
region which are equipped with collector RTUs. The NCC receives SCADA data from 14
substations through the Kamburu RCC and from the coastal RCC.
In the control center a mimic board is installed which forms, together with 2 operator stations,
the MMI. They are equipped with two color displays, one alphanumeric keyboard, one function
keyboard and a track ball, which are used for real time operation of the network.
3.2.2 Nairobi Regional Centre
The Nairobi RCC is located at a separate building next to the NCC. The control room is
equipped with a mimic board and two operator stations which are directly connected to the main
computer of the NCC.
The operator stations are equipped with two color displays, one alphanumeric keyboard, one
function keyboard and track ball. One hardcopy unit (connected to the operator station) and two
page printers are also available.
AYISI VALENTINE F17/8244/04 © 2009 27
Figure 3.2 Implementation specifications for the National Control Center
AYISI VALENTINE F17/8244/04 © 2009 28
3.2.3 Mount Kenya Regional Center
The Kamburu RCC is located on the third floor of hydro power plant of Kamburu. The KenGen
operators are supervising the region from two SINDAC operator stations as well as from control
panels from the 132/33 kV substations Kiganjo and Nanyuki. The master station is also located
at Kamburu power station and is connected to the substations with 33 RTUs in the Mt Kenya
region.
3.2.4 Coastal Regional Centre
The coastal RCC is located at the control room of Rabai 220/132 kV substation. The SCADA
system consists of two process computers and two front-end computers. The front-end computers
receive the process data directly from 8 substations equipped with RTUs.
At the control room one operator station with one color display, one alphanumeric keyboard, one
function keyboard and track ball are installed. Two pose printers are also in the station control.
3.2.5 Western Region Regional Center
The master station at the western RCC is connected to 4 substations in the western region of
Kenya where 33 RTUs are installed. These 132/33 kV substations are Musaga, Chemosit,
Eldoret and Kisumu. The data from 220/11 kV substations and Turkwel power station are
transmitted to the RCC through a PLC concentrator. The control and monitoring panels for
220/132/33 kV for Lessos are also installed.
AYISI VALENTINE F17/8244/04 © 2009 29
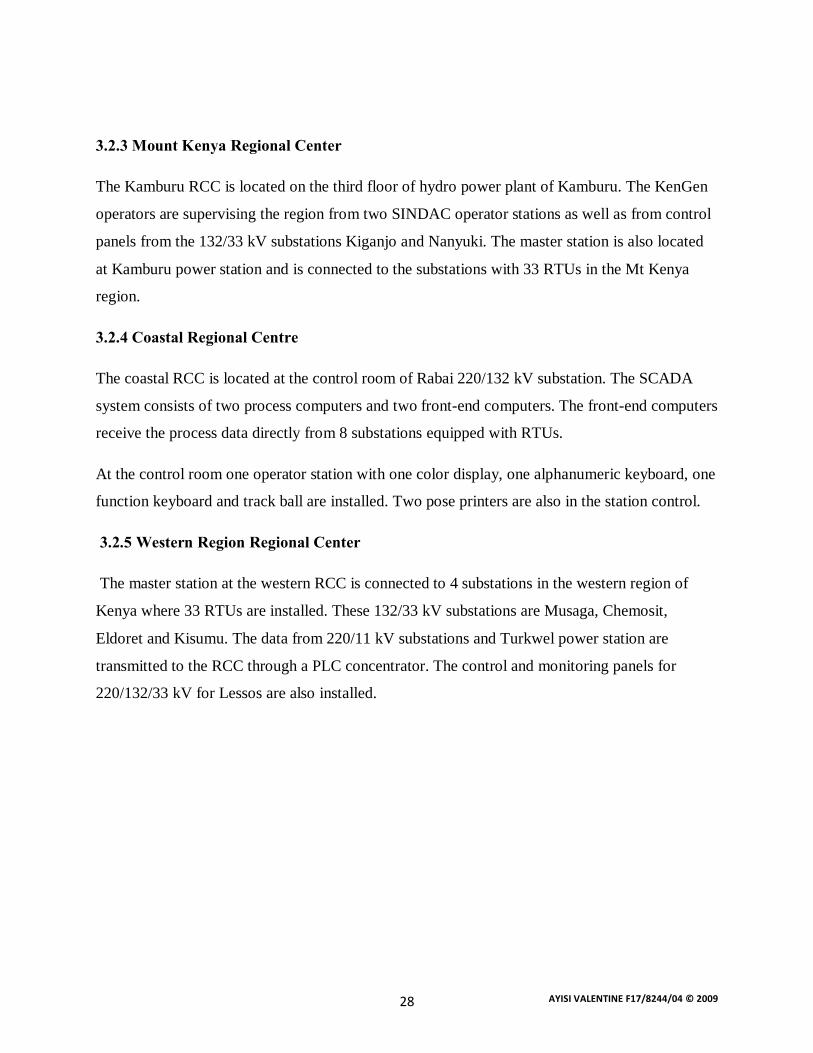
3.3 Typical Control room Layout
Figure 3.3 shows the layout of a typical control room
Figure 3.3 Typical layout of the computer control room
AYISI VALENTINE F17/8244/04 © 2009 30
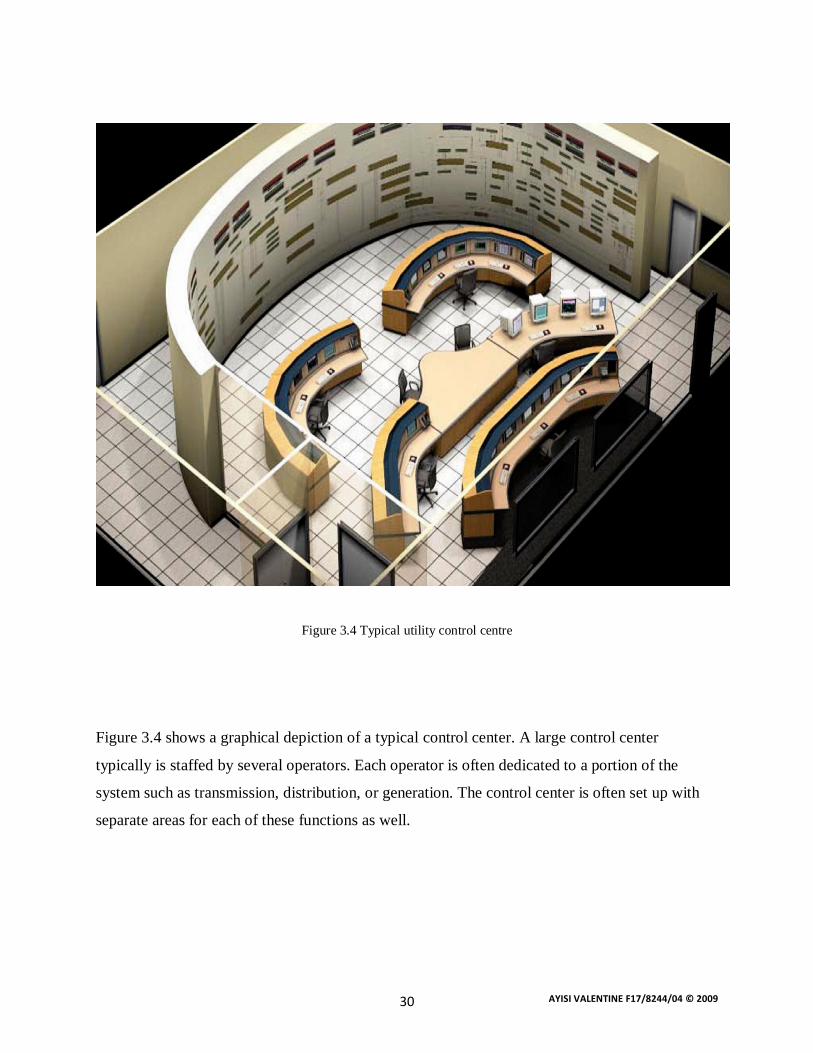
Figure 3.4 Typical utility control centre
Figure 3.4 shows a graphical depiction of a typical control center. A large control center
typically is staffed by several operators. Each operator is often dedicated to a portion of the
system such as transmission, distribution, or generation. The control center is often set up with
separate areas for each of these functions as well.

AYISI VALENTINE F17/8244/04 © 2009 31
The horseshoe control room layout is designed so that anyone in the center can see all the
screens. Operators at any of the operator displays should be able to view the entire control
room’s screens without undue difficulty as well.
Similar areas in the system that are being monitored should be situated close together to avoid
unnecessary movement by the operators to see what is going on.
3.4 Planned Electrical System in Kenya
Kenya has an area of 580,400 km2 and a population of around 31.5 million. It shares its borders
with Somalia, Ethiopia, Sudan, Uganda and Tanzania but has a high voltage connection to
Uganda only. A feasibility study jointly initiated by the governments of Kenya and Tanzania and
aimed at importing power from the South African Power Pool recommended another high
voltage connection with Tanzania.
This section of the design report gives a short overview of the power sector in Kenya with the
purpose of identifying the network to be supervised and determining the operational
requirements to be fulfilled by the SCADA system. The review of the existing power system
analyses the:
• Past, present and expected future power and energy demand in the country,
• Sources of electric power generation in Kenya and the import and export of energy, and
• The existing and planned transmission and distribution networks and facilities in order to
assess the importance of a secure energy supply and the necessity of power application and
energy management functions for the transmission system.
AYISI VALENTINE F17/8244/04 © 2009 32
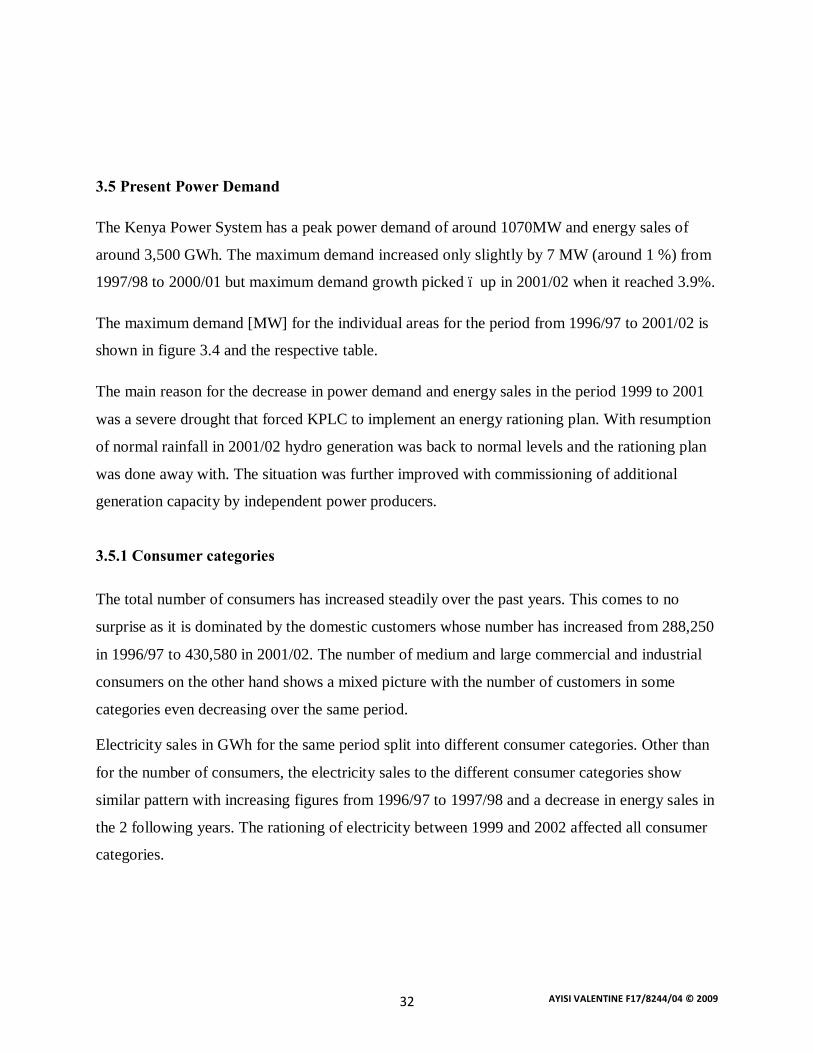
3.5 Present Power Demand
The Kenya Power System has a peak power demand of around 1070MW and energy sales of
around 3,500 GWh. The maximum demand increased only slightly by 7 MW (around 1 %) from
1997/98 to 2000/01 but maximum demand growth picked – up in 2001/02 when it reached 3.9%.
The maximum demand [MW] for the individual areas for the period from 1996/97 to 2001/02 is
shown in figure 3.4 and the respective table.
The main reason for the decrease in power demand and energy sales in the period 1999 to 2001
was a severe drought that forced KPLC to implement an energy rationing plan. With resumption
of normal rainfall in 2001/02 hydro generation was back to normal levels and the rationing plan
was done away with. The situation was further improved with commissioning of additional
generation capacity by independent power producers.
3.5.1 Consumer categories
The total number of consumers has increased steadily over the past years. This comes to no
surprise as it is dominated by the domestic customers whose number has increased from 288,250
in 1996/97 to 430,580 in 2001/02. The number of medium and large commercial and industrial
consumers on the other hand shows a mixed picture with the number of customers in some
categories even decreasing over the same period.
Electricity sales in GWh for the same period split into different consumer categories. Other than
for the number of consumers, the electricity sales to the different consumer categories show
similar pattern with increasing figures from 1996/97 to 1997/98 and a decrease in energy sales in
the 2 following years. The rationing of electricity between 1999 and 2002 affected all consumer
categories.
AYISI VALENTINE F17/8244/04 © 2009 33
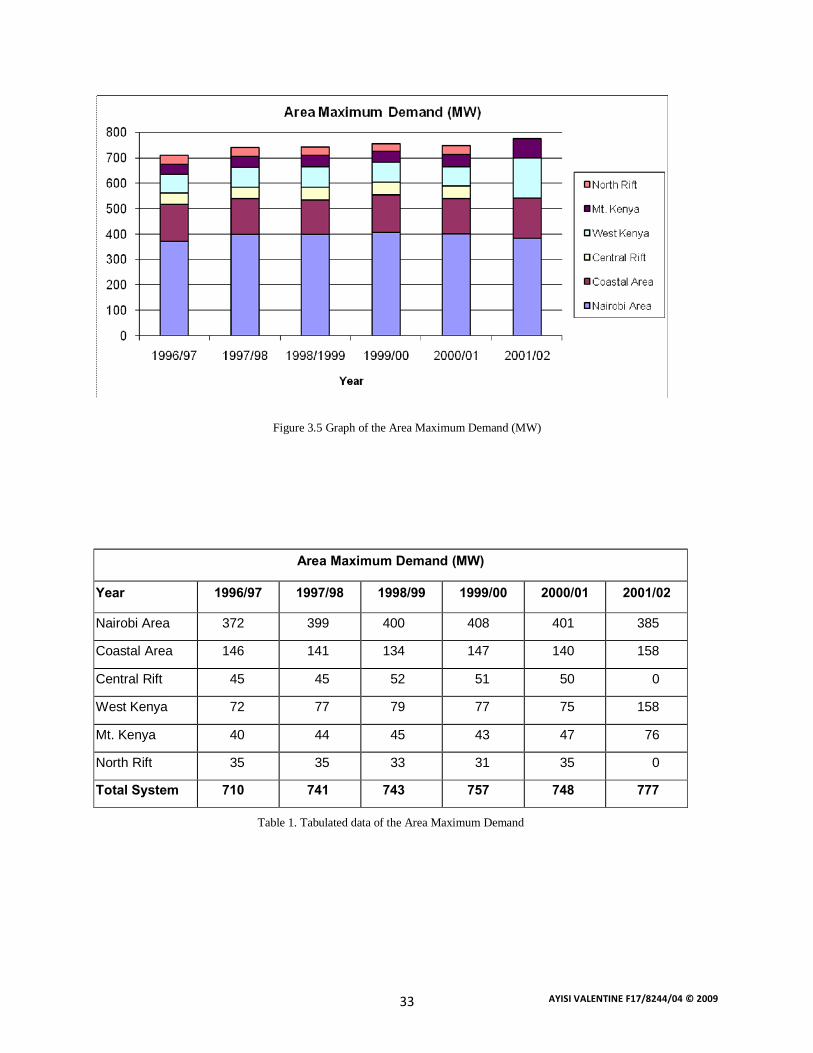
Figure 3.5 Graph of the Area Maximum Demand (MW)
Area Maximum Demand (MW)
Year 1996/97 1997/98 1998/99 1999/00 2000/01 2001/02
Nairobi Area 372 399 400 408 401 385
Coastal Area 146 141 134 147 140 158
Central Rift 45 45 52 51 50 0
West Kenya 72 77 79 77 75 158
Mt. Kenya 40 44 45 43 47 76
North Rift 35 35 33 31 35 0
Total System 710 741 743 757 748 777
Table 1. Tabulated data of the Area Maximum Demand

AYISI VALENTINE F17/8244/04 © 2009 34
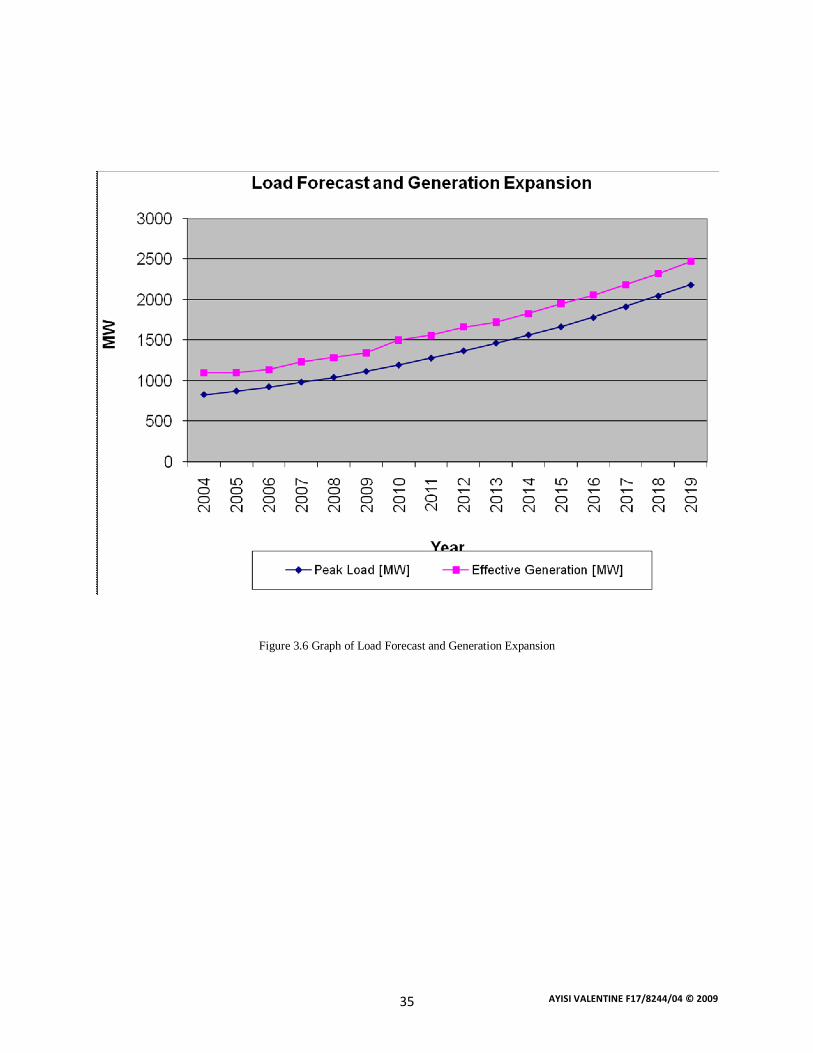
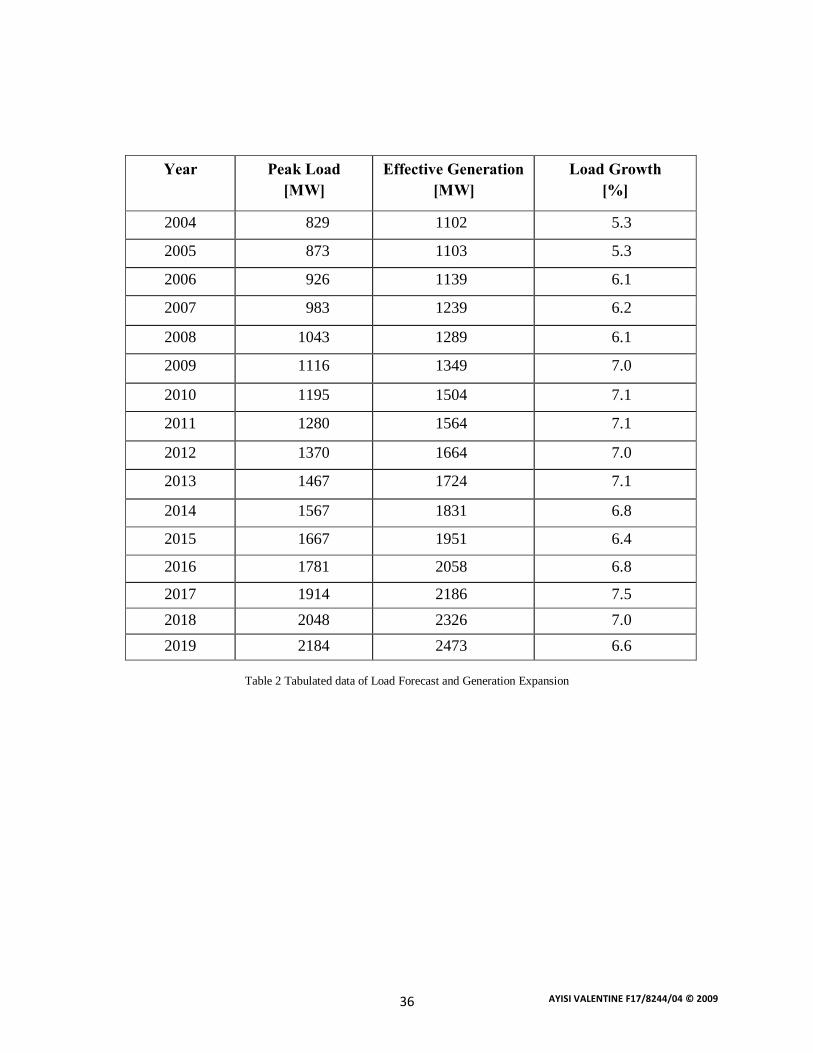
3.6 Load Forecast
LF, Load Forecast is a tool for predicting the total system electrical load with a variable time
resolution.
LF is used in both production and transmission utilities for planning purposes. The forecast is
presented both in the form of curves, according to the figure 3.5 and in tabular form. An accurate
LF function is a prerequisite for an optimal production planning procedure. The load forecast for
the next 15 years derives from the recommended generation and transmission expansion program
for Kenya. The table only indicates the additional generation and the transmission lines required
to connect the new power stations to the network. It does, however, not show the additional
transmission lines and substations (or substation extensions) within the transmission and sub-
transmission networks required to transfer the additional power to the consumers.
According to this load forecast, the peak load in Kenya will increase from 829 MW in 2004 to
2184 MW in 2019.
AYISI VALENTINE F17/8244/04 © 2009 35
Figure 3.6 Graph of Load Forecast and Generation Expansion
AYISI VALENTINE F17/8244/04 © 2009 36
Table 2 Tabulated data of Load Forecast and Generation Expansion
Year Peak Load [MW]
Effective Generation [MW]
Load Growth [%]
2004 829 1102 5.3
2005 873 1103 5.3
2006 926 1139 6.1
2007 983 1239 6.2
2008 1043 1289 6.1
2009 1116 1349 7.0
2010 1195 1504 7.1
2011 1280 1564 7.1
2012 1370 1664 7.0
2013 1467 1724 7.1
2014 1567 1831 6.8
2015 1667 1951 6.4
2016 1781 2058 6.8
2017 1914 2186 7.5 2018 2048 2326 7.0 2019 2184 2473 6.6
AYISI VALENTINE F17/8244/04 © 2009 37
3.6.1 Power Transmission System
The Kenyan power transmission system is sub-divided into four Regions:
• The Nairobi Region covers the electrical network of the capital of Kenya and its surroundings
representing approximately 50% of the total load of Kenya. The HV network consists of
220 kV and 132 kV transmission lines and substations feeding, via a meshed 66 kV sub-
transmission system, the 11 kV distribution network.
• The Western Region represents approximately 20% of the total load in Kenya and the HV
transmission network mainly consists of 220/132 kV transmission lines and substations
feeding the 33 kV and 11 kV sub-transmission and distribution networks.
• The Mt Kenya region represents approx. 10% of Kenya’s total load and has a 132kV network
feeding the consumers via 33kV and 11kV distribution networks.
• The Coastal Regional represents approximately 20% of the total load. The HV 220 kV and
132 kV transmission network feeds the 33 kV and 11 kV distribution systems.
The above HV networks are interconnected into a single 220 kV and 132 kV transmission grid
which is in turn interconnected to Uganda grid at Tororo by a 132 kV double circuit line from
Lessos via Musaga.
AYISI VALENTINE F17/8244/04 © 2009 38
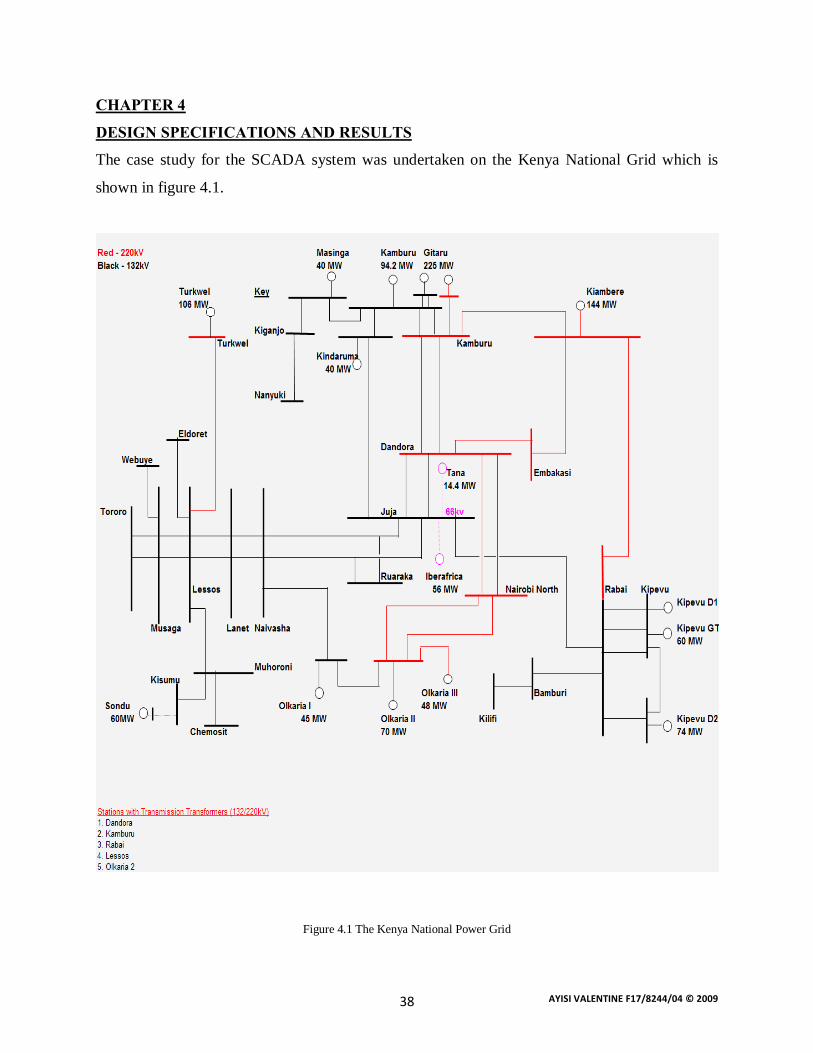
CHAPTER 4
DESIGN SPECIFICATIONS AND RESULTS
The case study for the SCADA system was undertaken on the Kenya National Grid which is
shown in figure 4.1.
Figure 4.1 The Kenya National Power Grid
AYISI VALENTINE F17/8244/04 © 2009 39
4.1 Data Acquisition
The functions to be performed by the SCADA system are described in detail in this section.
Real time data is collected from the following sources for use by the SCADA system.
v Contractor supplied RTUs
23 existing RTUs communicate with the SCADA system through dedicated data channels. They
have single and double pole status, analog and pulse accumulator inputs as well as supervisory
control outputs for switching of circuit breakers and isolators as well as raise/lower controls for
tap changing transformers.
v Contractor Supplied local RTUs
1 new contractor supplied local RTU and 1 re-used RTU at the NCC are located at the
computer room for training, maintenance and testing purposes. Spare RTUs are provided and
installed with simulation tools to simulate process inputs and outputs.
v Calculated data
These are generated by programs that periodically calculate database values. The calculated data
may be generated by programs that are part of the data acquisition function or other application
functions. It may be analog or discrete in nature
v Non-telemetered data entered by operator
These data may be analog or discrete in nature and are similar in all aspects to data collected
from RTUs.
AYISI VALENTINE F17/8244/04 © 2009 40
4.1.1 RTU data
Any RTU data may collect data from more than one substation or a substation may have more
than one RTU. All alarm and events messages generated by the SCADA system provide the
name of the substation and bay from which the data originated.
Periodic scans: it is possible to assign each telemetered point to one or more scan groups. Data is
collected from the RTU by specifying the scan group.
Demand scans: the SCADA system is able to collect any and all status and analog values from
any RTU on a non-periodic basic.
Calibration, maintenance and test: the operator is able to declare any RTU in the test mode for
purposes of calibration, maintenance or testing.
Telemetry failure and delete from scan: if valid data are not received from an RTU in response to
a scan command, another scan request for data from that source is issued
4.1.2 Data Processing
The SCADA system prepares all data it acquires for use by the display, control and application
functions.
Analog data: each analog point scanned by the SCADA system is connected to engineering units
before being stored in the database.
Quality markers: the system provides for a number of quality markers with each item of
measurement data.
Zero range: the system provides for the specification of an adjustable zero range for each item of
measurement data.
Data validity tests: data validity tests are performed every five minutes and on demand. It
generates an alarm when the data changes from valid to invalid.
AYISI VALENTINE F17/8244/04 © 2009 41
MVA and current calculations: MVA values are calculated for designated transformers or other
equipment. Current calculations are carried out for each end of designated lines, for transformers
and for other devices.
Alarming: For every changed status the system determines if an acknowledgment is required
from a user and, if so, it leads the user through appropriate sequence of menus and pictures to the
point at which the acknowledgment can be made. For a switch status change the system shall
proceed as follows:
• Un-commanded changes in switching state, changes in tele-metered and calculated
discrete points are alarmed. The alarm message includes:
ü Time of detection
ü Station name
ü Point name
ü Description of the field action that took place
ü Current state name
4.2 Topology Processor
The network topology processor analyzes the open/closed status of network switching devices,
such as breakers, and disconnections in order to define the configuration of the grid network for
display and the projection screen. Invalid data is indicated with a question mark. User entered
data is handled as valid information. The configuration is re-evaluated and updated after an
adjustable time delay following a change-of-state of a switching device and is also executed on
demand.
4.3 Data dissemination
The SCADA system provides the ability to transmit and receive data to and from control centers
and other computer systems e.g. metering data processing, settlement system etc. regardless of
the source of the source of the data, the frequency of its collection, or the means used to store it
in database.
AYISI VALENTINE F17/8244/04 © 2009 42
4.4 Supervisory Control
The operator is able to control the operation of switching devices connected to the RTUs. The
switching devices that can be controlled from any particular console are determined by the
partitions assigned to that console.
Security: the system provides a comprehensive range of mechanisms designed to prevent or
minimize the risk of damage to personnel and network equipment.
Single controls: the operator is able to select and operate any controllable switching device.
Control sequences: the system offers functions for optimization of complex switching operations
such as feeders, step-by-step dialog, where the all necessary single control operations are
initiated automatically by the system.
4.5 Information storage and retrieval
Data is collected and stored periodically and in response to power system disturbances. The data
consists of accumulator, analog and status point values that are manually entered tele-metered
and calculated together with their associated quality codes.
Journaling: it is provided to capture SCADA system data in to a journal file for later retrieval.
Data from the previous two years is stored and available online.
Archive manager and storage: the SCADA system includes an archive manager to manage the
storage and retrieval of data residing in both online and offline storage.
4.6 Man Machine Interface (MMI)
The principle interface between the user and the SCADA system is the consoles. A mechanism
for defining and controlling user access to the SCADA system at each console is provided. It has
a default mode which enables predefined access from each console. A password security feature
is provided that permits only authorized users to access it.
AYISI VALENTINE F17/8244/04 © 2009 43
4.7 Alarms and events
All alarms and events are presented to the operator in a consistent manner and are recorded in the
form of a message. The message is a single line of unabbreviated text that describes the
appearance:
ü Every alarm is displayed in graphical symbol, and has an audible annunciation
and is recorded as a message
ü Group alarms are displayed as a graphical symbol, but do not need extra audible
annunciation and documentation
ü Every event is recorded in a text message
4.7.1 Alarm Presentation
An intelligent alarm system guides the operator using a top-down hierarchy of signaling to the
most important starting place of the disturbance. A basic signaling window is presented on every
screen during real time operation. It is not possible to be removed from the screen.
Basic Signaling window
A basic signaling window is presented on every screen during real time operation. It is not
possible to be removed from the screen. The basic signaling display is configurable and in
general contains only a small number of buttons to select the following functions or displays:
• Power system overview displays
• SCADA system configuration display
• Network overview diagrams.
If the basic signaling display is totally or partially covered by another window, an alarm appears
(e.g. a button starts flashing) then, the basic signaling display is put at the front automatically
The flashing buttons indicate the affected areas. Starting at this point, the operator is guided to
the displays containing detailed information about the alarms.
AYISI VALENTINE F17/8244/04 © 2009 44
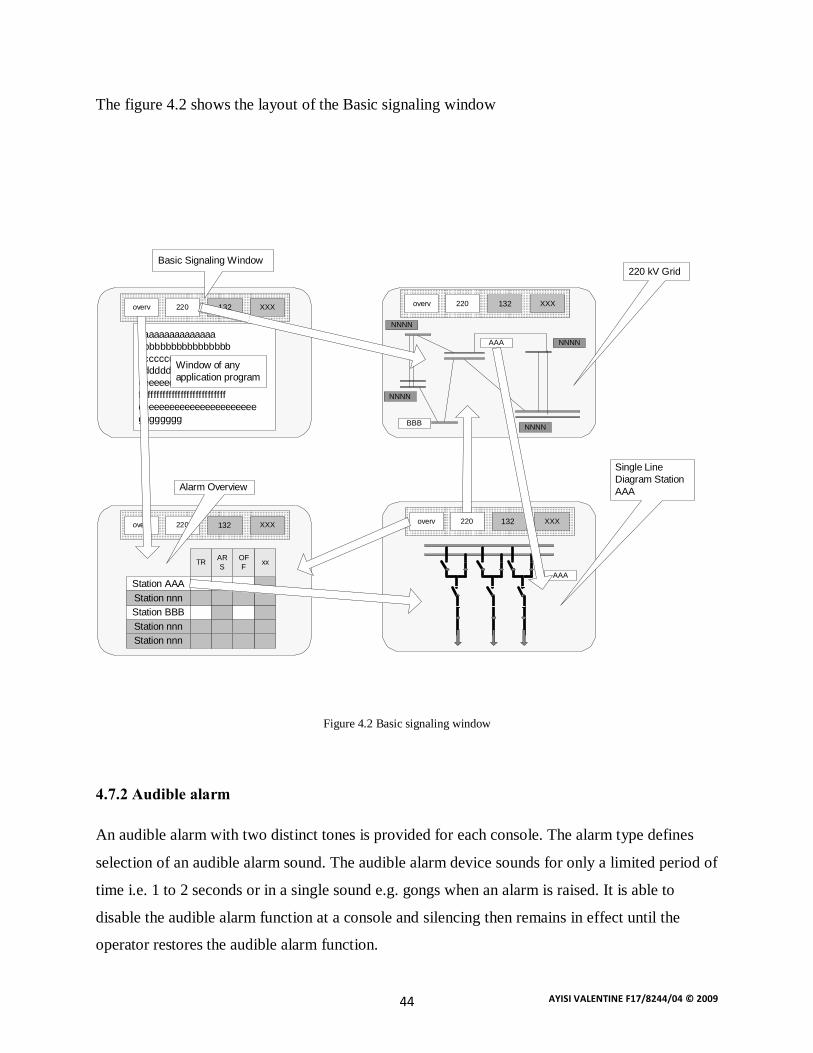
The figure 4.2 shows the layout of the Basic signaling window
aaaaaaaaaaaaaaabbbbbbbbbbbbbbbbbccccccccccccccccccccdddddddddddeeeeeeeeeeeeeeeeeeefffffffffffffffffffffffffffffeeeeeeeeeeeeeeeeeeeeeeegggggggg
NNNN
NNNN
BBB NNNN
AAA
NNNN
Station AAA
Station nnnStation nnnStation BBBStation nnn
TR xxOFF
ARS
AAA
220 110 XXXoverv
220 110 XXXoverv
220 110 XXXoverv
220 110 XXXoverv
Basic Signaling Window
Window of anyapplication program
Single LineDiagram StationAAAAlarm Overview
220 kV Grid
132132
132 132
Figure 4.2 Basic signaling window
4.7.2 Audible alarm
An audible alarm with two distinct tones is provided for each console. The alarm type defines
selection of an audible alarm sound. The audible alarm device sounds for only a limited period of
time i.e. 1 to 2 seconds or in a single sound e.g. gongs when an alarm is raised. It is able to
disable the audible alarm function at a console and silencing then remains in effect until the
operator restores the audible alarm function.
AYISI VALENTINE F17/8244/04 © 2009 45
4.7.3 Alarm inhibit/enable
Inhibiting alarms for a value or device causes all alarm processing of that value or device
continues and the database is updated. Alarm inhibiting causes the SCADA system to:
• Cease all further alarm annunciation for the value or device including symbol flashing
or highlighting
• Present a quality code next to the value or device on every display and hardcopy
containing the item in alarm.
4.8 Displays
It is possible to present any item in the database on any display. All supervisory control and data
control capabilities are supported from any window of a world co-ordinate space. Revise status
are displayed using combinations of symbols, control, descriptions and blinking.
4.8.1 Display features
Each display includes a heading at the top of the display consisting of a title showing, the
unabbreviated name of the display. When a display is larger than the screen being viewed, a
navigator window appears with the display. Movement, using the mouse, of this indicator in the
navigation window causes a corresponding change in the content of the window currently in use.
The engineer has the right to review the format and content of all displays supplied by the
contractor. The engineer has the approval rights for the displays developed by the operator.
The system comprises a graphical data engineering tool which makes it possible to define
objects, topology and pictures in a single straightforward operation. Topology is defined by
simply connecting the graphical symbols representing electrical objects with each other-drawing
it the way it looks.
It is possible to automatically generate pictures from the graphical representation in the data
engineering tool without the need for a separate tool. This is particularly useful when upgrading
the system from an existing database.
AYISI VALENTINE F17/8244/04 © 2009 46
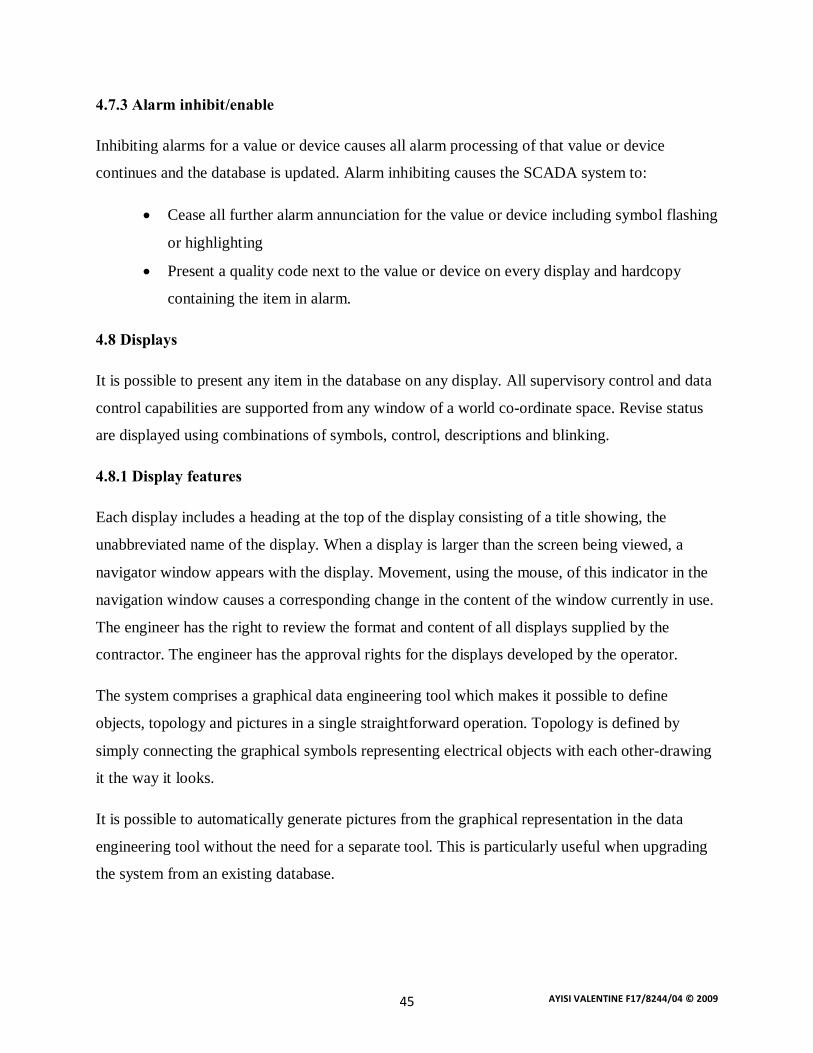
RESULTS
On running the system in the presence of the operators the following displays appeared.
Figure 4.3 Dandora substation display
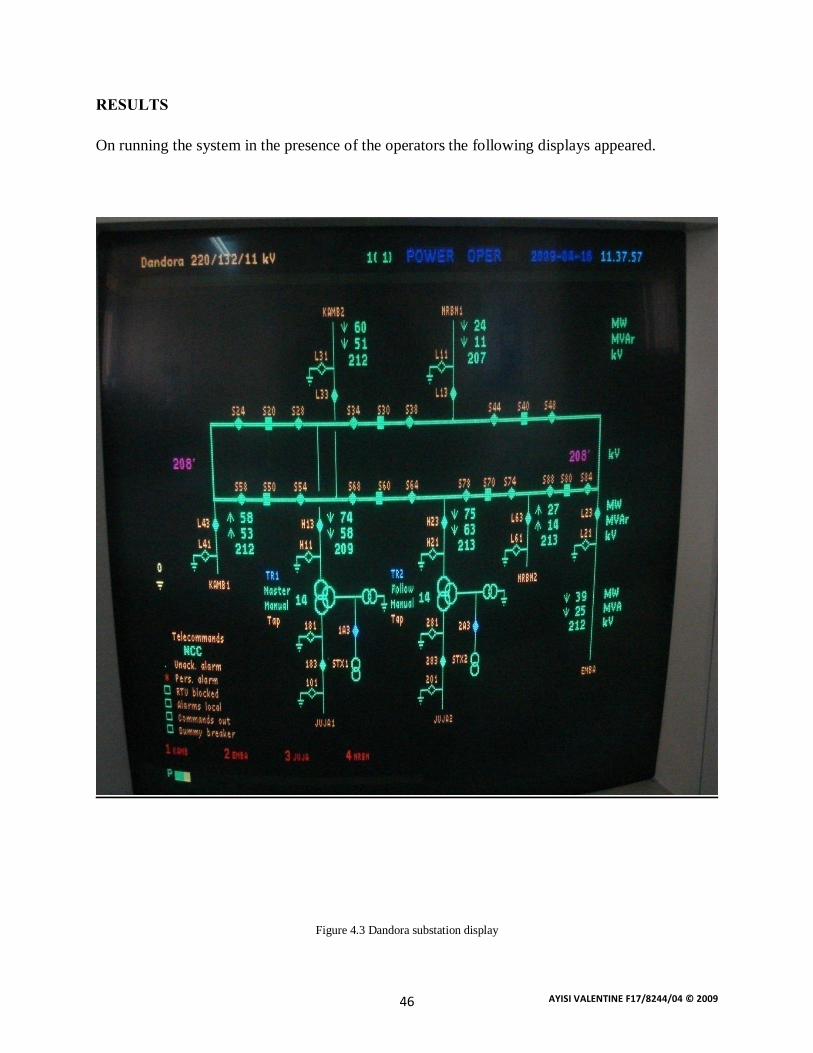
AYISI VALENTINE F17/8244/04 © 2009 47
Figure 4.4 Embakasi substation display
AYISI VALENTINE F17/8244/04 © 2009 48
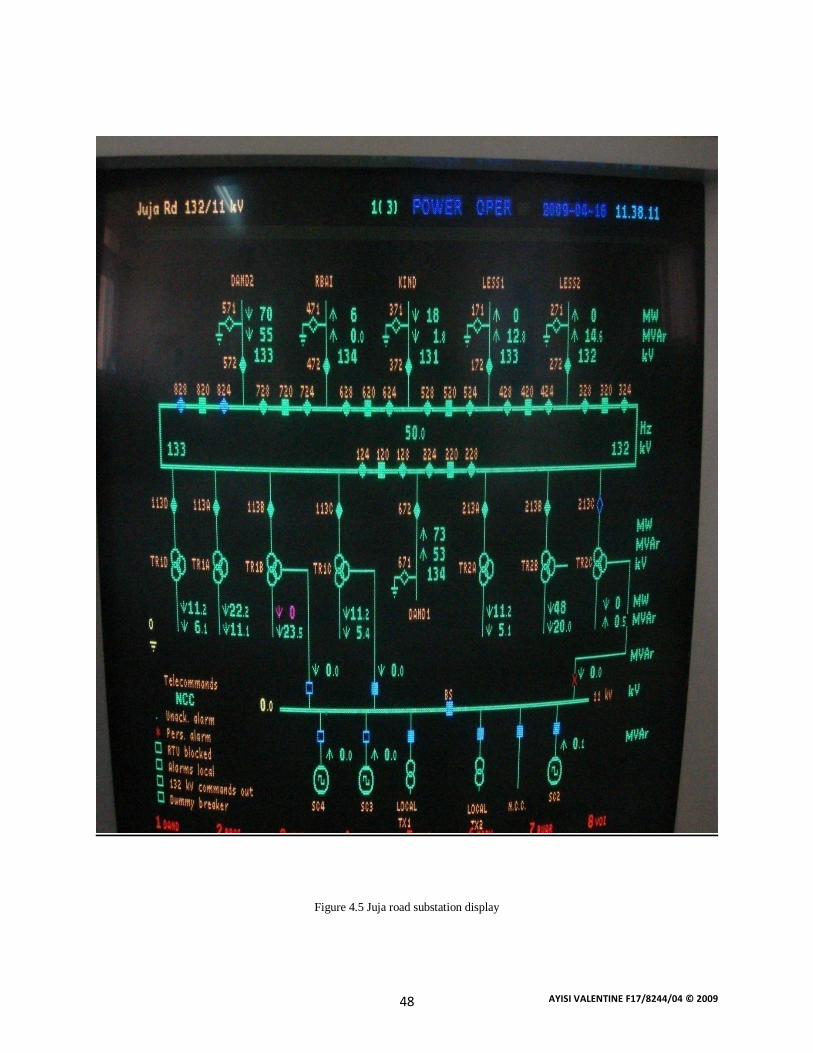
Figure 4.5 Juja road substation display
AYISI VALENTINE F17/8244/04 © 2009 49
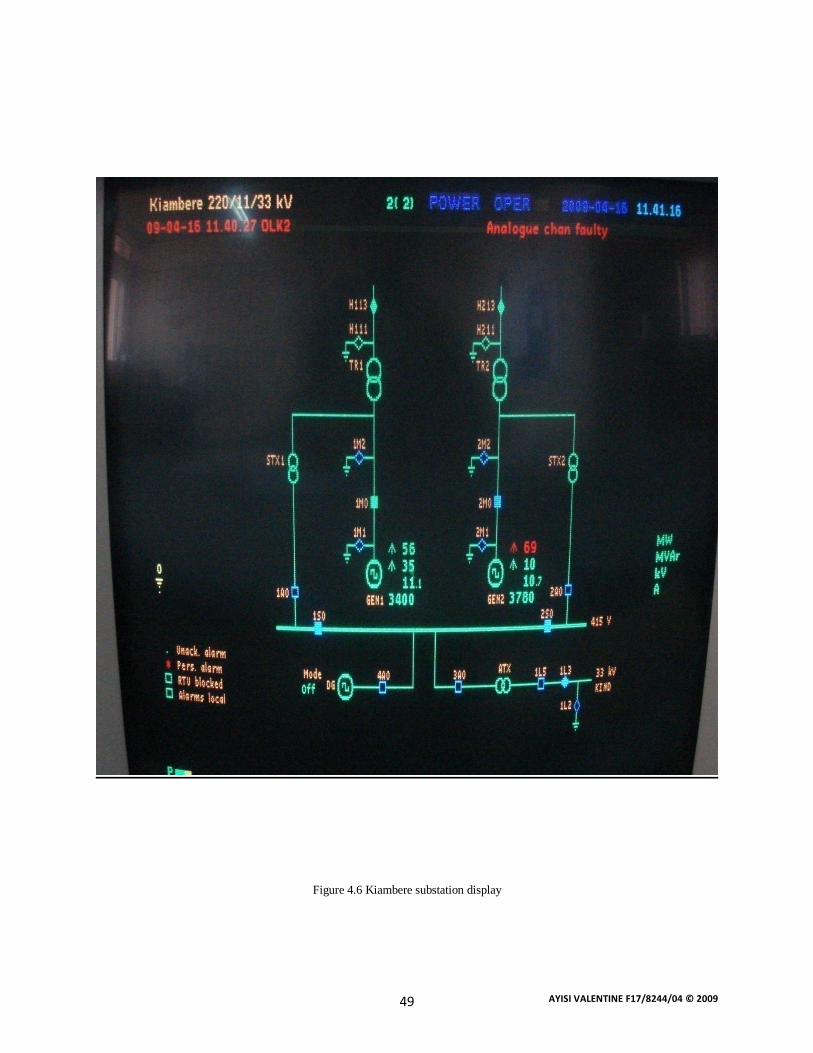
Figure 4.6 Kiambere substation display
AYISI VALENTINE F17/8244/04 © 2009 50
CHAPTER 5
TROUBLE SHOOTING AND CONCLUSION
5.0 INTRODUCTION
This section reviews certain methodologies that may be followed for effective troubleshooting
and maintenance of a telemetry system from the digital or analog field input/output at the RTUs
to the computer facilities at the central site. The emphasis in this section is on the methodology
to be used. Basic troubleshooting of the various components of a telemetry system are covered
her. This includes:
v The RTUs and components modules
v Associated equipment interfaced to the RTUs (such as PLCs)
v Master station
v Central site computer facilities
5.1 TROUBLESHOOTING THE TELEMETRY SYSTEM
Ensure that components are not removed on line whilst the system is powered up unless the
manufacturer specifically indicates that this is permissible. Damage to components and modules
can occur when removing whilst the system is still powered up.
5.1.1 RTUs and Component Modules
A typical procedure to follow when reviewing the operation of the telemetry system for faults is:
• Confirm that the power supply module is healthy
• If the power supply is not operating, check that there is power to the power supply
module
• Check the CPU module that the run or healthy light is on
• Check earthing connections for low resistance to earth or whether some other device
hardware has been added to the system
• If CPU module will not run, check the configurations program to see whether that is
faulty or not
• Cycle power to the RTUs before the new program is loaded
AYISI VALENTINE F17/8244/04 © 2009 51
• Replace CPU and retry the test
5.1.2 Master Sites
The master site will generally consist of a more complete telemetry unit and higher quality radio
equipment. Appropriate checks include:
• Check that the links to the central site are operating correctly
• Check that the BER alarm light is not on
• Check transmit power
• Check receiver sensitivity
• Check antenna alignment
• Check that connectors are secure and the cable or waveguide has not been damaged
• Check BER tests on each channel
5.1.3 The Central Site
The areas in which to troubleshoot problems here are quite varied as the master station consists
of:
• The operator stations
• The software for the system
• The communications network for the operator stations
5.2 CONCLUSION
The introduction of monitoring and control systems into the infrastructure of the power network
at the Kenya national grid has changed the outdated manual and analogue collection and
recording methods of electrical quantities to an automated digital system leading to better
supervision of the network, improving services level, helping in preparing and analyzing future
developments, better management of electrical resources……etc.
This material has provided an elaborate insight into the state-of-the-art of the technology of the
complete Kenya power system control field. Thus various parts in the Kenya national grid have

AYISI VALENTINE F17/8244/04 © 2009 52
been described following different topics stated in the table of contents. The overall system
aspect has, however, been the main issue throughout all this material.
The figures, illustrate in a general manner different control rooms, control room equipment and
the Kenya national grid thus presenting valuable information.
5.3 RECOMMENDATIONS
Certain vulnerabilities exist in most SCADA systems. They are:
v A cyber attack will most likely take one or two primary forms. The first is a direct (low-
level) attack on the end effective hardware – RTU, PLU and PLC. This kind of attack
takes advantage of weakness in the communication channel
v The other form of attack would be the subversion of a control system. This would take
place by crossing from the corporate side of a utility’s IT network to the SCADA control
center
5.3.1 Improve Security
• Create and follow a regularly tested security plan
• Enforce accountability for machines and people
• Digitally sign records to ensure they are not altered
• Secure open communication lines
• Force separation of duties, devices and networks so that no one person can have control
of your network
• Use firewalls both internally and externally
AYISI VALENTINE F17/8244/04 © 2009 53
5.3.2 Have a plan
• Decide who is in-charge of security
• Decide what the threat model and threat level are; budget accordingly
• Protect what you can, insure the rest
• Audit regularly to ensure your plan is carried out
5.3.3 Improve security, Enforce Accountability
• Separation of duties- it is important that no one person should have total control of the
network
• The development staff needs to test applications away from the product environment
• Separate portions of the network- the HR department does not need to see into the details
of the product network
• Someone has to ultimately be responsible for what happens on various parts of the
network
5.3.4 Rewards of Improved Security
• Reduction in waste, fraud, and abuse
• Reduction in overall risk to network and business
• Reduction in operational down time, by having better management of the network
• Reduced insurance premium for business insurance
• Reduced difficulty in following increasingly stringent compliance requirements
AYISI VALENTINE F17/8244/04 © 2009 54
REFERENCES:
1. Cegrell, Torsten, Power System control technology, Prentice –Hall international series in
control engineering, 1945
2. W. D. Stevenson, Elements of power system analysis, Mc Graw Hill, 1982
3. Russell Don, Marion E Council, power system control and protection, Academic Press,
USA, 1978
4. Robert H Miller, Malinowski, Power system operation, 3rd ed. Mc Graw Hill ,1994
5. Baumud M, Industrial electrical power system software, Chapman and Hall, USA, 1994
6. Martick R. K, Transmission lines for digital and communication networks, IEEE Press,
1995
7. Shafter G, User oriented power systems control, IFAC, Beijing, 1986
8. Gao Zhanjun, PAN Zhencun and BIAN Pen, “ Modeling of relay protection and fault
information systems,” Relay, vol.33, pp. 50-53, Feb 2005
9. ZHOU Ming, REN Jianwen and LI Genyin, “ A multi-agent based dispatching operation
instruction system in electrical power systems,” Proceedings of the CSEE, vol. 24 pp. 58-
62, April 2004