Embed Size (px)
Citation preview

1
UNIVERSITY OF NAIROBI
FACULTY OF ENGINEERING
DEPARTMENT OF ELECTRICAL AND ELECTRONIC ENGINEERING
FINAL YEAR PROJECT TITLE: AN SCR CONTROLLED BATTERY CHARGER
PROJECT NO. 054 AUTHOR: OKOCHIL CHURCHIL EMODO.
REG.NO. F17/1531/2000 SUPERVISOR: MR.V.DHARMADHIKARY
EXAMINER: MR.OMBURA DATE: MAY 2009
Submitted to the department of electrical and electronic engineering in partial fulfillment
for the award of a degree in Bachelor of Science in Electrical and Electronic Engineering.

2
Dedication To my family, my parents and all my beloved in the Lord.

3
Acknowledgement
I would like to thank my supervisor, Mr.V.Dharmadhikary for his guidance though this
project work. I would also like to thank Kelvin Omondi for his support in using his
computer.
Above all, I thank the almighty God for His leadership
4
Abstract
Batteries offer the closest solution to the storage of electricity by storing electrical
energy in form of chemical energy. This energy is then reconverted and used as need arises.
The used energy is replenished by use of charging circuits (battery chargers).These
chargers apply different principles. In this project, taper charging method is utilized.
This project requires the design of an SCR controlled battery charger with
indicators showing the level of the battery being charged. The design specifications will be
verified through implementation.

5
Introduction The problem statement required the design of an SCR controlled battery charger intended
to charge a battery of 12V, 1.8Ah.The charger was to have indicators showing the level of
battery being charged.
The circuit designed used a silicon controlled rectifier as the main rectifier and also as a
control device. The circuit had indicators showing when the battery is charging and when
fully charged .Previous work in this field recommended the inclusion of trickle charging
into the circuit to safeguard the battery against self discharge. This feature has been
included in this design.

6
TABLE OF CONTENTS
CHAPTER 1: LITERATURE REVIEW………………………………………………4
1.1 GENERAL CHARACTERISTICS OF BATTERIES …………………………4
1.1.1 The capacity of storage batteries…………………………………………………4
1.2 TYPES OF BATTERIES…………………………………………………………..4
1.2.1 Lead acid Batteries……………………………………………………………….4
1.2.2 Nickel-cadmium Batteries ……………………………………………………….5
1.2.3 Nickel-metal Hydride Batteries………………………………………………….6
1.2.4 Lithium-ion Batteries……………………………………………………..………6
1.3 CHARGING METHODS…………………………………………………………..7
1.3.1 Taper charging……………………………………………………………………7
1.3.2 Constant current charging…………………………………………………………8
1.3.3 Constant voltage charging…………………………………………………………9
CHAPTER 2: CIRCUIT DESIGN……………………………………………………10
2.1 FUNCTIONAL BLOCK DIAGRAM……………………………………………..10
2.2 CIRCUIT DESCRIPTION…………………………………………………………12
2.3 DESIGN OF CIRCUIT COMPONENTS……………………………………………14
CHAPTER 3: DESIGN SIMULATION………………………………………………...21
3.1 SIMULATION PROGRAM………………………………………………………….21
3.2 PROCEDURE FOR SIMULATION…………………………………………………21
3.3 SIMULATION RESULTS……………………………………………………………22
3.3.1 Waveforms from simulation………………………………………………………..22
3.3.2 Results from simulation ……………………………………………………………27
CHAPTER 4: IMPLEMENTATION……………………………………………………29
4.1 CIRCUIT CONSTRUCTION………………………………………………………..29

7
CHAPTER 5: RECOMMENDATIONS AND CONCLUSION………………………30
REFERENCES…………………………………………………………………………31

8
LITERATURE REVIEW
1.1 GENERAL CHARACTERISTICS OF BATTERIES
A battery charger is basically a circuit that applies electrical energy to a battery in order to
restore its power once the battery has been discharged. Battery characteristics offer a means
of measuring the performance of batteries which need to be known in order to design a
charger effectively.
1.1.1 CAPACITY OF STORAGE BATTERIES
Battery capacity is the total amount of electrical energy available from the battery when
fully charged. It is measured in Ampere-Hours or Watt-Hours.
1.2 TYPES OF BATTERIES
Batteries are classified into two major categories;
(i) Primary batteries
(ii) Secondary batteries
Primary cells are not rechargeable. Secondary batteries are rechargeable so as to restore
power. When electrical energy is applied to the battery, the electron flow from the negative
to the positive electrode that occurs during discharge is reversed and power is restored.
Examples of primary cells include zinc-carbon and zinc chloride cells.
Rechargeable batteries can be categorized into the following:
1.2.1 LEAD ACID BATTERIES
The anode of the cell is made of lead metal (Pb) while the cathode is lead (iv) oxide
(pbo2). The electrolyte is dilute sulphuric acid. During discharge, Lead (ii) sulphate is

9
formed by both the anode and cathode and water is produced. This reaction is shown
below:
Discharging
Pbo2+Pb+2H2SO4 2pbso4 +2H2O
Charging
Charging the battery reverses the reaction and produces the former constituents; Lead (iv)
oxide at the cathode and lead metal (pb) at the anode.
Advantages:
It has a high voltage on discharge
Its materials are relatively cheap and available.
1.2.2 NICKEL CADMIUM BATTERIES
The anode is made of nickel hydroxide and the cathode is cadmium. Potassium hydroxide
[KOH] is used as the electrolyte.
The electrolyte is not consumed during discharging.
Disadvantages
They suffer from memory effect. This is when the battery is continuously recharged
before it has discharged more than 50%b of its power, causing it to be maxed out at
50%.
Detection of overcharge is difficult.
Cadmium is a heavy metal and causes pollution to the environment when disposed.
10
1.2.3 NICKEL-METAL HYDRIDE BATTERIES.
These differ from Nickel cadmium batteries only by their negative electrode which is made
of a material capable of storing a large amount of electrons. Metal hydride is produced as
the charging product.
Advantages
-The energy density is almost 50% greater than nickel cadmium batteries .
-Memory effect is less significant.
Disadvantage
-It has a high self discharge.
1.2.4 LITHIUM ION BATTTERIES
The cathode and the anode are made from a material into which and from which lithium
can move. The anode of a conventional Li ion cell is made of carbon while the cathode is a
metal oxide. The electrolyte is a lithium salt in an organic solvent. The liquid electrolyte
conducts lithium ions, acting as a carrier between the cathode and anode when the battery
passes electric current through an external circuit. During discharge lithium is extracted
from the anode and inserted into the cathode. The reverse process occurs during charging.
Advantages
• Li ion batteries can be formed into a wide variety of shapes and sizes so as to
efficiently fill available space in the devices they power.
• They do not suffer from memory effect.
• They have a low self discharge rate of approximately 5% per month.

11
• They have high energy to weight ratio.
Disadvantages
Service life is dependent upon ageing (shelf life). Regardless of whether it is used or not,
the battery will decline slowly in capacity.
1.3 CHARGING METHODS.
The appropriate charging method is important so as to ensure long life for the battery and
expected performance. The main charging methods include following;
1.3.1TAPER CHARGING
Typical taper charges comprise of transformer- rectifier circuits. A maximum initial charge
current for the battery is held constant until the terminal voltage reaches a point at which
charge current begins to fall. The charging voltage should be disconnected, usually within
12-24hours.
Fig1.1: Charging characteristics for taper charging.
Charging current
Battery voltage
Time
V/I
12
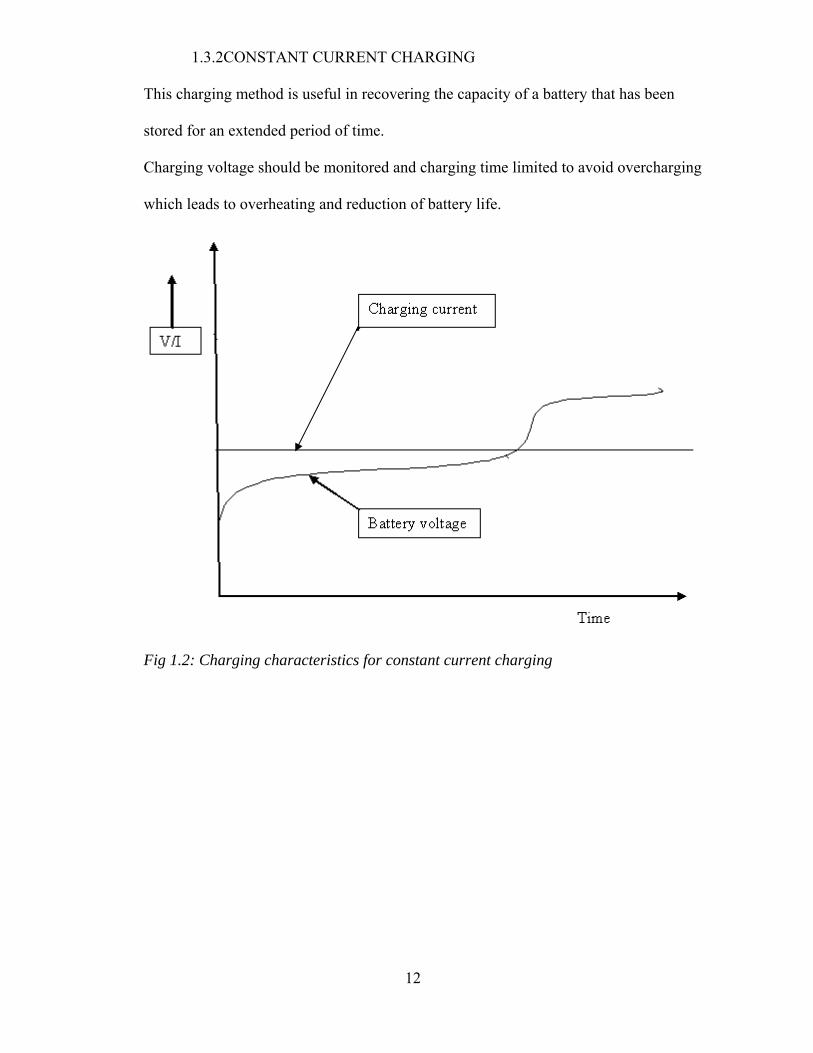
1.3.2CONSTANT CURRENT CHARGING
This charging method is useful in recovering the capacity of a battery that has been
stored for an extended period of time.
Charging voltage should be monitored and charging time limited to avoid overcharging
which leads to overheating and reduction of battery life.
Fig 1.2: Charging characteristics for constant current charging
13
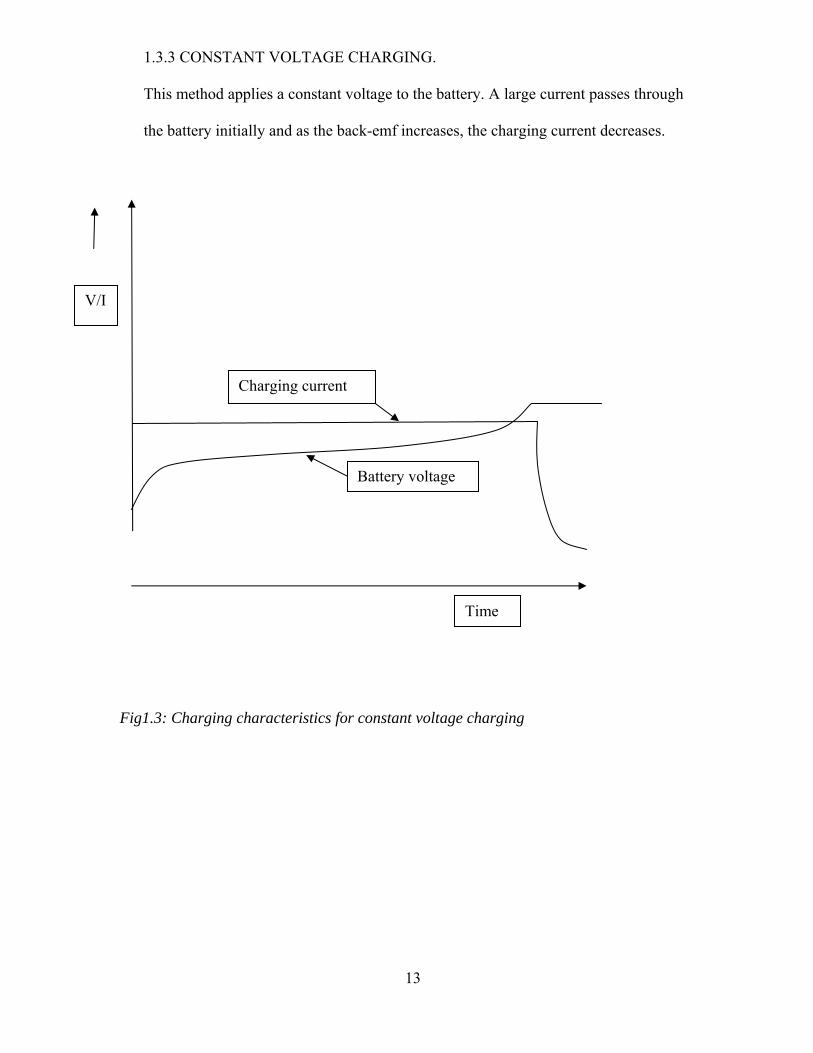
1.3.3 CONSTANT VOLTAGE CHARGING.
This method applies a constant voltage to the battery. A large current passes through
the battery initially and as the back-emf increases, the charging current decreases.
Fig1.3: Charging characteristics for constant voltage charging
Charging current
Battery voltage
V/I
Time

14
CIRCUIT DESIGN
2.1 FUNCTIONAL BLOCK DIAGRAM
Fig2.1: functional block diagram of a battery charger
STEP DOWN TRANSFORMER
RECTIFIER
CURRENT LIMITER
CONTROL SWITCH
BATTERY
BATTERY VOLTAGE MONITOR

15
STEP DOWN TRANSFORMER
This is used to step down the mains voltage to a value required by the charging circuit.
RECTIFIER
The rectifier section converts the stepped down A.C voltage into D.C voltage.
CURRENT LIMITER.
This is the resistance placed in series with the battery to limit the current due to the
small internal resistance of the battery.
CONTROL SWITCH
This controls the charging process.
BATTERY
This consists of the cells being charged. They are available in different ratings of voltage
and capacity. These parameters should be taken into consideration while designing the
charger to be used on the battery.
BATTERY VOLTAGE MONITOR
This compares the battery voltage with a certain preset value and then gives a signal to the
control switch. When this value is attained, the control switch acts accordingly.

16
2.2 CIRCUIT DESCRIPTION.
V1
230 Vrms 50 Hz 0°
T20
1
2
3
R2
30Ω
R4
10ΩR5
128kΩ
D1
1N4001
D2
1N4001
0
4
R1
10Ω
6
LED1
LED2R3
2.2Ω
R6
1.5kΩ
3
13
D7
1N4371A
R7
100ΩKey=A 25%
D8BT149_B
D4BT149_B
14
V212 V
9
12
2
8
10
18 1
21
0
Fig2.2: The designed battery charging circuit
In this charging circuit, charging current will flow through the battery when the charging or
applied voltage exceeds the battery voltage.
The transformer T1 steps down the mains voltage from 240V to 36V.
The SCR1 forms the main rectifier that rectifies stepped down A.C voltage to pulsating D.C
voltage. SCRI is turned on by a gate current that flows through the diode D2 through
current limiting resistor R5. These causes the SCRI to conduct most of the current to the
battery through current limiting resistor R1 hence charge it. R1 prevents excessive current
from flowing through the battery when it is charging. When SCR1 is conducting, during

17
the charging process, a voltage drops a cross R4 which causes a light emitting diode LED1,
connected a cross this resistor to illuminate.
The potentiometer R7 samples the battery voltage. One terminal of the potentiometer is
connected to the cathode of a zener diode whose Vz =6.2V
When a voltage equal to the Vz of the zener diode drops across the lower part of the
potential-divider, the zener diode is turned on and current flows to the gate of SCR2 hence
turning it on.
This causes current to flow to ground through current limiting resistor R3. The
potentiometer is adjusted such that when the battery is fully charged a voltage equal to Vz.
of the zener drops across its lower part. When SCR2 is conducting, LED2 lights up
indicating the battery is fully charged. The flow of current to ground through SCR2 also
prevents sufficient gate current to flow to SCR1 and hence it stops conducting. A small
charging current flows through R2 and D1 to the battery for trickle charging . D1 acts as
the rectifier in this case. Varying the potentiometer enables the charger to be used with
batteries of different voltage rating.

18
2.3 DESIGN OF CIRCUIT COMPONENTS
Battery:
Battery type- sealed lead acid
Voltage- 12V
Capacity- 1.8AH
It is recommended to charge the lead acid battery using a current between 10% to 30% of
AH rating of the battery.
10/100x1.8 =0.18
30/100x1.8 =0.54
Charging current can be between 180mA to 540mA.
STEP-DOWN TRANSFORMER.
The transformer should step down voltage from 240v to 36v.
Primary side:
Vrms = 240v
Vpeak = √2x240
=339.41V.
Secondary side:
Vrms=36v
Vpeak = √2x36
=50.91V
VA Rating of transformer:
Thyristors (SCR1 and SCR2)
Forward break over voltage (VFBO) ≥ 2 Vpr

19
Pr= rectified peak voltage = 50.91V
VFBO= 2x50.91
=101.82V
Current rating:
Current through SCR1=540 MA
Current rating =1A
Rectifier diodes
V (rectified peak) =50.91V
Vrating ≥ 2x50.91
=101.821V
Selected voltage rating was 100V for each diode.
Current rating:
Iaverage = 540mA=0.54A.
Ipeak=0.54/0.318=1.70A
Ipeak = 1.70A
IF≥2x1.70
3.4V
The selected rectifier diodes had a forward current rating of 5A
Rectifier output voltage:
Average voltage
Vav = 1/2πVmax sinθ.dθ

20
=Vmax/2π∫sinθ.dθ/2
=Vmax/2π[-cosθ]
=Vmax/π
=Vpeak/π
=50.91/π
Vav 16.21V
RMS voltage:
Vrms √1/2π VmaxSinθ.dθ
Vmax/2√2
50.91/2√2
18.0V
RESISTORS
(R2, R4, R5and R6)
When the battery is charging SCR2 does not conduct hence the circuit in fig 2.2 is reduced
to.
V1
230 Vrms 50 Hz 0°
T20
1
2
3
R2
30Ω
R4
10ΩR5
128kΩ
D1
1N4001
D2
1N4001
R1
10ΩLED1
R6
1.5kΩ
R7
100ΩKey=A 50%
D8BT149_B
V212 V
7
10
8
139
5
2
0
1
3
0
Fig2.3: charging path
During charging, the diodes, SCR1 and LED1, are assumed to have negligible resistance.
The circuit in fig 2.3 can then be reduced to;

21
R1
10Ω
R7
100ΩKey=A 50%
V212 V
7
R2
30Ω
R6
1.5kΩR4
10Ω
R5
128kΩ
2
V315.53 V
3
1
Fig 2.4: Equivalent circuit for the charging path
Let the charging current be about 300mA .Let R1,a current limiting resister be 10Ω
The current through the R7,
I7=12/100=0.12A
=120mA
The current through resistor R1= (120+300)mA
=420mA
The voltage across resistor R1
VR1=0.42x10=4.2V
Voltage across the parallel network ofR2, R4, R5 and R6
Vpn = (V1 12) 4.2
=2.6V
SCR1 forms the main rectifier and therefore should carry most of the current charging the
battery.
If the current through battery is 300mA, let the current through SCR1 be 250mA;
R4=2.6/0.250

22
=10.4Ω 10Ω
From the SCR datasheet (IG(max) =200µA.R5 should be a large resistor so as to aid in
preventing SCR1 from conducting when SCR2 is conducting (WHEN THE BATTERY IS
FULLY CHARGED).
LET 1G =50µA
R5= 6.4V/50µA=128KΩ
R2 and D1 allows a small current to flow to the battery for trickle charging when the battery
is fully charged. If the trickle current is 50µAand current through R7 is I7,
Where I7= voltage of fully charged battery total potential divider resistance
=13.8V/100Ω =0.138A
=138mA
Current through R2 and D1 is given by I2 = (138+50) mA =188mA
R2 =5.7V/188mA=30.3Ω
≈30Ω
From the LED data sheet, Ion =2mA
R6= 2.6V/2mA=1.3KΩ
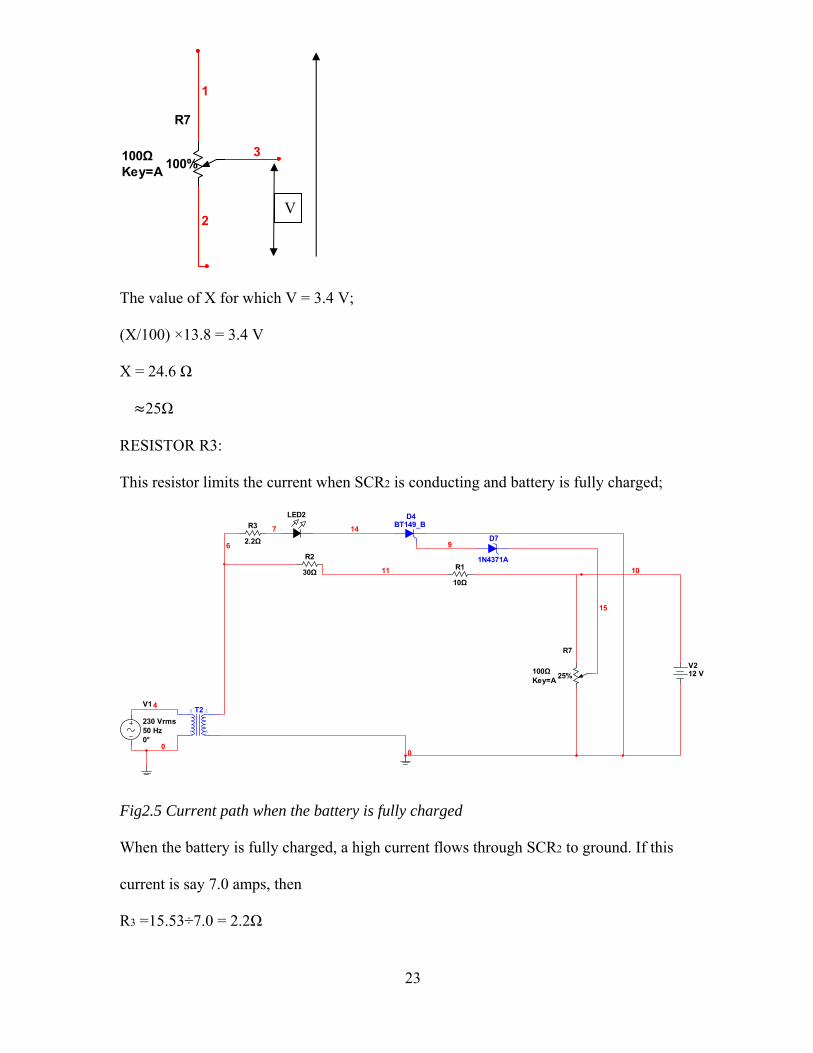
RESISTOR (R7)
R7 was selected to be 100Ω
When the battery is fully charged the voltage drop across the lower part of the voltage
divider should be equal to the sum of the zener voltage Vz and the SCR2 gate voltage. The
diode selected had a Vz of 2.6V. The gate trigger voltage for the selected SCR, VGT was
0.8V.
Vz + VGT = 2.6 + 0.8 = 3.4V
23
R7
100ΩKey=A 100%
1
2
3
The value of X for which V = 3.4 V;
(X/100) ×13.8 = 3.4 V
X = 24.6 Ω
25Ω
RESISTOR R3:
This resistor limits the current when SCR2 is conducting and battery is fully charged;
V1
230 Vrms 50 Hz 0°
T20
1
2
3
R2
30ΩR1
10Ω
LED2R3
2.2Ω D7
1N4371A
R7
100ΩKey=A 25%
D4BT149_B
V212 V
0
10
15
14
9
7
0
4
6
11
Fig2.5 Current path when the battery is fully charged
When the battery is fully charged, a high current flows through SCR2 to ground. If this
current is say 7.0 amps, then
R3 =15.53÷7.0 = 2.2Ω
V
24
Zener diode D7:
The zener voltage was selected arbitrarily to be 2.6V. The maximum zener current is given
by;
IZ(MAX) = fully charged battery voltage / total resistance of potential divider
=13.8/100 = 138 mA
VI=2.6 х 0.138 = 0.360W
POWER RATING = 1/2W.

25
DESIGN SIMULATION.
3.1 SIMULATION PROGRAM.
Multism version 10.0.1 was used for simulation of the circuit in figure 3.1
Fig3.1: circuit showing the simulation process
3.2 PROCEDURE FOR SIMULATION
The circuit in figure x. was constructed in multism and the charging process was simulated
from a fully discharged to a fully charged battery.The battery was represented by a d.c
source. The voltage of the d.c source was varied from12V to 13.8Vat intervals of 0.1V.
26
3.3 RESULTS FROM SIMULATION
3.3.1 WAVEFORMS FROM SIMULATION
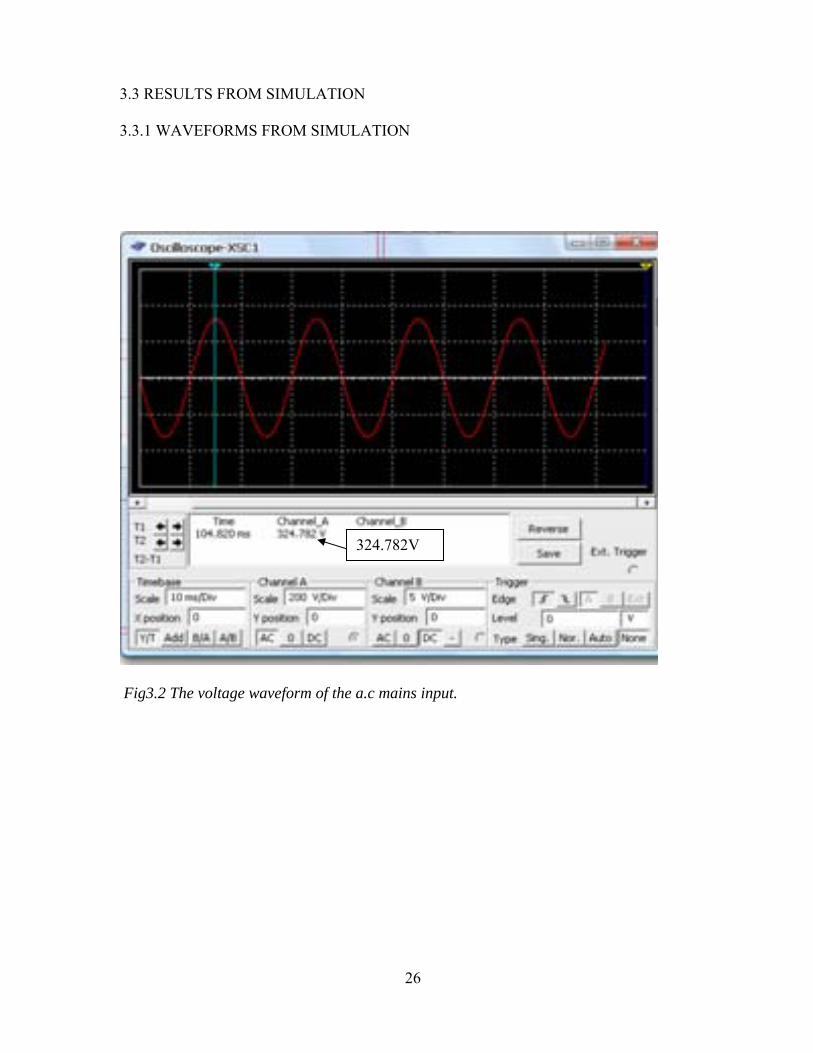
Fig3.2 The voltage waveform of the a.c mains input.
324.782V

27
Fig 3.3 The voltage waveform of the output of transformer T1 (input to charger
circuit)
48.772V
28
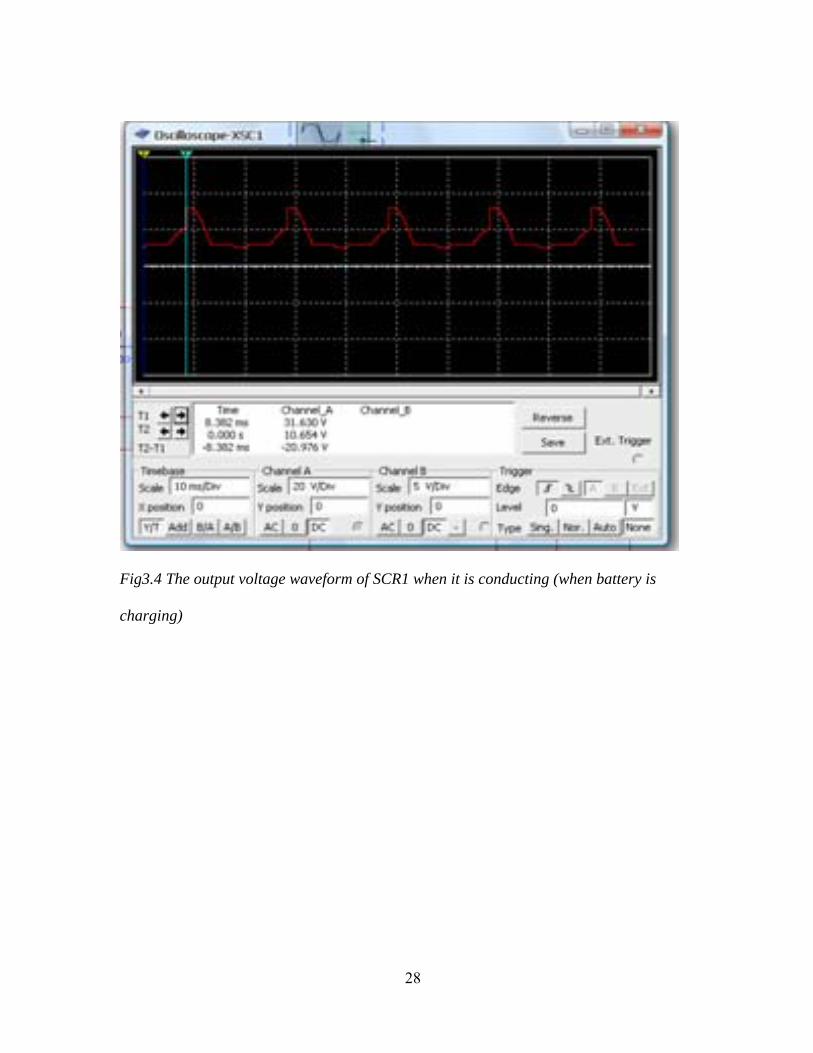
Fig3.4 The output voltage waveform of SCR1 when it is conducting (when battery is
charging)

29
Fig3.5 The voltage waveform of the charging circuit output.
28.369V

30
Fig3.6 Waveform of voltage across SCR1 when the battery is fully charged.

31
3.3.2 THE TABLE OF RESULTS FROM SIMULATION
Table 3.1: Results of the simulated charging process
Battery Voltage
(V)
Charging Current
(mA)
Battery Voltage
(V)
Charging Current
(mA)
12.0
291.023 13.0
238.707
12.1
286.217 13.1 232.327
12.2
281.381 13.2 225.223
12.3
276.484 13.3 216.471
12.4
271.468 13.4 63.419
12.5
266.403 13.5 60.902
12.6
261.191 13.6 58.372
12.7
255.871 13.7 55.826
12.8
250.387 13.8 53.263
12.9
244.708
32
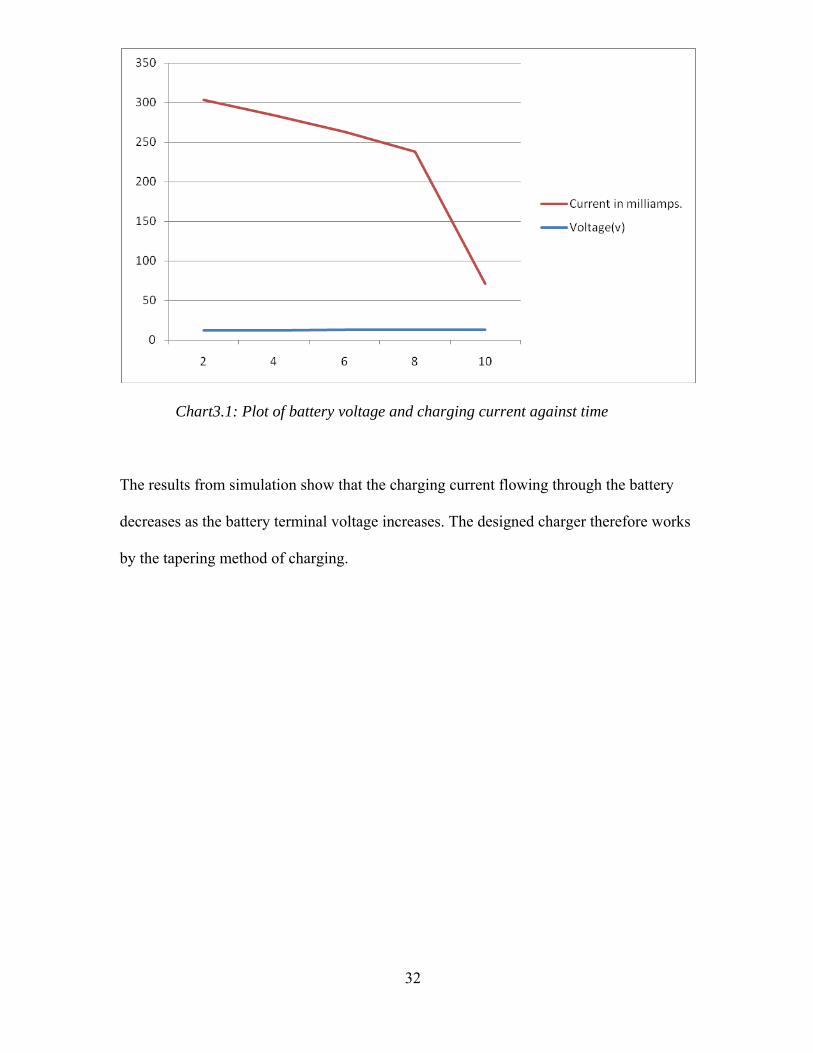
Chart3.1: Plot of battery voltage and charging current against time
The results from simulation show that the charging current flowing through the battery
decreases as the battery terminal voltage increases. The designed charger therefore works
by the tapering method of charging.

33
4.1 IMPLEMENTATION
By the time of handing in of this report, the simulated circuit had not been constructed.
This was because two important components, the SCR1 (BT149B) and SCR2 (BT149B) or
their equivalent were not available. However, efforts are being made to have the
components available and the circuit constructed before the presentation on 26/05/2009.

34
RECOMMENDATIONS AND CONLUSIONS
5.1 RECOMMENDATIONS
Future work in this area can be done in the following area;
Provision for automatic isolation of the battery from the charging circuit when the battery
is fully charged.
5.2 CONCLUSION
An SCR-controlled battery charger which applies the principle of taper charging was
successfully designed. Results from the simulation indicate that charger works according to
the design. It correctly indicated when the battery was being charged and when fully
charged.

35
REFERENCES
1. www.batteryuniversity.com\
2. www.mpowerk.com
3. www.wikipedia.org
4. www.alldatasheets.com
5. www.datasheetcatalog.com
6. Power Electronics Lecture notes, by Dr.Ogaba