Embed Size (px)
Citation preview

1
Chapter 04
Lecture

A GLIMPSE OF HISTORY
German physician Robert Koch (1843–1910)
Studied disease-causing bacteria; Nobel Prize in
1905
Developed methods of cultivating bacteria
Worked on methods of solid media to allow single
bacteria to grow and form colonies
Tried potatoes, but nutrients limiting for many bacteria
• Solidifying liquid nutrient media with
gelatin helped
• Limitations: melting temperature,
digestible
• In 1882, Fannie Hess, wife of associate,
suggested agar, then used to harden
jelly

INTRODUCTION
Prokaryotes found growing in severe conditions
Ocean depths, volcanic vents, polar regions all
harbor thriving prokaryotic species
Many scientists believe that if life exists on other
planets, it may resemble these microbes
Individual species have limited set of conditions
Also require appropriate nutrients
Important to grow microbes in culture
Medical significance
Nutritional, industrial uses
4.1. PRINCIPLES OF BACTERIAL GROWTH
Prokaryotic cells divide by binary fission One cell divides into two, two
into four, 48, 816, etc…
Exponential growth: population doubles each division
Generation time is time it takes to double Varies among species
Environmental conditions
Exponential growth has important consequences 10 cells of food-borne pathogen
in potato salad at picnic can become 40,000 cells in 4 hours
Cell gets longer and
DNA replicates.
Cell divides into two cells.
Cells separate.
Daughter cells
DNA is moved into
each future daughter
cell and cross wall forms.

4.1. PRINCIPLES OF BACTERIAL GROWTH
Growth can be calculated
Nt = N0 x 2n
Nt = number of cells in population at time t
N0 = original number of cells in population
n = number of divisions
Example: pathogen in potato salad at picnic in sun
Assume 10 cells with 20 minute generation time
N0 = 10 cells in original population
n = 12 (3 divisions per hour for 4 hours)
Nt = N0 x 2n = 10 x 212
Nt = 10 x 4,096
Nt = 40,960 cells of pathogen in 4 hours!

4.1. PRINCIPLES OF BACTERIAL GROWTH
The power of exponential growth
Rapid generation time with optimal conditions can
yield huge populations quickly
Remember that generation time depends on
species and growth conditions

4.2. PROKARYOTIC GROWTH IN NATURE
Microorganisms historically studied in laboratory
But dynamic, complex conditions in nature have profound effect on microbial growth, behavior Cells sense changes, adjust to surroundings
Synthesize compounds useful for growth
Can live singly Most live in polysaccharide- encased communities
Termed biofilms
Cause slipperiness of rocks in stream bed, slimy “gunk” in sink drains, scum in toilet bowls, dental plaque

BIOFILMS
Formation of biofilm
Planktonic bacteria
move to the surface
and adhere.
Bacteria multiply
and produce
extracellular polymeric
substances (EPS).
Other bacteria may
attach to the EPS
and grow.
Cells communicate
and create channels
in the EPS that allow
nutrients and waste
products to pass.
Some cells detach
and then move to
other surfaces to
create additional
biofilms.
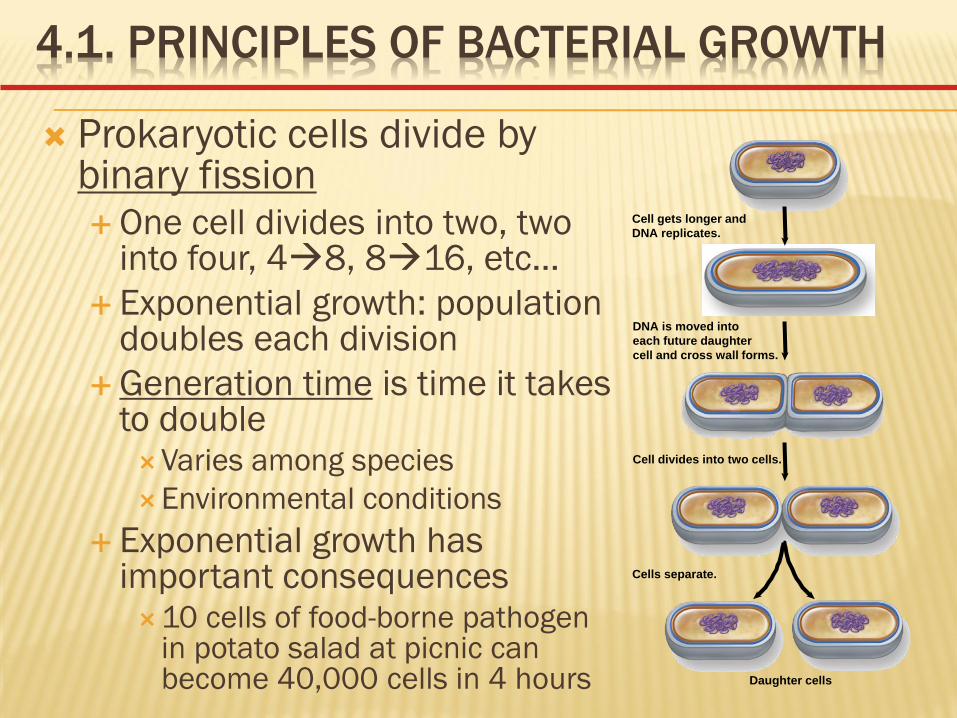
BIOFILMS
Biofilms have characteristic architectures
Channels through which nutrients and wastes pass
Cells communicate by synthesizing chemical signals
Biofilms have important implications
Dental plaque leads to tooth decay, gum disease
Most infections (e.g., ear infections, cystic fibrosis)
Industrial concerns: accumulations in pipes, drains
Biofilm structure shields microbes growing within
May be hundreds of times more resistant
Biofilms can also be helpful
Bioremediation, wastewater treatment

INTERACTIONS OF MIXED MICROBIAL
COMMUNITIES
Prokaryotes regularly grow in close association
Many different species
Interactions can be cooperative
Can foster growth of species otherwise unable to survive
Strict anaerobes can grow in mouth if others consume O2
Metabolic waste of one can serve as nutrient for other
Interactions often competitive
Some synthesize toxic compounds to inhibit competitors

4.3. OBTAINING A PURE CULTURE
Pure culture defined as population of cells
derived from a single cell
Allows study of single species
Pure culture obtained using aseptic technique
Minimizes potential contamination
Cells grown on culture medium
Contains nutrients dissolved in water
Can be broth (liquid) or solid gel

GROWING MICROORGANISMS ON A SOLID
MEDIUM
Need culture medium, container, aseptic conditions, method to separate individual cells
With correct conditions, single cell will multiply
Form visible colony (~1 million cells easily visible)
Agar used to solidify
Not destroyed by high temperatures
Liquifies above 95°C
Solidifies below 45°C
Few microbes can degrade
Growth in Petri dish
Excludes contaminants
Agar plate

4.4. PROKARYOTIC GROWTH IN LABORATORY
CONDITIONS
Prokaryotes grown on agar plates or in tubes or
flasks of broth
Closed systems
Nutrients not renewed; wastes not removed
Termed batch cultures
Yields characteristic growth curve
Open system required to maintain continuous
growth
Termed continuous culture
Nutrients added, wastes removed continuously

THE GROWTH CURVE
Growth curve characterized by five stages N
um
ber
of
cells (
log
rith
mic
scale
)
Phase of
prolonged decline
Death
phase
Stationary
phase
Time (hr) (days/months/years)
Lag
phase
Log or
exponential
phase
1010
108
100
102
104
106

THE GROWTH CURVE
Lag phase Number of cells does not increase
Begin synthesizing enzymes required for growth
Delay depends on conditions
Exponential (log) phase Cells divide at constant rate
Generation time measured
Most sensitive to antibiotics
Production of primary metabolites
Important commercially
Secondary metabolite production occurs as nutrients are depleted and wastes accumulate
Nu
mb
er
of
cell
s (
log
ari
thm
ic s
cale
)
Syn
the
sis
of
meta
bo
lite
s
Stationary
Secondary
metabolite
Primary
metabolite
Log
Lag
Time (hr)

THE GROWTH CURVE
Stationary phase
Nutrient levels too low to sustain growth
Total numbers remain constant
Some die, release contents; others grow
Death phase
Total number of viable cells decrease
Cells die at constant rate
Exponential, but usually much slower than cell growth
Phase of prolonged decline
Some fraction may survive
Adapted to tolerate worsened conditions
COLONY GROWTH
Colonies and liquid cultures share similarities
Important differences based on location
Position of single cell determines its environment
Edge of colony has O2, nutrients
Center of colony has depleted O2, nutrients
Accumulation of potentially toxic wastes including acids
Colony may range from exponential growth at
edges, death phase in center

4.5. ENVIRONMENTAL FACTORS THAT INFLUENCE
MICROBIAL GROWTH
Prokaryotes inhabit nearly all environments
Some live in comfortable habitats favored by
humans
Some live in harsh environments
Termed extremophiles; most are Archaea
Major conditions that influence growth
Temperature
Atmosphere
pH
Water availability

TEMPERATURE REQUIREMENTS
Each species has well-defined temperature range
Optimum growth usually close to upper end of range
Psychrophile: –5° to 15°C
Found in Arctic and Antarctic regions
Psychrotroph: 20° to 30°C
Important in food spoilage
Mesophile: 25° to 45°C
Pathogens 35° to 40°C
Thermophiles: 45° to 70°C
Common in hot springs
Hyperthermophiles: 70° to 110°C
Usually members of Archaea
Found in hydrothermal vents
Gro
wth
rate
0
Hyperthermophile Thermophile Mesophile
Psychrotroph
Temperature (°C)
120 110 100 90 80 –10 10 20 30 40 50 60 70
Psychrophile

TEMPERATURE REQUIREMENTS
Proteins of thermophiles resist denaturing Thermostability comes from amino acid sequence
Number and position of bonds, which determine structure
Temperature and food preservation Refrigeration (~4°C) slows spoilage by limiting growth
of otherwise fast-growing mesophiles Psychrophiles, psychrotrophs can still grow, but slowly
Freezing preserves food; not effective at killing microbes
Temperature and disease Temperature of different parts of human body differs
Some microbes cause disease in certain parts
E.g., Hansen’s disease (leprosy) involves coolest regions (ears, hands, feet, fingers) due to preference of M. leprae

OXYGEN REQUIREMENTS
Boil nutrient agar to drive off O2; cool to just above solidifying
temperature; innoculate; gently swirl
Growth demonstrates organism’s O2 requirements

PH
Bacteria survive a range of pH; have optimum
Most maintain constant internal pH, typically near neutral
Pump out protons if in acidic environment
Bring in protons if in alkaline environment
Most microbes are neutrophiles
Range of pH 5 to 8; optimum near pH 7
Food can be preserved by increasing acidity
H. pylori grows in stomach; produces urease to split urea into CO2 and ammonia to decrease acidity of surroundings
Acidophiles grow optimally at pH below 5.5
Picrophilus oshimae has optimum pH of less than 1!
Alkaliphiles grow optimally at pH above 8.5
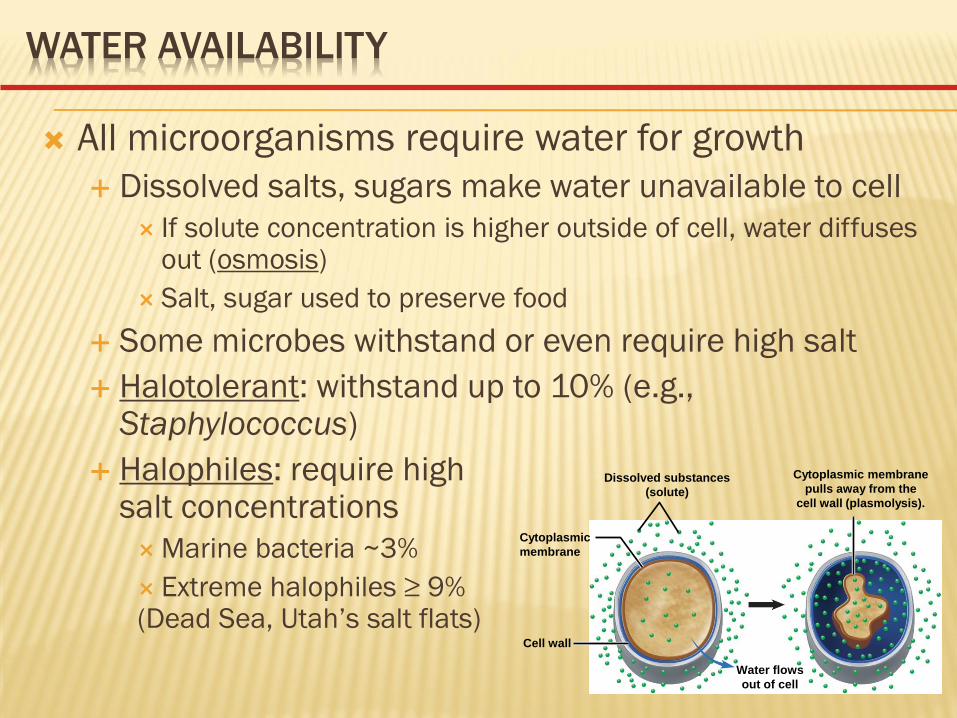
WATER AVAILABILITY
All microorganisms require water for growth
Dissolved salts, sugars make water unavailable to cell
If solute concentration is higher outside of cell, water diffuses out (osmosis)
Salt, sugar used to preserve food
Some microbes withstand or even require high salt
Halotolerant: withstand up to 10% (e.g., Staphylococcus)
Halophiles: require high salt concentrations
Marine bacteria ~3%
Extreme halophiles ≥ 9% (Dead Sea, Utah’s salt flats)
Water flows
out of cell
Cell wall
Cytoplasmic
membrane
Dissolved substances
(solute)
Cytoplasmic membrane
pulls away from the
cell wall (plasmolysis).

4.6. NUTRITIONAL FACTORS THAT INFLUENCE
MICROBIAL GROWTH
Prokaryotes have remarkable metabolic diversity
Require nutrients to synthesize cell components
Lipid membranes, cell walls, proteins, nucleic acids
Made from subunits: phospholipids, sugars, amino acids, nucleotides
Subunits composed of chemical elements including carbon and nitrogen
Key considerations:
Required elements
Growth factors
Energy sources
Nutritional diversity

4.6. NUTRITIONAL FACTORS THAT INFLUENCE
MICROBIAL GROWTH
Required elements
Major elements make up cell components
Carbon source distinguishes different groups
Heterotrophs use organic carbon
Autotrophs use inorganic carbon as CO2 (carbon fixation)
Nitrogen required for amino acids, nucleic acids
Many use ammonia (some convert nitrate to ammonia)
Nitrogen fixation important
Iron, phosphorous often limiting
Trace elements usually available (cobalt, zinc, copper molybdenum, manganese)

4.6. NUTRITIONAL FACTORS THAT INFLUENCE
MICROBIAL GROWTH
Energy sources
Sunlight, chemical compound
Phototrophs obtain energy from sunlight
Plants, algae, photosynthetic bacteria
Chemotrophs extract energy from chemicals
Mammalian cells, fungi, many types of prokaryotes
Sugars, amino acids, fatty acids common sources
Some prokaryotes use inorganic chemicals such as
hydrogen sulfide, hydrogen gas
4.6. NUTRITIONAL FACTORS THAT INFLUENCE
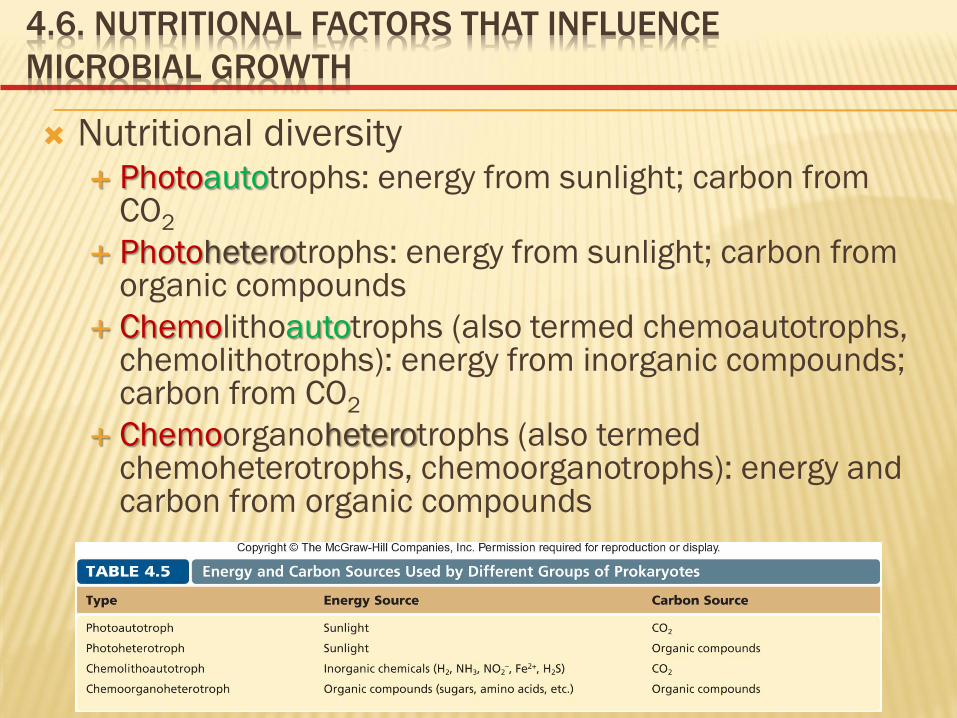
MICROBIAL GROWTH
Nutritional diversity Photoautotrophs: energy from sunlight; carbon from
CO2
Photoheterotrophs: energy from sunlight; carbon from organic compounds
Chemolithoautotrophs (also termed chemoautotrophs, chemolithotrophs): energy from inorganic compounds; carbon from CO2
Chemoorganoheterotrophs (also termed chemoheterotrophs, chemoorganotrophs): energy and carbon from organic compounds

4.8. METHODS TO DETECT AND MEASURE
MICROBIAL GROWTH
Direct cell counts: total numbers (living plus dead)
Direct microscope count
Cell-counting instruments (Coulter counter, flow cytometer)
Using a microscope, the cells in several large squares like the one shown
are counted and the results averaged. To determine the number of cells
per ml, that number must be multiplied by 1/volume (in ml) held in the
square. For example, if the square holds 1/1,250,000 ml, then the number
of cells must be multiplied by 1.25 × 10⁶ ml.
Sample spreads over counting
grid by capillary action.
Cover glass resting on
supporting ridges
Counting grid Counting chamber
Side view
0 0 0 0 2 5 8 9
Automatic counter
Electronic detector
Bacterial cell
Sample in
liquid

4.8. METHODS TO DETECT AND MEASURE
MICROBIAL GROWTH
Viable cell counts: cells capable of multiplying
Can use selective, differential media for particular species
Plate counts: single cell gives rise to colony
Plate out dilution series: 30–300 colonies ideal
Adding 1 ml of culture to 9 ml of diluent results in a 1:10 dilution.
Original bacterial
culture
to 9 ml diluent
1:10,000 dilution
to 9 ml diluent
1:1,000 dilution
to 9 ml diluent
1:10 dilution
to 9 ml diluent
1:100 dilution
5
cells/ml
50,000
cells/ml
5,000
cells/ml
500
cells/ml
50
cells/ml
Too many cells
produce too
many colonies
to count.
Too many cells
produce too
many colonies
to count.
Too many cells
produce too
many colonies
to count.
Between 30–300
cells produces a
countable plate.
Does not produce
enough colonies
for a valid count.
1 ml 1 ml 1 ml 1 ml 1 ml

4.8. METHODS TO DETECT AND MEASURE
MICROBIAL GROWTH
Plate counts determine colony-forming units (CFUs)
Culture, diluted
as needed
0.1–1.0 ml
0.1–0.2 ml Spread cells onto surface
of pre-poured solid agar.
Pour-plate method
Spread-plate method
Incubate
Bacterial colonies
appear only on surface.
Melted cooled agar
Incubate
Some colonies appear on
surface; many are below surface. Add melted cooled agar
and swirl gently to mix.
Solid agar

4.8. METHODS TO DETECT AND MEASURE
MICROBIAL GROWTH
Membrane filtration
Concentrates microbes by filtration
Filter is incubated on appropriate agar medium
A known volume of liquid is passed
through a sterile membrane filter; the
filter retains bacterial cells.
The membrane filter is placed on
an appropriate agar medium and
incubated.
The number of colonies that grow on the
filter indicates the number of bacterial cells
in the volume filtered.
Liquid
sample
Membrane
filter

4.8. METHODS TO DETECT AND MEASURE
MICROBIAL GROWTH
Measuring biomass
Turbidity is proportional to concentration of cells
Measured with spectrophotometer Top scale=Percentage of
light that passes through
Bottom scale=
Optical density
(absorbance)
Light
detector
Concentrated cell
suspension
(c) The percentage of light that reaches the detector of the spectrophotometer
is inversely proportional to the optical density. (b) A spectrophotometer is used to measure turbidity.
(a) The cloudiness, or turbidity, of the liquid in the tube on the left
is proportional to the concentration of cells.
Light source Dilute cell
suspension
40 50
4.
40 50
4.