Embed Size (px)
Citation preview

Chapman and Ward HMPOR case slide 1 © 2011 John Wiley & Sons Ltd
Samdo case study discussion
Chris Chapman and Stephen Ward
Chapman and Ward HMPOR case slide 2 © 2011 John Wiley & Sons Ltd
Discussion starting point
Start with a working assumption about the objective:
maximizing the expected value of M = R – C,
where M = margin (contribution to profit) per year
R = revenue
C = cost (direct and amortisation of capital)
Assume we want to understand the expected
values of M, R and C plus associated opportunity
and risk, and begin by considering R
Chapman and Ward HMPOR case slide 3 © 2011 John Wiley & Sons Ltd
Key components of R (revenue)
• base load power sales to Ontario Hydro
• waste heat (low pressure steam)
• back-up emergency power
We need to size these components,
then identify associated key sources of uncertainty,
and associated key responses (decisions)
Chapman and Ward HMPOR case slide 4 © 2011 John Wiley & Sons Ltd
Key components of C (cost)
• amortised capital cost
• fuel cost
• other costs
We need to size these components,
then identify associated key sources of uncertainty,
and associated key responses (decisions)
Chapman and Ward HMPOR case slide 5 © 2011 John Wiley & Sons Ltd
Creative thinking putting this together
• New untested design CCTG plant?
• Defer emergency power business?
• Back-to-back contract with Ontario Hydro?
• Back-to-back contract with gas supplier?
• Timing issues?
Chapman and Ward HMPOR case slide 6 © 2011 John Wiley & Sons Ltd
Some concluding comments
• The top-down process starting point is useful here• Many of the key generic process ideas can be
applied to all opportunity, risk and uncertainty management processes
• Designing processes for contexts is an overarching key idea
• Seeking simplicity systematically in these processes is another key idea, part of the overarching opportunity efficiency concept

Chapman and Ward HMPOR case slide 7 © 2011 John Wiley & Sons Ltd
Transcon 1 case study discussion
Chris Chapman and Stephen Ward
1 of 4 2011
Chapman and Ward HMPOR case slide 8 © 2011 John Wiley & Sons Ltd
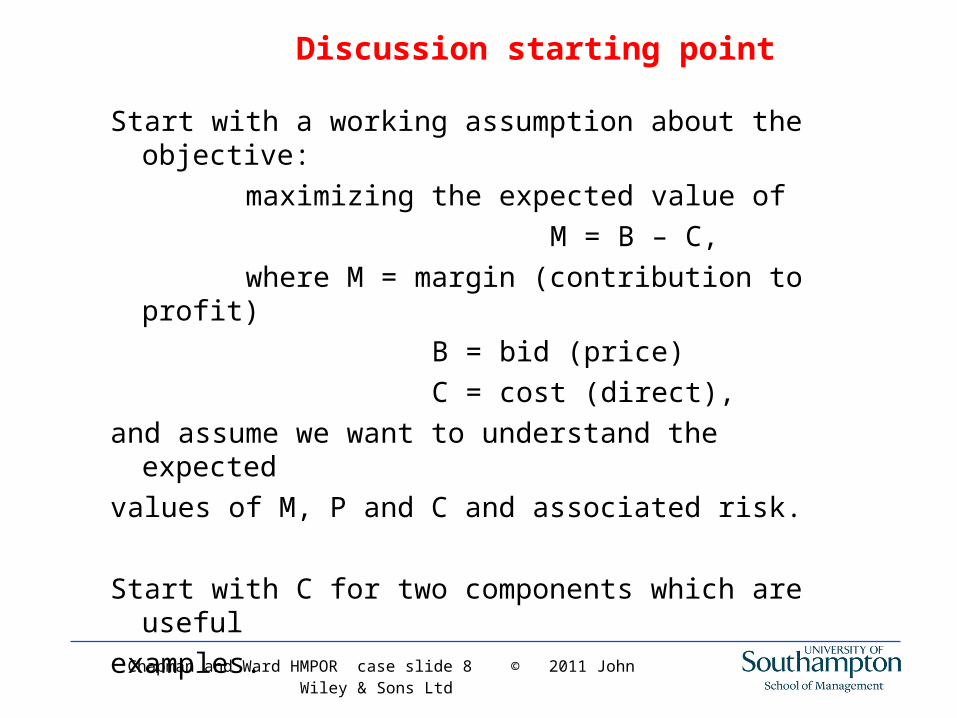
Discussion starting point
Start with a working assumption about the objective:
maximizing the expected value of
M = B – C,
where M = margin (contribution to profit)
B = bid (price)
C = cost (direct),
and assume we want to understand the expected
values of M, P and C and associated risk.
Start with C for two components which are useful
examples.
Chapman and Ward HMPOR case slide 9 © 2011 John Wiley & Sons Ltd
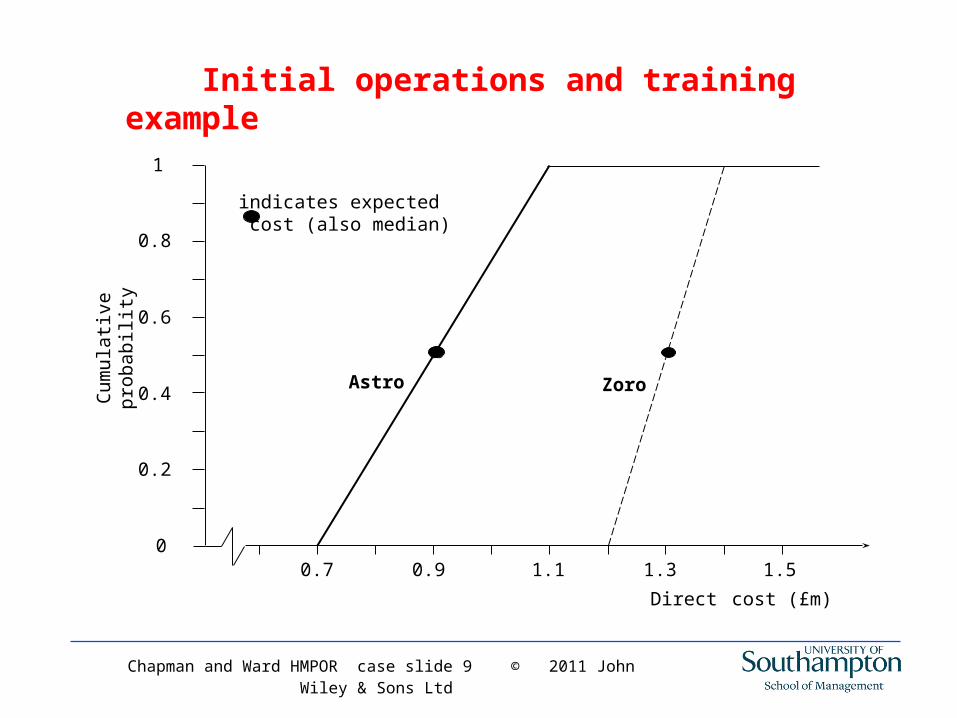
Initial operations and training example
Direct cost (£m)
Astro Zoro
0.7 0.9 1.1 1.3
Cum
ula
tive
pro
babi
lity
0.2
0.4
0.6
0.8
1
01.5
indicates expected cost (also median)
Chapman and Ward HMPOR case slide 10 © 2011 John Wiley & Sons Ltd
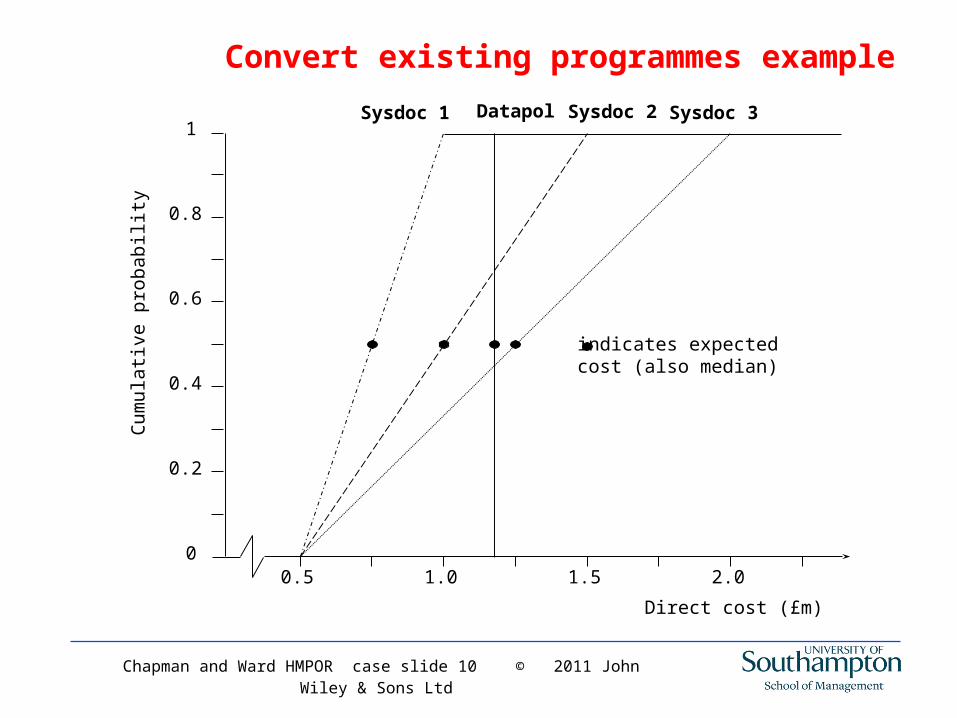
Convert existing programmes example
0.5 1.0 1.5 2.0
Direct cost (£m)
Cum
ula
tive
pro
babi
lity
0.2
0.4
0.6
0.8
1
0
indicates expectedcost (also median)
Sysdoc 1 Sysdoc 2 Sysdoc 3 Datapol
Chapman and Ward HMPOR case slide 11 © 2011 John Wiley & Sons Ltd
Linking this to common practice
• The value of simple ‘other objective’ assessments
early on• The value of simple initial cost estimates• The value of the ‘risk efficiency’ concept and its
assessment via simple linear cumulative probability distributions
Chapman and Ward HMPOR case slide 12 © 2011 John Wiley & Sons Ltd
Some concluding comments
• The key estimating process ideas have been used very successfully by a limited number of organisations
• Many of the key ideas can be applied to all opportunity, risk and uncertainty management processes

Chapman and Ward HMPOR case slide 13 © 2011 John Wiley & Sons Ltd
Transcon 2 case study discussion
Chris Chapman and Stephen Ward2 of 4 2011
Chapman and Ward HMPOR case slide 14 © 2011 John Wiley & Sons Ltd
Discussion starting point
Keep the working assumption that we are
maximizing the expected value of M = B – C,
where M = margin (contribution to profit)
B = bid (price)
C = cost (direct),
and we want to understand the expected value
of C, associated risk and decisions.
Now look at C when discrete events are explicitly involved.
Chapman and Ward HMPOR case slide 15 © 2011 John Wiley & Sons Ltd
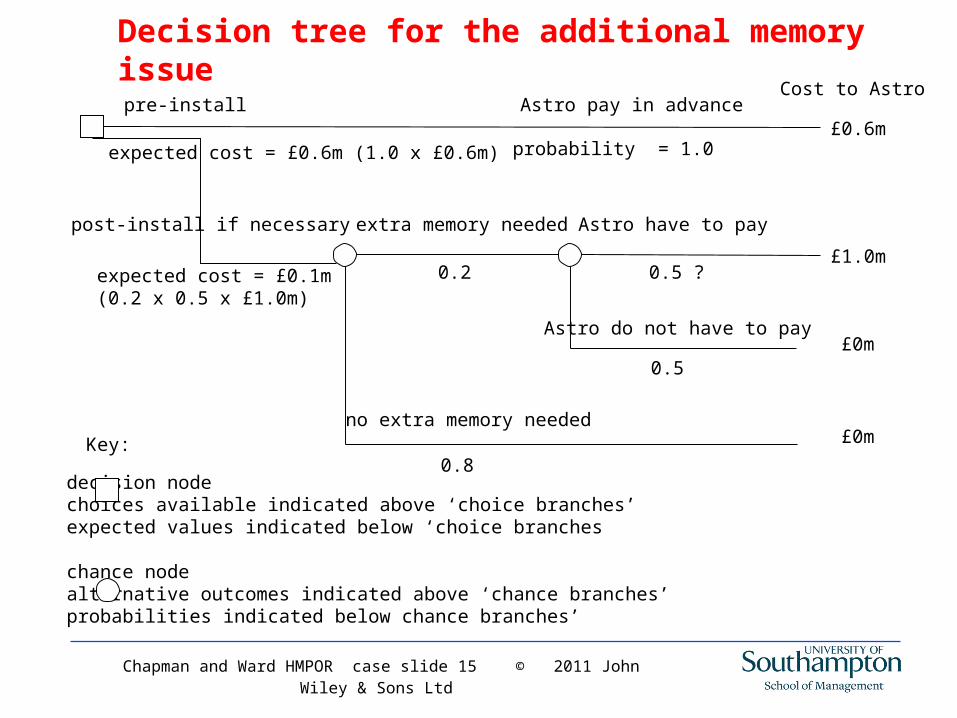
Decision tree for the additional memory issue
0.8Key:
decision nodechoices available indicated above ‘choice branches’expected values indicated below ‘choice branches
chance nodealternative outcomes indicated above ‘chance branches’probabilities indicated below chance branches’
Cost to Astro
£0.6m
£1.0m
£0m
£0m
pre-install
expected cost = £0.6m (1.0 x £0.6m)
post-install if necessary
expected cost = £0.1m(0.2 x 0.5 x £1.0m)
extra memory needed
0.2
Astro have to pay
0.5 ?
Astro do not have to pay
0.5
no extra memory needed
probability = 1.0
Astro pay in advance
Chapman and Ward HMPOR case slide 16 © 2011 John Wiley & Sons Ltd
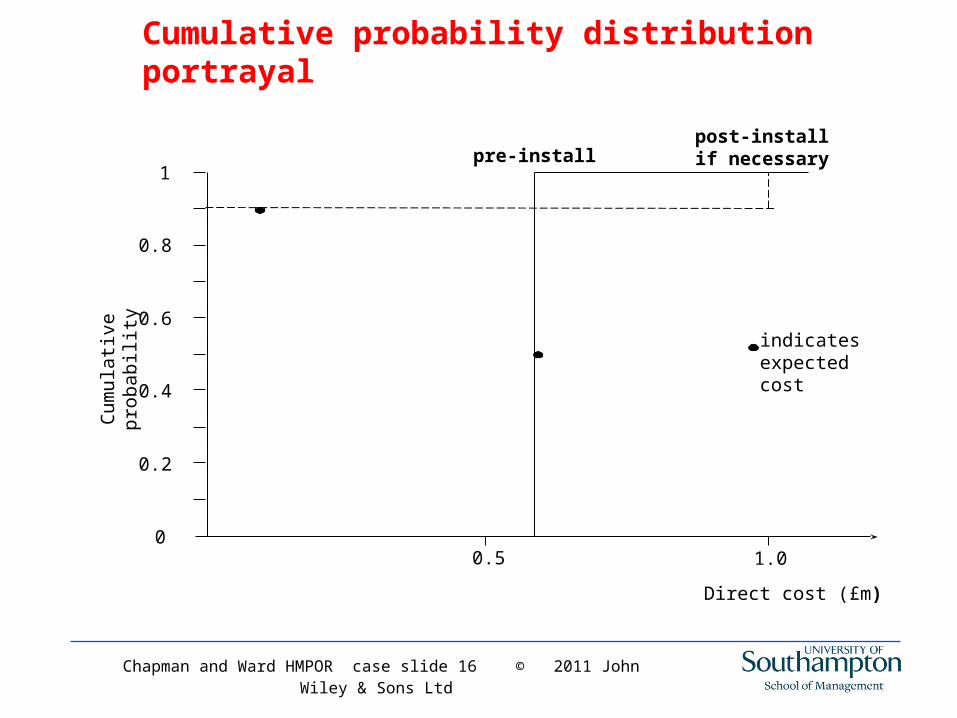
Cumulative probability distribution portrayal
indicatesexpectedcost
pre-installpost-installif necessary
0.5
0.2
0.4
0.6
0.8
1
0 1.0
Cum
ula
tive
pro
babi
lity
Direct cost (£m)
Chapman and Ward HMPOR case slide 17 © 2011 John Wiley & Sons Ltd
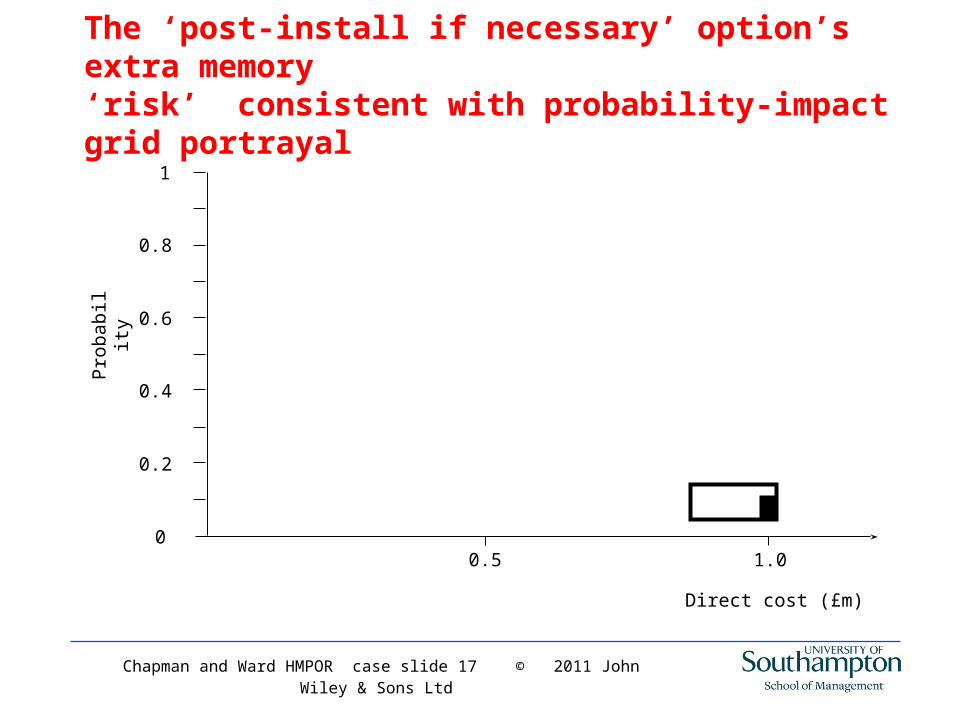
The ‘post-install if necessary’ option’s extra memory‘risk’ consistent with probability-impact grid portrayal
0.5
0.2
0.4
0.6
0.8
1
0 1.0
Pro
bab
ility
Direct cost (£m)
Chapman and Ward HMPOR case slide 18 © 2011 John Wiley & Sons Ltd
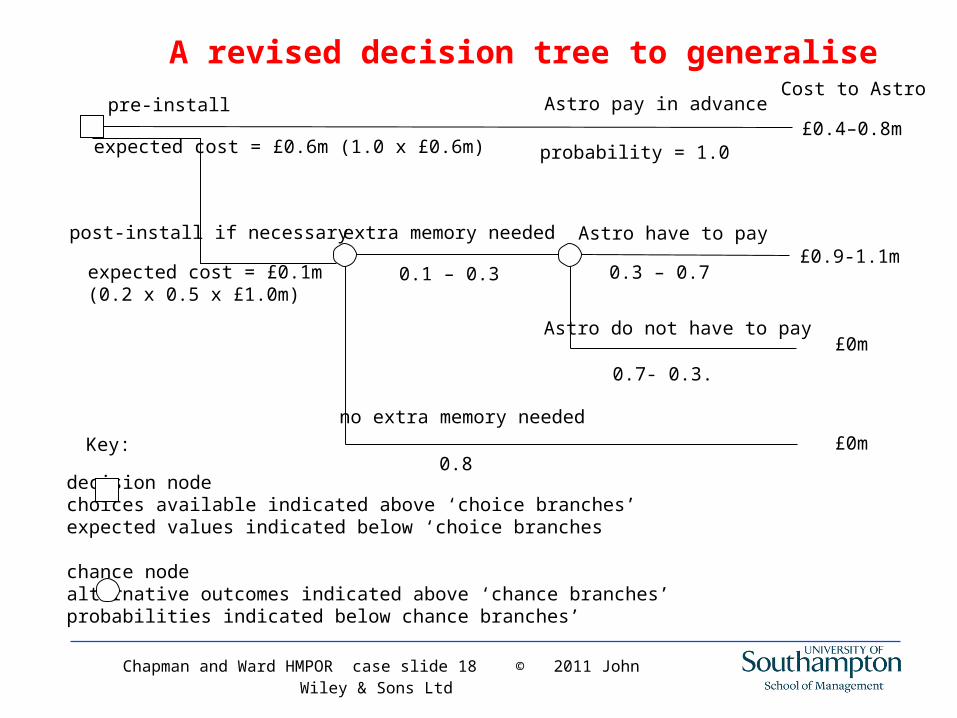
A revised decision tree to generalise
0.8Key:
decision nodechoices available indicated above ‘choice branches’expected values indicated below ‘choice branches
chance nodealternative outcomes indicated above ‘chance branches’probabilities indicated below chance branches’
Cost to Astro
£0.4–0.8m
£0.9-1.1m
£0m
£0m
pre-install
expected cost = £0.6m (1.0 x £0.6m)
post-install if necessary
expected cost = £0.1m(0.2 x 0.5 x £1.0m)
extra memory needed
0.1 – 0.3
Astro have to pay
0.3 – 0.7
Astro do not have to pay
0.7- 0.3.
no extra memory needed
probability = 1.0
Astro pay in advance
Chapman and Ward HMPOR case slide 19 © 2011 John Wiley & Sons Ltd
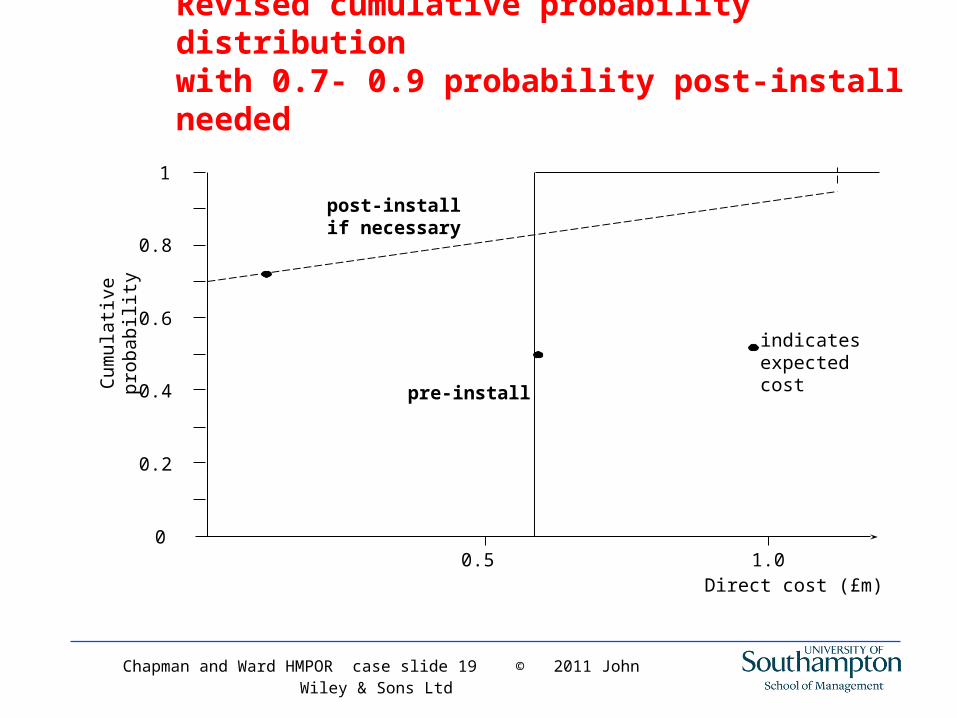
Revised cumulative probability distributionwith 0.7- 0.9 probability post-install needed
indicatesexpectedcostpre-install
post-installif necessary
0.5
0.2
0.4
0.6
0.8
1
01.0
Cum
ula
tive
pro
babi
lity
Direct cost (£m)
Chapman and Ward HMPOR case slide 20 © 2011 John Wiley & Sons Ltd
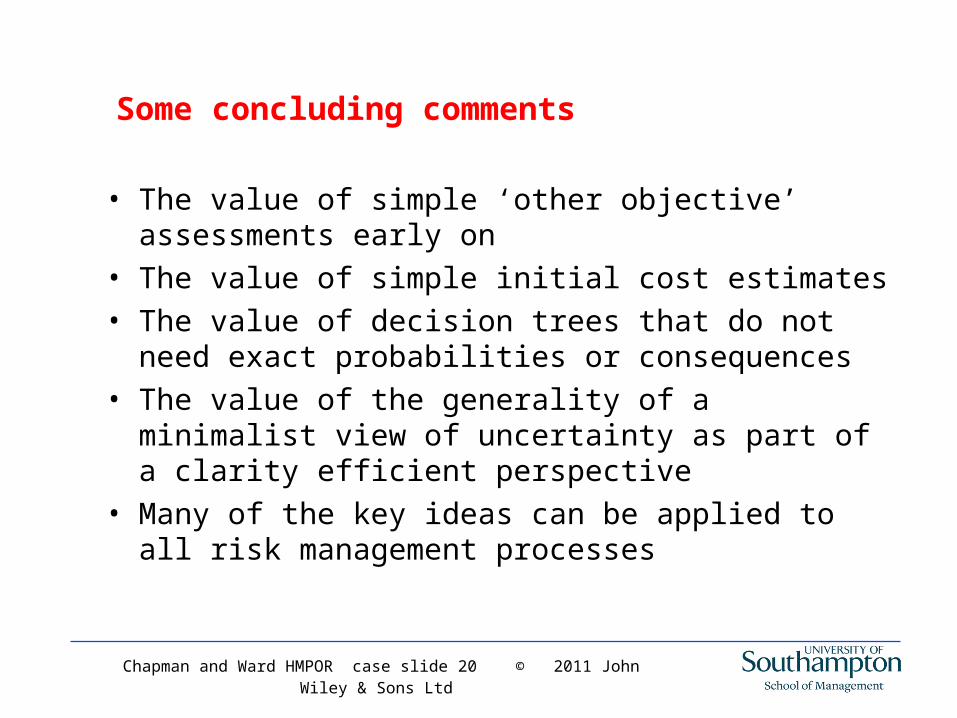
Some concluding comments
• The value of simple ‘other objective’ assessments early on
• The value of simple initial cost estimates• The value of decision trees that do not need exact
probabilities or consequences• The value of the generality of a minimalist view of
uncertainty as part of a clarity efficient perspective• Many of the key ideas can be applied to all risk
management processes

Chapman and Ward HMPOR case slide 21 © 2011 John Wiley & Sons Ltd
Transcon 3 case study discussion
Chris Chapman and Stephen Ward3 of 4 2011
Chapman and Ward HMPOR case slide 22 © 2011 John Wiley & Sons Ltd
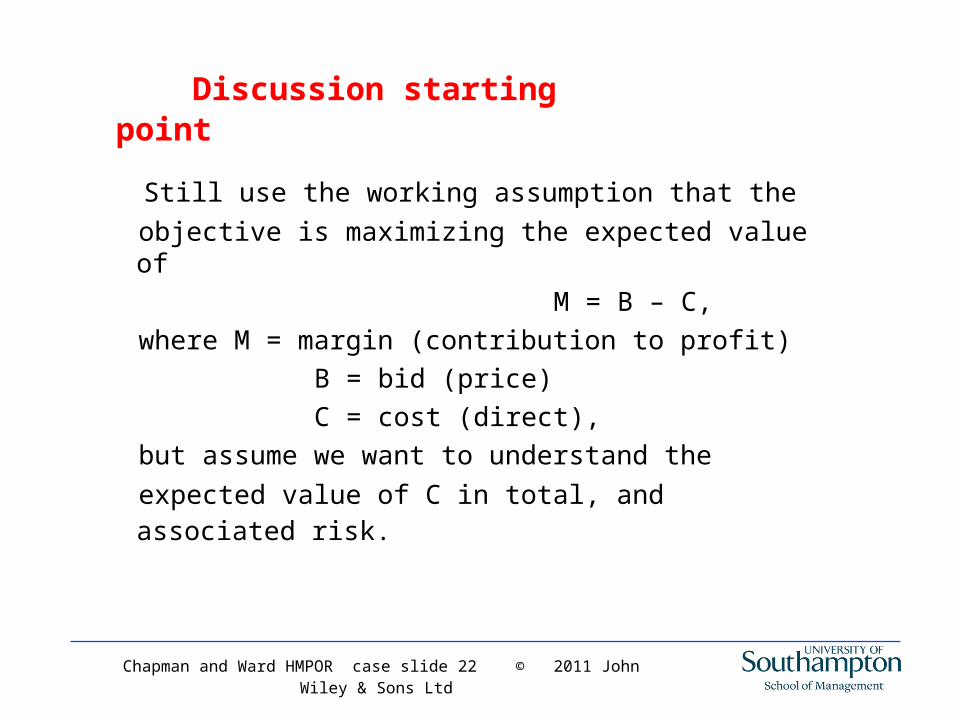
Discussion starting point
Still use the working assumption that the
objective is maximizing the expected value of
M = B – C,
where M = margin (contribution to profit)
B = bid (price)
C = cost (direct),
but assume we want to understand the
expected value of C in total, and associated risk.
Chapman and Ward HMPOR case slide 23 © 2011 John Wiley & Sons Ltd
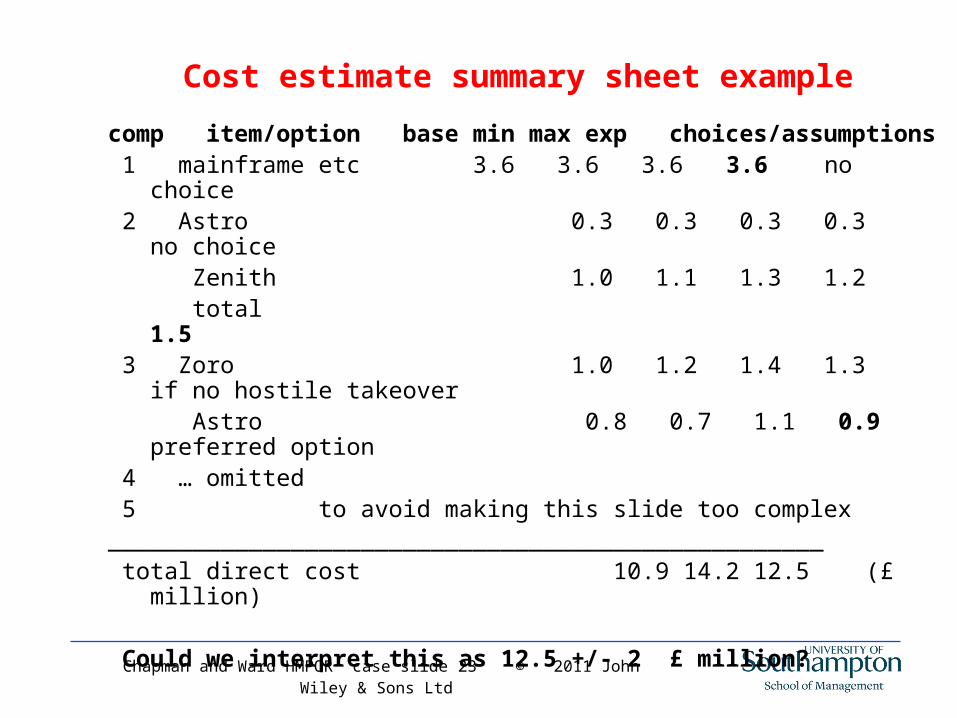
Cost estimate summary sheet example
comp item/option base min max exp choices/assumptions 1 mainframe etc 3.6 3.6 3.6 3.6 no choice 2 Astro 0.3 0.3 0.3 0.3 no choice Zenith 1.0 1.1 1.3 1.2 total 1.5 3 Zoro 1.0 1.2 1.4 1.3 if no hostile takeover Astro 0.8 0.7 1.1 0.9 preferred option 4 … omitted 5 to avoid making this slide too complex___________________________________________________ total direct cost 10.9 14.2 12.5 (£ million) Could we interpret this as 12.5 +/- 2 £ million?
Chapman and Ward HMPOR case slide 24 © 2011 John Wiley & Sons Ltd
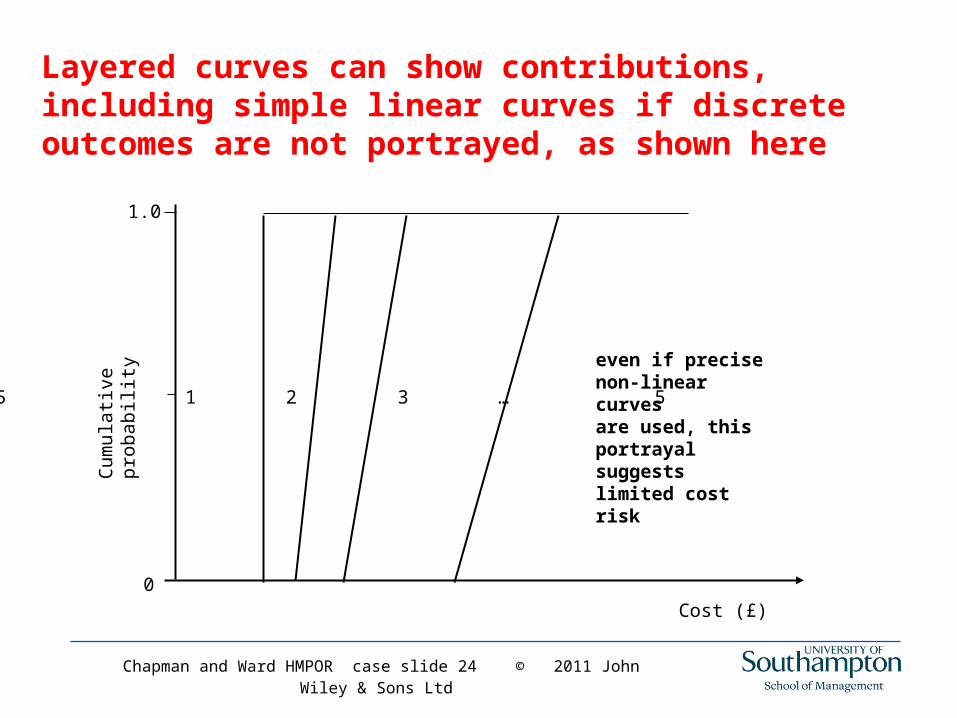
Layered curves can show contributions, including simple linear curves if discrete outcomes are not portrayed, as shown here
0.5 1 2 3 … 5
0
1.0
Cost (£)
Cum
ula
tive
pr
obab
ility
even if precisenon-linear curvesare used, this portrayal suggestslimited cost risk
Chapman and Ward HMPOR case slide 25 © 2011 John Wiley & Sons Ltd
Linking this to common practice
• The value of simple estimating processes
• The value of more complex estimating processes in
their own right and as the basis of simple estimates
• The key estimating process ideas have been used very successfully by a limited number of organisations
Chapman and Ward HMPOR case slide 26 © 2011 John Wiley & Sons Ltd
Some concluding comments
• Many of the key process ideas can be applied to all opportunity, risk and uncertainty management processes
• Designing processes for contexts is an overarching key idea
• Seeking simplicity systematically in these processes is another key idea, introducing complexity where it pays being a crucial part of this

Chapman and Ward HMPOR case slide 27 © 2011 John Wiley & Sons Ltd
Transcon 4 case study discussion
Chris Chapman and Stephen Ward4 of 4 2011
Chapman and Ward HMPOR case slide 28 © 2011 John Wiley & Sons Ltd
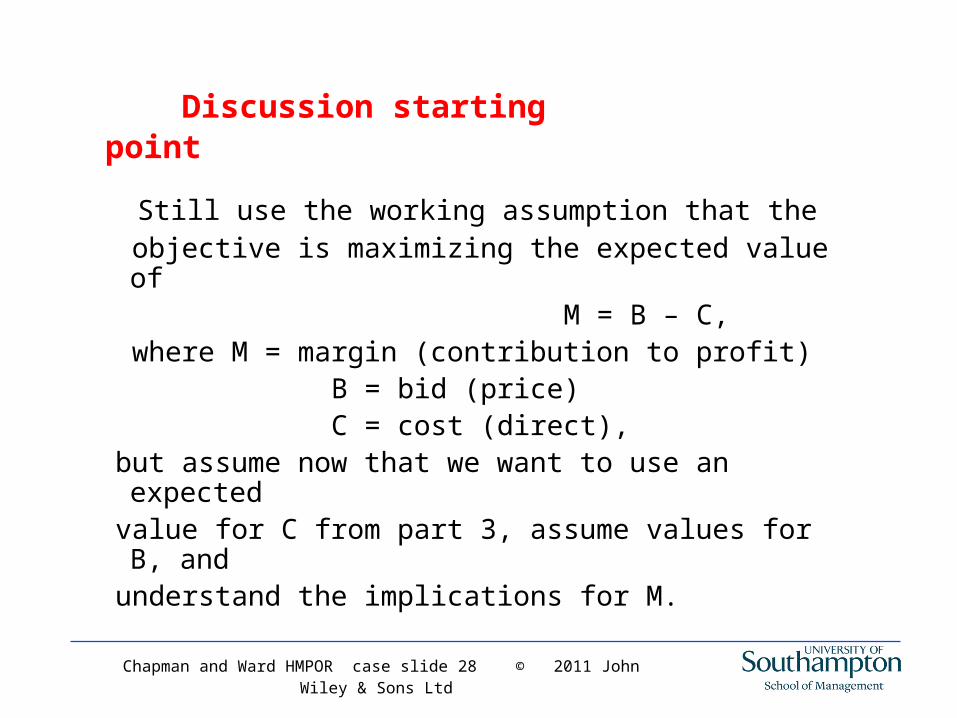
Discussion starting point
Still use the working assumption that the objective is maximizing the expected value of M = B – C, where M = margin (contribution to profit) B = bid (price) C = cost (direct), but assume now that we want to use an expected value for C from part 3, assume values for B, and understand the implications for M.
Chapman and Ward HMPOR case slide 29 © 2011 John Wiley & Sons Ltd
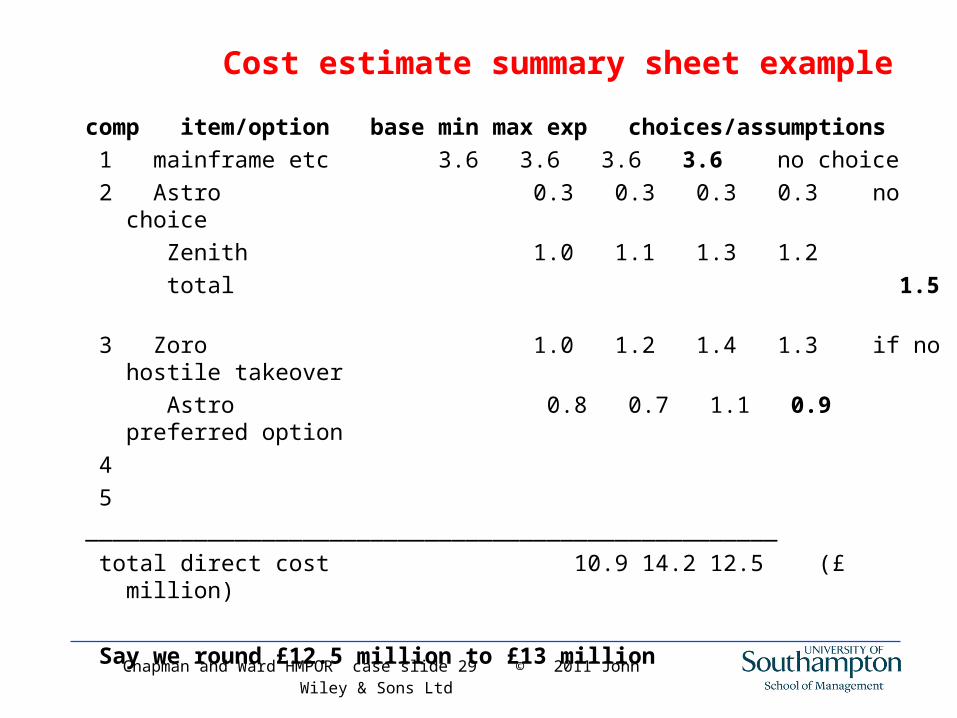
Cost estimate summary sheet example
comp item/option base min max exp choices/assumptions
1 mainframe etc 3.6 3.6 3.6 3.6 no choice
2 Astro 0.3 0.3 0.3 0.3 no choice
Zenith 1.0 1.1 1.3 1.2
total 1.5
3 Zoro 1.0 1.2 1.4 1.3 if no hostile takeover
Astro 0.8 0.7 1.1 0.9 preferred option
4
5
___________________________________________________
total direct cost 10.9 14.2 12.5 (£ million)
Say we round £12.5 million to £13 million
Chapman and Ward HMPOR case slide 30 © 2011 John Wiley & Sons Ltd
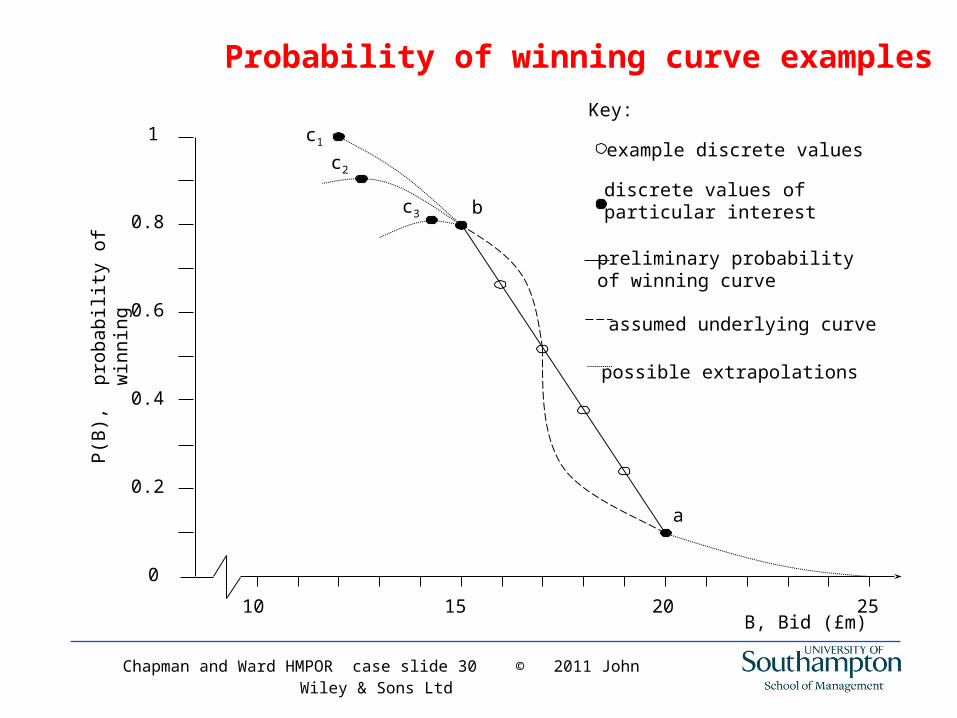
Probability of winning curve examples
Key:
example discrete values
discrete values of particular interest
preliminary probabilityof winning curve
assumed underlying curve
possible extrapolations
10 15 20 25B, Bid (£m)
P(B
),
prob
abili
ty o
f w
inn
ing
0.2
0.4
0.6
0.8
1
0
c1
c2
c3 b
a
Chapman and Ward HMPOR case slide 31 © 2011 John Wiley & Sons Ltd
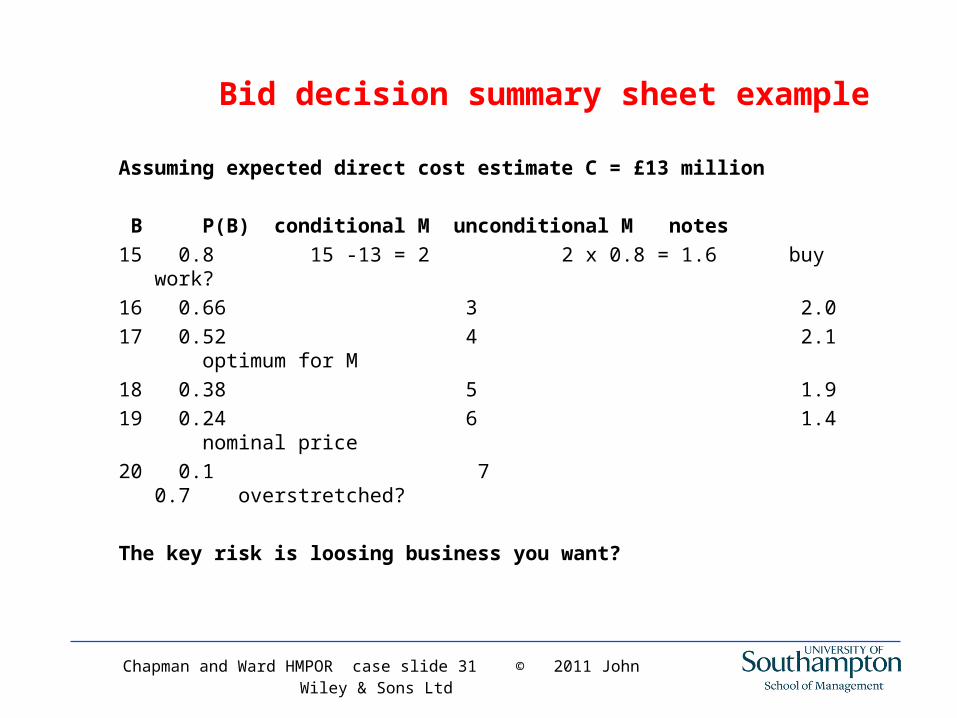
Bid decision summary sheet example
Assuming expected direct cost estimate C = £13 million
B P(B) conditional M unconditional M notes
15 0.8 15 -13 = 2 2 x 0.8 = 1.6 buy work?
16 0.66 3 2.0
17 0.52 4 2.1 optimum for M
18 0.38 5 1.9
19 0.24 6 1.4 nominal price
20 0.1 7 0.7 overstretched?
The key risk is loosing business you want?
Chapman and Ward HMPOR case slide 32 © 2011 John Wiley & Sons Ltd
Linking this to common practice
• The value of simple ‘other objective’ assessments early on
• The value of simpler and more complex cost estimates• The value of simpler and more complex bid curve
(probability of winning) estimates
What do more complex bid curve
estimates involve?
Chapman and Ward HMPOR case slide 33 © 2011 John Wiley & Sons Ltd
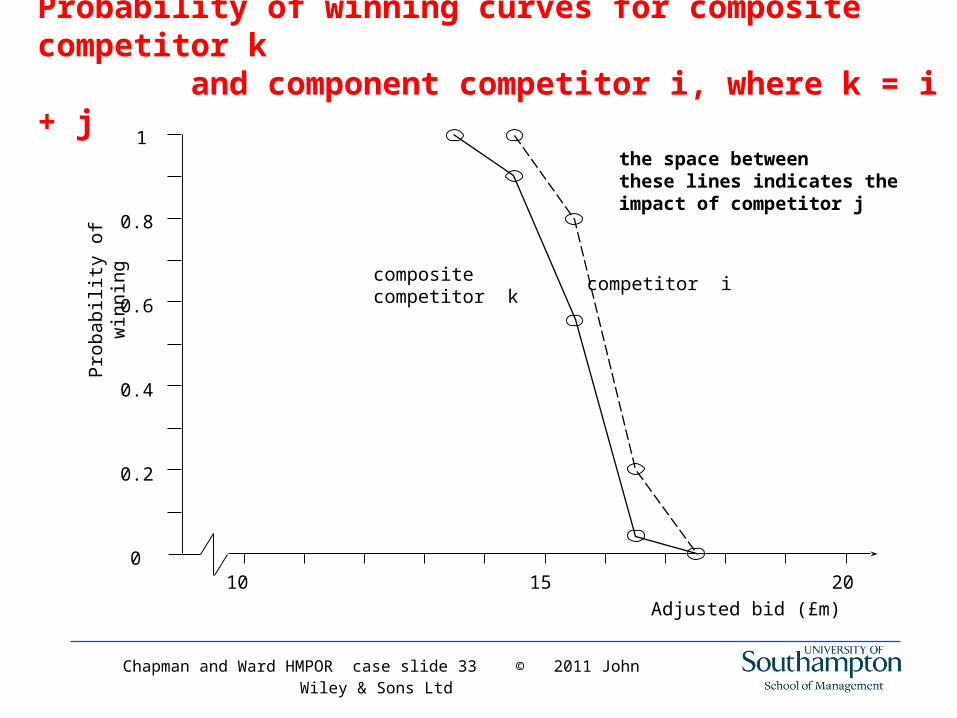
Probability of winning curves for composite competitor k and component competitor i, where k = i + j
competitor icompositecompetitor k
the space betweenthese lines indicates theimpact of competitor j
10 15 20
Adjusted bid (£m)
Pro
bab
ility
of
win
ning
0.2
0.4
0.6
0.8
1
0
Chapman and Ward HMPOR case slide 34 © 2011 John Wiley & Sons Ltd
Some concluding comments
• The key bidding process ideas have been used very successfully by a limited number of organisations
• Many of the key process ideas can be applied to all opportunity, risk and uncertainty management processes
• Designing processes for contexts is an overarching key idea
• Seeking simplicity systematically in these processes is another key idea, introducing complexity where it pays being a crucial part of this, part of the overarching opportunity efficiency concept