Embed Size (px)
Citation preview
Oceans and Ecosystems Research Changing levels of Oceanic Carbon Dioxide Rik Wanninkhof
Rik Wanninkhof AOML Program Review, 4-6 March 2014

AOML Program Review
Programmatic drivers of Ocean Carbon Cycle efforts US Carbon Cycle Science Program
• An interagency effort
Carbon Cycle Science Plan: www.carboncyclescience.gov within the USGCRP Strategic Plan and the annual research priorities of the USGCRP
• Federal Ocean Acidification Research and Monitoring Act (FOARAM) Act of 2009
• A global community effort (IOC, WCRP, Future Earth/ICSU) International efforts in support of assessments of the Global Carbon Project http://www.globalcarbonproject.org/

AOML Program Review
Overarching questions
• What is the sea-air CO2 flux across the interface (SOCAT & Takahashi)?
• What are the decadal changes in inventories of anthropogenic carbon(GO-SHIP)?
• What are the patterns of coastal ocean CO2 levels and how are they affecting marine biota? (Ocean acidification)

AOML Program Review
The Problem
• Atmospheric CO2 levels are changing due to release of the green house gas CO2 which is considered a pollutant (EPA, 2009).
• Pollutant levels and impact of pollutants require monitoring. • Of the 10 Pg C emitted by burning of fossil fuels, ≈50 % remain in
the atmospheric, the remainder is taken up by land plants and oceans.
• We study the uptake by the oceans both from a “bookkeeping” perspective, and to assess impact of rising CO2 levels on biogeochemistry.
In 2009 EPA qualified the increasing CO2 levels as a pollutant along with the other greenhouse gases Ch4, N2O, HCFCs, PCFCs, and SF6
AOML Program Review
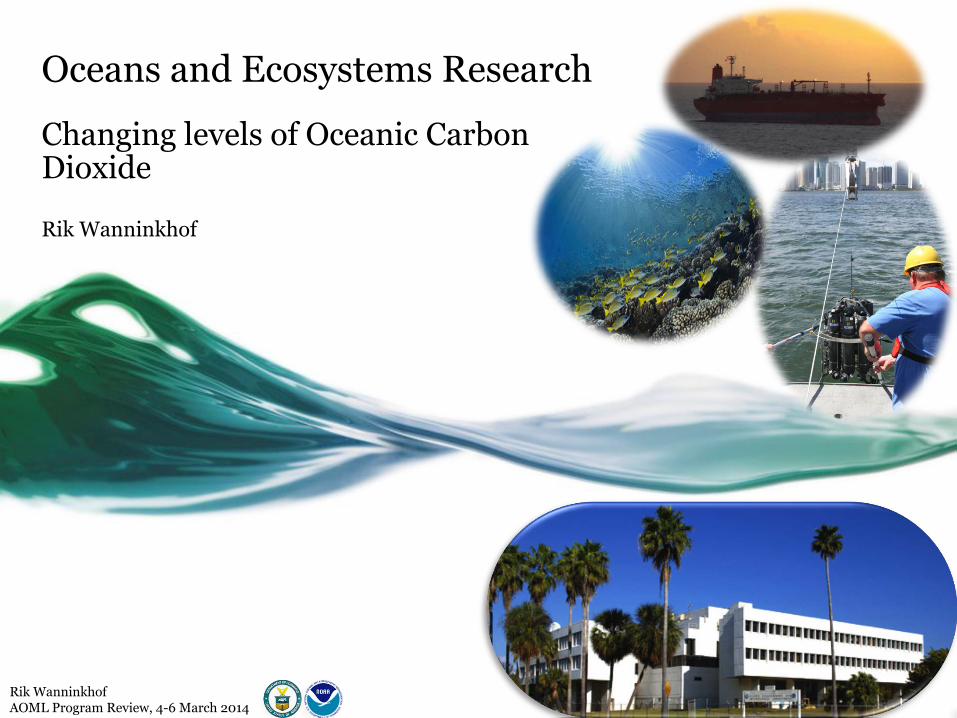
How much is 10 Pg C?
In 2012 9.7 Pg C was released to the atmosphere by
burning of fossil fuel. Of the total emissions from
human activities during the period 2003-2012, about
45% accumulated in the atmosphere, 27% in the
ocean and 27% on land (GCP, 2013).
Mitigation by capture is challenging:
If compressed into liquid CO2 and stored as
suggested as a mitigation action this equates to filling
the volume of the Empire State building every day
AOML Program Review
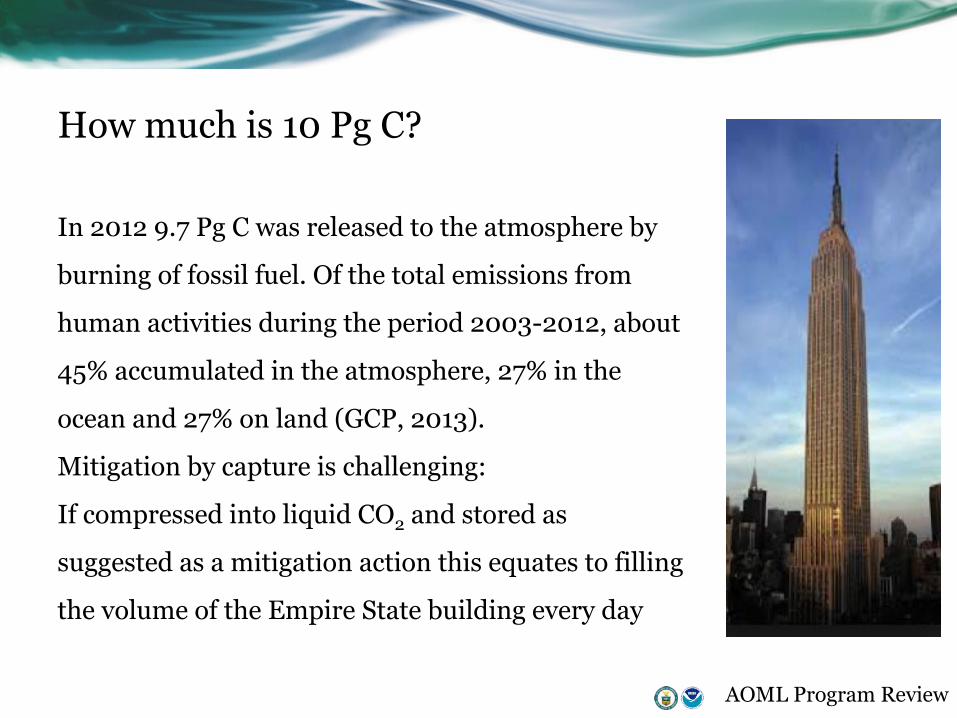
What is the sea-air CO2 flux across the interface? Efforts: SOCAT & Takahashi climatology
Performance measure: Constrain the sea-air CO2 fluxes to 0.2 Pg C/yr The NOAA funded ship of opportunity program lead by AOML (2 NOAA labs, 3 CIs ,ad 3 academic institutions) with 15 ships contribute 50 % (≈ 5 M datapoints) of the global surface water CO2 data (IOCCP-SOCAT) A Mul&-‐na&onal Effort: USA, Japan, Australia, Norway, England, France, Netherlands, Germany, Spain, China
AOML Program Review
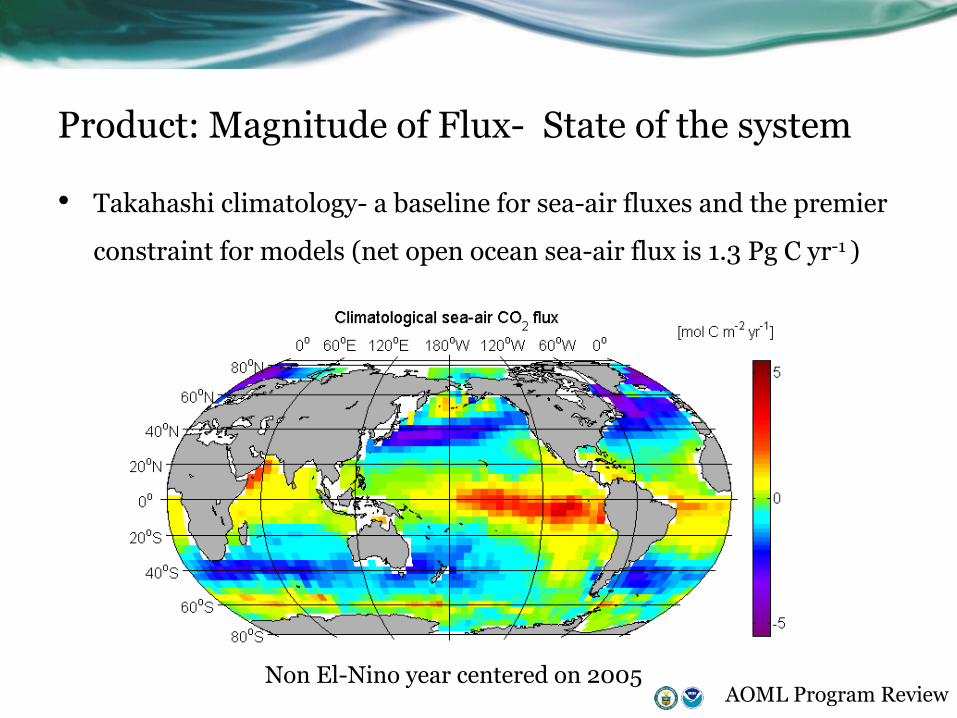
Product: Magnitude of Flux- State of the system
• Takahashi climatology- a baseline for sea-air fluxes and the premier
constraint for models (net open ocean sea-air flux is 1.3 Pg C yr-1 )
Non El-Nino year centered on 2005
AOML Program Review
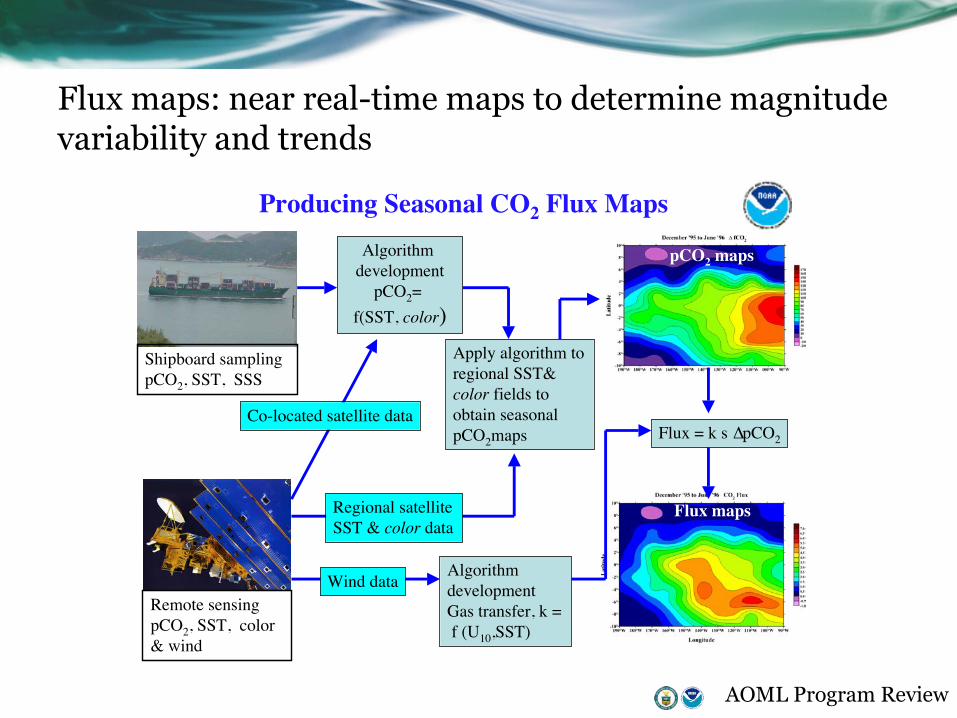
Flux maps: near real-time maps to determine magnitude variability and trends
Producing Seasonal CO2 Flux Maps
Shipboard samplingpCO2, SST, SSS
Remote sensingpCO2, SST, color& wind
Algorithm development
pCO2= f(SST, color)
Co-located satellite data
Regional satelliteSST & color data
Apply algorithm toregional SST&color fields toobtain seasonalpCO2maps
AlgorithmdevelopmentGas transfer, k = f (U10,SST)
Wind data
pCO2 maps
Flux maps
Flux = k s ∆pCO2

AOML Program Review
Global Ocean Carbon Uptake: Magnitude, Variability and Trends
Rik Wanninkhof1, Geun-Ha Park2, Taro Takahashi3, Colm Sweeney4,14, Richard Feely5, Yukihiro Nojiri6, Nicolas Gruber7, Scott C. Doney8, Galen A. McKinley9, Andrew Lenton10, Corinne Le Quéré11, Christoph Heinze12 , Jörg Schwinger12, Heather Graven7,13, Samar Khatiwala3
Wanninkhof et al. 2013,Biogeosciences, RECCAP

AOML Program Review
Trends in ocean uptake : Estimates based on surface values are appreciably shorter than models based on interior changes: artifact or feedback?
Wanninkhof et al. 2013
AOML Program Review
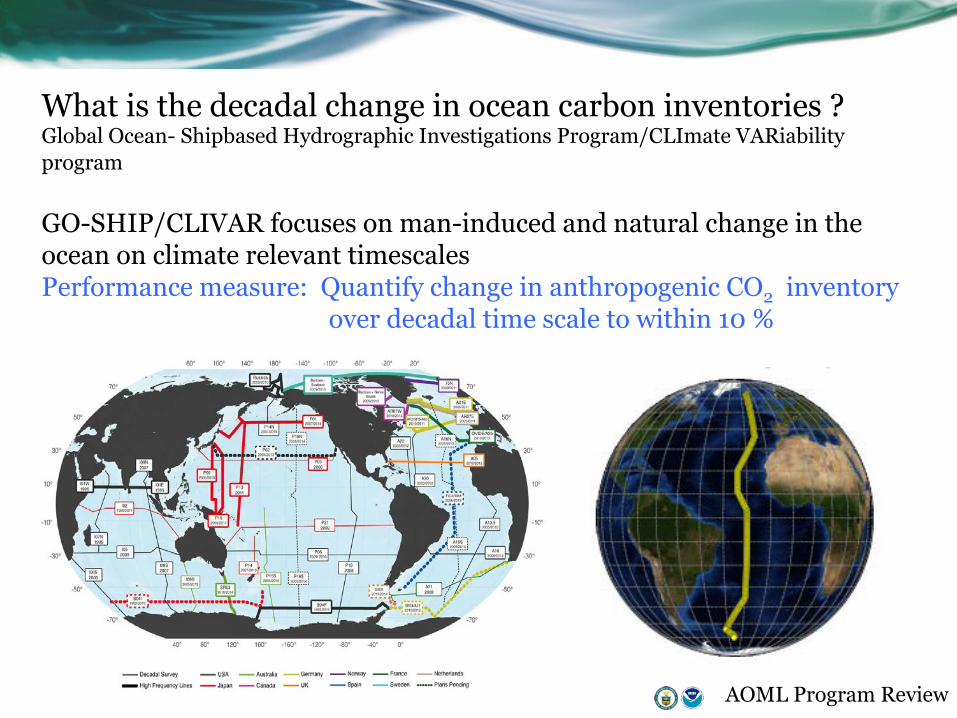
What is the decadal change in ocean carbon inventories ? Global Ocean- Shipbased Hydrographic Investigations Program/CLImate VARiability program GO-SHIP/CLIVAR focuses on man-induced and natural change in the ocean on climate relevant timescales Performance measure: Quantify change in anthropogenic CO2 inventory
over decadal time scale to within 10 %

AOML Program Review
GO-SHIP CLIVAR/CO2 A16 section Lead by scientists at AOML Participants from 2 NOAA labs., 3 CI’s, 10 academic institutions DIC cross section 2013 Change in DIC between 2013 and 2003
Primary purpose: Serving climate quality data within 6-months to the science community
About 5000 DIC datapoints from 3 cruise sections Shipboard data management and QC tools provides ability for shipboard checks Preliminary data of sufficient quality for qualitative state and change estimates

AOML Program Review
Determining change in anthropogenic CO2 (Canthro)requires accounting for natural variability Utilize: Co-variance of “natural” DIC with nutrients and oxygen
Use of inert transient tracers (CFC, SF6)
Highlight: Greater uptake in S. Atlantic than N. Atlantic
Wanninkhof, R., Doney, S., Bullister, J. L., Levine, N. M., Warner, M. J., and Gruber, N.: Detecting anthropogenic CO2 changes in the interior Atlantic Ocean between 1989 and 2005, J Geophys. Res., 115, , C11028, doi:10.1029/2010JC006251, 2010.
Canthro change from 1990 to 2004
Wanninkhof et al. 2010

AOML Program Review
Comparison of global estimate of Canthro of decadal change with individual lines (mid 2000’s - mid1990’s)
The background estimate are preliminary results based on a modified eMLR method (Clement and Gruber, 2014), while the individual dots represents published estimates based on the original eMLR method, such as Wanninkhof et al., 2010 (Atlantic A16) and Sabine et al. 2008 (Pacific P16
Gruber et al., 2014
Mol/m2/yr
Global mean
AOML Program Review
What are the patterns of coastal ocean CO2 levels and how are they affecting marine biota? (Ocean acidification) Performance measure: determine aragonite saturation state to 0.2 Focus on building a coastal observing system with emphasis on water column carbon dynamics Applying what we’ve learned in to open ocean to the coastal ocean. Ø Instrumental techniques Ø Data management Ø Data Quality Control Ø Data interpolation If we extrapolate open ocean data to the coast we obtain a coastal sink for carbon of -0.18 pG C year (independent assessments of coastal fluxes -0.1 to -1 Pg C with most recent estimates ≈0.2 Pg C)
AOML Program Review
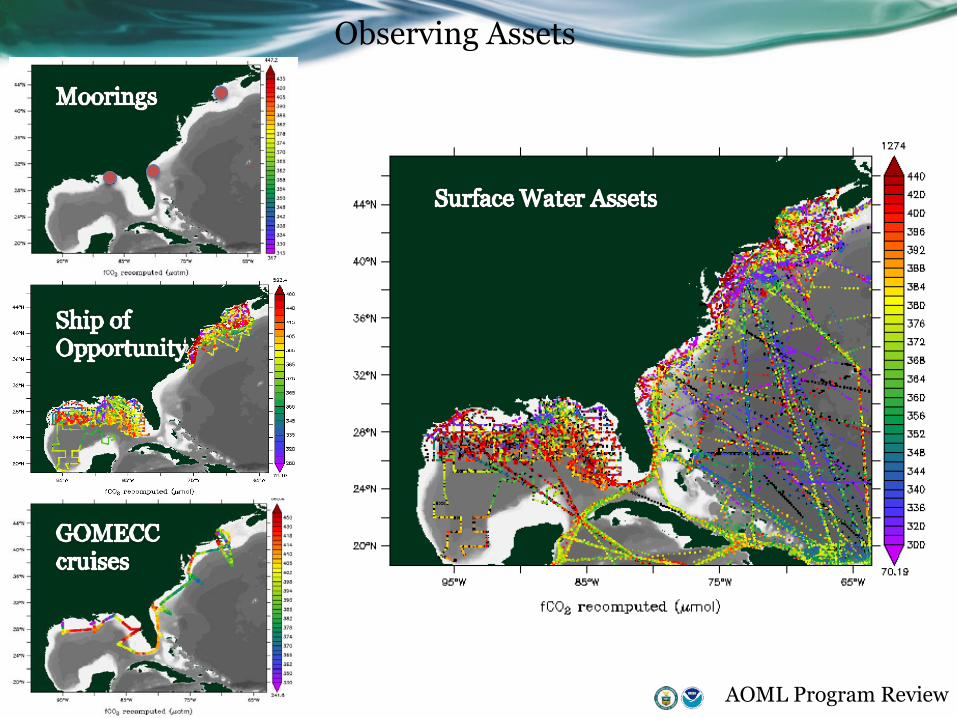
Observing Assets
AOML Program Review
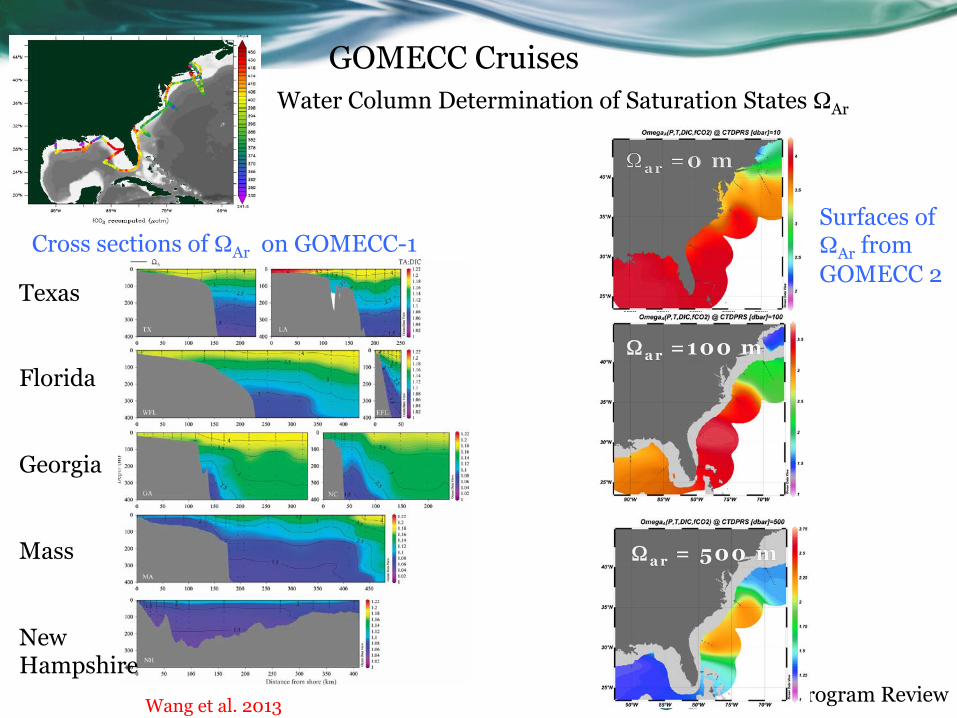
GOMECC Cruises Water Column Determination of Saturation States ΩAr
Ωa r =100 m
Ωa r = 500 m
Cross sections of ΩAr on GOMECC-1
Texas Florida Georgia Mass New Hampshire Wang et al. 2013
Surfaces of ΩAr from GOMECC 2

AOML Program Review
Aragonite Saturation State (Ωar) Maps Aragonite Saturation State: ΩAr = [Ca2+] [CO3
2-]/Ksp
Modelling/Algorithm development
Dry season Wet Season
Ωar = f (Alk, pCO2) Alk = f (SSS, SST)
Validation

AOML Program Review Photo: David Wisegarver, PMEL

AOML Program Review
Long-term goal: Climate Adaptation and Mitigation Objective: Improved scientific understanding of the changing climate system and its impacts The need to advance understanding of the climate system and climate impacts, improve climate predictions and projections, and better inform adaptation and mitigation strategies is urgent. Key scientific uncertainties limit scientists’ ability to understand and predict changes in the climate system. This is particularly true for monthly-to-decadal timescales and at the regional and local levels for which scales are highly relevant to planning and decision making. http://www.ppi.noaa.gov/goals/ You’ve got to measure and measure well before you can understand
AOML Program Review
Charge As outlined in the “purpose of the review” section of the “charge to reviewers,” Laboratory scientific reviews are conducted to help the Laboratory: 1. in its strategic planning of its future science, 2. to ensure that Laboratory research is linked to the NOAA Strategic Plan, 3. is relevant to OAR mission and priorities, 4.is of high quality as judged by preeminence criteria, 5. and is carried out with a high level of performance.


![Fisheries and Aquaculture in our Changing Climate · The build-up of carbon dioxide and other greenhouse gases in our atmosphere [1] is changing several of the features of the earth’s](https://img.pdfslide.us/doc/110x75/5fbbde7fa1f1a3536717bf68/fisheries-and-aquaculture-in-our-changing-the-build-up-of-carbon-dioxide-and-other.jpg)