Embed Size (px)
Citation preview
Biophysical Journal Volume 107 November 2014 2141–2150 2141
Article
Changing Chromatin Fiber Conformation by Nucleosome Repositioning
Oliver Muller,1 Nick Kepper,2 Robert Schopflin,1 Ramona Ettig,2 Karsten Rippe,2 and Gero Wedemann1,*1Institute for Applied Computer Science, University of Applied Sciences Stralsund, Stralsund, Germany; and 2DeutschesKrebsforschungszentrum and BioQuant, Heidelberg, Germany
ABSTRACT Chromatin conformation is dynamic and heterogeneous with respect to nucleosome positions, which can bechanged by chromatin remodeling complexes in the cell. These molecular machines hydrolyze ATP to translocate or evictnucleosomes, and establish loci with regularly and more irregularly spaced nucleosomes as well as nucleosome-depletedregions. The impact of nucleosome repositioning on the three-dimensional chromatin structure is only poorly understood.Here, we address this issue by using a coarse-grained computer model of arrays of 101 nucleosomes considering severalchromatin fiber models with and without linker histones, respectively. We investigated the folding of the chain in dependenceof the position of the central nucleosome by changing the length of the adjacent linker DNA in basepair steps. We found inour simulations that these translocations had a strong effect on the shape and properties of chromatin fibers: i), Fiber curvatureand flexibility at the center were largely increased and long-range contacts between distant nucleosomes on the chain werepromoted. ii), The highest destabilization of the fiber conformation occurred for a nucleosome shifted by two basepairs fromregular spacing, whereas effects of linker DNA changes of ~10 bp in phase with the helical twist of DNA were minimal. iii),A fiber conformation can stabilize a regular spacing of nucleosomes inasmuch as favorable stacking interactions betweennucleosomes are facilitated. This can oppose nucleosome translocations and increase the energetic costs for chromatin remod-eling. Our computational modeling framework makes it possible to describe the conformational heterogeneity of chromatinin terms of nucleosome positions, and thus advances theoretical models toward a better understanding of how genome compac-tion and access are regulated within the cell.
INTRODUCTION
The eukaryotic genome is hierarchically organized intochromatin. Its conformation is an important factor for regu-lating DNA accessibility for gene expression, replication,and repair (1,2). The basic repeating unit of chromatin isthe nucleosome, which consists of an octameric proteincore composed of two copies each of histone proteinsH2A, H2B, H3, and H4, and 146 bp of DNA wrappedaround the histone core in ~1.65 turns (3,4). A fifth histoneprotein, the linker histone H1 or its avian counterpart H5,can associate with the nucleosome core and promote furthercompaction (5). The nucleosomes are connected by theintervening linker DNA, which measures 20–80 bp, depend-ing on the organism, tissue, or cell type. Furthermore, vari-ations of linker DNA length are found within the genome ofa single cell (6).
In low salt, nucleosomes connected by linker DNA adoptan open beads-on-a-string-like structure (2). Under physio-logical salt conditions this structure condenses in vitro intoa fiber-like arrangement of nucleosomes with a diameterof ~30 nm, referred to as 30 nm chromatin fiber (7). Thedetailed structure of the 30 nm chromatin fiber in vitroand within the cell is still under investigation. Various
Submitted February 10, 2014, and accepted for publication September 12,
2014.
*Correspondence: [email protected]
Editor: Jason Kahn.
� 2014 by the Biophysical Society
0006-3495/14/11/2141/10 $2.00
studies have proposed different conformational models(8–18). The presence of 30 nm fibers in transcriptionallyinactive cells like starfish sperm (19) and avian erythrocyte(20) was shown by electron microscopy. The analysisof other cellular systems led to the conclusion that thedominant chromatin structure are irregular 10-nm chainsin a polymer melt three-dimensional (3D) organization(21–25). This type of chromatin folding is promoted byhigh nucleosome concentrations and an irregular spacingof nucleosomes as discussed previously (26). Interestingly,regularly spaced arrays up to several hundred nucleosomeswere identified in human lymphoblastoid cell lines byhigh-resolution nucleosome positioning mapping (27). Inthe latter study, it was estimated that regularly spaced tractsof nucleosomes may be present in almost half of thegenome. Although no data on the 3D-folding of the aboveregularly spaced regions within the cell exist, in vitro studiesshowed that these types of arrays adopt regular 30-nm-typechromatin fibers (8,13,18). To date, the latter studies providethe highest resolution of folded nucleosome chains, whichserve here as well-defined in vitro reference systems fordissecting the properties of nucleosome chains by computersimulations.
The 30 nm chromatin fiber models proposed in the liter-ature describe the spatial arrangement of the nucleosomeswith respect to each other and the path of the connectinglinker DNA. Most models can be assigned to one of two
http://dx.doi.org/10.1016/j.bpj.2014.09.026
2142 Muller et al.
main categories: solenoid and zigzag models. In solenoidmodels nucleosomes form stacks with their direct neighborsin the nucleosome chain, with the linker DNA bending to-ward the fiber center. In contrast, in zigzag or crossed-linkermodels nucleosomes are stacked only with nonneighbors inthe nucleosome chain, with the linker DNA passing straightthrough the fiber center in a zigzag manner (28,29). Inrecent years, approaches to model chromatin structure anddynamics by means of computer simulation consideringthe effects of energy and thermal fluctuations have madesignificant progress as reviewed recently (26). In particular,the size of systems and level of molecular detail amenable tonumerical simulations has been largely improved (30–32).Current models of the 30 nm chromatin fiber frequentlyassume regularly spaced nucleosomes with uniform linkerDNA length. However, for chromatin in vivo variations innucleosome spacing are observed throughout the genomeand between cell types (6,27,33–36). At some genomicregions and around binding sites of the transcription factorCTCF, nucleosomes are highly ordered (6,27,37). However,in general, the heterogeneity of nucleosome spacing withina given genomic locus is considerable as discussed in ourprevious work (36,38).
To incorporate a nonconstant repeat length Woodcocket al. (39) introduced Gauss-distributed linker variationsinto their chromatin model; these led to changes in fiberdirection and apparent discontinuities. A study using com-puter simulations of nucleosome chains with varying anglesbetween adjacent nucleosomes showed an increase in fiberflexibility with increasing variability (40). Both modelsinvestigated the effect of an overall distribution of varyinglinker length, not the effect of individual repositionednucleosomes.
The positions of nucleosomes in vivo are not fixed butactively regulated by specific proteins, so-called chromatinremodeling complexes, which can change the packagingstate of chromatin to control critical cellular processessuch as gene regulation. These ATP-driven proteins havethe capability to disrupt nucleosome-DNA contacts, movenucleosomes along DNA, and remove or exchange nucleo-somes (41–43). The remodeling complexes translocatenucleosomes in small well-defined steps (44,45). Thus,nucleosome positions are dynamically controlled on thelevel of individual nucleosomes by the cell.
Here, we have investigated the impact of repositioning asingle nucleosome in the context of various chromatin fiberconformations using a computer model, which aims at theunderstanding of the folding of larger structures neglectingdetailed electrostatics (17,40,46). We analyzed the effectsof repositioning on the global chromatin fiber shape anddetermined the energetic barriers imposed on nucleosomerepositioning by structural properties, Furthermore, weconsidered changes in nucleosomal contact probabilities.These analyses provide indications for key mechanisms ofthe interaction between higher-order chromatin structure
Biophysical Journal 107(9) 2141–2150
and nucleosome repositioning. To clearly identify theeffects of repositioning and to prevent the interference ofmultiple irregularities, only a single nucleosome was mani-pulated in an otherwise regularly spaced nucleosome chain.We find that the single nucleosome translocations can havelarge effects on the shape and properties of chromatin fiberswith respect to the global geometry as well as short- andlong-range interactions between nucleosomes.
MATERIALS AND METHODS
A computer simulation approach was used to study the impact of reposi-
tioning a single nucleosome on fiber structure and energetics. For every
repositioning step, an accordingly modified structure was simulated using
a coarse-grained Monte Carlo simulation model in combination with a
feedback-optimized replica exchange approach (17,46,47). The resulting
fiber trajectories were analyzed to investigate the energetic and conforma-
tional changes over the range from 0 to 10 bp of repositioning in basepair
resolution.
Coarse-grained chromatin model
Weused a coarse-grainedmodel of chromatin,which has been described pre-
viously (26,46,48), and especially in great detail in the supplementalmaterial
of (17). The linker DNA between nucleosomes ismodeled as chains of cylin-
drical segments with a diameter of 1.2 nm. Nucleosomes are represented by
cylinders with dimensions of 11 nm diameter and 5.5 nm height. Harmonic
potentials for stretching, bending, and torsion represent the elastic properties
of the linker DNA. In contrast to some of our previous work modeling
chromatin stretching, here unwrapping of DNA from the nucleosome core
was not included, because in the absence of external forces unwrapping is
typically limited to fluctuations of about a basepair around an average value.
This has only little effect on the relative orientations of two nucleosomes
with respect to each other for the equilibriumconformation (49–52). Electro-
static interactions between linker DNA segments are modeled by charged
spheres placed within the segments (see the Supporting Material, Materials
and Methods). Interactions between nucleosomes are described by a poten-
tial based on S-functions approximating oblate spherocylinders (46,53).
For more details see the Supporting Material, Materials and Methods. The
simulation parameters used in this work are listed in Table S3.
Modeling of nucleosome repositioning
We used three models of different chromatin systems in the simulations
(17). The first was a two-start cross-linker model (CL) with a nucleosome
repeat length (NRL) of 169 bp, derived from the tetranucleosome crystal
structure (9,48). The second was a crossed-linker model describing a
conformation found in chicken erythrocyte chromatin with a H5 linker his-
tone-dependent nucleosome stem structure of the linker DNA (CLS) and a
NRL of 212 bp (40,46). The third model was a fiber model with interdigi-
tated nucleosomes in the presence of linker histone H1 (ID), derived from
electron microscopy studies of reconstituted chromatin fibers (8,15,48).
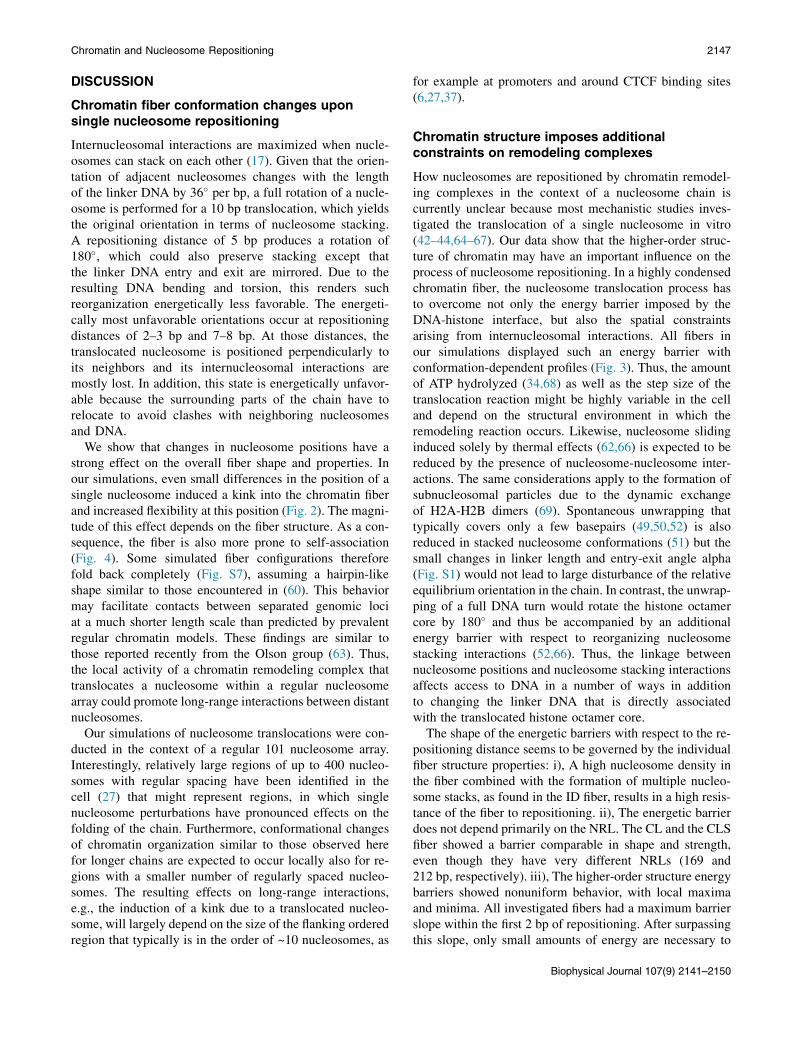
This model’s NRL was 197 bp. An overview of the model structures and
associated parameters is given in Fig. 1 and Table 1. To explore the effects
of repositioned nucleosomes in a well-defined reference system, we chose
strictly regular fiber conformations for our simulations in which only the
central nucleosome was repositioned. Each fiber conformation contained
101 nucleosomes with the structural parameters listed in Table S2.
Starting from these basic fiber conformations, we generated modified
conformations with one nucleosome repositioned in consecutive 1 bp steps
(see next paragraph). Following this process, for every fiber model we ob-
tained 11 conformations with successive nucleosome displacements, which
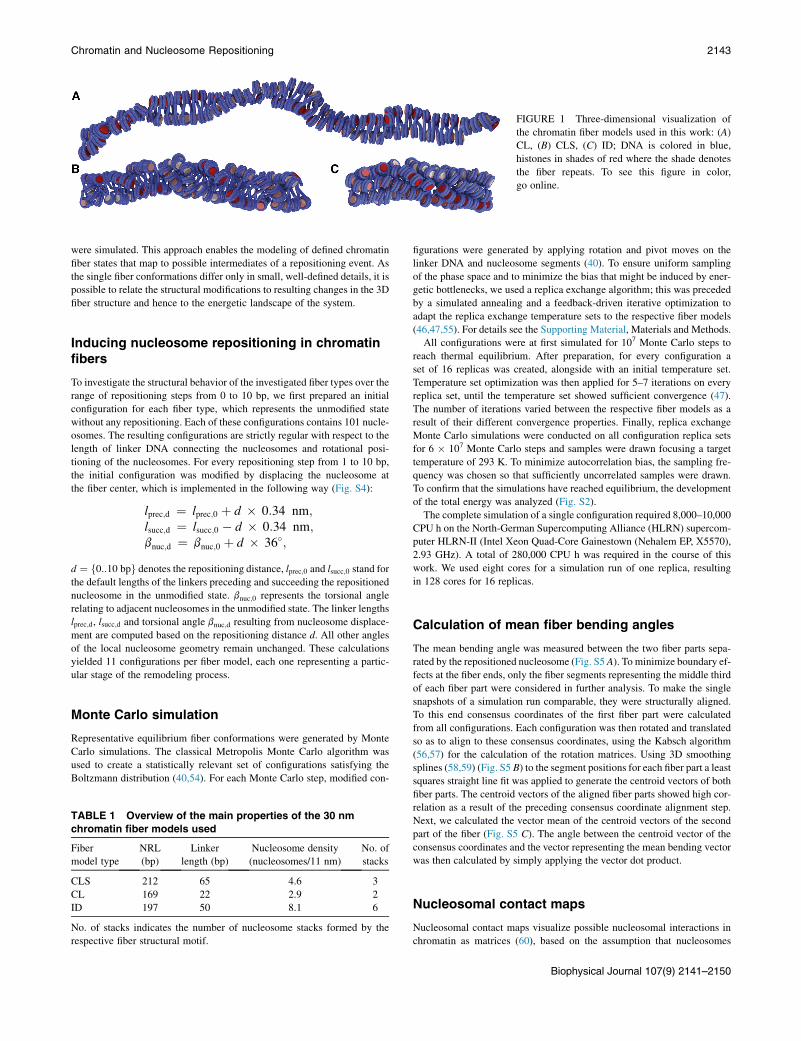
FIGURE 1 Three-dimensional visualization of
the chromatin fiber models used in this work: (A)
CL, (B) CLS, (C) ID; DNA is colored in blue,
histones in shades of red where the shade denotes
the fiber repeats. To see this figure in color,
go online.
Chromatin and Nucleosome Repositioning 2143
were simulated. This approach enables the modeling of defined chromatin
fiber states that map to possible intermediates of a repositioning event. As
the single fiber conformations differ only in small, well-defined details, it is
possible to relate the structural modifications to resulting changes in the 3D
fiber structure and hence to the energetic landscape of the system.
Inducing nucleosome repositioning in chromatinfibers
To investigate the structural behavior of the investigated fiber types over the
range of repositioning steps from 0 to 10 bp, we first prepared an initial
configuration for each fiber type, which represents the unmodified state
without any repositioning. Each of these configurations contains 101 nucle-
osomes. The resulting configurations are strictly regular with respect to the
length of linker DNA connecting the nucleosomes and rotational posi-
tioning of the nucleosomes. For every repositioning step from 1 to 10 bp,
the initial configuration was modified by displacing the nucleosome at
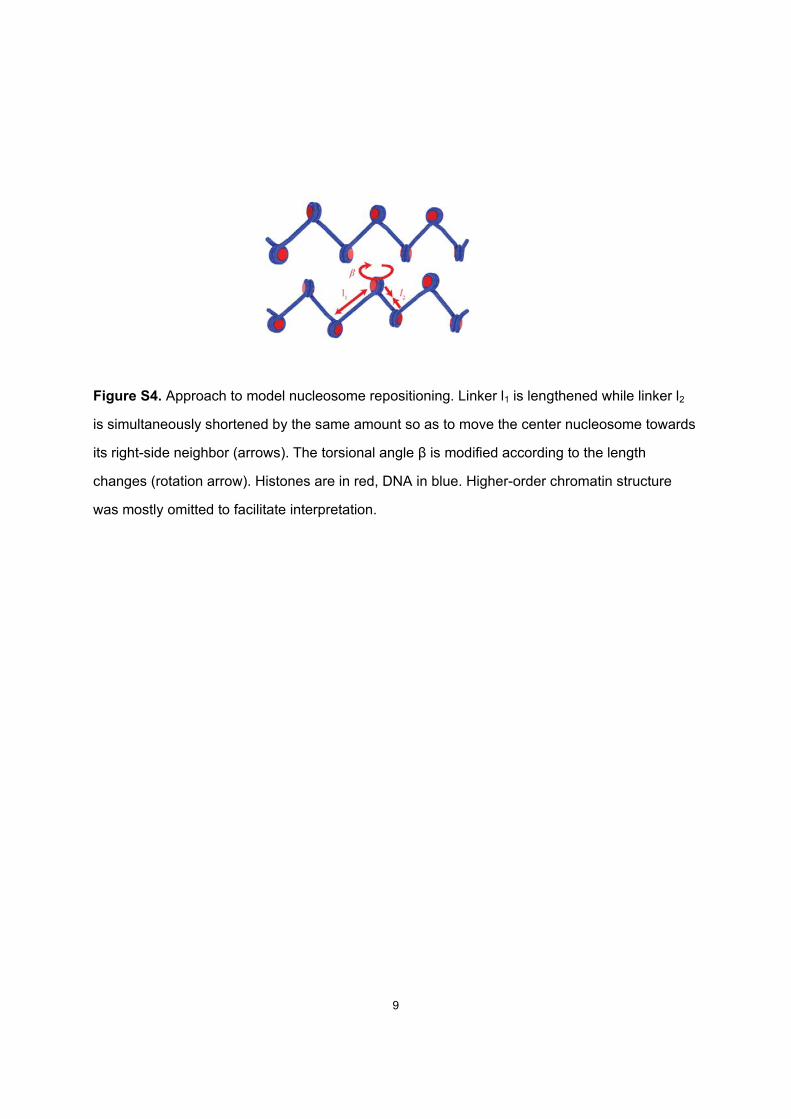
the fiber center, which is implemented in the following way (Fig. S4):
lprec;d ¼ lprec;0 þ d � 0:34 nm;lsucc;d ¼ lsucc;0 � d � 0:34 nm;bnuc;d ¼ bnuc;0 þ d � 36�;
d ¼ f0::10 bpg denotes the repositioning distance, lprec;0 and lsucc;0 stand forthe default lengths of the linkers preceding and succeeding the repositioned
nucleosome in the unmodified state. bnuc;0 represents the torsional angle
relating to adjacent nucleosomes in the unmodified state. The linker lengths
lprec;d, lsucc;d and torsional angle bnuc;d resulting from nucleosome displace-
ment are computed based on the repositioning distance d. All other angles
of the local nucleosome geometry remain unchanged. These calculations
yielded 11 configurations per fiber model, each one representing a partic-
ular stage of the remodeling process.
Monte Carlo simulation
Representative equilibrium fiber conformations were generated by Monte
Carlo simulations. The classical Metropolis Monte Carlo algorithm was
used to create a statistically relevant set of configurations satisfying the
Boltzmann distribution (40,54). For each Monte Carlo step, modified con-
TABLE 1 Overview of the main properties of the 30 nm
chromatin fiber models used
Fiber
model type
NRL
(bp)
Linker
length (bp)
Nucleosome density
(nucleosomes/11 nm)
No. of
stacks
CLS 212 65 4.6 3
CL 169 22 2.9 2
ID 197 50 8.1 6
No. of stacks indicates the number of nucleosome stacks formed by the
respective fiber structural motif.
figurations were generated by applying rotation and pivot moves on the
linker DNA and nucleosome segments (40). To ensure uniform sampling
of the phase space and to minimize the bias that might be induced by ener-
getic bottlenecks, we used a replica exchange algorithm; this was preceded
by a simulated annealing and a feedback-driven iterative optimization to
adapt the replica exchange temperature sets to the respective fiber models
(46,47,55). For details see the Supporting Material, Materials and Methods.
All configurations were at first simulated for 107 Monte Carlo steps to
reach thermal equilibrium. After preparation, for every configuration a
set of 16 replicas was created, alongside with an initial temperature set.
Temperature set optimization was then applied for 5–7 iterations on every
replica set, until the temperature set showed sufficient convergence (47).
The number of iterations varied between the respective fiber models as a
result of their different convergence properties. Finally, replica exchange
Monte Carlo simulations were conducted on all configuration replica sets
for 6 � 107 Monte Carlo steps and samples were drawn focusing a target
temperature of 293 K. To minimize autocorrelation bias, the sampling fre-
quency was chosen so that sufficiently uncorrelated samples were drawn.
To confirm that the simulations have reached equilibrium, the development
of the total energy was analyzed (Fig. S2).
The complete simulation of a single configuration required 8,000–10,000
CPU h on the North-German Supercomputing Alliance (HLRN) supercom-
puter HLRN-II (Intel Xeon Quad-Core Gainestown (Nehalem EP, X5570),
2.93 GHz). A total of 280,000 CPU h was required in the course of this
work. We used eight cores for a simulation run of one replica, resulting
in 128 cores for 16 replicas.
Calculation of mean fiber bending angles
The mean bending angle was measured between the two fiber parts sepa-
rated by the repositioned nucleosome (Fig. S5 A). To minimize boundary ef-
fects at the fiber ends, only the fiber segments representing the middle third
of each fiber part were considered in further analysis. To make the single
snapshots of a simulation run comparable, they were structurally aligned.
To this end consensus coordinates of the first fiber part were calculated
from all configurations. Each configuration was then rotated and translated
so as to align to these consensus coordinates, using the Kabsch algorithm
(56,57) for the calculation of the rotation matrices. Using 3D smoothing
splines (58,59) (Fig. S5 B) to the segment positions for each fiber part a least
squares straight line fit was applied to generate the centroid vectors of both
fiber parts. The centroid vectors of the aligned fiber parts showed high cor-
relation as a result of the preceding consensus coordinate alignment step.
Next, we calculated the vector mean of the centroid vectors of the second
part of the fiber (Fig. S5 C). The angle between the centroid vector of the
consensus coordinates and the vector representing the mean bending vector
was then calculated by simply applying the vector dot product.
Nucleosomal contact maps
Nucleosomal contact maps visualize possible nucleosomal interactions in
chromatin as matrices (60), based on the assumption that nucleosomes
Biophysical Journal 107(9) 2141–2150
A
B
2144 Muller et al.
which reside in close spatial proximity have a high probability of interact-
ing. Contact maps for simulated fiber models were created by tracing the
distances between all n2 possible pair combinations of the n nucleosomes
over the whole simulation run. Nucleosome pairs with distances smaller
than 1.5 times the nucleosome radius were regarded as being in contact.
Hence, the contact probability P of a particular nucleosome pair with index
i and j is given by Eq. 1:
Pij ¼Ncontact
ij
N;
with Ncontactij being the number of samples in which the nucleosome pair ij in
contact and N being the total number of simulation samples.
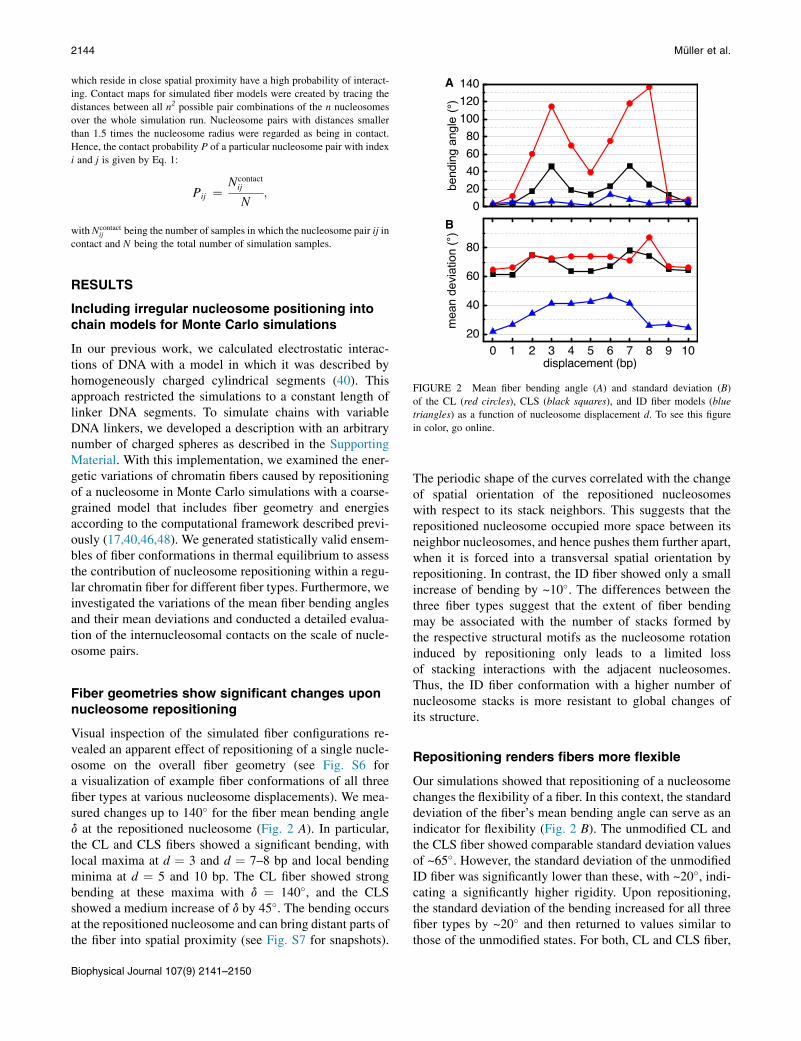
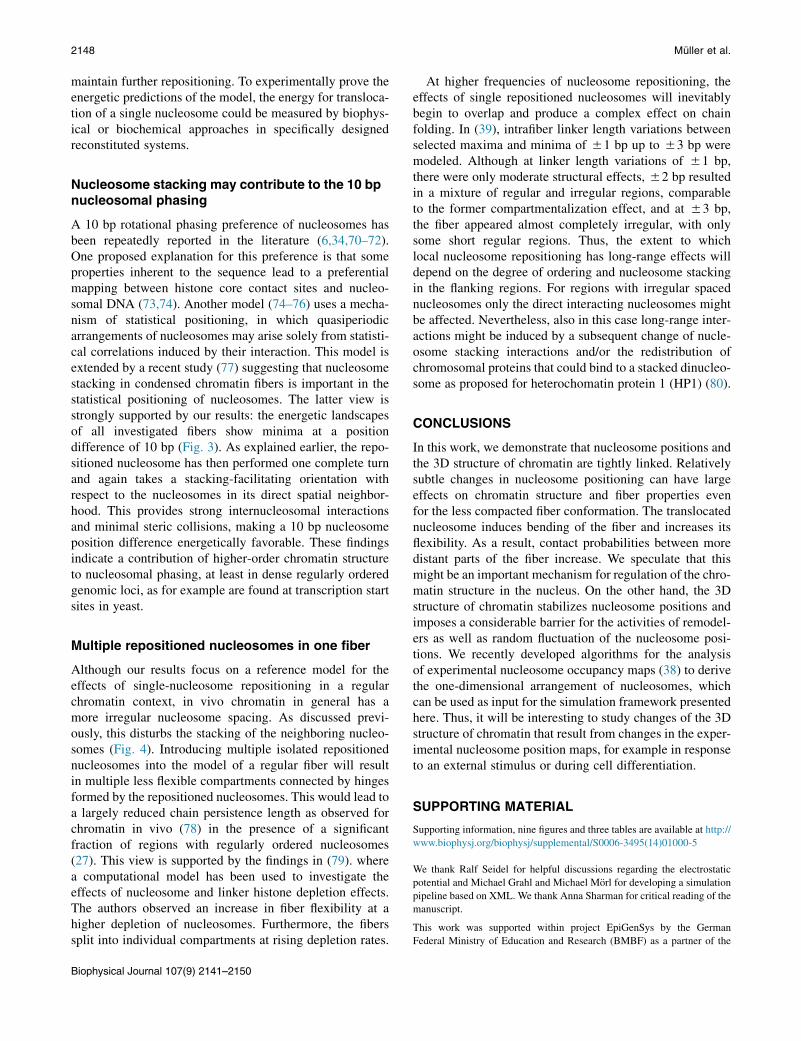
FIGURE 2 Mean fiber bending angle (A) and standard deviation (B)
of the CL (red circles), CLS (black squares), and ID fiber models (blue
triangles) as a function of nucleosome displacement d. To see this figure
in color, go online.
RESULTS
Including irregular nucleosome positioning intochain models for Monte Carlo simulations
In our previous work, we calculated electrostatic interac-tions of DNA with a model in which it was described byhomogeneously charged cylindrical segments (40). Thisapproach restricted the simulations to a constant length oflinker DNA segments. To simulate chains with variableDNA linkers, we developed a description with an arbitrarynumber of charged spheres as described in the SupportingMaterial. With this implementation, we examined the ener-getic variations of chromatin fibers caused by repositioningof a nucleosome in Monte Carlo simulations with a coarse-grained model that includes fiber geometry and energiesaccording to the computational framework described previ-ously (17,40,46,48). We generated statistically valid ensem-bles of fiber conformations in thermal equilibrium to assessthe contribution of nucleosome repositioning within a regu-lar chromatin fiber for different fiber types. Furthermore, weinvestigated the variations of the mean fiber bending anglesand their mean deviations and conducted a detailed evalua-tion of the internucleosomal contacts on the scale of nucle-osome pairs.
Fiber geometries show significant changes uponnucleosome repositioning
Visual inspection of the simulated fiber configurations re-vealed an apparent effect of repositioning of a single nucle-osome on the overall fiber geometry (see Fig. S6 fora visualization of example fiber conformations of all threefiber types at various nucleosome displacements). We mea-sured changes up to 140� for the fiber mean bending angled at the repositioned nucleosome (Fig. 2 A). In particular,the CL and CLS fibers showed a significant bending, withlocal maxima at d ¼ 3 and d ¼ 7–8 bp and local bendingminima at d ¼ 5 and 10 bp. The CL fiber showed strongbending at these maxima with d ¼ 140�, and the CLSshowed a medium increase of d by 45�. The bending occursat the repositioned nucleosome and can bring distant parts ofthe fiber into spatial proximity (see Fig. S7 for snapshots).
Biophysical Journal 107(9) 2141–2150
The periodic shape of the curves correlated with the changeof spatial orientation of the repositioned nucleosomeswith respect to its stack neighbors. This suggests that therepositioned nucleosome occupied more space between itsneighbor nucleosomes, and hence pushes them further apart,when it is forced into a transversal spatial orientation byrepositioning. In contrast, the ID fiber showed only a smallincrease of bending by ~10�. The differences between thethree fiber types suggest that the extent of fiber bendingmay be associated with the number of stacks formed bythe respective structural motifs as the nucleosome rotationinduced by repositioning only leads to a limited lossof stacking interactions with the adjacent nucleosomes.Thus, the ID fiber conformation with a higher number ofnucleosome stacks is more resistant to global changes ofits structure.
Repositioning renders fibers more flexible
Our simulations showed that repositioning of a nucleosomechanges the flexibility of a fiber. In this context, the standarddeviation of the fiber’s mean bending angle can serve as anindicator for flexibility (Fig. 2 B). The unmodified CL andthe CLS fiber showed comparable standard deviation valuesof ~65�. However, the standard deviation of the unmodifiedID fiber was significantly lower than these, with ~20�, indi-cating a significantly higher rigidity. Upon repositioning,the standard deviation of the bending increased for all threefiber types by ~20� and then returned to values similar tothose of the unmodified states. For both, CL and CLS fiber,
Chromatin and Nucleosome Repositioning 2145
the flexibility changed similarly upon repositioning. After amarginal increase of standard deviation at d ¼ 1 bp, bothfibers showed a rise at d ¼ 2 bp. The flexibility then stayednearly the same until d ¼ 8 bp for the CL fiber, whereas atransient decline of standard deviation was observed forthe CLS fiber around d ¼ 5 bp. Both fibers then showed amaximum around d ¼ 7–8 bp before dropping back to alevel similar to that of the unmodified state. In contrast,the ID fiber showed a very different variability behaviorupon repositioning. After a small increase at d ¼ 1 bp itsstandard deviation grew linearly until reaching a maximumaround d ¼ 3 bp. The standard deviation then remained atthat level until it decreased again to a value close to theinitial level at d ¼ 8 bp.
The 3D fiber conformation can impose an energybarrier toward repositioning of a nucleosome
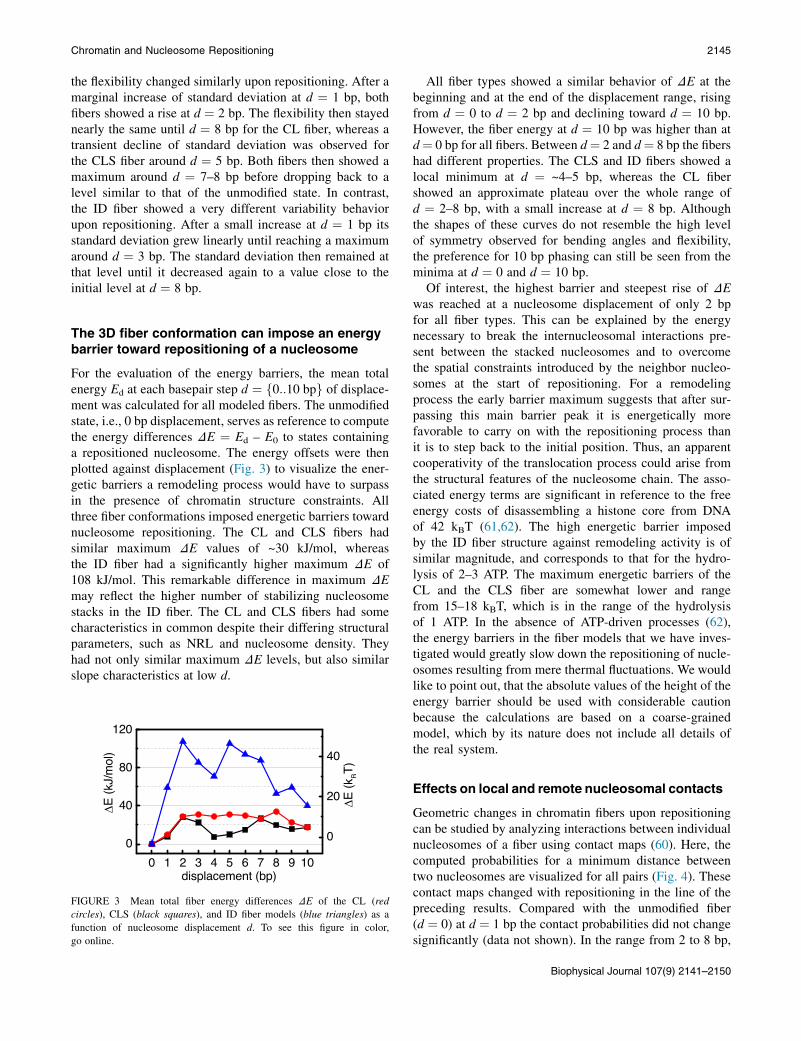
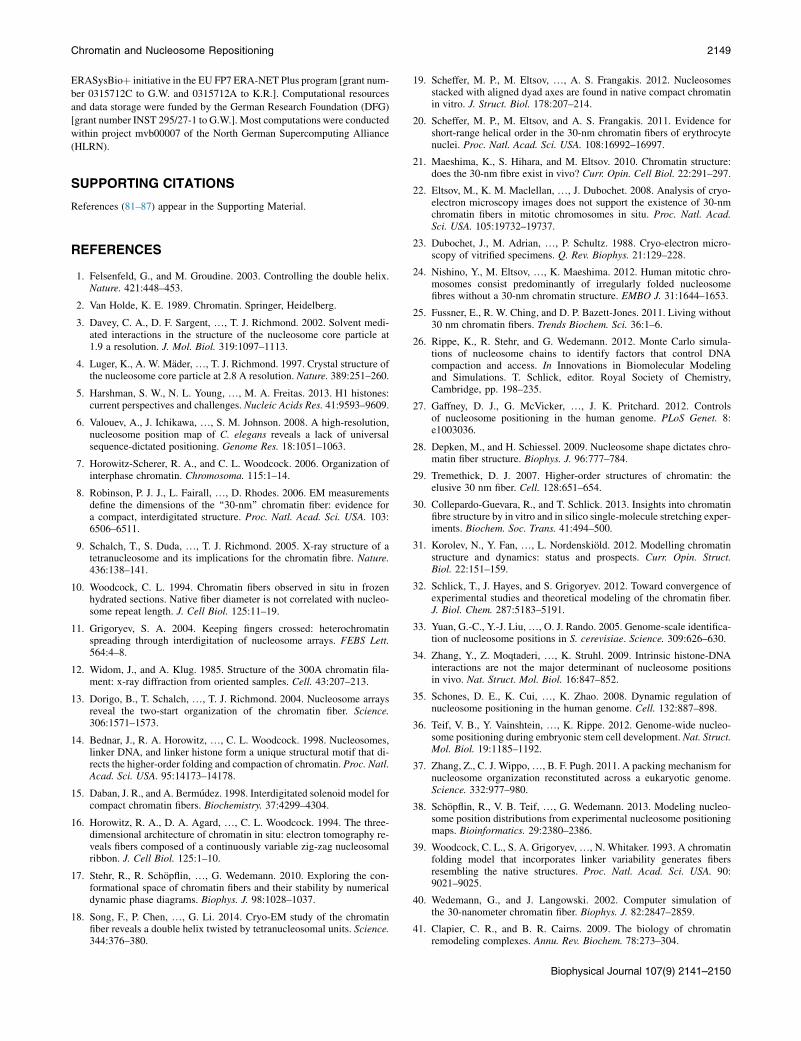
For the evaluation of the energy barriers, the mean totalenergy Ed at each basepair step d ¼ f0::10 bpg of displace-ment was calculated for all modeled fibers. The unmodifiedstate, i.e., 0 bp displacement, serves as reference to computethe energy differences DE ¼ Ed – E0 to states containinga repositioned nucleosome. The energy offsets were thenplotted against displacement (Fig. 3) to visualize the ener-getic barriers a remodeling process would have to surpassin the presence of chromatin structure constraints. Allthree fiber conformations imposed energetic barriers towardnucleosome repositioning. The CL and CLS fibers hadsimilar maximum DE values of ~30 kJ/mol, whereasthe ID fiber had a significantly higher maximum DE of108 kJ/mol. This remarkable difference in maximum DEmay reflect the higher number of stabilizing nucleosomestacks in the ID fiber. The CL and CLS fibers had somecharacteristics in common despite their differing structuralparameters, such as NRL and nucleosome density. Theyhad not only similar maximum DE levels, but also similarslope characteristics at low d.
FIGURE 3 Mean total fiber energy differences DE of the CL (red
circles), CLS (black squares), and ID fiber models (blue triangles) as a
function of nucleosome displacement d. To see this figure in color,
go online.
All fiber types showed a similar behavior of DE at thebeginning and at the end of the displacement range, risingfrom d ¼ 0 to d ¼ 2 bp and declining toward d ¼ 10 bp.However, the fiber energy at d ¼ 10 bp was higher than atd¼ 0 bp for all fibers. Between d¼ 2 and d¼ 8 bp the fibershad different properties. The CLS and ID fibers showed alocal minimum at d ¼ ~4–5 bp, whereas the CL fibershowed an approximate plateau over the whole range ofd ¼ 2–8 bp, with a small increase at d ¼ 8 bp. Althoughthe shapes of these curves do not resemble the high levelof symmetry observed for bending angles and flexibility,the preference for 10 bp phasing can still be seen from theminima at d ¼ 0 and d ¼ 10 bp.
Of interest, the highest barrier and steepest rise of DEwas reached at a nucleosome displacement of only 2 bpfor all fiber types. This can be explained by the energynecessary to break the internucleosomal interactions pre-sent between the stacked nucleosomes and to overcomethe spatial constraints introduced by the neighbor nucleo-somes at the start of repositioning. For a remodelingprocess the early barrier maximum suggests that after sur-passing this main barrier peak it is energetically morefavorable to carry on with the repositioning process thanit is to step back to the initial position. Thus, an apparentcooperativity of the translocation process could arise fromthe structural features of the nucleosome chain. The asso-ciated energy terms are significant in reference to the freeenergy costs of disassembling a histone core from DNAof 42 kBT (61,62). The high energetic barrier imposedby the ID fiber structure against remodeling activity is ofsimilar magnitude, and corresponds to that for the hydro-lysis of 2–3 ATP. The maximum energetic barriers of theCL and the CLS fiber are somewhat lower and rangefrom 15–18 kBT, which is in the range of the hydrolysisof 1 ATP. In the absence of ATP-driven processes (62),the energy barriers in the fiber models that we have inves-tigated would greatly slow down the repositioning of nucle-osomes resulting from mere thermal fluctuations. We wouldlike to point out, that the absolute values of the height of theenergy barrier should be used with considerable cautionbecause the calculations are based on a coarse-grainedmodel, which by its nature does not include all details ofthe real system.
Effects on local and remote nucleosomal contacts
Geometric changes in chromatin fibers upon repositioningcan be studied by analyzing interactions between individualnucleosomes of a fiber using contact maps (60). Here, thecomputed probabilities for a minimum distance betweentwo nucleosomes are visualized for all pairs (Fig. 4). Thesecontact maps changed with repositioning in the line of thepreceding results. Compared with the unmodified fiber(d ¼ 0) at d ¼ 1 bp the contact probabilities did not changesignificantly (data not shown). In the range from 2 to 8 bp,
Biophysical Journal 107(9) 2141–2150
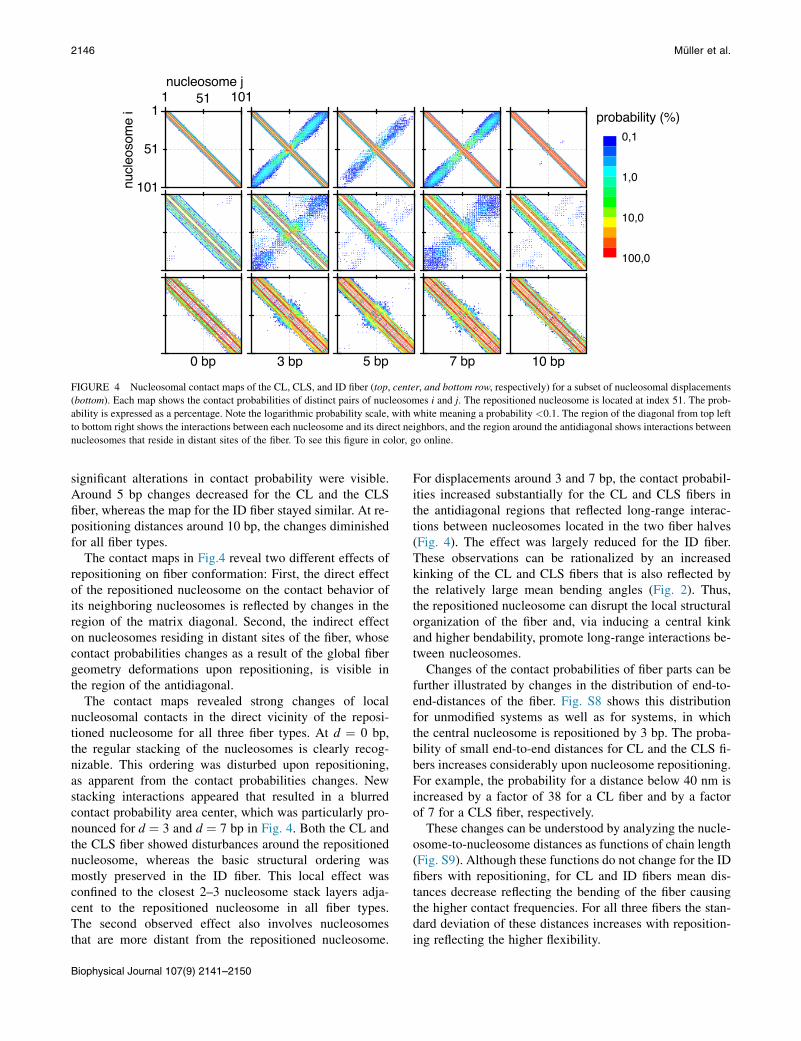
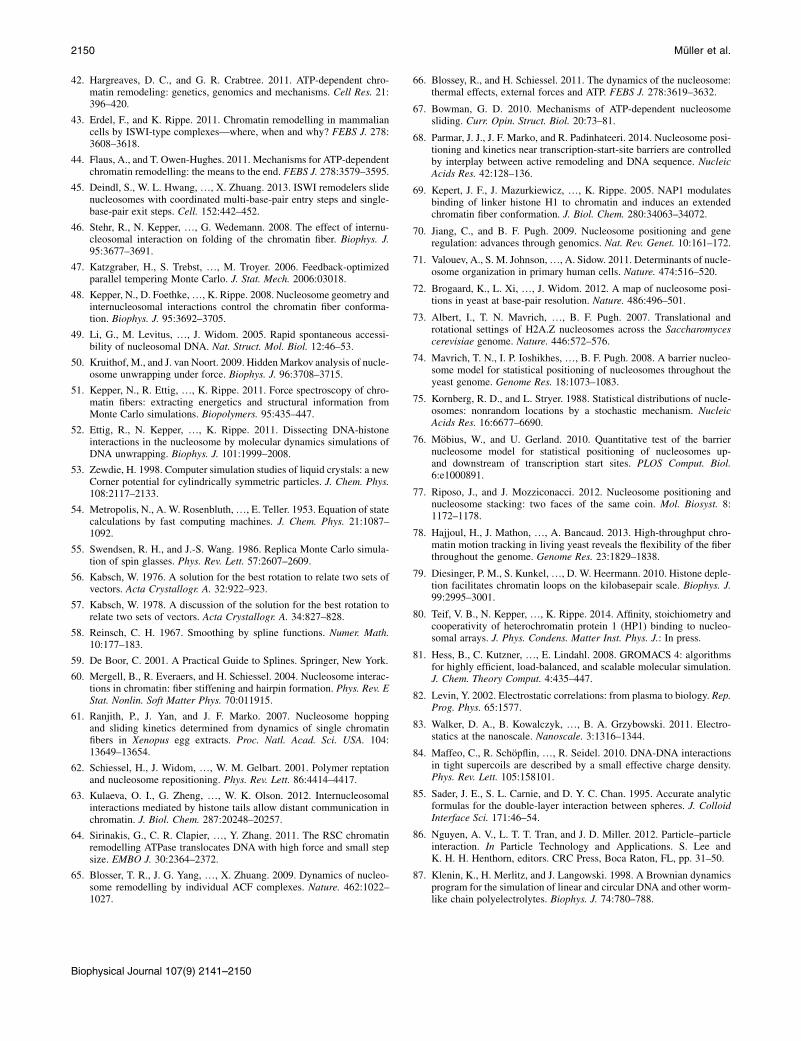
FIGURE 4 Nucleosomal contact maps of the CL, CLS, and ID fiber (top, center, and bottom row, respectively) for a subset of nucleosomal displacements
(bottom). Each map shows the contact probabilities of distinct pairs of nucleosomes i and j. The repositioned nucleosome is located at index 51. The prob-
ability is expressed as a percentage. Note the logarithmic probability scale, with white meaning a probability <0.1. The region of the diagonal from top left
to bottom right shows the interactions between each nucleosome and its direct neighbors, and the region around the antidiagonal shows interactions between
nucleosomes that reside in distant sites of the fiber. To see this figure in color, go online.
2146 Muller et al.
significant alterations in contact probability were visible.Around 5 bp changes decreased for the CL and the CLSfiber, whereas the map for the ID fiber stayed similar. At re-positioning distances around 10 bp, the changes diminishedfor all fiber types.
The contact maps in Fig.4 reveal two different effects ofrepositioning on fiber conformation: First, the direct effectof the repositioned nucleosome on the contact behavior ofits neighboring nucleosomes is reflected by changes in theregion of the matrix diagonal. Second, the indirect effecton nucleosomes residing in distant sites of the fiber, whosecontact probabilities changes as a result of the global fibergeometry deformations upon repositioning, is visible inthe region of the antidiagonal.
The contact maps revealed strong changes of localnucleosomal contacts in the direct vicinity of the reposi-tioned nucleosome for all three fiber types. At d ¼ 0 bp,the regular stacking of the nucleosomes is clearly recog-nizable. This ordering was disturbed upon repositioning,as apparent from the contact probabilities changes. Newstacking interactions appeared that resulted in a blurredcontact probability area center, which was particularly pro-nounced for d ¼ 3 and d ¼ 7 bp in Fig. 4. Both the CL andthe CLS fiber showed disturbances around the repositionednucleosome, whereas the basic structural ordering wasmostly preserved in the ID fiber. This local effect wasconfined to the closest 2–3 nucleosome stack layers adja-cent to the repositioned nucleosome in all fiber types.The second observed effect also involves nucleosomesthat are more distant from the repositioned nucleosome.
Biophysical Journal 107(9) 2141–2150
For displacements around 3 and 7 bp, the contact probabil-ities increased substantially for the CL and CLS fibers inthe antidiagonal regions that reflected long-range interac-tions between nucleosomes located in the two fiber halves(Fig. 4). The effect was largely reduced for the ID fiber.These observations can be rationalized by an increasedkinking of the CL and CLS fibers that is also reflected bythe relatively large mean bending angles (Fig. 2). Thus,the repositioned nucleosome can disrupt the local structuralorganization of the fiber and, via inducing a central kinkand higher bendability, promote long-range interactions be-tween nucleosomes.
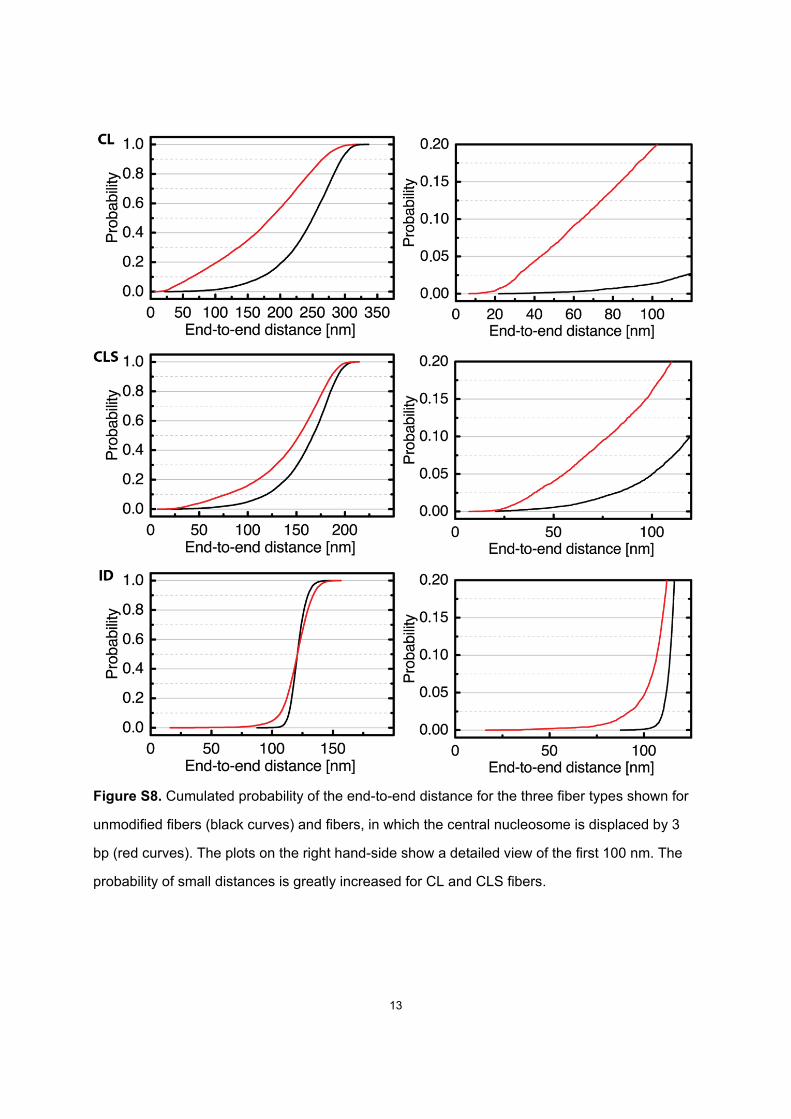
Changes of the contact probabilities of fiber parts can befurther illustrated by changes in the distribution of end-to-end-distances of the fiber. Fig. S8 shows this distributionfor unmodified systems as well as for systems, in whichthe central nucleosome is repositioned by 3 bp. The proba-bility of small end-to-end distances for CL and the CLS fi-bers increases considerably upon nucleosome repositioning.For example, the probability for a distance below 40 nm isincreased by a factor of 38 for a CL fiber and by a factorof 7 for a CLS fiber, respectively.
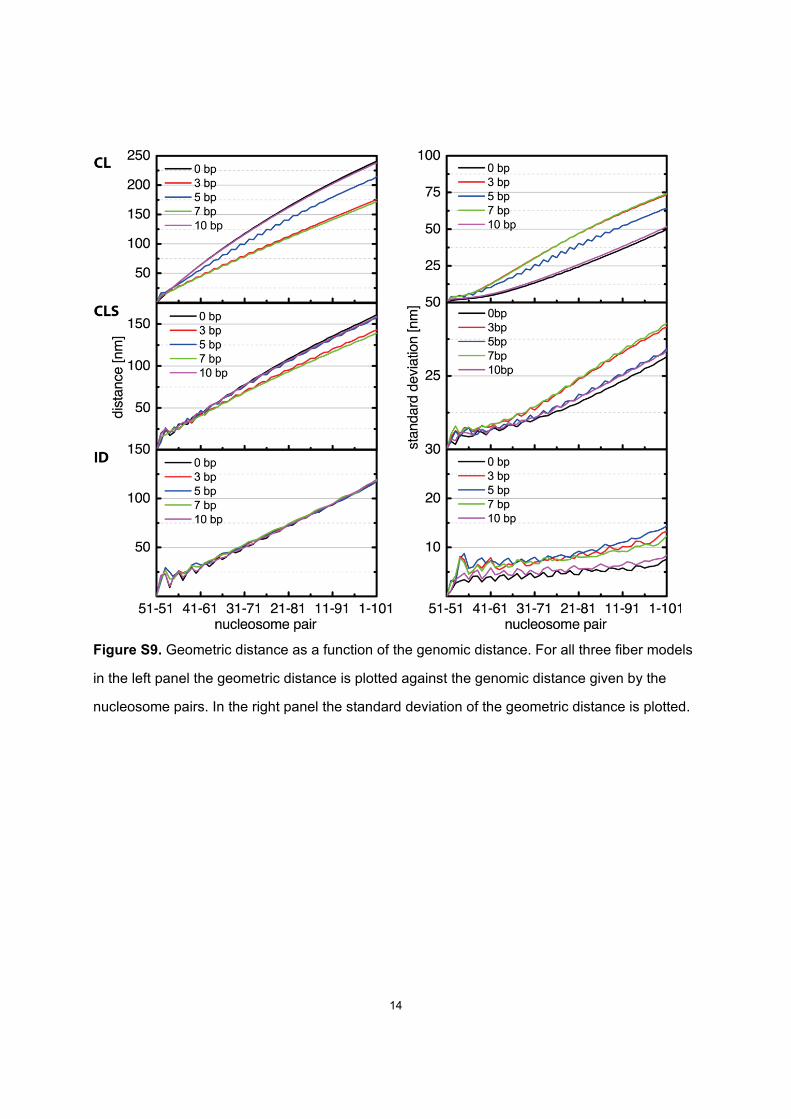
These changes can be understood by analyzing the nucle-osome-to-nucleosome distances as functions of chain length(Fig. S9). Although these functions do not change for the IDfibers with repositioning, for CL and ID fibers mean dis-tances decrease reflecting the bending of the fiber causingthe higher contact frequencies. For all three fibers the stan-dard deviation of these distances increases with reposition-ing reflecting the higher flexibility.
Chromatin and Nucleosome Repositioning 2147
DISCUSSION
Chromatin fiber conformation changes uponsingle nucleosome repositioning
Internucleosomal interactions are maximized when nucle-osomes can stack on each other (17). Given that the orien-tation of adjacent nucleosomes changes with the lengthof the linker DNA by 36� per bp, a full rotation of a nucle-osome is performed for a 10 bp translocation, which yieldsthe original orientation in terms of nucleosome stacking.A repositioning distance of 5 bp produces a rotation of180�, which could also preserve stacking except thatthe linker DNA entry and exit are mirrored. Due to theresulting DNA bending and torsion, this renders suchreorganization energetically less favorable. The energeti-cally most unfavorable orientations occur at repositioningdistances of 2–3 bp and 7–8 bp. At those distances, thetranslocated nucleosome is positioned perpendicularly toits neighbors and its internucleosomal interactions aremostly lost. In addition, this state is energetically unfavor-able because the surrounding parts of the chain have torelocate to avoid clashes with neighboring nucleosomesand DNA.
We show that changes in nucleosome positions have astrong effect on the overall fiber shape and properties. Inour simulations, even small differences in the position of asingle nucleosome induced a kink into the chromatin fiberand increased flexibility at this position (Fig. 2). The magni-tude of this effect depends on the fiber structure. As a con-sequence, the fiber is also more prone to self-association(Fig. 4). Some simulated fiber configurations thereforefold back completely (Fig. S7), assuming a hairpin-likeshape similar to those encountered in (60). This behaviormay facilitate contacts between separated genomic lociat a much shorter length scale than predicted by prevalentregular chromatin models. These findings are similar tothose reported recently from the Olson group (63). Thus,the local activity of a chromatin remodeling complex thattranslocates a nucleosome within a regular nucleosomearray could promote long-range interactions between distantnucleosomes.
Our simulations of nucleosome translocations were con-ducted in the context of a regular 101 nucleosome array.Interestingly, relatively large regions of up to 400 nucleo-somes with regular spacing have been identified in thecell (27) that might represent regions, in which singlenucleosome perturbations have pronounced effects on thefolding of the chain. Furthermore, conformational changesof chromatin organization similar to those observed herefor longer chains are expected to occur locally also for re-gions with a smaller number of regularly spaced nucleo-somes. The resulting effects on long-range interactions,e.g., the induction of a kink due to a translocated nucleo-some, will largely depend on the size of the flanking orderedregion that typically is in the order of ~10 nucleosomes, as
for example at promoters and around CTCF binding sites(6,27,37).
Chromatin structure imposes additionalconstraints on remodeling complexes
How nucleosomes are repositioned by chromatin remodel-ing complexes in the context of a nucleosome chain iscurrently unclear because most mechanistic studies inves-tigated the translocation of a single nucleosome in vitro(42–44,64–67). Our data show that the higher-order struc-ture of chromatin may have an important influence on theprocess of nucleosome repositioning. In a highly condensedchromatin fiber, the nucleosome translocation process hasto overcome not only the energy barrier imposed by theDNA-histone interface, but also the spatial constraintsarising from internucleosomal interactions. All fibers inour simulations displayed such an energy barrier withconformation-dependent profiles (Fig. 3). Thus, the amountof ATP hydrolyzed (34,68) as well as the step size of thetranslocation reaction might be highly variable in the celland depend on the structural environment in which theremodeling reaction occurs. Likewise, nucleosome slidinginduced solely by thermal effects (62,66) is expected to bereduced by the presence of nucleosome-nucleosome inter-actions. The same considerations apply to the formation ofsubnucleosomal particles due to the dynamic exchangeof H2A-H2B dimers (69). Spontaneous unwrapping thattypically covers only a few basepairs (49,50,52) is alsoreduced in stacked nucleosome conformations (51) but thesmall changes in linker length and entry-exit angle alpha(Fig. S1) would not lead to large disturbance of the relativeequilibrium orientation in the chain. In contrast, the unwrap-ping of a full DNA turn would rotate the histone octamercore by 180� and thus be accompanied by an additionalenergy barrier with respect to reorganizing nucleosomestacking interactions (52,66). Thus, the linkage betweennucleosome positions and nucleosome stacking interactionsaffects access to DNA in a number of ways in additionto changing the linker DNA that is directly associatedwith the translocated histone octamer core.
The shape of the energetic barriers with respect to the re-positioning distance seems to be governed by the individualfiber structure properties: i), A high nucleosome density inthe fiber combined with the formation of multiple nucleo-some stacks, as found in the ID fiber, results in a high resis-tance of the fiber to repositioning. ii), The energetic barrierdoes not depend primarily on the NRL. The CL and the CLSfiber showed a barrier comparable in shape and strength,even though they have very different NRLs (169 and212 bp, respectively). iii), The higher-order structure energybarriers showed nonuniform behavior, with local maximaand minima. All investigated fibers had a maximum barrierslope within the first 2 bp of repositioning. After surpassingthis slope, only small amounts of energy are necessary to
Biophysical Journal 107(9) 2141–2150
2148 Muller et al.
maintain further repositioning. To experimentally prove theenergetic predictions of the model, the energy for transloca-tion of a single nucleosome could be measured by biophys-ical or biochemical approaches in specifically designedreconstituted systems.
Nucleosome stacking may contribute to the 10 bpnucleosomal phasing
A 10 bp rotational phasing preference of nucleosomes hasbeen repeatedly reported in the literature (6,34,70–72).One proposed explanation for this preference is that someproperties inherent to the sequence lead to a preferentialmapping between histone core contact sites and nucleo-somal DNA (73,74). Another model (74–76) uses a mecha-nism of statistical positioning, in which quasiperiodicarrangements of nucleosomes may arise solely from statisti-cal correlations induced by their interaction. This model isextended by a recent study (77) suggesting that nucleosomestacking in condensed chromatin fibers is important in thestatistical positioning of nucleosomes. The latter view isstrongly supported by our results: the energetic landscapesof all investigated fibers show minima at a positiondifference of 10 bp (Fig. 3). As explained earlier, the repo-sitioned nucleosome has then performed one complete turnand again takes a stacking-facilitating orientation withrespect to the nucleosomes in its direct spatial neighbor-hood. This provides strong internucleosomal interactionsand minimal steric collisions, making a 10 bp nucleosomeposition difference energetically favorable. These findingsindicate a contribution of higher-order chromatin structureto nucleosomal phasing, at least in dense regularly orderedgenomic loci, as for example are found at transcription startsites in yeast.
Multiple repositioned nucleosomes in one fiber
Although our results focus on a reference model for theeffects of single-nucleosome repositioning in a regularchromatin context, in vivo chromatin in general has amore irregular nucleosome spacing. As discussed previ-ously, this disturbs the stacking of the neighboring nucleo-somes (Fig. 4). Introducing multiple isolated repositionednucleosomes into the model of a regular fiber will resultin multiple less flexible compartments connected by hingesformed by the repositioned nucleosomes. This would lead toa largely reduced chain persistence length as observed forchromatin in vivo (78) in the presence of a significantfraction of regions with regularly ordered nucleosomes(27). This view is supported by the findings in (79). wherea computational model has been used to investigate theeffects of nucleosome and linker histone depletion effects.The authors observed an increase in fiber flexibility at ahigher depletion of nucleosomes. Furthermore, the fiberssplit into individual compartments at rising depletion rates.
Biophysical Journal 107(9) 2141–2150
At higher frequencies of nucleosome repositioning, theeffects of single repositioned nucleosomes will inevitablybegin to overlap and produce a complex effect on chainfolding. In (39), intrafiber linker length variations betweenselected maxima and minima of 51 bp up to 53 bp weremodeled. Although at linker length variations of 51 bp,there were only moderate structural effects, 52 bp resultedin a mixture of regular and irregular regions, comparableto the former compartmentalization effect, and at 53 bp,the fiber appeared almost completely irregular, with onlysome short regular regions. Thus, the extent to whichlocal nucleosome repositioning has long-range effects willdepend on the degree of ordering and nucleosome stackingin the flanking regions. For regions with irregular spacednucleosomes only the direct interacting nucleosomes mightbe affected. Nevertheless, also in this case long-range inter-actions might be induced by a subsequent change of nucle-osome stacking interactions and/or the redistribution ofchromosomal proteins that could bind to a stacked dinucleo-some as proposed for heterochomatin protein 1 (HP1) (80).
CONCLUSIONS
In this work, we demonstrate that nucleosome positions andthe 3D structure of chromatin are tightly linked. Relativelysubtle changes in nucleosome positioning can have largeeffects on chromatin structure and fiber properties evenfor the less compacted fiber conformation. The translocatednucleosome induces bending of the fiber and increases itsflexibility. As a result, contact probabilities between moredistant parts of the fiber increase. We speculate that thismight be an important mechanism for regulation of the chro-matin structure in the nucleus. On the other hand, the 3Dstructure of chromatin stabilizes nucleosome positions andimposes a considerable barrier for the activities of remodel-ers as well as random fluctuation of the nucleosome posi-tions. We recently developed algorithms for the analysisof experimental nucleosome occupancy maps (38) to derivethe one-dimensional arrangement of nucleosomes, whichcan be used as input for the simulation framework presentedhere. Thus, it will be interesting to study changes of the 3Dstructure of chromatin that result from changes in the exper-imental nucleosome position maps, for example in responseto an external stimulus or during cell differentiation.
SUPPORTING MATERIAL
Supporting information, nine figures and three tables are available at http://
www.biophysj.org/biophysj/supplemental/S0006-3495(14)01000-5
We thank Ralf Seidel for helpful discussions regarding the electrostatic
potential and Michael Grahl and Michael Morl for developing a simulation
pipeline based on XML. We thank Anna Sharman for critical reading of the
manuscript.
This work was supported within project EpiGenSys by the German
Federal Ministry of Education and Research (BMBF) as a partner of the
Chromatin and Nucleosome Repositioning 2149
ERASysBioþ initiative in the EU FP7 ERA-NET Plus program [grant num-
ber 0315712C to G.W. and 0315712A to K.R.]. Computational resources
and data storage were funded by the German Research Foundation (DFG)
[grant number INST 295/27-1 to G.W.]. Most computations were conducted
within project mvb00007 of the North German Supercomputing Alliance
(HLRN).
SUPPORTING CITATIONS
References (81–87) appear in the Supporting Material.
REFERENCES
1. Felsenfeld, G., and M. Groudine. 2003. Controlling the double helix.Nature. 421:448–453.
2. Van Holde, K. E. 1989. Chromatin. Springer, Heidelberg.
3. Davey, C. A., D. F. Sargent, ., T. J. Richmond. 2002. Solvent medi-ated interactions in the structure of the nucleosome core particle at1.9 a resolution. J. Mol. Biol. 319:1097–1113.
4. Luger, K., A. W. Mader,., T. J. Richmond. 1997. Crystal structure ofthe nucleosome core particle at 2.8 A resolution. Nature. 389:251–260.
5. Harshman, S. W., N. L. Young, ., M. A. Freitas. 2013. H1 histones:current perspectives and challenges. Nucleic Acids Res. 41:9593–9609.
6. Valouev, A., J. Ichikawa, ., S. M. Johnson. 2008. A high-resolution,nucleosome position map of C. elegans reveals a lack of universalsequence-dictated positioning. Genome Res. 18:1051–1063.
7. Horowitz-Scherer, R. A., and C. L. Woodcock. 2006. Organization ofinterphase chromatin. Chromosoma. 115:1–14.
8. Robinson, P. J. J., L. Fairall, ., D. Rhodes. 2006. EM measurementsdefine the dimensions of the ‘‘30-nm’’ chromatin fiber: evidence fora compact, interdigitated structure. Proc. Natl. Acad. Sci. USA. 103:6506–6511.
9. Schalch, T., S. Duda, ., T. J. Richmond. 2005. X-ray structure of atetranucleosome and its implications for the chromatin fibre. Nature.436:138–141.
10. Woodcock, C. L. 1994. Chromatin fibers observed in situ in frozenhydrated sections. Native fiber diameter is not correlated with nucleo-some repeat length. J. Cell Biol. 125:11–19.
11. Grigoryev, S. A. 2004. Keeping fingers crossed: heterochromatinspreading through interdigitation of nucleosome arrays. FEBS Lett.564:4–8.
12. Widom, J., and A. Klug. 1985. Structure of the 300A chromatin fila-ment: x-ray diffraction from oriented samples. Cell. 43:207–213.
13. Dorigo, B., T. Schalch, ., T. J. Richmond. 2004. Nucleosome arraysreveal the two-start organization of the chromatin fiber. Science.306:1571–1573.
14. Bednar, J., R. A. Horowitz, ., C. L. Woodcock. 1998. Nucleosomes,linker DNA, and linker histone form a unique structural motif that di-rects the higher-order folding and compaction of chromatin. Proc. Natl.Acad. Sci. USA. 95:14173–14178.
15. Daban, J. R., and A. Bermudez. 1998. Interdigitated solenoid model forcompact chromatin fibers. Biochemistry. 37:4299–4304.
16. Horowitz, R. A., D. A. Agard, ., C. L. Woodcock. 1994. The three-dimensional architecture of chromatin in situ: electron tomography re-veals fibers composed of a continuously variable zig-zag nucleosomalribbon. J. Cell Biol. 125:1–10.
17. Stehr, R., R. Schopflin, ., G. Wedemann. 2010. Exploring the con-formational space of chromatin fibers and their stability by numericaldynamic phase diagrams. Biophys. J. 98:1028–1037.
18. Song, F., P. Chen, ., G. Li. 2014. Cryo-EM study of the chromatinfiber reveals a double helix twisted by tetranucleosomal units. Science.344:376–380.
19. Scheffer, M. P., M. Eltsov, ., A. S. Frangakis. 2012. Nucleosomesstacked with aligned dyad axes are found in native compact chromatinin vitro. J. Struct. Biol. 178:207–214.
20. Scheffer, M. P., M. Eltsov, and A. S. Frangakis. 2011. Evidence forshort-range helical order in the 30-nm chromatin fibers of erythrocytenuclei. Proc. Natl. Acad. Sci. USA. 108:16992–16997.
21. Maeshima, K., S. Hihara, and M. Eltsov. 2010. Chromatin structure:does the 30-nm fibre exist in vivo? Curr. Opin. Cell Biol. 22:291–297.
22. Eltsov, M., K. M. Maclellan, ., J. Dubochet. 2008. Analysis of cryo-electron microscopy images does not support the existence of 30-nmchromatin fibers in mitotic chromosomes in situ. Proc. Natl. Acad.Sci. USA. 105:19732–19737.
23. Dubochet, J., M. Adrian, ., P. Schultz. 1988. Cryo-electron micro-scopy of vitrified specimens. Q. Rev. Biophys. 21:129–228.
24. Nishino, Y., M. Eltsov, ., K. Maeshima. 2012. Human mitotic chro-mosomes consist predominantly of irregularly folded nucleosomefibres without a 30-nm chromatin structure. EMBO J. 31:1644–1653.
25. Fussner, E., R. W. Ching, and D. P. Bazett-Jones. 2011. Living without30 nm chromatin fibers. Trends Biochem. Sci. 36:1–6.
26. Rippe, K., R. Stehr, and G. Wedemann. 2012. Monte Carlo simula-tions of nucleosome chains to identify factors that control DNAcompaction and access. In Innovations in Biomolecular Modelingand Simulations. T. Schlick, editor. Royal Society of Chemistry,Cambridge, pp. 198–235.
27. Gaffney, D. J., G. McVicker, ., J. K. Pritchard. 2012. Controlsof nucleosome positioning in the human genome. PLoS Genet. 8:e1003036.
28. Depken, M., and H. Schiessel. 2009. Nucleosome shape dictates chro-matin fiber structure. Biophys. J. 96:777–784.
29. Tremethick, D. J. 2007. Higher-order structures of chromatin: theelusive 30 nm fiber. Cell. 128:651–654.
30. Collepardo-Guevara, R., and T. Schlick. 2013. Insights into chromatinfibre structure by in vitro and in silico single-molecule stretching exper-iments. Biochem. Soc. Trans. 41:494–500.
31. Korolev, N., Y. Fan, ., L. Nordenskiold. 2012. Modelling chromatinstructure and dynamics: status and prospects. Curr. Opin. Struct.Biol. 22:151–159.
32. Schlick, T., J. Hayes, and S. Grigoryev. 2012. Toward convergence ofexperimental studies and theoretical modeling of the chromatin fiber.J. Biol. Chem. 287:5183–5191.
33. Yuan, G.-C., Y.-J. Liu,., O. J. Rando. 2005. Genome-scale identifica-tion of nucleosome positions in S. cerevisiae. Science. 309:626–630.
34. Zhang, Y., Z. Moqtaderi, ., K. Struhl. 2009. Intrinsic histone-DNAinteractions are not the major determinant of nucleosome positionsin vivo. Nat. Struct. Mol. Biol. 16:847–852.
35. Schones, D. E., K. Cui, ., K. Zhao. 2008. Dynamic regulation ofnucleosome positioning in the human genome. Cell. 132:887–898.
36. Teif, V. B., Y. Vainshtein, ., K. Rippe. 2012. Genome-wide nucleo-some positioning during embryonic stem cell development. Nat. Struct.Mol. Biol. 19:1185–1192.
37. Zhang, Z., C. J. Wippo,., B. F. Pugh. 2011. A packing mechanism fornucleosome organization reconstituted across a eukaryotic genome.Science. 332:977–980.
38. Schopflin, R., V. B. Teif, ., G. Wedemann. 2013. Modeling nucleo-some position distributions from experimental nucleosome positioningmaps. Bioinformatics. 29:2380–2386.
39. Woodcock, C. L., S. A. Grigoryev,., N. Whitaker. 1993. A chromatinfolding model that incorporates linker variability generates fibersresembling the native structures. Proc. Natl. Acad. Sci. USA. 90:9021–9025.
40. Wedemann, G., and J. Langowski. 2002. Computer simulation ofthe 30-nanometer chromatin fiber. Biophys. J. 82:2847–2859.
41. Clapier, C. R., and B. R. Cairns. 2009. The biology of chromatinremodeling complexes. Annu. Rev. Biochem. 78:273–304.
Biophysical Journal 107(9) 2141–2150
2150 Muller et al.
42. Hargreaves, D. C., and G. R. Crabtree. 2011. ATP-dependent chro-matin remodeling: genetics, genomics and mechanisms. Cell Res. 21:396–420.
43. Erdel, F., and K. Rippe. 2011. Chromatin remodelling in mammaliancells by ISWI-type complexes—where, when and why? FEBS J. 278:3608–3618.
44. Flaus, A., and T. Owen-Hughes. 2011. Mechanisms for ATP-dependentchromatin remodelling: the means to the end. FEBS J. 278:3579–3595.
45. Deindl, S., W. L. Hwang, ., X. Zhuang. 2013. ISWI remodelers slidenucleosomes with coordinated multi-base-pair entry steps and single-base-pair exit steps. Cell. 152:442–452.
46. Stehr, R., N. Kepper, ., G. Wedemann. 2008. The effect of internu-cleosomal interaction on folding of the chromatin fiber. Biophys. J.95:3677–3691.
47. Katzgraber, H., S. Trebst, ., M. Troyer. 2006. Feedback-optimizedparallel tempering Monte Carlo. J. Stat. Mech. 2006:03018.
48. Kepper, N., D. Foethke,., K. Rippe. 2008. Nucleosome geometry andinternucleosomal interactions control the chromatin fiber conforma-tion. Biophys. J. 95:3692–3705.
49. Li, G., M. Levitus, ., J. Widom. 2005. Rapid spontaneous accessi-bility of nucleosomal DNA. Nat. Struct. Mol. Biol. 12:46–53.
50. Kruithof, M., and J. van Noort. 2009. HiddenMarkov analysis of nucle-osome unwrapping under force. Biophys. J. 96:3708–3715.
51. Kepper, N., R. Ettig, ., K. Rippe. 2011. Force spectroscopy of chro-matin fibers: extracting energetics and structural information fromMonte Carlo simulations. Biopolymers. 95:435–447.
52. Ettig, R., N. Kepper, ., K. Rippe. 2011. Dissecting DNA-histoneinteractions in the nucleosome by molecular dynamics simulations ofDNA unwrapping. Biophys. J. 101:1999–2008.
53. Zewdie, H. 1998. Computer simulation studies of liquid crystals: a newCorner potential for cylindrically symmetric particles. J. Chem. Phys.108:2117–2133.
54. Metropolis, N., A. W. Rosenbluth,., E. Teller. 1953. Equation of statecalculations by fast computing machines. J. Chem. Phys. 21:1087–1092.
55. Swendsen, R. H., and J.-S. Wang. 1986. Replica Monte Carlo simula-tion of spin glasses. Phys. Rev. Lett. 57:2607–2609.
56. Kabsch, W. 1976. A solution for the best rotation to relate two sets ofvectors. Acta Crystallogr. A. 32:922–923.
57. Kabsch, W. 1978. A discussion of the solution for the best rotation torelate two sets of vectors. Acta Crystallogr. A. 34:827–828.
58. Reinsch, C. H. 1967. Smoothing by spline functions. Numer. Math.10:177–183.
59. De Boor, C. 2001. A Practical Guide to Splines. Springer, New York.
60. Mergell, B., R. Everaers, and H. Schiessel. 2004. Nucleosome interac-tions in chromatin: fiber stiffening and hairpin formation. Phys. Rev. EStat. Nonlin. Soft Matter Phys. 70:011915.
61. Ranjith, P., J. Yan, and J. F. Marko. 2007. Nucleosome hoppingand sliding kinetics determined from dynamics of single chromatinfibers in Xenopus egg extracts. Proc. Natl. Acad. Sci. USA. 104:13649–13654.
62. Schiessel, H., J. Widom, ., W. M. Gelbart. 2001. Polymer reptationand nucleosome repositioning. Phys. Rev. Lett. 86:4414–4417.
63. Kulaeva, O. I., G. Zheng, ., W. K. Olson. 2012. Internucleosomalinteractions mediated by histone tails allow distant communication inchromatin. J. Biol. Chem. 287:20248–20257.
64. Sirinakis, G., C. R. Clapier, ., Y. Zhang. 2011. The RSC chromatinremodelling ATPase translocates DNA with high force and small stepsize. EMBO J. 30:2364–2372.
65. Blosser, T. R., J. G. Yang, ., X. Zhuang. 2009. Dynamics of nucleo-some remodelling by individual ACF complexes. Nature. 462:1022–1027.
Biophysical Journal 107(9) 2141–2150
66. Blossey, R., and H. Schiessel. 2011. The dynamics of the nucleosome:thermal effects, external forces and ATP. FEBS J. 278:3619–3632.
67. Bowman, G. D. 2010. Mechanisms of ATP-dependent nucleosomesliding. Curr. Opin. Struct. Biol. 20:73–81.
68. Parmar, J. J., J. F. Marko, and R. Padinhateeri. 2014. Nucleosome posi-tioning and kinetics near transcription-start-site barriers are controlledby interplay between active remodeling and DNA sequence. NucleicAcids Res. 42:128–136.
69. Kepert, J. F., J. Mazurkiewicz, ., K. Rippe. 2005. NAP1 modulatesbinding of linker histone H1 to chromatin and induces an extendedchromatin fiber conformation. J. Biol. Chem. 280:34063–34072.
70. Jiang, C., and B. F. Pugh. 2009. Nucleosome positioning and generegulation: advances through genomics. Nat. Rev. Genet. 10:161–172.
71. Valouev, A., S. M. Johnson,., A. Sidow. 2011. Determinants of nucle-osome organization in primary human cells. Nature. 474:516–520.
72. Brogaard, K., L. Xi, ., J. Widom. 2012. A map of nucleosome posi-tions in yeast at base-pair resolution. Nature. 486:496–501.
73. Albert, I., T. N. Mavrich, ., B. F. Pugh. 2007. Translational androtational settings of H2A.Z nucleosomes across the Saccharomycescerevisiae genome. Nature. 446:572–576.
74. Mavrich, T. N., I. P. Ioshikhes, ., B. F. Pugh. 2008. A barrier nucleo-some model for statistical positioning of nucleosomes throughout theyeast genome. Genome Res. 18:1073–1083.
75. Kornberg, R. D., and L. Stryer. 1988. Statistical distributions of nucle-osomes: nonrandom locations by a stochastic mechanism. NucleicAcids Res. 16:6677–6690.
76. Mobius, W., and U. Gerland. 2010. Quantitative test of the barriernucleosome model for statistical positioning of nucleosomes up-and downstream of transcription start sites. PLOS Comput. Biol.6:e1000891.
77. Riposo, J., and J. Mozziconacci. 2012. Nucleosome positioning andnucleosome stacking: two faces of the same coin. Mol. Biosyst. 8:1172–1178.
78. Hajjoul, H., J. Mathon, ., A. Bancaud. 2013. High-throughput chro-matin motion tracking in living yeast reveals the flexibility of the fiberthroughout the genome. Genome Res. 23:1829–1838.
79. Diesinger, P. M., S. Kunkel,., D. W. Heermann. 2010. Histone deple-tion facilitates chromatin loops on the kilobasepair scale. Biophys. J.99:2995–3001.
80. Teif, V. B., N. Kepper, ., K. Rippe. 2014. Affinity, stoichiometry andcooperativity of heterochromatin protein 1 (HP1) binding to nucleo-somal arrays. J. Phys. Condens. Matter Inst. Phys. J.: In press.
81. Hess, B., C. Kutzner, ., E. Lindahl. 2008. GROMACS 4: algorithmsfor highly efficient, load-balanced, and scalable molecular simulation.J. Chem. Theory Comput. 4:435–447.
82. Levin, Y. 2002. Electrostatic correlations: from plasma to biology. Rep.Prog. Phys. 65:1577.
83. Walker, D. A., B. Kowalczyk, ., B. A. Grzybowski. 2011. Electro-statics at the nanoscale. Nanoscale. 3:1316–1344.
84. Maffeo, C., R. Schopflin, ., R. Seidel. 2010. DNA-DNA interactionsin tight supercoils are described by a small effective charge density.Phys. Rev. Lett. 105:158101.
85. Sader, J. E., S. L. Carnie, and D. Y. C. Chan. 1995. Accurate analyticformulas for the double-layer interaction between spheres. J. ColloidInterface Sci. 171:46–54.
86. Nguyen, A. V., L. T. T. Tran, and J. D. Miller. 2012. Particle–particleinteraction. In Particle Technology and Applications. S. Lee andK. H. H. Henthorn, editors. CRC Press, Boca Raton, FL, pp. 31–50.
87. Klenin, K., H. Merlitz, and J. Langowski. 1998. A Brownian dynamicsprogram for the simulation of linear and circular DNA and other worm-like chain polyelectrolytes. Biophys. J. 74:780–788.
1
Changing chromatin fiber conformation
by nucleosome repositioning
Oliver Müller1, Nick Kepper2, Robert Schöpflin1, Ramona Ettig2, Karsten Rippe2 and Gero
Wedemann1*
1 CC Bioinformatics, University of Applied Sciences Stralsund, Zur Schwedenschanze 15, 18435
Stralsund, Germany
2 Deutsches Krebsforschungszentrum & BioQuant, 69120, Heidelberg, Germany
*Corresponding author
Supporting Material
Supporting Materials and Methods
For a full description of the model and the simulation procedure please see Supplementary
Material of ref. (17) and ref. (46), respectively. The description given here follows the
presentations in the mentioned work. Generally, chromatin is modeled as a chain of segments,
in which nucleosome segments are connected by DNA segments. Each segment has a position
and a local coordinate system consisting of three perpendicular unit vectors , , that
describe the orientation of the ith segment. Vector indicates thereby the direction of the
segment.
Elastic energies
Elastic interactions are modeled by harmonic potentials. The strength constants of the
interactions are named where X denotes the type of interaction (s=stretching, b=bending,
2
t=torsion) and Y the interaction partners (DNA or nucleosome). The energy for stretching is
calculated by
, (S1)
where bi is the current length and is the equilibrium length of the segment. The bending
energy is given by
, (S2)
where i is calculated from with being the equilibrium direction of the next
segment and its actual direction. The torsional energy is computed as
, (S3)
where angles αi,and γi are from the Euler-transformation of to with the angles (αi, βi, γi).
The angle αi describes the rotation around and i is the intrinsic twist (87).
Electrostatic energy of linker DNA
Our previous approach for calculating electrostatic interactions of DNA approximated DNA as
composed of homogeneously charged cylindrical segments and was restricted to a constant
length of linker DNA segments (40). To allow DNA linkers of variable lengths within a simulated
chromatin fiber we modeled the DNA linker here by a chain comprised of an arbitrary number of
charged spheres as described in the following. The GROMACS unit system was used according
to Supplementary Table S1, which is based on nm, ps, K, electron charge (e) and atomic mass
unit (u) (81).
The electrostatic energy of two spheres with charge q1 and q2 and radius a separated by a
center-to-center-distance r can be approximated by the electrostatic part of the Derjaguin-
Landau-Verwey-Overbeek, DLVO, theory (82, 83) as
3
, (S4)
with κ being the inverse Debye length calculated by:
. (S5)
For the values listed in Table S1 yields 1.0387 which corresponds to a Debye
length of 0.96 .
The charge of a DNA segment is given by , with being the nominal line charge density
(−2/0.34 ec nm−1) and d the length of the DNA represented by the sphere. The line charge
density of the DNA must be adapted to the effective charge density *
∗ , (S6)
where CR is the charge adaptation factor and PBS accounts for the geometry of subsequent
overlapping beads and for deviations due to using an approximation instead of the exact
Poisson-Boltzmann (PB) equation (84). Here, we use for CR a value of 0.42 as proposed in
(84). The adaptation factor PBS was determined by relating the new potential to the previous
description as cylindrical segments, which was tested in great detail using measurements from
single DNA molecule experiments as a benchmark (84). The electrostatic energies computed
with equation (S4) for a chain of 100 DNA segments that interact with a single DNA segment
were fitted to the values obtained from the PB corrected Debye-Hückel (DH) equation for
charged cylinders using finite elements method (84) (data provided by Ralf Seidel). The
electrostatic energies as function of distance are plotted for different salt concentrations in Fig.
S3. The approximation reproduces the energy curves of the numerical solution very well for the
given adaptation factors.
4
We are aware that our approach using the DLVO-equation for the electrostatic repulsion
between two charged spheres could be enhanced by applying the improved Derjaguin
approximation (85) as reviewed recently (86). However, this approximation is computationally
more demanding. Since the new approximation used here reproduces the previous
approximation well, which was tested in great detail (84), it is sufficiently accurate for the
numerical simulations of nucleosome chain folding conducted here .
Internucleosomal interaction
The model of the internucleosomal interaction is based on a shifted 12-6 Lennard -Jones
potential
4 ô , ô ,
| | ô ,ô , | | ô ,ô , , (S7)
where ô1 and ô2 denote the orientation of the nucleosomes and the distance between the
centers of the nucleosomes. The dependency of and from ô1, ô2 and reflects the shape of
the nucleosome and is modeled by a series expansion in S-functions (53):
ô , ô , , (S8)
and ô , ô , (S9)
The expansion coefficients were chosen in order to fit the dimensions of a nucleosome and to
achieve a ratio of interaction energies of 1/12 between side-by-side and top-on-top oriented
nucleosomes. Further details on the energy terms are given in ref. (46) and in the supplemental
material of ref. (17). The influence of the nucleosome tails is included in the choice of the
strength of (46). In principle more details could be added by modifications of the expansion
coefficients xxx. We refrained from doing so since details of the internucleosomsal interaction
are still subject of research and unambiguous experimental evidence for a detailed theoretical
model is lacking.
5
DNA-Nucleosome excluded volume
The volume of DNA segments is approximated by spheres. The minimal distance d between the
center of a DNA sphere and a spherocylinder describing the nucleosome is computed. The
excluded volume EDNA-Nuc is described as the sum of the individual excluded volume energies
E’DNA-Nuc computed for a DNA sphere and the volume of the nucleosome
0 (S10)
with rn=(5.5/2) nm and rd = 1.2 nm.
Simulation protocol
We used a Monte Carlo (MC) algorithm to create a statistical relevant set of configurations
satisfying the Boltzmann distribution (54). In order to avoid trapping in local energy minima
observed in this kind of systems (46) we applied a replica exchange procedure introduced by
Swendsen and Wang (55). Here, M replicas of the system were simulated with classical
Metropolis Monte Carlo simultaneously, each at a certain temperature Ti, where the single
temperatures represent a temperature gradient. After a defined number of MC simulation steps
systems with adjacent temperatures (Ti, Ti+1) attempted to exchange their replicas with the
probability:
min1, exp (S11)
with i = 1/(kBTi), kB being the Boltzmann constant and Ei the energy of the system i. Thus, a
replica is heated and cooled down, respectively, during these exchange events avoiding the
systems to get trapped in a local minimum. The temperatures were determined by using a
feedback-optimized approach prior to the production run of the simulations (47). This algorithm
optimizes the distribution of temperatures at a given maximum temperature iteratively, such that
the diffusion of replicas from the highest to the lowest temperature and vice versa is improved in
each iteration. The procedure can be made more efficient by starting with a system, that was
pre-relaxed utilizing a simulated annealing scheme (46).
6
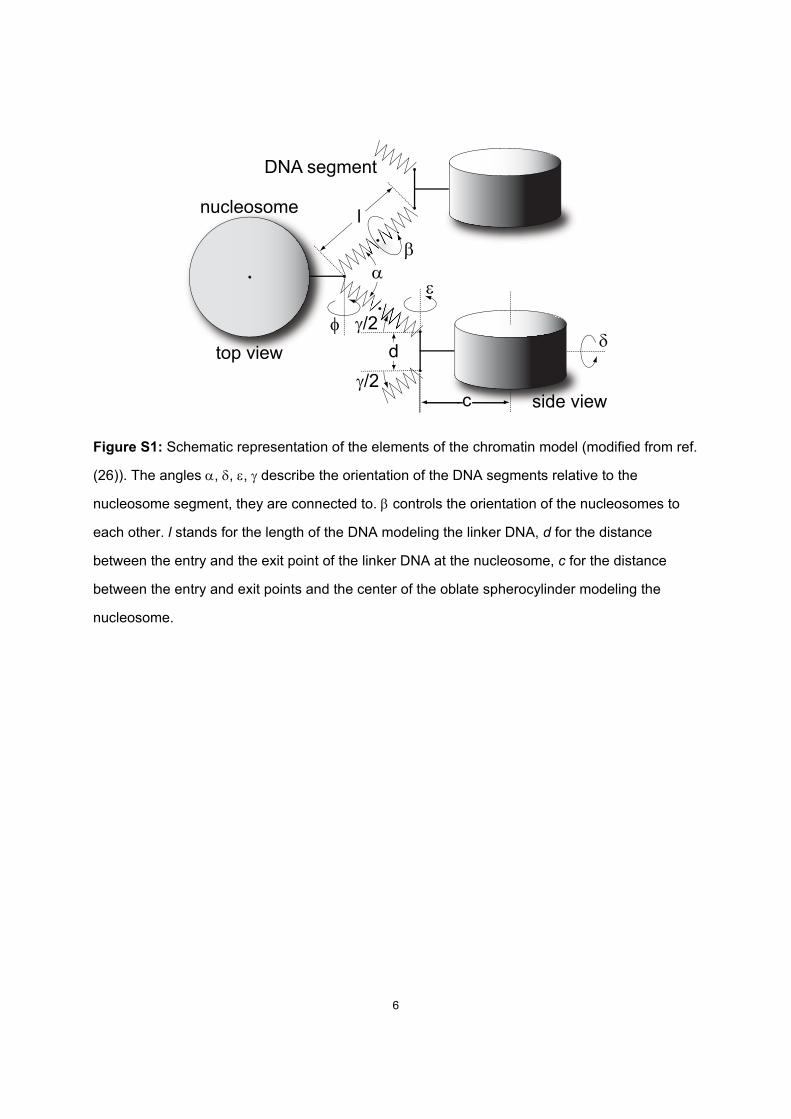
Figure S1: Schematic representation of the elements of the chromatin model (modified from ref.
(26)). The angles , , , describe the orientation of the DNA segments relative to the
nucleosome segment, they are connected to. controls the orientation of the nucleosomes to
each other. l stands for the length of the DNA modeling the linker DNA, d for the distance
between the entry and the exit point of the linker DNA at the nucleosome, c for the distance
between the entry and exit points and the center of the oblate spherocylinder modeling the
nucleosome.
c
l
d
α
δγ/2
γ/2
β
ε
φ
top view
side view
DNA segment
nucleosome
7
A B
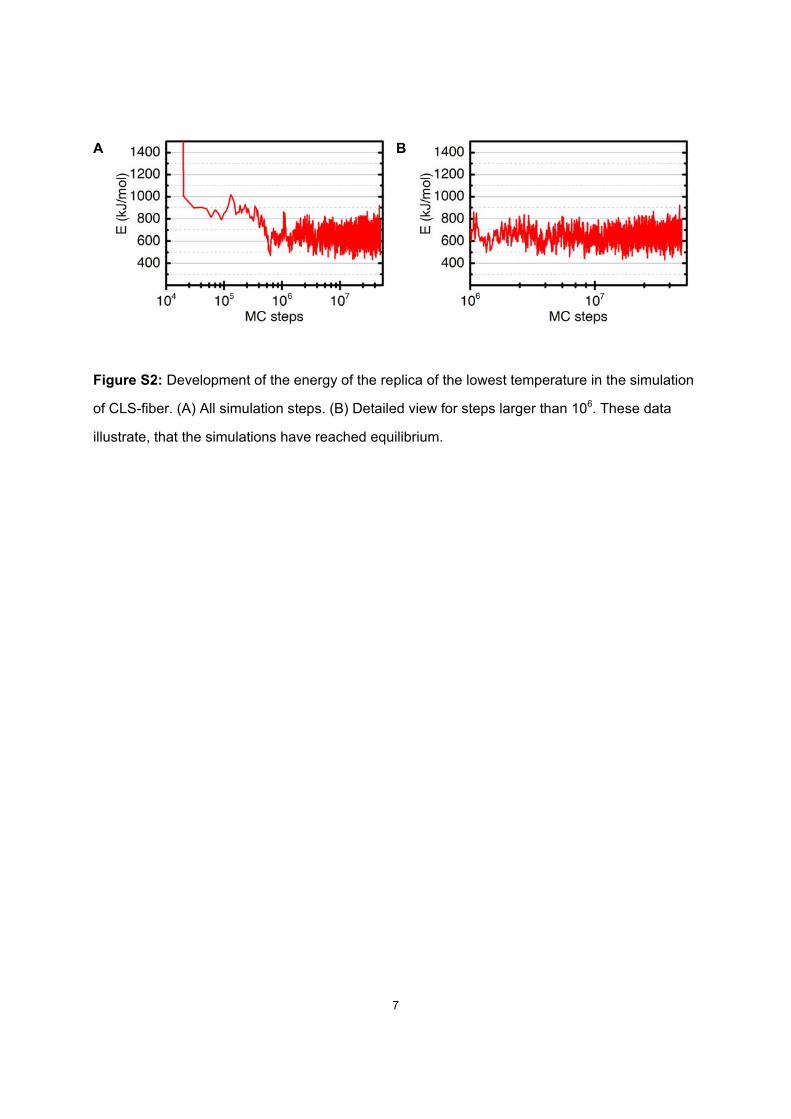
Figure S2: Development of the energy of the replica of the lowest temperature in the simulation
of CLS-fiber. (A) All simulation steps. (B) Detailed view for steps larger than 106. These data
illustrate, that the simulations have reached equilibrium.
8
A B
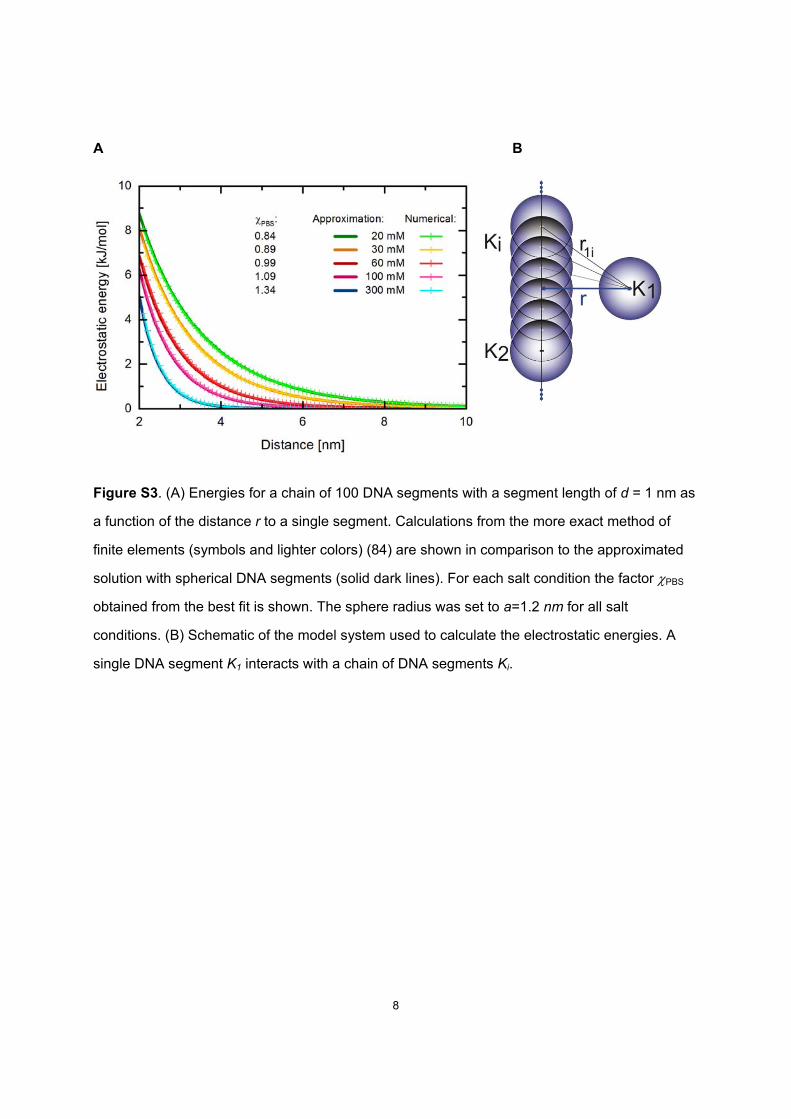
Figure S3. (A) Energies for a chain of 100 DNA segments with a segment length of d = 1 nm as
a function of the distance r to a single segment. Calculations from the more exact method of
finite elements (symbols and lighter colors) (84) are shown in comparison to the approximated
solution with spherical DNA segments (solid dark lines). For each salt condition the factor PBS
obtained from the best fit is shown. The sphere radius was set to a=1.2 nm for all salt
conditions. (B) Schematic of the model system used to calculate the electrostatic energies. A
single DNA segment K1 interacts with a chain of DNA segments Ki.
9
Figure S4. Approach to model nucleosome repositioning. Linker l1 is lengthened while linker l2
is simultaneously shortened by the same amount so as to move the center nucleosome towards
its right-side neighbor (arrows). The torsional angle β is modified according to the length
changes (rotation arrow). Histones are in red, DNA in blue. Higher-order chromatin structure
was mostly omitted to facilitate interpretation.
10
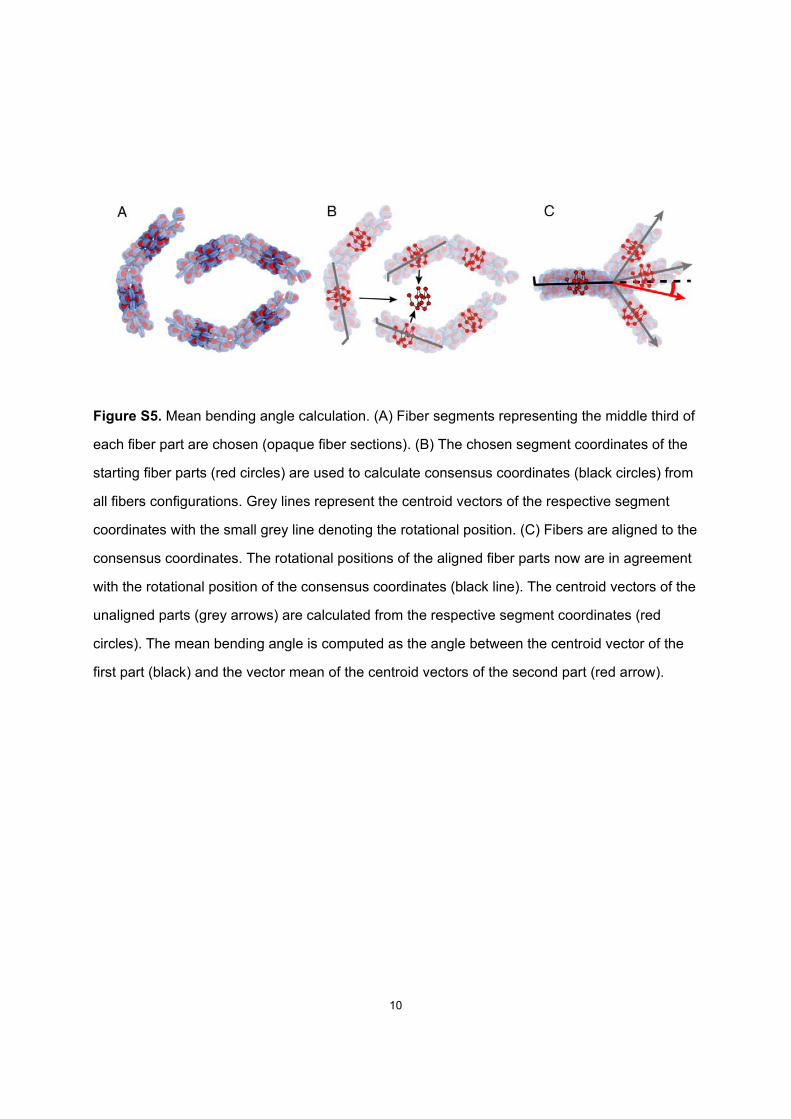
Figure S5. Mean bending angle calculation. (A) Fiber segments representing the middle third of
each fiber part are chosen (opaque fiber sections). (B) The chosen segment coordinates of the
starting fiber parts (red circles) are used to calculate consensus coordinates (black circles) from
all fibers configurations. Grey lines represent the centroid vectors of the respective segment
coordinates with the small grey line denoting the rotational position. (C) Fibers are aligned to the
consensus coordinates. The rotational positions of the aligned fiber parts now are in agreement
with the rotational position of the consensus coordinates (black line). The centroid vectors of the
unaligned parts (grey arrows) are calculated from the respective segment coordinates (red
circles). The mean bending angle is computed as the angle between the centroid vector of the
first part (black) and the vector mean of the centroid vectors of the second part (red arrow).
11
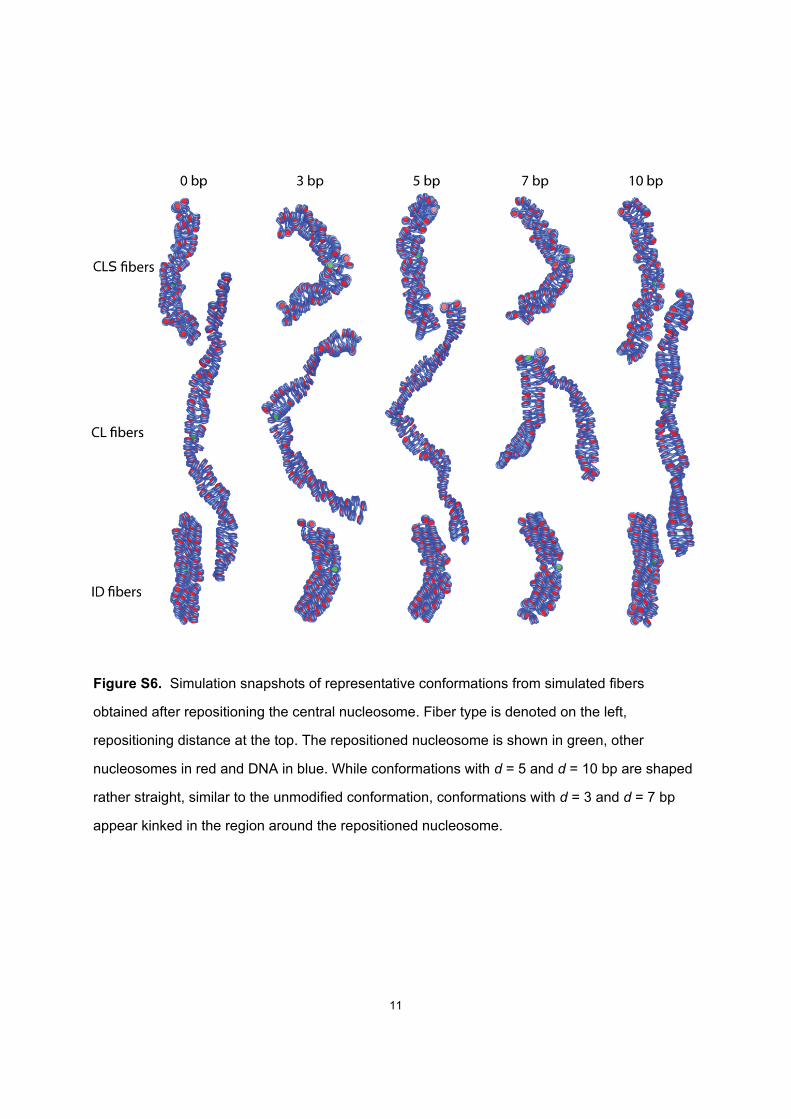
Figure S6. Simulation snapshots of representative conformations from simulated fibers
obtained after repositioning the central nucleosome. Fiber type is denoted on the left,
repositioning distance at the top. The repositioned nucleosome is shown in green, other
nucleosomes in red and DNA in blue. While conformations with d = 5 and d = 10 bp are shaped
rather straight, similar to the unmodified conformation, conformations with d = 3 and d = 7 bp
appear kinked in the region around the repositioned nucleosome.
12
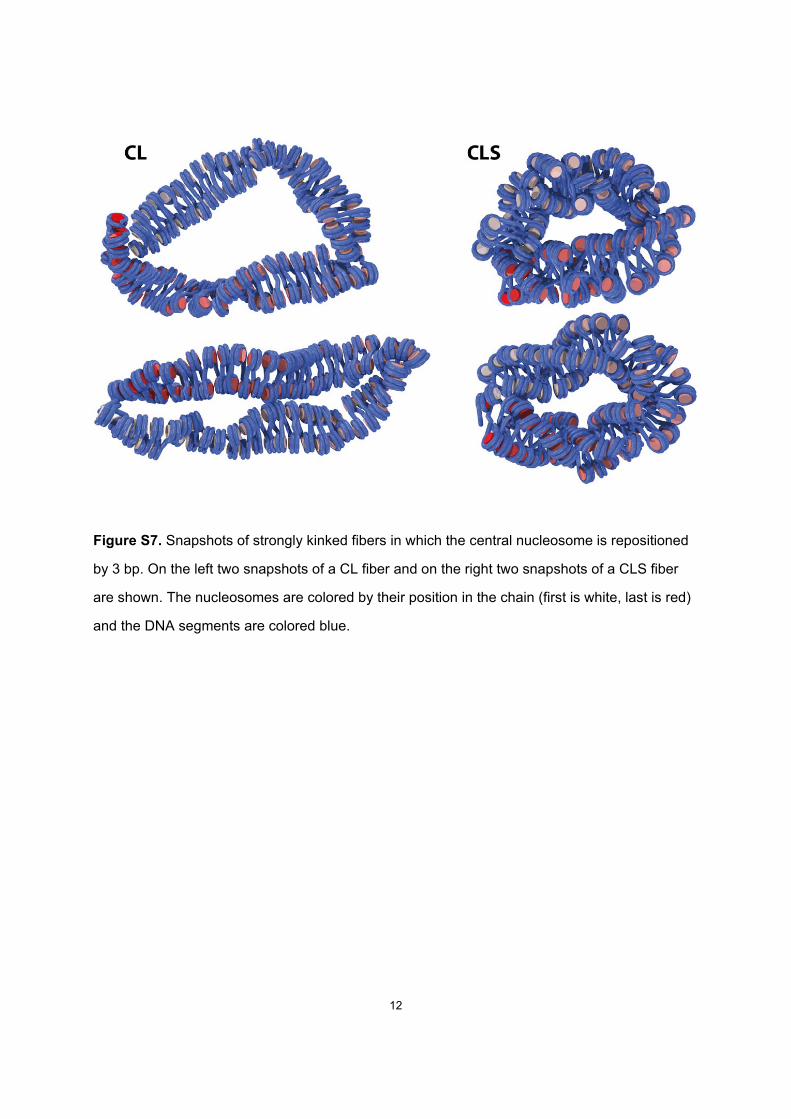
Figure S7. Snapshots of strongly kinked fibers in which the central nucleosome is repositioned
by 3 bp. On the left two snapshots of a CL fiber and on the right two snapshots of a CLS fiber
are shown. The nucleosomes are colored by their position in the chain (first is white, last is red)
and the DNA segments are colored blue.
13
Figure S8. Cumulated probability of the end-to-end distance for the three fiber types shown for
unmodified fibers (black curves) and fibers, in which the central nucleosome is displaced by 3
bp (red curves). The plots on the right hand-side show a detailed view of the first 100 nm. The
probability of small distances is greatly increased for CL and CLS fibers.
14
Figure S9. Geometric distance as a function of the genomic distance. For all three fiber models
in the left panel the geometric distance is plotted against the genomic distance given by the
nucleosome pairs. In the right panel the standard deviation of the geometric distance is plotted.
15
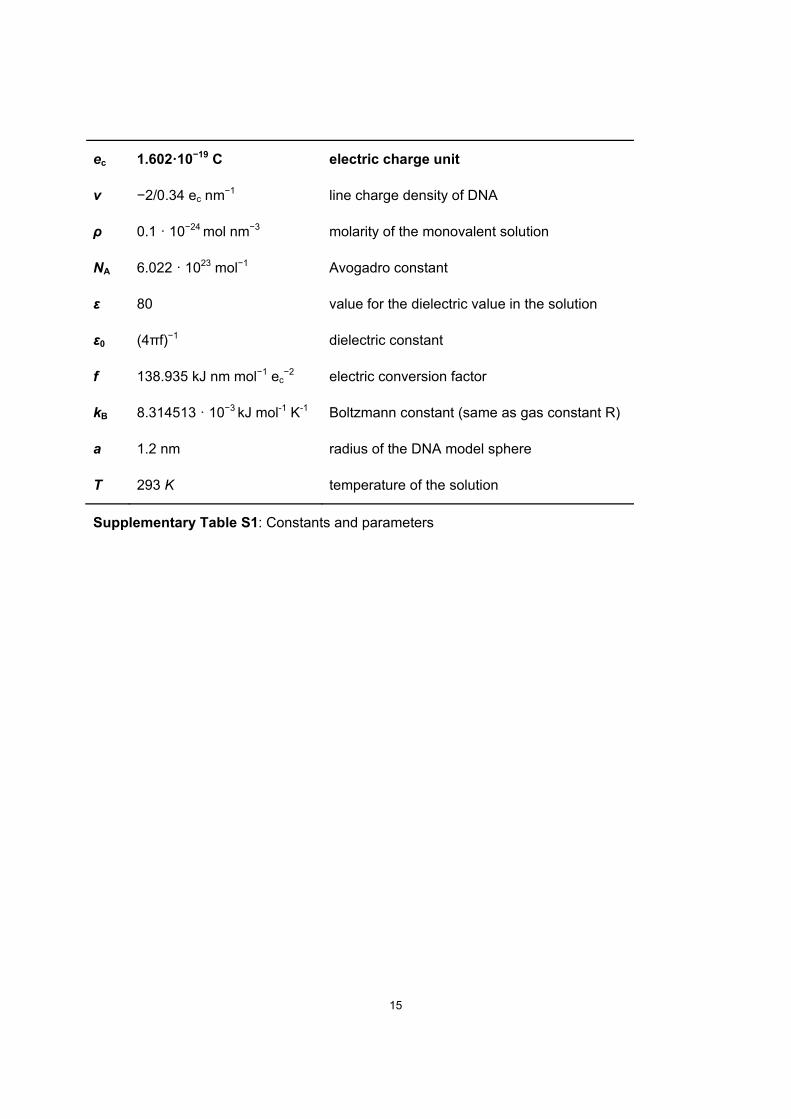
ec 1.602·10−19 C electric charge unit
ν −2/0.34 ec nm−1 line charge density of DNA
ρ 0.1 · 10−24 mol nm−3 molarity of the monovalent solution
NA 6.022 · 1023 mol−1 Avogadro constant
ε 80 value for the dielectric value in the solution
ε0 (4πf)−1 dielectric constant
f 138.935 kJ nm mol−1 ec−2 electric conversion factor
kB 8.314513 · 10−3 kJ mol-1 K-1 Boltzmann constant (same as gas constant R)
a 1.2 nm radius of the DNA model sphere
T 293 K temperature of the solution
Supplementary Table S1: Constants and parameters
16
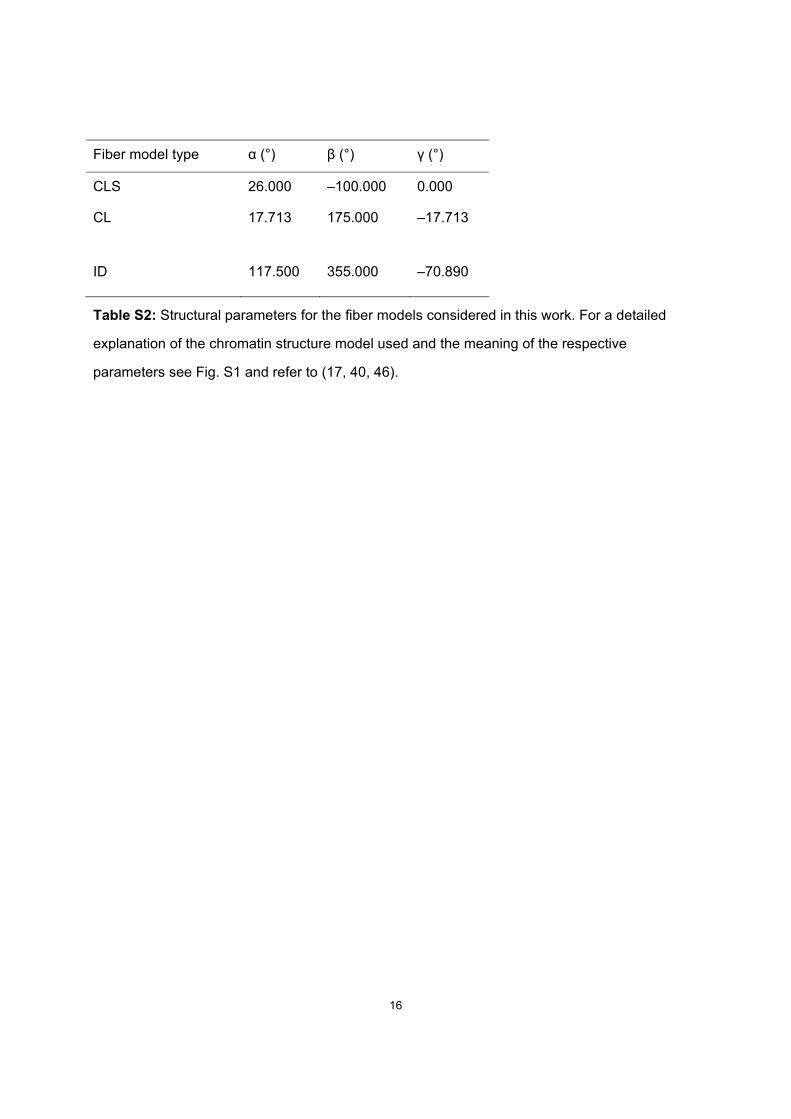
Fiber model type α (°) β (°) γ (°)
CLS 26.000 –100.000 0.000
CL 17.713 175.000 –17.713
ID 117.500 355.000 –70.890
Table S2: Structural parameters for the fiber models considered in this work. For a detailed
explanation of the chromatin structure model used and the meaning of the respective
parameters see Fig. S1 and refer to (17, 40, 46).
17
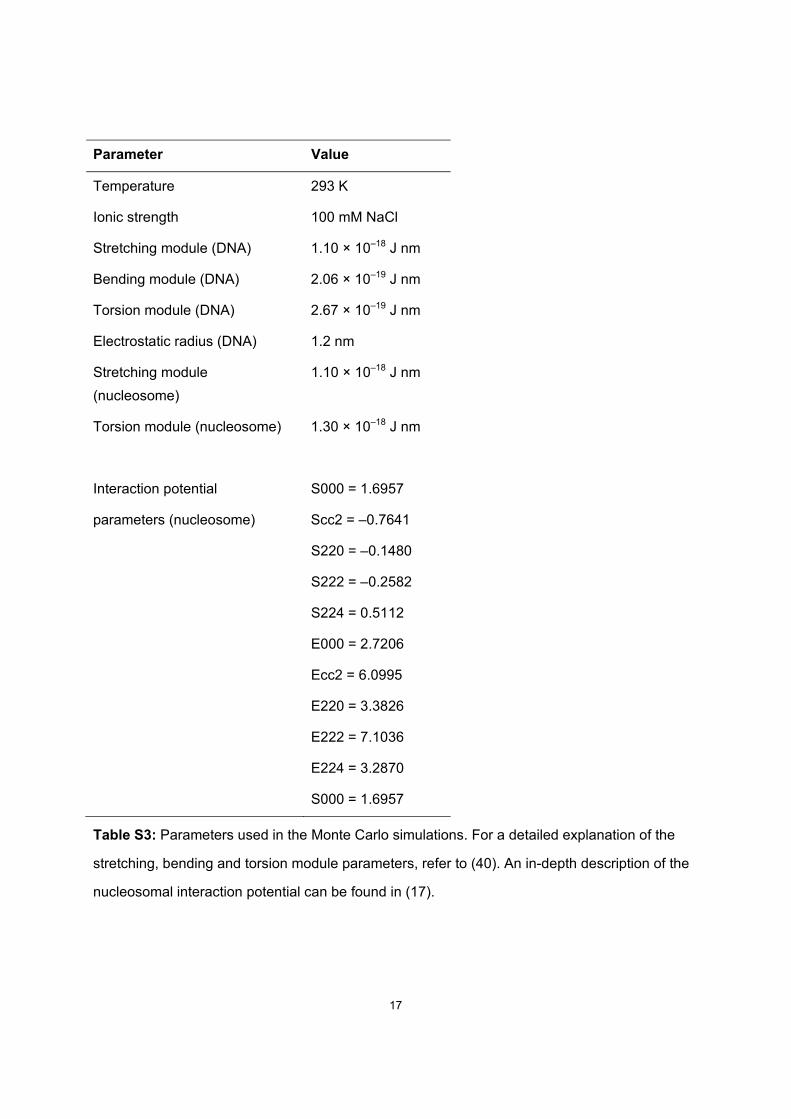
Parameter Value
Temperature 293 K
Ionic strength 100 mM NaCl
Stretching module (DNA) 1.10 × 10⁻¹⁸ J nm
Bending module (DNA) 2.06 × 10⁻¹⁹ J nm
Torsion module (DNA) 2.67 × 10⁻¹⁹ J nm
Electrostatic radius (DNA) 1.2 nm
Stretching module
(nucleosome)
1.10 × 10⁻¹⁸ J nm
Torsion module (nucleosome) 1.30 × 10⁻¹⁸ J nm
Interaction potential S000 = 1.6957
parameters (nucleosome) Scc2 = –0.7641
S220 = –0.1480
S222 = –0.2582
S224 = 0.5112
E000 = 2.7206
Ecc2 = 6.0995
E220 = 3.3826
E222 = 7.1036
E224 = 3.2870
S000 = 1.6957
Table S3: Parameters used in the Monte Carlo simulations. For a detailed explanation of the
stretching, bending and torsion module parameters, refer to (40). An in-depth description of the
nucleosomal interaction potential can be found in (17).
18
Supporting References
1. Stehr, R., R. Schöpflin, R. Ettig, N. Kepper, K. Rippe, and G. Wedemann. 2010. Exploring the conformational space of chromatin fibers and their stability by numerical dynamic phase diagrams. Biophys. J. 98: 1028–1037.
2. Stehr, R., N. Kepper, K. Rippe, and G. Wedemann. 2008. The effect of internucleosomal interaction on folding of the chromatin fiber. Biophys. J. 95: 3677–3691.
3. Klenin, K., H. Merlitz, and J. Langowski. 1998. A Brownian Dynamics Program for the Simulation of Linear and Circular DNA and Other Wormlike Chain Polyelectrolytes. Biophys. J. 74: 780–788.
4. Wedemann, G., and J. Langowski. 2002. Computer simulation of the 30-nanometer chromatin fiber. Biophys. J. 82: 2847–2859.
5. Hess, B., C. Kutzner, D. van der Spoel, and E. Lindahl. 2008. GROMACS 4: Algorithms for Highly Efficient, Load-Balanced, and Scalable Molecular Simulation. J. Chem. Theory Comput. 4: 435–447.
6. Walker, D.A., B. Kowalczyk, M.O. de la Cruz, and B.A. Grzybowski. 2011. Electrostatics at the nanoscale. Nanoscale. 3: 1316–1344.
7. Levin, Y. 2002. Electrostatic correlations: from plasma to biology. Rep. Prog. Phys. 65: 1577.
8. Maffeo, C., R. Schöpflin, H. Brutzer, R. Stehr, A. Aksimentiev, G. Wedemann, and R. Seidel. 2010. DNA-DNA Interactions in Tight Supercoils Are Described by a Small Effective Charge Density. Phys. Rev. Lett. 105: 158101.
9. Sader, J.E., S.L. Carnie, and D.Y.C. Chan. 1995. Accurate Analytic Formulas for the Double-Layer Interaction between Spheres. J. Colloid Interface Sci. 171: 46–54.
10. Nguyen, A.V., L.T.T. Tran, and J.D. Miller. 2012. Particle–Particle Interaction. In: Lee S, KHH Henthorn, editors. Particle technology and applications. Boca Raton, FL: CRC Press. pp. 31–50.
11. Zewdie, H. 1998. Computer simulation studies of liquid crystals: A new Corner potential for cylindrically symmetric particles. J. Chem. Phys. 108: 2117.
12. Metropolis, N., A.W. Rosenbluth, M.N. Rosenbluth, A.H. Teller, and E. Teller. 1953. Equation of State Calculations by Fast Computing Machines. J. Chem. Phys. 21: 1087–1092.
13. Swendsen, and Wang. 1986. Replica Monte Carlo simulation of spin glasses. Phys. Rev. Lett. 57: 2607–2609.
14. Katzgraber, H., S. Trebst, D. Huse, and M. Troyer. 2006. Feedback-optimized parallel tempering Monte Carlo. J Stat Mech Theor Exp. P03018:03018.
15. Rippe, K., R. Stehr, and G. Wedemann. 2012. Monte Carlo Simulations of Nucleosome Chains to Identify Factors that Control DNA Compaction and Access. In: Schlick T, editor. Innovations in Biomolecular Modeling and Simulations. Cambridge: Royal Society of Chemistry. pp. 198–235.