Embed Size (px)
Citation preview

Changes to Medicare under the Affordable Care ActBy Jack Davidson and Jonathan Levin
The Affordable Care Act (ACA) made
substantial changes to Medicare.
Supporters of the ACA hoped
the 2010 law would improve the
efficiency of Medicare by reforming
payments and health care delivery
while also lowering costs.
Some of the notable reforms included
adjustments to slow the growth of
Medicare prices, attempts to reduce
expenditures in Medicare Advantage,
and a range of programs that reward
or penalize health care providers
based on how they perform relative to
quality or cost targets. Early evidence
suggests some success in slowing cost
growth, but the potential long-term
impact of far-reaching payment
reforms is still hard to assess.
These policy changes have been
overshadowed by the controversy
over the ACA’s reforms to the
individual health care market and the
expansion of Medicaid. But with the
new Congress poised to revisit and
likely repeal parts of the Affordable
Care Act, Medicare may come under
the microscope again. This Policy
Brief reviews the ACA reforms to
Medicare and how they have played
out over the last seven years.
Traditional Medicare (Parts A & B)
The ACA mandated several broad sets
of reforms to the traditional fee-for-
service (FFS) Medicare program.
These reforms included an attempt
to slow cost growth by changing the
formula for Medicare payments, as
well as programs and demonstrations
that attempt to shift the structure
of Medicare payments and the
incentives of health care providers.
Medicare reimburses providers for
services based on administrative
payment schedules. The Centers for
Medicare and Medicaid Services (CMS)
update these schedules each year to
reflect changes in medical costs. The
update reflects changes in the costs
of providing different services. The
ACA mandated that calculations of
these cost changes should incorporate
productivity growth that enables
health care providers to use their
resources more efficiently.
Figure 1 illustrates the impact of
the ACA productivity adjustment
using CMS Inpatient Hospital data
(2000-2017). So far, the adjustments
have been relatively small on an
annual basis, on the order of 0.5
to 1.0 percent (the 2017 number is
slated at 0.3 percent). However, the
adjustments cumulate over time, so
that as of 2017 payments are 3.45
percent lower than they would have
been with the old unadjusted index.
Over time, the policy will cut
meaningfully into prices. A hospital
that receives $2,500 for performing a
cardiac catheterization and expects
this to rise to $3,000 over a decade
might see that growth cut by $150.
An open and significant question is
whether the productivity adjustment
will be sustainable. In the short
run, Medicare has some flexibility
to reduce payment growth. Over
a longer period, payments need
to be high enough to induce
hospitals and physicians to accept
Medicare insurance. Ultimately, the
sustainability of the ACA adjustment
will depend on whether health care
productivity gains keep up with
those of the economy at large so
that providers remain willing to
participate.
Policy Brief
January, 2017 siepr.stanford.edu
About the Authors
Jack Davidson is a
sophomore at
Dartmouth College,
majoring in
economics. He was
a research assistant
at SIEPR during the
summer of 2016.
Jonathan Levin is the
Philip H. Knight
Professor and Dean
of the Stanford
Graduate School of
Business and a senior
fellow at SIEPR.
Stanford Institute for Economic Policy Research

Another set of ACA reforms, with
less direct budget consequences but
potentially far-reaching effects, address
the structure of Medicare payments.
Experts have long pointed to two
structural problems with fee-for-
service payments. First, they provide
no direct reward for quality of care.
Second, they provide no incentive
for physicians or hospitals to forgo
unnecessary tests or procedures, or
expensive treatments with relatively
low health benefits.
Two ACA programs aim to reward
hospitals for quality of care: the
Hospital Readmissions Reduction
Program (HRRP) and Hospital
Value Based Purchasing (HVBP).
Both adjust hospital payments
based on selected quality metrics,
imposing penalties on hospitals that
underperform and in the case of the
HVBP awarding bonuses to high-
quality providers.
The HRRP seeks to reduce Medicare
hospital readmissions and these
have fallen since 2012, just prior
to the implementation of HRRP
payments. Establishing causality is
a delicate issue, although looking
across hospitals there is some
evidence that access to HRRP
payments is associated with reduced
readmissions. In the case of the
HVBP, a Government Accountability
Office (GAO) review in 2015 found
little impact on quality or payments.
However, the program’s quality
metrics and incentive structure
have been changing and the GAO
observed that future effects could be
more substantial.
To address over-utilization of
services, the ACA also initiated the
Medicare Shared Savings Program
(MSSP), which rewards providers
for keeping patient costs below a
target level. Because patients often
receive care from a combination of
doctors, hospitals, and other facilities,
a central component of the MSSP
is a reliance on Accountable Care
Organizations (ACOs).
ACOs are groups of providers that
can coordinate health care for groups
of beneficiaries and contract with
the government for shared savings.
An ACO might include one or more
hospitals, additional outpatient
clinics, and dozens or hundreds of
physicians. For instance, the POM
ACO associated with the University
of Michigan Medical School’s Faculty
Group Practice has more than 5,000
providers and 12 physician groups
and covers roughly 120,000 patients
in 22 Michigan counties.
In large part due to their inclusion
in the Affordable Care Act, ACOs
have seen a meteoric rise since their
inception roughly 10 years ago. As
of 2016, the government had signed
contracts with 477 ACOs covering
8.9 million Medicare beneficiaries,
including 434 ACOs in the MSSP. The
total number of ACOs in the United
States has grown from 64 in 2011 to
838 in 2016. Although the jury is still
2
Stanford Institute for Economic Policy Research
Figure 1. Historical Hospital Inpatient Market Basket (annual percent change)
Productivity Adjustment
1.5
2.0
2.5
3.0
3.5
4.0
FY 00 FY 01 FY 02 FY 03 FY 04 FY 05 FY 06 FY 07 FY 08 FY 09 FY 10 FY 11 FY 12 FY 13 FY 14 FY 15 FY 16
Adjusted Market Basket Update Unadjusted Market Basket Update
Source: Centers for Medicare and Medicaid Services Market Basket Data

out on how the spread of ACOs will
affect the quality and cost of health
care, it is possible that organizational
changes in health care delivery could
be among the most meaningful
impacts of the ACA.
In addition to reforming Medicare
payments, the ACA also attempted
to establish two new institutions
within the Medicare program. One
of these, the Independent Payment
Advisory Board (IPAB), was designed
as a backstop to limit Medicare
cost growth. It was charged with
implementing cuts in the Medicare
program in the event of certain cost
triggers, which so far have not been
realized. The IPAB was extremely
controversial from the start. To date,
no members have been nominated,
and the IPAB seems unlikely to see
the light of day anytime soon.
The other institution—the Center
for Medicare and Medicaid
Innovation (CMI)—has been more
successful. The CMI primarily houses
demonstration programs testing
innovations in Medicare and Medicaid
payments. While demonstration
programs existed prior to the ACA,
their number has grown. Currently,
there are 27 ongoing demonstrations
relating solely to the Medicare
program, many of which are focused
on alternative payment models
such as quality-based payments or
payments for “episodes of care”
rather than individual services.
As of January 2016, more than 20
percent of fee-for-service payments
went through an alternative payment
model, and Sylvia Burwell, the
Obama administration’s secretary
of Health and Human Services, set
a goal of increasing that level to 50
percent by 2018. Whether the new
administration will try to reach this
goal is an open question.
Medicare Advantage (Part C)
The ACA also mandated significant
changes to the Medicare Advantage
program, which allows Medicare
beneficiaries to enroll in private
insurance plans. In the years
preceding the ACA, Medicare
Advantage payments to insurers
became more generous and
enrollment expanded steadily. As of
2009, Medicare Advantage spending
per beneficiary had ballooned to
113 percent of the per capita cost of
traditional Medicare, contrary to the
program’s goal of reducing taxpayer
costs. The ACA targeted the level of
Medicare Advantage payments to
insurance plans and also tied them to
measures of plan quality.
Figure 2 shows the reduction in
Medicare Advantage spending
relative to traditional fee-for-service
Medicare since the implementation
of the ACA. The three lines reflect
the complicated nature of price
setting in the Medicare Advantage
program. The blue line shows
benchmark payments set by the
government. The red line shows
3
Figure 2. Medicare Advantage Bids, Benchmarks, and Payments (percent of FFS spending)
MA Payment System
90%
95%
100%
105%
110%
115%
120%
2008 2009 2010 2011 2012 2013 2014 2015 2016
Benchmarks Bids Payments
Source: Medicare Payment Advisory Commission (2016), Health Care Spending and the Medicare Program: Data Book

Policy Brief
bids made by Medicare Advantage
insurers. The grey line shows the
ultimate government payments per
Medicare Advantage enrollee relative
to per-capita fee-for-service spending.
The payment reforms have triggered
roughly a 10 percent decline in
Medicare Advantage spending relative
to fee-for-service, saving around $16
billion dollars in 2016.
The ACA reductions involved
several specific changes. One was
to limit the growth in benchmark
rates that set regional baselines for
Medicare Advantage reimbursement.
Here the goal was to bring those
payments back in line with regional
fee-for-service spending. This was
coupled with an adjustment to the
risk-coding used to ensure that plans
with relatively sick enrollees receive
larger payments.
Medicare uses a predictive formula
to “score” each beneficiary on his/
her expected medical costs, using the
individual’s age and chronic illnesses.
Under this system, private insurers
have a strong financial incentive to
make sure chronic conditions are
recorded, and analysts have noted
that due to thorough (some would
say aggressive) coding, risk scores in
Medicare Advantage rise more rapidly
than risk scores in traditional Medicare.
To counteract this, the Deficit
Reduction Act of 2005 and later the
ACA instituted a “coding adjustment”
that scales down Medicare Advantage
risk scores. As of 2016, this
adjustment reduces the program’s
plan payments by 5.41 percent.
The ACA also brought financial
incentives into Medicare Advantage’s
five-star quality system. The Centers
for Medicare and Medicaid Services
initiated the rating system for
Medicare Advantage plans in 2008
in order to measure plan quality
and performance. The ACA tied plan
payments to these ratings, creating a
direct financial reward to plans with
higher quality ratings.
The CMS has argued these payments
have led insurers to focus on
achieving higher ratings, driving
increases in quality of care. Figure 3
uses Kaiser Family Foundation data
on Medicare Advantage enrollment to
show the resulting increase in plan
quality. Between 2013 and 2016, plan
enrollment shifted significantly from
three-star plans into four-star plans.
A final aspect of the ACA reforms
to Medicare Advantage was to
directly target the operating profits
of insurers. Specifically, the ACA
mandated that the Medical Loss Ratio
(MLR) of Medicare Advantage plans
must be at least 85 percent. The MLR
captures the dollar amount of health
claims paid relative to plan revenue,
so an 85 percent maximum MLR
January, 2017
4
Continued on Back Flap
Figure 3. Medicare Advantage Enrollment in Plans by Star Rating (percentage of total)
MA Enrollment by Star Rating
3 2 4 54 1 2 1
20
13 8 6
37
3225
21
14
2432
35
1520 21 24
7 8 8 9
0%
10%
20%
30%
40%
50%
60%
70%
80%
90%
100%
2013 2014 2015 2016
No Rating 2.5 Stars 3.0 Stars 3.5 Stars 4.0 Stars 4.5 Stars 5.0 Stars
Source: Kaiser Family Foundation, Medicare Advantage 2016 Spotlight
Policy Brief
means that a plan can use no more
than 15 percent of its revenue to
cover administrative costs, insurance
company profits, and non-health care
related items.
In principle, this relatively blunt form
of regulation could have significant
effects on insurer behavior. However,
the GAO has found that a majority
of insurers already met the MLR
requirements at the time the ACA
was passed in 2010 and more than
three-quarters of plans met the
requirements in 2011. So due to a
relatively easy-to-meet standard and
exceptions in the law for certain
types of plans, the MLR restriction
does not yet appear to have had
much impact.
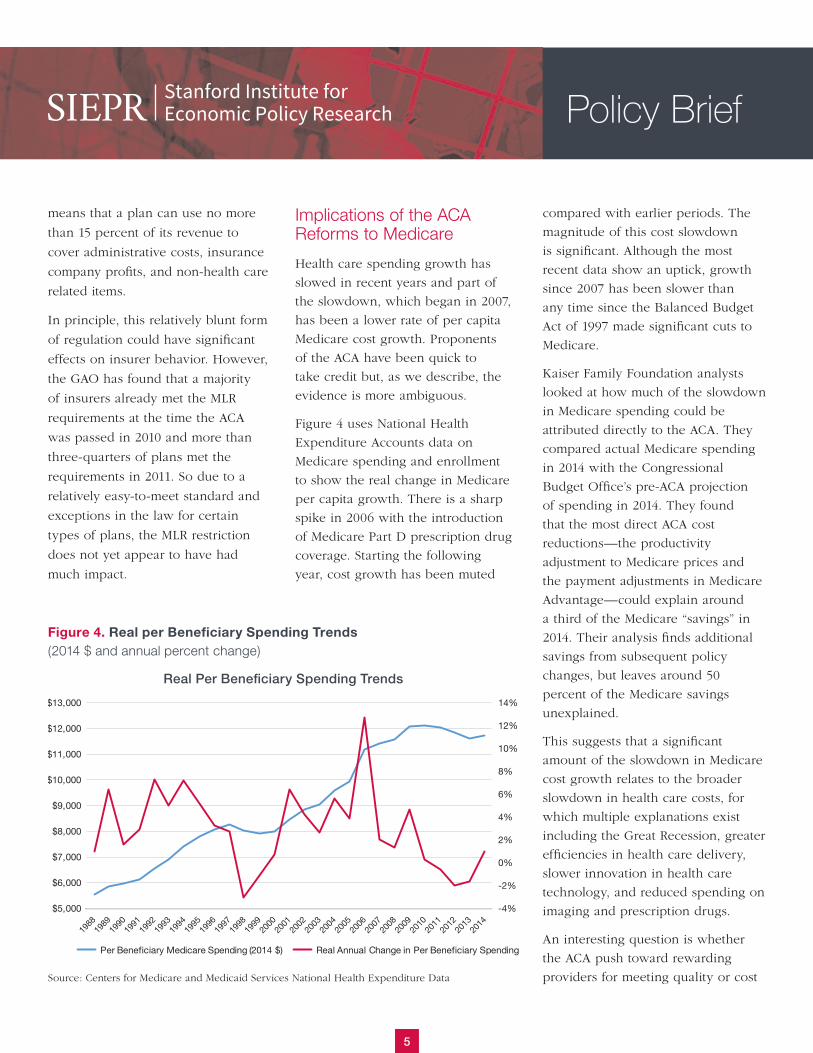
Implications of the ACA Reforms to Medicare
Health care spending growth has
slowed in recent years and part of
the slowdown, which began in 2007,
has been a lower rate of per capita
Medicare cost growth. Proponents
of the ACA have been quick to
take credit but, as we describe, the
evidence is more ambiguous.
Figure 4 uses National Health
Expenditure Accounts data on
Medicare spending and enrollment
to show the real change in Medicare
per capita growth. There is a sharp
spike in 2006 with the introduction
of Medicare Part D prescription drug
coverage. Starting the following
year, cost growth has been muted
compared with earlier periods. The
magnitude of this cost slowdown
is significant. Although the most
recent data show an uptick, growth
since 2007 has been slower than
any time since the Balanced Budget
Act of 1997 made significant cuts to
Medicare.
Kaiser Family Foundation analysts
looked at how much of the slowdown
in Medicare spending could be
attributed directly to the ACA. They
compared actual Medicare spending
in 2014 with the Congressional
Budget Office’s pre-ACA projection
of spending in 2014. They found
that the most direct ACA cost
reductions—the productivity
adjustment to Medicare prices and
the payment adjustments in Medicare
Advantage—could explain around
a third of the Medicare “savings” in
2014. Their analysis finds additional
savings from subsequent policy
changes, but leaves around 50
percent of the Medicare savings
unexplained.
This suggests that a significant
amount of the slowdown in Medicare
cost growth relates to the broader
slowdown in health care costs, for
which multiple explanations exist
including the Great Recession, greater
efficiencies in health care delivery,
slower innovation in health care
technology, and reduced spending on
imaging and prescription drugs.
An interesting question is whether
the ACA push toward rewarding
providers for meeting quality or cost
5
Stanford Institute for Economic Policy Research
Figure 4. Real per Beneficiary Spending Trends (2014 $ and annual percent change)
Real Per Beneficiary Spending Trends
$5,000
$6,000
$7,000
$8,000
$9,000
$10,000
$11,000
$12,000
$13,000
Per Beneficiary Medicare Spending (2014 $) Real Annual Change in Per Beneficiary Spending
-4%
-2%
0%
2%
4%
6%
8%
10%
12%
14%
Source: Centers for Medicare and Medicaid Services National Health Expenditure Data

targets may be indirectly responsible
for slowing Medicare and overall
health care spending growth. An
optimistic story would be that ACA
changes in payment structure, which
also are entering the commercial
sector, have triggered organizational
changes and improved efficiency.
As noted above, it is still early to
assess this hypothesis. With the new
Congress likely considering further
changes in Medicare, it is unclear if
we will get an answer on the long-
run impact of the payment reforms.
References
For a full list of references, please
see Davidson, J. & Levin, J. (2016).
Changes to Medicare under the
Affordable Care Act, prepared for the
Alfred P. Sloan Foundation.
Medicare Payment Advisory
Commission. (2016). Health Care
Spending and the Medicare Program:
A Data Book.
The Henry J. Kaiser Family
Foundation. (2016). Medicare
Advantage 2016 Spotlight: Enrollment
Market Update.
Centers for Medicare & Medicaid
Services. (2014). National Health
Expenditure Data.
Patient Protection and Affordable
Care Act, 42 U.S.C. § 18001 et seq.
(2010).
About the Stanford Institute for Economic Policy ResearchWe support research that informs economic policymaking while engaging future leaders and scholars. We share knowledge and build relationships among academics, government officials, the business community and the public.
Policy BriefsSIEPR Policy Briefs summarize research by our affiliated faculty and researchers. They reflect the views and ideas of the author only. SIEPR is a nonpartisan research institute.
For Additional CopiesPlease visit SIEPR.stanford.edu
LocationJohn A. and Cynthia Fry Gunn Building366 Galvez StreetStanford, CA 94305-6015
Onlinesiepr.stanford.edu
@siepr facebook.com/SIEPR/
Stanford Institute for Economic Policy Research


![Notice of changes in Medicare and Alaska - Premera Blue Cross · Notice of changes in Medicare and Medicare Supplement Coverage P.O. Box 327 Seattle, WA 98111 3] U ^ F A P+ , 4P`](https://img.pdfslide.us/doc/110x75/5b9a24ff09d3f294728d3bc6/notice-of-changes-in-medicare-and-alaska-premera-blue-cross-notice-of-changes.jpg)