Embed Size (px)
Citation preview

1
Changes in Spousal Relationships Over the Marital Life Course
We used six waves of data from the Marital Instability Over the Life Course study to examine
long-term trends in three aspects of spousal relationships: marital happiness, the frequency of
participation in shared activities, and discord (n = 1,617). The first analyses were based on
random effects regression models. Across the full sample, happiness declined gradually during
the first 20 years of marriage and then stabilized. Participation in shared activities declined
during the first 20 years of marriage and then increased, whereas discord declined continuously.
These trends depended, however, on whether marriages ended in divorce. Happiness declined
dramatically among spouses headed for divorce but was stable among continuously married
spouses. Similarly, the frequency of shared activities declined sharply, and discord rose, among
spouses headed for divorce. Reports of declines in happiness and increases in discord prior to
divorce were more marked among wives than husbands. Trends in spousal relationships did not
vary with marriage order (first versus higher-order marriages) or whether spouses were college
graduates. Fixed effects regression models confirmed most (but not all) of these trends. Overall,
and contrary to some prior studies, our results suggest that marriages that remain together show
little evidence of deterioration in relationship quality over the marital life course. Nevertheless,
period effects were apparent, with marital relationships (irrespective of duration) becoming more
troubled during the 1980s and 1990s but rebounding in 2000.

2
Social scientists have learned a lot about marriage since the first empirical studies were
conducted in the 1930s (Burgess and Cottrell 1939; Terman, Buttenwieser, Ferguson, Johnson, &
Wilson, 1938). We know a great deal, for example, about the correlates of marital quality, the
predictors of divorce, and the consequences of marital conflict and divorce for health and general
wellbeing. Despite many decades of research, however, gaps remain in our understanding of how
spousal relationships change over the marital life course. These gaps are due partly to the
shortage of long-term longitudinal studies of married people, especially studies based on
nationally representative samples. Although some studies have examined long-term trends in
marital happiness, few have focused on other dimensions of marriage, such as the frequency of
shared activities or conflict. Moreover, we know little about how marital trajectories differ
between spouses who divorce and those who remain continuously married.
To address these gaps in our understanding, we show how three aspects of marital
relationships—happiness, the frequency of participation in shared activities, and discord—
change over time in a nationally representative (U.S.) sample of married people. We focus on the
relationship trajectories of two particular groups: those who remain continuously married and
those who divorce. We also consider whether relationship trajectories vary by gender, marriage
order, and education. We accomplish these goals using pooled time series analyses (with random
and fixed effects models) and 20 years of panel data from the Marital Instability over the Life
Course (MIOLC) study. These analyses cast light on several theoretical perspectives on stability
and change in marital relationships.
THEORETICAL PERSPECTIVES
Three general ways of thinking about changes in spousal relationships appear in the theoretical
and empirical literature. Relationship stability perspectives stress the homeostatic nature of

3
spousal relationships. The enduring dynamics perspective (Huston, Caughlin, Houts, Smith, &
George, 2001), for example, assumes that spouses have genetic predispositions, personalities,
attachment styles, relationship skills, and other traits that affect how they interact in
relationships. These factors lead spouses to develop stable patterns of interaction in the early
years of marriage—or even prior to marriage. Because relationship dynamics crystallize
relatively early, interpersonal problems typically emerge in the first year of marriage and tend to
endure over time. Karney and Bradbury’s (1995) vulnerability-stress-adaptation model also
emphasizes the stable traits that people bring to relationships, such as a tendency to experience
negative affect (neuroticism) or make problematic attributions about a partner’s behavior. These
factors not only increase the level of discord in relationships, but also impair people’s ability to
cope with stressful circumstances that arise during marriage. In summary, relationship stability
perspectives suggest that (a) most of the risk factors that lead to divorce are present at the start of
marriages, and (b) relationship characteristics tends to be stable over many years because the
individual and couple traits that shape relationships change slowly, if at all.
Huston and colleagues also outlined two perspectives based on the idea that most
marriages are harmonious during the newlywed stage but deteriorate over time (Huston et al.,
2001). The disillusionment perspective suggests that people enter marriage with romanticized
and idealized images of their spouses. After the newlywed years, however, people become
disillusioned with their marriages as they move beyond romanticized fantasies and adopt more
realistic views of their spouses’ limitations. As disappointment sets in, feelings of satisfaction
and love begin to wane, and feelings of ambivalence and doubt emerge. A related perspective
based on the notion of emergent distress assumes that all couples begin marriage as affectionate
and loving partners. During the early years they may even avoid conflict to maintain a positive

4
emotional tone. But as they encounter the inevitable problems of life, an accumulation of
disagreements, expressions of negative sentiment, and troubling behavior leads to relationship
distress. Because conflict arises in all relationships, declines in attraction to one’s spouse are
normative.
A related decline perspective was advanced by Pineo (1961). According to this view,
spouses marry at a time when they are most compatible. As the years pass, however, individuals
change in random, largely unanticipated ways. These changes lead to incompatibility and a
poorer relationship fit. These ideas are consistent with exchange theory (Sabatelli and Shehan,
1993), which assumes that spouses “exchange” valued characteristics that each brings to the
marriage. Changes in these characteristics over time are likely to disrupt the equity of the
exchange and lead to unhappiness. Another decline perspective can be drawn from sociological
life course theory (Elder, 1998), which assumes that relationships are shaped by the timing and
sequencing of events and the roles that spouses enter and leave during the marriage. According
to this view, the positive feelings reported by newlyweds do not necessarily erode because of
intrinsic relationship dynamics or personality traits. Instead, they tend to decline as couples
struggle with the challenges of rearing young children, paying off mortgages, dealing with work-
family conflict, caring for aging relatives, and experiencing age-related decrements in health
(VanLaningham, Johnson, and Amato, 2001).
Although they appear frequently in the research literature, the theoretical models
described thus far may be too pessimistic. It is true, as noted earlier, that many individuals
possess stable, negative traits that undermine their relationships. Other individuals, however,
possess stable, positive traits that strengthen their relationships, such as honesty, generosity,
trust, conscientiousness, good communication skills, the willingness to compromise, and a knack
5
for resolving disagreements peacefully. Moreover, all individuals have the capacity to learn,
adapt, and grow. These positive traits facilitate adaptive processes and allow people to deal with
the inevitable problems that arise in relationships and in life more generally (Hawkins, Fowers,
Carroll, and Yang, 2007). According to a marital resilience perspective, not all spouses are
doomed to see the quality of their relationships erode over time. Although marriages headed for
divorce may deteriorate, spouses with resilient relationships can maintain—or even improve
on—the generally positive relationship dynamics that characterize the early years of marriage
(Canary, Stafford, and Semic, 2002). According to this view, spending many years together can
lead to deeper levels of appreciation, closeness, and contentment.
EMPIRICAL EVIDENCE
Does previous research provide support for any of the three theoretical models outlined earlier?
Although many longitudinal studies of marital quality can be found in the literature, only a few
have lasted longer than five years. Moreover, most of these studies involved only two waves of
data and, hence, were unable to detect nonlinear patterns of change. Despite these limitations, a
consistent finding in this literature is that marital satisfaction declines during the first few years
of marriage (e.g., Kurdek, 1999; Lindahl, Clements, and Markman, 1998). How marital quality
changes after this, and whether couples that eventually divorce begin their marriages with
troubled relationships, is less clear.
In an early study, Pineo (1961) reported on 400 married couples first studied in the 1930s
and followed up twenty years later. Husbands as well as wives reported general declines in a
variety of relationship characteristics between interviews, including satisfaction, love, intimacy,
and shared activities. Vaillant and Vaillant (1993) followed 169 male college students and their
wives (first studied in the 1930s and 1940s) for 40 years. Among husbands, marital adjustment

6
declined during the first 15 years of marriage then stabilized, whereas among wives, marital
adjustment declined continuously. (Wives reported especially large declines in resolving
disagreements.) VanLaningham, Johnson, and Amato (2001) used 17 years of national data from
the first five waves of the MIOLC study (initiated in 1980) and found that marital happiness
declined continuously at all marital durations, with no upturn in the later years of marriage.
More recently, Biddit, Hope, Brown, and Orbuch (2012) followed 320 newlywed couples for 16
years and found a general (average) decline in marital happiness for wives as well as husbands.
The authors also used mixture modeling to show that not all spouses followed the same
trajectory, however. James (2015) used data from 2,604 women in the 1979 National
Longitudinal Survey of Youth who reported on their marriages between 1992 and 2010. Reports
of happiness and communication declined modestly but continuously, on average, whereas
reports of conflict were curvilinear (increasing and then declining after the first decade). James
also used mixture modeling to demonstrate heterogeneity in these trajectories.
Taken together, the studies by Pineo (1961), Vaillant and Vaillant (1993), VanLaningham
et al. (2001), Biddit et al. (2012), and James (2015) are consistent in showing that spousal
relationships tend to become less positive over time. The latter two studies also show, however,
that not all couples follow the same pattern of decline. Moreover, no studies have considered
how the relationship trajectories of continuously married spouses differ from the relationship
trajectories of spouses who end their marriages in divorce.
CONTRIBUTIONS OF THE CURRENT STUDY
To assess the three general theoretical perspectives outlined earlier, we draw on the MIOLC
study. This data set has four advantages for the current inquiry: (1) it is based on a randomly
selected national sample of married individuals, (2) it is relatively large with over 2,000 cases,

7
(3) it contains multiple-item measures of several relationship dimensions, and (4) it includes six
waves of data collected over a 20-year period. A disadvantage is that it was initiated in 1980,
which means that the results may not be generalizable to more recent marriage cohorts.
Nevertheless, the MIOLC continues to be the most useful data set available for understanding
long-term changes in marital relationships.1
The current study is similar in certain respects to VanLaningham et al. (2001), which also
used the MIOLC. The two studies differ in several important respects, however. First, the
VanLaningham et al. study was conducted before the final (6th) wave of data (collected in 2000)
was available, whereas we use all six waves of data. The additional wave makes it possible to
extend the range of marital duration estimates with greater precision. Second, VanLaningham et
al. did not examine marital quality trajectories for respondents who divorced—a central focus of
the current study. Third, VanLaningham et al. focused only on marital happiness, whereas the
current study includes three conceptually distinct relationship dimensions. Fourth, although
VanLaningham et al. provided suggestive evidence that period effects were present in their data,
they did not directly test or control for them. The current study, in contrast, includes controls for
period effects that can distort estimates of marital duration effects. To our knowledge, the current
study is the first to separate period effects from marital duration effects.
To summarize, the current study reveals how three spousal relationship dimensions
(happiness, participation in shared activities, and discord) change over the marital life course
(that is, change over long durations of time). A central goal is to consider how relationships
change for spouses who either divorce or remain together. Can the troubled relationships of
divorced spouses be observed in the initial years of marriage, as the marital stability perspective
suggests? Or do these relationships begin happily and then decline abruptly, as the marital

8
decline perspective suggests? What about spouses who remain continuously married? Do they
report declines in relationship quality, as the marital decline perspective suggests? Or do they
report consistently positive relationships, or even improvement in relationship quality, as the
marital resilience perspective suggests?
In addition to focusing on divorce, we consider whether relationship trajectories vary
with gender (husband versus wife), marriage order (first versus higher-order marriages), and
education (college versus non-college). Since Jessie Bernard’s (1982) discussion of “his” and
“her” marriages, gender differences in marriage have been of broad interest to family scholars
(Jackson, Miller Oka, and Henry, 2014). Marriage order is of interest because, since the rise in
divorce rates in the 1960s and 1970s, an increasing percentage of marriages have been
remarriages for one or both spouses (Bramlett & Mosher, 2002). Moreover, college and non-
college educated spouses differ substantially on a variety of marital behaviors, including age at
marriage, having children prior to marriage, and the probability of ending a marriage in divorce
(Cherlin, 2014).
METHOD
Sample
Our analysis was based on the 20-year MIOLC study (Booth, Johnson, Amato, and Rogers,
2000). The target population consisted of all married individuals in households in the contiguous
United States with a telephone, both spouses present, and both spouses 55 years of age or less in
1980. Telephone interviewers used random digit dialing to select a sample of households and a
second random procedure to select either the husband or wife for an interview. Seventeen
percent of targeted individuals could not be reached after 20 calls. Of those individuals
contacted, 78% gave complete interviews. The final sample consisted of 2,034 married persons.

9
When compared with U.S. Census data, the sample was representative of married individuals
with respect to age, race, household size, home ownership, presence of children, and region of
the country, although there was an overrepresentation of women (60%)—a common outcome in
surveys. The sample was tracked and re-interviewed in 1983, 1988, 1992, 1997, and 2000, with
re-interview rates of 78%, 84%, 89%, 88%, and 87%, respectively.
The data set for the current analysis included pooled data from all six waves.
Respondents contributed records for each wave in which they were married and participating in
the study. An advantage of pooled time series analysis is that it allows cases to contribute all
available data, irrespective of attrition (Johnson, 1995). Only respondents who participated in
two or more waves of data collection were included in the analysis. The analytic sample involved
7,076 observations (records) from 1,617 individuals. Of these individuals, 790 remained married
and continued through the final interview in 2000, 313 divorced, 77 experienced the death of a
spouse, and the remaining 437 dropped out of the panel at some point. Of those respondents who
divorced or experienced the death of a spouse during the study, 89 remarried and reported on
their new relationships in two or more waves. We included these observations in the analyses.
One advantage of including these cases is that it weakened the correlation between duration of
marriage and year of interview (period).
In 1980 the mean ages of husbands and wives were 35 and 37, respectively. The majority
of respondents (88%) were white, and 17% had cohabited with their spouses prior to marriage.
The majority of couples (72%) were parents in 1980, although some children no longer were
living at home.
Variables
Relationship Characteristics. Marital happiness was based on ten items. Sample items

10
included, “How happy are you with the amount of understanding you receive from your
spouse?...with the amount of love and affection you receive?...with your sexual
relationship?...with your marriage overall?” Responses were scored in the direction of greater
happiness (1 = not too happy, 2 = pretty happy, 3 = very happy), and the mean response served
as the scale score. Alpha reliability coefficients ranged from .87-.88 across waves.
To measure shared activities, respondents were asked how often they engaged in six
activities with the spouse: eating dinner, shopping, visiting friends, working on projects around
the house, and going out for recreation. Responses were scored in the direction of frequent
interaction (1 = never, 4 = almost always), and the mean response served as the scale score.
Alpha reliability coefficients ranged from .64-.69 across waves.
General relationship discord was a composite based on three scales. To assess marital
problems, respondents were asked about the presence of 13 problems in their marriages,
including whether they or their spouses get angry easily, have feelings that are easily hurt, are
jealous, are critical, avoid talking, or have had extramarital sex. The total number of reported
problems served as the measure. Marital conflict was based on five items, including “In general,
how often do you disagree with your spouse?” (1 = never, 5 = very often), and “How many
serious quarrels have you had with your spouse in the last two months?” (0-4 or more). The
mean response across the five items served as the scale score. Divorce proneness is the
propensity to divorce and includes both a cognitive component (e.g., thinking that one’s marriage
is in trouble) and a behavioral component (e.g., talking with one’s spouse about divorce). The
scale included 13-items, such as “Has the thought of divorce or separation ever crossed your
mind?” Because the sum of the items was positively skewed, the log (base 10) served as the scale
score. The three scales (problems, conflict, and divorce proneness) were equally weighted (using

11
Z score transformations) and added to produce a measure of general relationship discord. The
reliability for the composite was .85 across all waves.
Marital Duration. Marital duration was measured in years and was time-varying in the
analysis. In 1980 this variable ranged from 0 to 38 with a mean of 12.6 (S = 9.2). In 2000 (the
final survey year) this variable ranged from 20 to 58 with a mean of 33.1 (S = 8.9). The
longitudinal data set included 242 spouses who had been married for 2 years or less at the time of
the first interview, and 205 spouses who had been married for 40 years or longer at the time of
the final interview. We also included a quadratic term (years married squared) to capture
nonlinear trends.
Divorce. As noted earlier, 313 spouses divorced during the study. Divorce was treated as
a time-invariant variable in the analysis because the focus was on spouses who ever divorced,
irrespective of when the event occurred.
Gender. The respondent’s gender was included in all analyses (0 = husband, 1 = wife).
The majority of respondents (60%) were female—a common outcome in survey research.
Marriage order. Marriage order was coded 0 = first marriage for the respondent, 1 =
second or higher order marriage for the respondent. Fourteen percent of respondents were in
second or higher-order marriages. In an alternative specification, we scored this variable 1 if it
was a second or higher-order marriage for the respondent and the respondent’s spouse, but the
results were identical to those reported later.
College graduate. The respondent’s education was coded 0 = not a college graduate, 1 =
college graduate. Nineteen percent of respondents were college graduates. In alternative
specifications, we scored this variable 1 if the respondent and the respondent’s spouse were
college graduates, but the results were identical to those reported later.

12
Periods. Period effects were estimated by including dummy variables for each survey
year (1983, 1988, 1992, 1997, and 2000), with 1980 serving as the omitted reference category.
Attrition. Of all the respondents interviewed in 1980, 53% no longer were participating
in the panel by 2000 (including some respondents who died). We relied on a variation of
Heckman’s (1979) two-step method to correct for attrition bias. We used logistic regression to
model the attrition of respondents from the panel and used the resulting equation to calculate the
probability of dropping out of the panel for each case. Attrition was more common among
African Americans, relatively young or old spouses, renters, spouses with little education,
spouses married for only a few years, and spouses living in the south. This variable was included
as a control variable in the random effects models.
Analysis
We estimated the statistical models with the xtreg procedure in Stata. We estimated random and
fixed effects models because each has offsetting advantages and disadvantages. Random effects
models allowed us to estimate regression coefficients for divorce, gender, marriage order, and
college—four of the central variables in our study. Fixed effects models (unlike random effects
models) allowed us to control for all unobserved time-invariant variables, including demographic
characteristics and stable personality traits that may affect attrition. Fixed effects models also
allowed us to control for cohort effects, given that year of birth and age at marriage are fixed.
Fixed effects models do not allow for the inclusion of time-invariant variables, however, so we
could not use them to provide regression coefficients for divorce, gender, marriage order, and
college. We could, however, model interaction terms between marital duration and these
variables, which was sufficient for our purposes. It is common for researchers working with
pooled time series data to compare the results of both types of models (e.g., Teachman, 2011;

13
Turney and Carlson, 2011). To the extent that random and fixed effects models yield comparable
findings, confidence in the general conclusions is strengthened.
Although a good deal of attrition occurred in the panel study (as noted earlier), missing
data among cases participating in each wave was modest and represented no more than 1% of
observations for the variables used in the analysis. For this reason, we relied on listwise deletion
to deal with within-wave missing data.
Prior to analysis, the relationship variables (happiness, shared activities, and discord)
were transformed to Z scores (mean = 0, standard deviation = 1). Doing so made it easier to (a)
assess the magnitude of change over time and (b) make comparisons across outcomes.
RESULTS FROM RANDOM EFFECTS MODELS
Overall Trends
Table 1 in the appendix shows the equations (unstandardized coefficients) for all three spousal
relationship variables. We begin by focusing on the Model 1 results without the interaction
terms. For marital happiness, the negative coefficient for years married (-.015) and the positive
coefficient for years married squared (.0003) indicated a curvilinear trend. Not surprisingly,
spouses who eventually divorced reported lower levels of happiness (-.710 of a standard
deviation) than did spouses who remained married. Consistent with many studies, wives reported
less happiness than did husbands (-.187 of a standard deviation). The dummy variables for
survey year reveal that marital happiness declined during the 1980s and 1990s but rebounded in
2000. Finally, the significant coefficient for attrition (-.495) indicates that spouses with a high
probability of dropping out of the sample reported less happiness—a result that reinforces the
usefulness of controlling for attrition bias.
(Table 1 about here)

14
The results for the frequency of shared activities were comparable to the results for
happiness in some respects. In particular, the negative coefficient for years and the positive
coefficient for years squared in Model 1 indicate a curvilinear trend. In addition, spouses who
divorced reported fewer activities than did spouses who remained married, and wives reported
fewer activities than did husbands. Respondents with a high probability of attrition reported
fewer activities than did respondents with a low probability. Finally, the coefficients for survey
years reveal that shared activities declined substantially during the years of the study, with an
especially large drop in the final year of the study. With respect to discord, the Model 1 equation
shows a significant decline over time, although the quadratic term was not significant. Consistent
with earlier results, discord was higher among spouses headed for divorce than for spouses who
remained together and higher among wives than husbands. The dummy variables for year of
survey suggest that discord increased during the 1980s and 1990s but declined by 2000.
Figure 1 shows the overall trajectories of marital happiness, shared activities, and
discord, based on the Model 1 equations with all covariates set at their means. Note that
happiness declined during the first 20 years of marriage and then stabilized. The amount of
decline was modest, however, and represented only about one-fifth of a standard deviation.
Shared activities also declined during the first 20 years of marriage (about one fifth of a standard
deviation). After 25 years of marriage, however, shared activities began to increase, and by year
40 this variable was almost as high as it had been in the first year of marriage. Finally, discord
between spouses declined continuously and represented a drop of nearly two thirds of a standard
deviation over a 40-year period.
(Figure 1 about here)
Trends for Spouses Who Divorced or Remained Married

15
The Model 2 equations in Table 1 show the results of interacting divorce and marital duration.
For marital happiness, the interaction between divorce and years married was negative and
statistically significant (-.048), although the interaction between divorce and years married
squared was not significant. This result indicates that marital happiness declined more steeply
over time for spouses who divorced than for spouses who remained together. Moreover, the
coefficient for divorce in Model 2 was low and not significant (-.116). This result indicates that
the gap in marital happiness between spouses who either divorced or remained together was
modest in the first year of marriage (that is, at year = 0), but became increasingly pronounced
over time.
With respect to shared activities, the divorce x years married interaction term in Model 2
was negative and significant, although the interaction involving the quadratic term was not
significant. This result indicates that participation in shared activities declined more steeply for
spouses who divorced than for spouses who remained together. Moreover, the coefficient for
divorce in Model 2 was low and not significant. This result indicates that the gap between
spouses who either divorced or remained together was small in the first year of marriage but
became more pronounced over time. With respect to discord, the divorce x years married
interaction term also was significant and positive. This result indicates that discord increased
more steeply over time for spouses who divorced than for spouses who remained together.
Contrary to the results for happiness and shared activities, however, the b coefficient for divorce
was significant (.194), which indicates that even in the first year of marriage, spouses who later
divorced reported more conflict than did spouses who remained together.
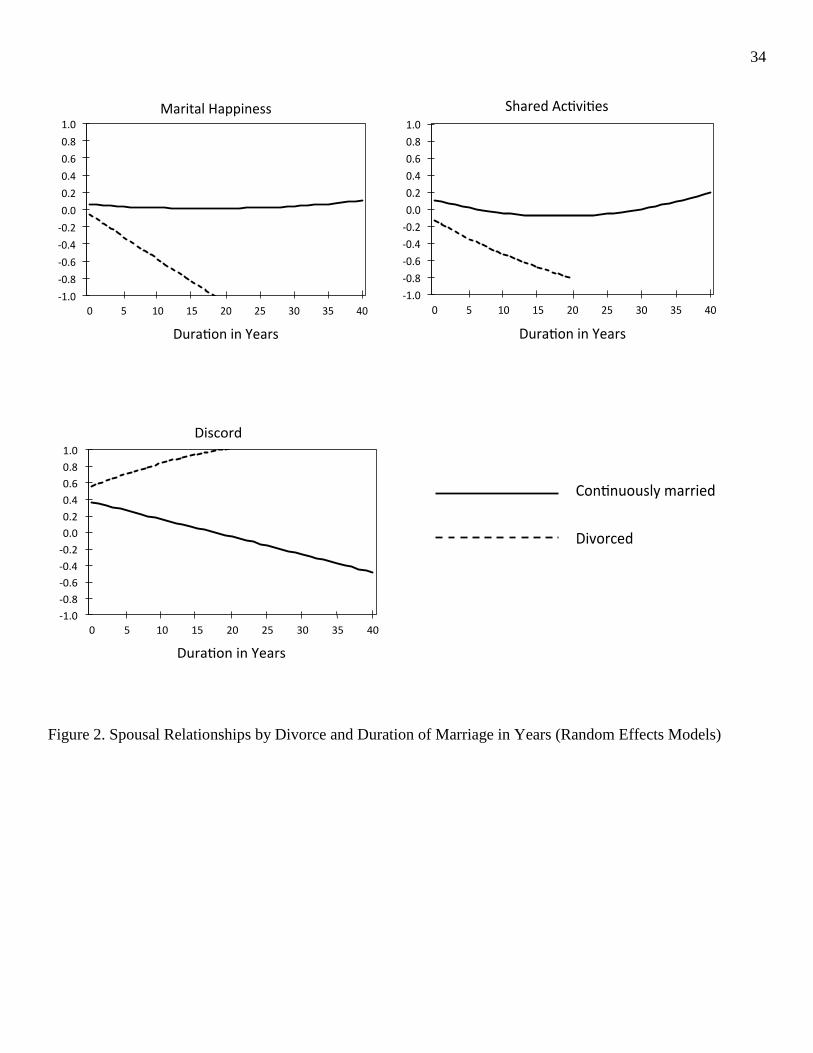
Figure 2 shows the estimated trajectories for spouses who divorced and remained married,
based on the coefficients in Model 2 (Table 1) with all covariates set at their means. In the first

16
year of marriage, spouses who later divorced reported slightly (but not significantly) less
happiness than did spouses who remained together. Spouses headed for divorce revealed a sharp
decline in happiness in subsequent years, dropping nearly a full standard deviation in less than 20
years—assuming that they stayed married for that long. Spouses who did not divorce exhibited a
different trajectory, with an almost imperceptible decline in happiness during the first two
decades of marriage (5% of a standard deviation) followed by a small increase (10% of a
standard deviation) during the next two decades.
(Figure 2 about here)
Trajectories of shared activities for divorced and continuously married spouses also are
shown in Figure 2. Spouses who divorced scored slightly lower at the beginning of the marriage
than did spouses who remained together. Shared activities in the divorced group declined two
thirds of a standard deviation during the first two decades of marriage. The mean for the
continuously married group also declined, albeit more gradually, and bottomed out after 20
years, with an overall decline of about one fifth of a standard deviation. The frequency of shared
activities increased again in subsequent years and by year 36 had returned to where it started at
the beginning of the marriage.
Finally, spouses who divorced reported more discord (conflict, problems, and divorce
proneness) in the first year of marriage than did spouses who remained together. Moreover,
discord increased over time for spouses headed for divorce, whereas it declined over time for
spouses who remained together. The decline in discord for continuously married spouses
represented 85% of a standard deviation over 40 years—a large change.
Gender Differences
In subsequent models (not shown), we examined differences between husbands and wives by

17
including interaction terms between gender and years married, years married squared, and
divorce. No two- or three-way interaction terms were significant for the frequency of shared
activities. For happiness and discord, however, the three-way interaction terms (gender x years
married x divorce) were statistically significant (all p < .05). The corresponding three-way
interaction for shared activities only approached significance (p = .09).
Figure 3 shows the marital happiness trajectories separately for husbands and wives.
Husbands and wives headed for divorce reported declines in marital happiness, but the decline
was steeper for wives than for husbands. Among wives who remained continuously married,
marital happiness changed little. Among husbands who remained continuously married, marital
happiness increased modestly (about one-tenth of a standard deviation) but significantly. These
results are consistent with prior research showing that wives tend to be report less marital
happiness and more relationship problems than do husbands (Amato et al., 2007…). The current
results indicate, however, that the gap between husbands and wives grew larger over time,
irrespective of whether couples stayed together or divorced.
(Figure 3 about here)
Figure 3 also illustrates gender differences in the trajectories of discord. Among wives in
marriages that ended in divorce, reports of discord started at a relatively high level in the first
year of marriage and increased substantially over time. Among husbands in marriages that ended
in divorce, in contrast, reports of discord were relatively high in the first year of marriage and
changed little after that. As with marital happiness, wives headed for divorce held especially
dismal views of their relationships as the years passed. Among marriages that remained intact,
wives reported more discord early in the marriage than did husbands. As the years passed,
however, both wives and husbands reported less discord, with the two trajectories converging

18
after 30 years of marriage.
Although the three-way interaction between gender, divorce, and the number of years
married was only marginally significant for shared activities (p = .09), we include a figure for
this outcome for the sake of completeness. As was the case for marital happiness, reports of
shared activities declined more steeply among wives headed for divorce than among husbands.
Results for Other Variables
Spouses in first marriages did not differ from spouses in second or higher-order marriages with
respect to happiness, shared activities, or discord. Moreover, marriage order did not interact with
divorce or gender with respect to any relationship outcomes. Although second (and higher-order
marriages) are more likely than first marriages to end in divorce (Bramlett & Mosher, 2002),
marriage order does not appear to be related to how spouses evaluate their marriages. These
results are consistent with several prior studies (e.g., Amato et al., 2007, White & Booth, 1985).
Presumably, higher-order marriages often end for reasons other than poor relationship quality
(such as holding positive attitudes toward divorce, having low commitment to the relationship, or
experiencing stress from the presence of stepchildren).
Spouses with college degrees did not differ from spouses without college degrees on any
relationship outcome. Moreover, education did not interact with divorce or gender in any
statistical model. Although divorce rates tend to be lower for spouses with college degrees
(Cherlin, 2014), having a college degree does not appear to be related to reports of relationship
quality—at least in the marriage cohort considered in the current study.
The dummy variables reflecting year of study consistently produced significant results.
These period effects are show in Figure 4, with all other variables in the models set at their
means. Happiness and discord reflected one another, with happiness showing declines followed

19
by an increase, and discord showing increases followed by a decline. In contrast, participation in
shared activities declined continuously during the years of the study and dropped especially
sharply between 1997 and 2000.
(Figure 4 about here)
It is difficult to determine the cause of period effects like these. Economic recessions in
1980-82 and 1991-91 were associated with increases in unemployment, declines in the real
earnings of men, and more family poverty. Starting in the mid 1990s and continuing through
2000, however, the U.S. economy expanded, leading to increases in employment and wages and
declines in economic hardship (Gould, Mishel, and Shierholz, 2013). These trends may have had
negative (and later, positive) effects on marital relationships. Wives’ employment expanded
during the 1980s and 1990s, which led to work-family conflict and tension over gender role
(Amato et al., 2007). Moreover, the high rate of female employment in 2000 may have
suppressed the frequency of shared activities in that year to an unusually low level. In addition,
many observers have argued that American culture became more individualistic after the 1960s
(Amato et al., 2007; Cherlin, 2004)—another trend that may have decreased the frequency of
interaction between spouses. Any of these factors, or a combination of them, could have been
responsible for the changes shown in Figure 4.
Fixed Effects Models
The results of fixed effects models are shown in Table 2 in the appendix. These equations should
be compared with the Model 2 equations (based on random effects models) in Table 1. Divorce
status, gender (wife), marriage order, college attendance, and the attrition variable are not in the
fixed effects equations because they are time invariant. Although it was not possible to include
divorce, it was possible to include interaction terms for years married x divorce (and the other

20
time invariant variables).
The equations in Table 2 are similar in most respects to those in Table 1. The interactions
between divorce and years married were significant and in the expected direction for all three
outcomes. These interactions can be seen in Figure 5. A disadvantage of fixed effects models is
that they cannot show difference between groups of spouses in the first year of marriage.
Because no between-person variance is modeled (only within-person variance) everyone
essentially starts in the “same place.” Nevertheless, consistent with the results from the random
effects models, the fixed effects models reveal that all aspects of relationship quality deteriorated
relatively quickly among spouses headed for divorce.
Figure 5 also reveals that among spouses who did not divorce, marital happiness declined
slightly and then increased again after about 20 years of marriage—a result directly comparable
to the random effects model. Shared activities declined by about three fourths of a standard
deviation and then stabilized after 30 years of marriage among spouses in continuously intact
marriages. This result differs from the random effects models, which suggested that shared
activities increased again after 20 years of marriage. Finally, the level of discord among spouses
who remained married increased slightly in Figure 5, but this trend was not statistically
significant (see Table 2). This contrasts with the random effects result, which suggested that
discord declined continuously.
Despite some differences between the random and fixed effects models, both indicated
that spouses in continuously intact marriages experienced no decline in marital happiness and no
increase in discord. Indeed, spouses in stable marriages appeared to experience a slight
improvement in marital happiness in the later years. In general, these results do not support the
view that most marriages experience an irrevocable erosion of relationship quality over the life

21
course.
GENERAL DISCUSSION
The current investigation considered the evidence for three theoretical perspectives on spousal
relationships over the life course. Most studies that have addressed this topic have been limited
by relatively short time frames of five years or less. (e.g., Huston et al., 2001; Kurdek, 1999;
Lavner and Bradbury, 2010). Other studies with longer time frames have involved samples of
limited size and geographical range, often without the benefit of probability sampling (e.g.,
Bidditt et al., 2012; Pineo, 1961; Vaillant and Vaillant, 1993). The current study, in contrast, was
based on a large, randomly selected national sample with six waves of data collected over a 20-
year period.
The relationship stability perspective (one of the theoretical models considered earlier)
assumes that relationship characteristics crystallize quickly and remain constant over time. This
continuity reflects the role of stable personal traits (such as personalities, genetic predispositions,
attachment styles, and social skills) in shaping relationship outcomes (Karney & Bradbury, 1995;
Huston et al., 2001). If this perspective is correct, then differences between spouses who divorce
or remain together should be apparent from the very beginning of the marriage. Contrary to this
assumption, however, our random effects models (Table 1 and Figure 2) indicated that spouses
who either divorced or stayed married differed only modestly in the first year of marriage. Gaps
between these two groups widened dramatically, however, as the first decade of marriage
unfolded. The current analysis, therefore, does not provide much support for the relationship
stability perspective.
Relationship decline perspectives assume that marital quality gradually deteriorates for
most spouses. This deterioration can occur because spouses become disillusioned with one
22
another (Huston et al., 2001), because the inevitable stress of life takes its toll on relationships
(Huston et al., 2001), or because spouses become increasingly different from one another and
drift apart (Pineo, 1961). Our random and fixed effects results indicate that this perspective
accurately describes the trajectories of spouses who end their marriages in divorce, but it does
not apply to most spouses who remain married. Marital happiness does not decline, on average,
among spouses who avoid divorce. Indeed, our results suggest that marital happiness increases
slightly in the later years of marriage, especially for husbands. We also find no evidence that
relationship discord increases over time for spouses who avoid divorce. Instead, discord either
declines (random effects model) or remains constant (fixed effects model). It is true that the
frequency of shared activities declines in long-term marriages, although interaction either stops
declining (fixed effects model) or increases again in the later years of marriage (random effects
model). This decline in shared activities may occur because spouses gradually develop new
interests or friendships outside of the relationship. Even if one accepts the fixed effects result,
however, it is still the case that spouses in long-term marriages are as happy as they had been in
the early years of marriage and experience no more conflict.
Our results suggest that the pessimistic conclusions of previous studies may have been
due to four limitations: (1) not having longitudinal data of sufficient duration to capture
improvements in marital happiness in the later years of marriage, (2) failing to separate couples
headed for divorce from couples who remain married, thus depressing aggregate levels of
relationship quality in the pooled sample, and (3) failing to control for period effects that can
shift mean levels of relationship quality downward during certain historical periods. Contrary to
previous work, the current study offers a more optimistic view of how marriages change, at least
among spouses who avoid divorce. Our results provide the most support for the marital resilience

23
model. Although some marriages clearly end in disaster, other spouses are able to maintain
satisfying and cohesive marital bonds for many decades.
This paper is not without limitations. First, although the MIOLC is a nationally
representative sample of married Americans 55 or younger, these data were originally collected
in 1980, and it is possible that more recent marriage cohorts display different patterns of change
over time. Second, as is typical of longitudinal studies, the data set suffered from a significant
degree of attrition. Although we attempted to correct for bias, attrition is always a source of
concern in longitudinal research. Third, although our total sample included 1,617 cases, our
estimates of how trajectories began and concluded were based on smaller subsamples. In
particular, our estimates of marital quality in the first two years of marriage were based on 242
individuals, 56 of whom divorced. Fourth, although our fixed effects analyses controlled for
cohort differences in mean levels of marital quality, our analysis assumed no cohort differences
in how marital quality changes over time. Cohort x duration interactions could cause some of our
estimates to be misleading. Given the impossibility of completely disentangling marital duration,
period, and cohort effects, we cannot test this assumption directly.
In the present study, different trajectories were estimated from known groups based on
divorce and gender. Mixture modeling—an increasingly common method in the social
sciences—makes it possible to estimate trajectories when groups are unknown, and a few recent
studies have demonstrated that this method can be applied usefully to study marital relationships
(Anderson et al., 2010; Birditt, Hope, Brown, and Orbuch, 2012; Lavner and Bradbury, 2010).
Although more work along these lines could be done with the MIOLC, new sources of long-term
data on marriage will become available as ongoing longitudinal studies, such as the National
Longitudinal Surveys of Youth (NLSY1979 and NLSY1997), continue into the future.

24
Ultimately, however, a better understanding of how relationships change in more recent marriage
cohorts may require the collection of new longitudinal data—an expensive and long-term
commitment on the part of researchers, although one that seems worthwhile.
25
REFERENCES
Allison, P. D. (2009). Fixed effects regression models. Los Angeles, CA: Sage.
Amato, P. R., A. Booth, D. R. Johnson, and S. J. Rogers. (2007). Alone together: How marriage
in America is changing: Harvard University Press.
Amato, P. R., and B. Hohmann-Marriott. 2007. “A Comparison of High and Low-Distress
Marriages that End in Divorce.” Journal of Marriage and Family 69: 621-638.
Anderson, J. R., M. J. Van Ryzin, and W. J. Doherty. 2010. "Developmental Trajectories of
Marital Happiness in Continuously Married Indivdiuals: A Group-Based Modeling
Approach." Journal of Family Psychology 24: 587-596.
Bernard, Jessie. (1982). The future of marriage. New Haven, CT: Yale University Press.
Birditt, K. .S., S. Hope, E. Brown, and T. L. Orbuch. 2012. "Developmental Trajectories of
Marital Happiness over 16 years." Research in Human Development 9: 126-144.
Burgess, E. W., and L. S. Cottrell. 1939. Predicting success or failure in marriage. New York:
Prentice-Hall.
Booth, A., D. R. Johnson, P. R. Amato, and S. J. Rogers. 2000. Marital Instability Over the Life
Course: A Six-Wave Panel Study (pp. 4). Ann Arbor, Michigan: Inter-university
Consortium for Political and Social Research.
Bramlett, M. D., & Mosher, W. D. 2002. Cohabitation, Marriage, Divorce, and Remarriage in
the United States (Series 23, Number 22). Washington, DC: National Center for Health
Statistics.
Canary, D. J., L. Stafford, & B. A. Semic. 2002. "A Panel Study of the Associations Between
Maintenance Strategies and Relational Characteristics." Journal of Marriage and Family
64: 395-406.

26
Elder, G. H. 1998. The life course as developmental theory. Child Development 69: 1-12.
Gould, E., L. Mishel, and H. Shierholz. 2013. Already More than a Lost Decade: Income and
Poverty Trends Continue to Paint a Bleak Picture. Economic Policy Institute
(http://www.epi.org/publication/lost-decade-income-poverty-trends-continue/)
Hawkins, A. J., B. J. Fowers, J. S. Carroll, and C. Yang. 2007. "Conceptualizing and
Measuring Marital Virtues." In S. L. Hofferth and L. M. Casper (Eds.). Handbook of
Measurement Issues in Family Research (pp. 67-83). Mahweh, New Jersey: Lawrence
Erlbaum.
Hawkins, D. N. and A. Booth. (2005). Unhappily Ever After: Effects of Long-Term, Low-
Quality Marriages on Well-Being." Social Forces 84: 451-471.
Heckman, J. (1979). Sample selection bias as a specification error. Econometrica, 47: 153–61.
Huston, T. L., J. P. Caughlin, R. M. Houts, S. E. Smith, and L. J. George. 2001. "The Connubial
Crucible: Newlywed Years as Predictors of Marital Delight, Distress, and Divorce."
Journal of Personality and Social Psychology 80: 237-252.
Jackson, J. B., R. B. Miller, M. Oka, and R. G. Henry. 2014. "Gender Differences in Marital
Satisfaction: A Meta-Analysis." Journal of Marriage and Family 76: 105-129.
Johnson, D. (1995). "Alternative Methods for the Quantitative Analysis of Panel Data in Family
Research: Pooled Time-Series Models." Journal of Marriage and Family 57: 1065-1077.
Johnson, D. (2005). "Two-Wave Panel Analysis: Comparing Statistical Methods for Studying
the Effects of Transitions." Journal of Marriage and Family 67: 1061-1075.
Kamp Dush, C. M., and M. G. Taylor. 2012. "Trajectories of Marital Conflict Across the Life
Course: Predictors and Interactions With Marital Happiness Trajectories." Journal of
Family Issues 33: 341-368.

27
Kamp Dush, C. M., M. G. Taylor, and R. A. Kroeger. 2008. "Marital Happiness and
Psychological Well-Being Across the Life Course." Family Relations 57: 211-226.
Kearney, B. R., and T. N. Bradbury. 1995. "The Longitudinal Course of Marital Quality and
Stability: A Review of Theory, Method, and Research." Psychological Bulletin 118: 3-34.
Kurdek, L. (1999). "The Nature and Predictors of the Trajectory of Change in Marital Quality for
Husbands and Wives over the First 10 Years of Marriage." Developmental Psychology,
35: 1283-1296.
Lavner, J. A., and T. N. Bradbury. (2010). "Patterns of Change in Marital Satisfaction over the
Newlywed Years." Journal of Marriage and Family 72: 1171-1118.
Lindahl, K., M. Clements, and H. Markman. 1998. "The Development of Marriage: A 9-year
Perspective." In T. N. Bradbury (Ed.), The Developmental Course of Marital
Dysfunction. Cambridge, MA: Cambridge University Press.
Nagin, D. S. (2005). Group-Based Modeling of Development. Boston, MA: Harvard University
Press.
Pineo, P. C. 1961. "Disenchantment in the Later Years of Marriage." Marriage and Family
Living 23: 3-11.
Sabatelli, R. M. and C. L. Shehan. 1993. "Exchange and Resource Theories." Pp.385- 411 in
Sourcebook of Family Theories and Methods: A ContextualApproach, edited by P. G.
Boss, W. J. Doherty, R. LaRossa, W. R. Schumm, and S. K. Steinmetz. Plenum.
Spanier, G. B., and R. A. Lewis. (1980). "Marital quality: A Review of the Seventies." Journal
of Marriage and Family 42: 825-839.
Terman, L. M., Buttenwieser, P., Ferguson, L. W., Johnson, W. B., & Wilson, D. P. (1938).
Psychological factors in marital happiness. New York: McGraw-Hill.

28
Teachman, J. (2011). "Modeling Repeateable Events Using Discrete-Time Data: Predicting
Marital Dissolution." Journal of Marriage and Family 73: 525-540.
Turney, K., and M. J. Carlson. 2011. "Multipartnered Fertility and Depression among Fragile
Families." Journal of Marriage and Family 73: 570-587.
Vaillant, C. O., and G. E. Vaillant. 1993. "Is the U-Curve of Marital Satisfaction an Illusion? A
40-Year Study of Marriage." Journal of Marriage and the Family 55: 230-239.
VanLaningham, J., D. R. Johnson, and P. R. Amato. 2001. "Marital Happiness, Marital Duration,
and the U-Shaped Curve: Evidence from a Five-Wave Panel Study. Social Forces 78:
1313-1341.
White, L. K., & A. Booth. 1985. "The quality and stability of remarriages: The role of
stepchildren." American Sociological Review 50:689-698.
29
END NOTES
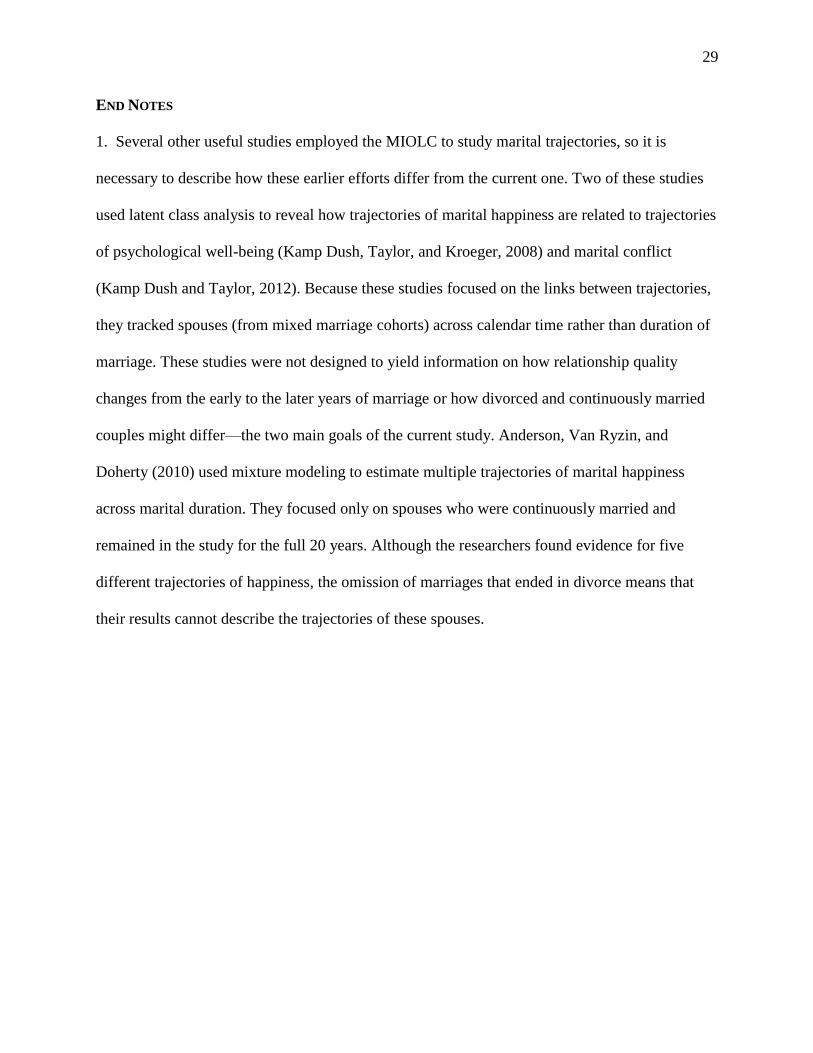
1. Several other useful studies employed the MIOLC to study marital trajectories, so it is
necessary to describe how these earlier efforts differ from the current one. Two of these studies
used latent class analysis to reveal how trajectories of marital happiness are related to trajectories
of psychological well-being (Kamp Dush, Taylor, and Kroeger, 2008) and marital conflict
(Kamp Dush and Taylor, 2012). Because these studies focused on the links between trajectories,
they tracked spouses (from mixed marriage cohorts) across calendar time rather than duration of
marriage. These studies were not designed to yield information on how relationship quality
changes from the early to the later years of marriage or how divorced and continuously married
couples might differ—the two main goals of the current study. Anderson, Van Ryzin, and
Doherty (2010) used mixture modeling to estimate multiple trajectories of marital happiness
across marital duration. They focused only on spouses who were continuously married and
remained in the study for the full 20 years. Although the researchers found evidence for five
different trajectories of happiness, the omission of marriages that ended in divorce means that
their results cannot describe the trajectories of these spouses.

30
Table 1. Random Effects Regression of Spousal Relationship Characteristics on Marital Duration.
________________________________________________________________________________________
Marital Happiness Shared Activities Marital Discord
________________________________________________________________________________________
Model 1 Model 2 Model 1 Model 2 Model 1 Model 2
Years married -.015*** -.006 -.027*** -.021*** -.013*** -.021***
(.004) (.004) (.004) (.004) (.004) (.004)
Years married2 .0003*** .0002* .001*** .001*** -.0001 -.0001
(.0001) (.0001) (.0001) (.0001) (.0001) (.0001)
Divorce -.710*** -.116 -.539*** -.182 .740*** .194*
(.057) (.100) (.054) (.100) (.058) (.098)
Divorce x years ----- -.048*** ----- -.035** ----- .054***
(.012) (.013) (.011)
Divorce x years2 ----- -.0001 ----- .0003 ----- -.0004
(.0004) (.0004) (.0004)
Female -.187*** -.196*** -.129** -.134** .149** .157***
(.044) (.044) (.041) (.041) (.045) (.045)
Remarried -.043 -.070 -.003 -.017 .010 .034
(.063) (.063) (.059) (.059) (.064) (.065)
College .044 .034 .029 -.034 -.006 .002
(.057) (.056) (.052) (.052) (.058) (.058)
1980 ----- ----- ----- ----- ----- -----
1983 -.187*** -.184*** -.166*** -.163*** .075** .072**
(.025) (.024) (.026) (.026) (.023) (.023)
1988 -.253*** -.257*** -.367*** -.367*** .150*** .152***
(.032) (.032) (.032) (.032) (.031) (.031)
1992 -.267*** -.291*** -.384*** -.393*** .239*** .256***
(.039) (.039) (.039) (.039) (.039) (.039)
1997 -.244*** -.291*** -.374*** -.395*** .143** .181***
(.049) (.049) (.048) (.048) (.049) (.049)
2000 .016 -.051 -1.160*** -1.190*** -.108 .033
(.056) (.057) (.055) (.055) (.056) (.057)
Attrition -.495* -.636** -.523* -.595** .453 .575*
(.233) (.232) (.218) (.218) (.238) (.238)
Constant .463*** .343*** .605 .539*** .083 .182**
(.058) (.059) (.056) (.057) (.059) (.060
R squared .056*** .101*** .105*** .107*** .110*** .110***
______________________________________________________________________________________

31
Note: Table values are unstandardized regression coefficients with standard errors in parentheses. Sample sizes
are 1,616-1,618 cases (6,618-6,705 observations), depending on the equation.
* p < .05. ** p < .01. *** p < .001 (two-tailed)

32
Table 2. Fixed Effects Regression of Spousal Relationship Characteristics on Marital Duration.
__________________________________________________________________________
Marital Happiness Shared Activities Discord
__________________________________________________________________________
Years married -.008 -.042*** .006
(.006) (.007) (.006)
Years married2 .0002* .0005*** -.0001
(.0001) (.0001) (.0001)
Divorce x years -.072*** -.040** .055***
(.013) (.014) (.013)
Divorce x years2 .0002 .0001 -.0002
(.0004) (.0004) (.0004)
1980 ----- ----- -----
1983 -.178*** -.102*** .064
(.027) (.030) (.026)
1988 -.237*** -.192*** -.046
(.047) (.050) (.044)
1992 -.280*** -.138 -.032
(.066) (.071) (.062)
1997 -.274** -.046 -.224**
(.091) (.098) (.088)
2000 -.048 -.689*** -.426***
(.107) (.115) (.101)
Constant .295*** .733*** -.066
(.070) (.076) (.067)
R squared .081*** .180*** .079***
_________________________________________________________________________
Note: Table values are unstandardized regression coefficients with standard errors in
parentheses. Sample sizes are 1,616-1,618 cases (6,618-6,705 observations), depending
on the equation.
* p < .05. ** p < .01. *** p < .001 (two-tailed)

33
Figure 1. Marital Happiness, Shared Activities, and Discord by Duration of Marriage in Years (Random
Effects Models)
34
Figure 2. Spousal Relationships by Divorce and Duration of Marriage in Years (Random Effects Models)

35
Figure 3. Spousal Relationships for Divorced and Continuously Married Wives and Husbands
(Random Effects Models)

36
Figure 4. Spousal Relationship Dimensions by Year of Survey (Random Effects Models)

37
Figure 5. Marital Happiness, Shared Activities, and Discord by Duration of Marriage in Years: Continuously
Married Spouses (Fixed Effects Models)