Embed Size (px)
Citation preview
Extractive Industries for Development Series #11October 2009
Changes in CO2 Emissions from Energy Use
A Multicountry
Decomposition
Analysis
Masami Kojima
Robert Bacon

World Bank Group’s Oil, Gas, and Mining Policy Division Oil, Gas, Mining, and Chemicals Department
A joint service of the World Bank and the International Finance Corporation
The Oil, Gas, and Mining Policy Division series publishes reviews and analyses of sec-tor experience from around the world as well as new findings from analytical work. It places particular emphasis on how the experience and knowledge gained relates to developing country policy makers, communities affected by extractive industries, extractive industry enterprises, and civil society organizations. We hope to see this series inform a wide range of interested parties on the opportunities as well as the risks presented by the sector.
The findings, interpretations, and conclusions expressed in this paper are entirely those of the authors and should not be attributed in any manner to the World Bank or its affiliated organizations, or to members of its Board of Executive Directors or the countries they represent. The World Bank does not guarantee the accuracy of the data included in this publication and accepts no responsibility whatsoever for any conse-quence of their use.
Copyright ©2009www.worldbank.org/ogmc (or /oil or /gas or /mining)www.ifc.org/ogmc (or /oil or /gas or /mining)Cover photos: Oil rig, hematite-banded ironstone, LNG tanker
Changes in CO2 Emissions from Energy Use
A Multicountry
Decomposition
Analysis
Masami KojimaRobert Bacon
World Bank | Oil, Gas, and Mining Policy Division Working Paper
Extractive Industries for Development Series #11October 2009

vExtractive Industries for Development Series
Contents
Acknowledgments vi
Abbreviations vii
ExecutiveSummary 1
1 Background 9
2 LevelsandIntensitiesofEmissions 11
3 Methodology 15Five-Factor Decomposition 15
Six-Factor Decomposition 17
Sectoral Decomposition 19
4 Results 21Five-Factor Decomposition 21
Six-Factor Decomposition 28
Sectoral Decomposition 28
5 Conclusions 33
AppendixesA Data Treatment 35
B Results for Five-Factor Decomposition 37
C Results for Six-Factor Decomposition 71
References 83
FiguresE.1 Decomposition Analysis of Global CO
2 Emissions 2
2.1 Top 20 Countries Ranked by Total CO2 Emissions in 2006 12
2.2 Top 20 CO2 Emitters Per Capita in 2006 12
2.3 Top 20 CO2 Emitters Per Unit of GDP in 2006 13
Changes in CO2 Emissions from Energy Usevi
2.4 CO2 Emissions Per Unit of GDP 14
3.1 Sensitivity of Offsetting Coefficient to gE/g
G 18
3.2 Comparison of Annual and Three-Year Average Data 19
4.1 Decomposition Analysis of Global CO2 Emissions 24
4.2 Decomposition Analysis of CO2 Emissions in China 25
4.3 Decomposition Analysis of CO2 Emissions in Russia 25
4.4 Sectoral Decomposition Analysis of Global CO2 Emissions,
1994–96 to 2004–06 29
4.5 Sectoral Decomposition Analysis of Global CO2 Emissions,
1994–96 to 1991–2001 29
4.6 Sectoral Decomposition Analysis of Global CO2 Emissions,
1999−2001 to 2004−06 30
4.7 Sectoral Decomposition Analysis of CO2 Emissions
in China, 1999−2001 to 2004−06 31
4.8 Sectoral Decomposition Analysis of CO2 Emissions
in India, 1994–96 to 2004–06 31
TablesE.1 Performance of Groups of Countries 4
E.2 Distribution of Offsetting Coefficients for the Full Period, by Country Category 5
4.1 Percentage of Countries with Positive Coefficients in Five-Factor Decomposition 21
4.2 Distribution of Offsetting Coefficients by Country Category 23
4.3 Performance of Countries by Category 26
4.4 Percentage of Countries with Positive Coefficients in Six-Factor Decomposition, Based on IEA Data 28
B.1 Decomposition Analysis between 1994–96 and 2004–06 Based on IEA Data 39
B.2 Decomposition Analysis between 1994−96 and 1999−2001 Based on IEA Data 43
B.3 Decomposition Analysis between 1999–2001 and 2004–06 Based on IEA Data 47
B.4 Decomposition Analysis between 1994−95 and 2004−06 Based on U.S. EIA Data 51
B.5 Decomposition Analysis between 1994−96 and 1999−2001 Based on U.S. EIA Data 56
viiExtractive Industries for Development Series
B.6 Decomposition Analysis between 1999−2001 and 2004−06 Based on U.S. EIA Data 61
B.7 Ratio of Offsetting Coefficients Calculated Using IEA and U.S. EIA Data 66
B.8 Percentage of Countries with Positive Coefficients in Five-Factor Decomposition Based on U.S. EIA Data 70
C.1 Six-Factor Decomposition Analysis between 1994−96 and 2004−06 Based on IEA Data 71
C.2 Six-Factor Decomposition Analysis between 1994−96 and 1999−2001 Based on IEA Data 75
C.3 Six-Factor Decomposition Analysis between 1999−2001 and 2004−06 Based on IEA Data 79
Changes in CO2 Emissions from Energy Useviii
Acknowledgments
This report was prepared by Masami Kojima and Robert Bacon of the Oil, Gas, and Mining Policy Division. The report benefited from help-ful comments provided by four peer reviewers: Carter Brandon of the China and Mongolia Sustainable Development Unit, Todd Johnson of the Latin American and the Caribbean Energy Unit, Kseniya Lvovsky of the Environment Department, and Dominique van der Mensbrugghe of the Development Prospects Group, all of the World Bank. Nita Congress edited and laid out the document, and Esther Petrilli-Massey of the Oil, Gas, and Mining Policy Division oversaw its production.
ixExtractive Industries for Development Series
Abbreviations
CO2 carbon dioxide
IEA International Energy AgencyOECD Organisation for Economic Co-operation and DevelopmentU.S. EIA U.S. Energy Information Administration
All tonnes are metric tonnes.
All monetary amounts are current U.S. dollars, unless otherwise specified.

1Extractive Industries for Development Series
ExecutiveSummary
The continued growth of global emissions of carbon dioxide (CO2) and
their likely adverse effects on global warming are focusing debate on the contribution of various countries to total emissions and the comparabil-ity of efforts across countries in mitigating these emissions. This paper examines recent trends in CO
2 emissions across countries at different lev-
els of development and asks what has been contributing to the growth of emissions as well as to their moderation.
The paper compares countries on their absolute levels of CO2 emis-
sions from energy use—more specifically, from the combustion of fos-sil fuels—as well as the levels of emissions per capita and per unit of gross domestic product (GDP). Countries’ performance ranges widely depending on the metric used, with significant differences even within each income group, underscoring multiple and complex drivers of CO
2
emissions. In absolute terms, the top 20 emitters accounted for nearly 80 percent of global emissions in 2006. Measured on a per capita basis, the top per capita emitter released ten times the global average. Half of the top 20 per capita emitters were major hydrocarbon producers. Some countries have seen their emissions intensity (CO
2 emissions per unit
of GDP) fall during the most recent decade for which data are available (1996–2006); others, including a few high-income countries, have seen intensity gradually increase. Globally, with the exception of 2003 and 2004, emissions intensity declined every year during the decade.
The paper applies a decomposition analysis, an accounting method-ology based on a log mean Divisia index, to analyze the change in CO
2
emissions over a decade. The methodology allows the change in emis-sions to be separated into changes in five factors:
• The carbon intensity of fossil fuels consumed• The share of fossil fuels in total energy used (fossil fuel intensity of
energy)• The energy required to produce a unit of GDP (energy intensity)• GDP per capita • Population
Changes in CO2 Emissions from Energy Use2
Because they are additive, the relative effects of these factors can be read-ily expressed and compared. To reduce fluctuations due to temporary jumps in annual data, the initial value was taken as the average for the period 1994–96, and the final value was taken as the average for 2004–06. The decade was split into two five-year subperiods to better capture changes within the decade. Data from the International Energy Agency (IEA) for CO
2 emissions and energy supply and consumption were
used to obtain the main findings. An alternative source of information on emissions and energy use, drawn from the U.S. Energy Information Administration (U.S. EIA), was used to provide supplementary informa-tion on a wider range of countries.
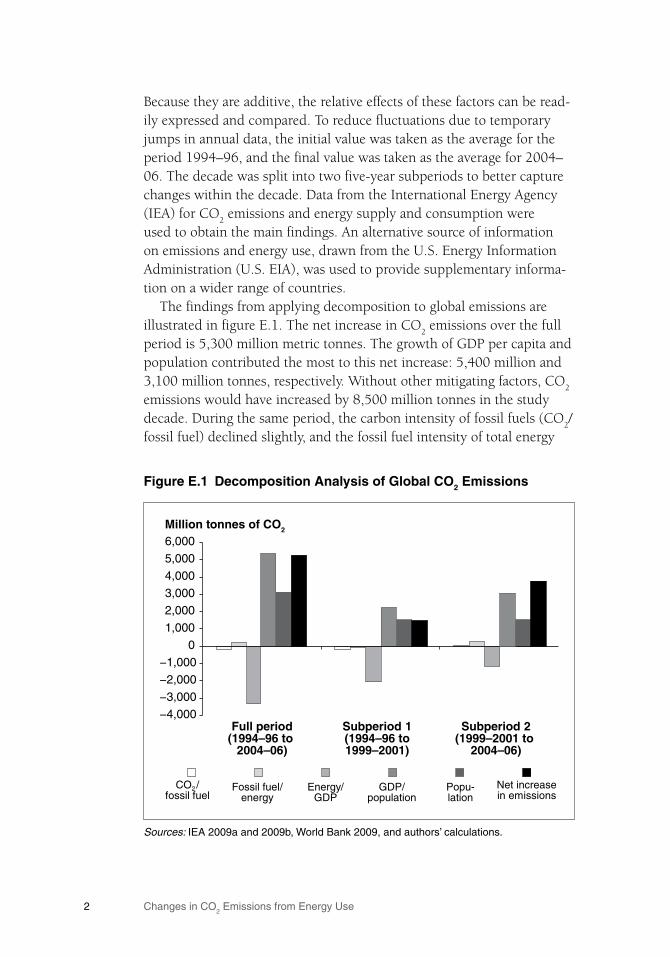
The findings from applying decomposition to global emissions are illustrated in figure E.1. The net increase in CO
2 emissions over the full
period is 5,300 million metric tonnes. The growth of GDP per capita and population contributed the most to this net increase: 5,400 million and 3,100 million tonnes, respectively. Without other mitigating factors, CO
2
emissions would have increased by 8,500 million tonnes in the study decade. During the same period, the carbon intensity of fossil fuels (CO
2/
fossil fuel) declined slightly, and the fossil fuel intensity of total energy
FigureE.1 DecompositionAnalysisofGlobalCO2Emissions
Sources: IEA 2009a and 2009b, World Bank 2009, and authors’ calculations.
−4,000
−3,000
−2,000
−1,000
0
1,000
2,000
3,000
4,000
5,000
6,000
Full period(1994–96 to
2004–06)
Subperiod 1(1994–96 to1999–2001)
Subperiod 2(1999–2001 to
2004–06)
Million tonnes of CO2
CO2 /fossil fuel
Fossil fuel/energy
Energy/GDP
GDP/population
Popu-lation
Net increasein emissions
3Extractive Industries for Development Series
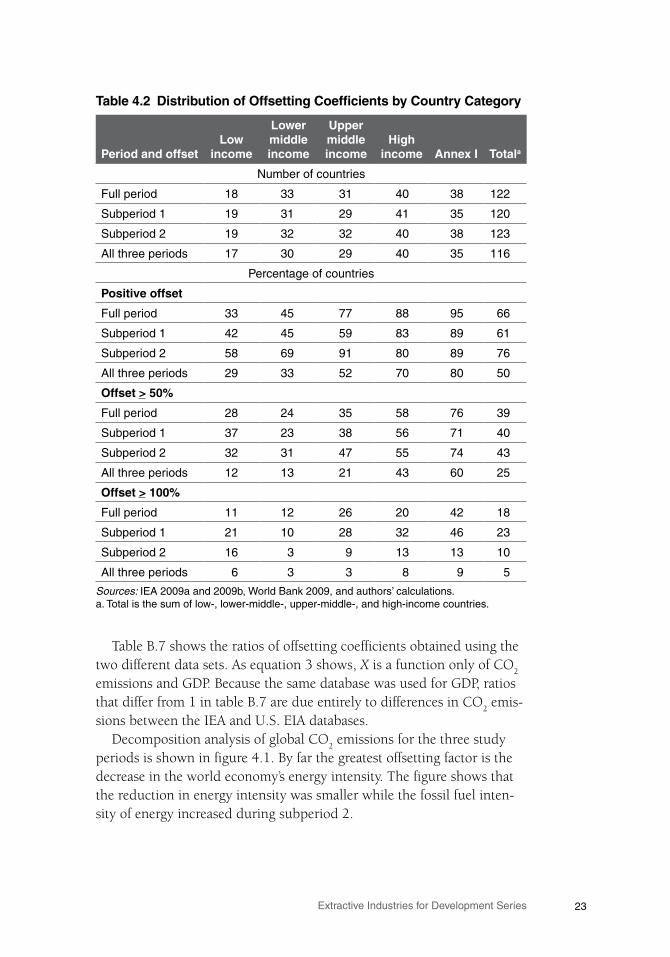
(fossil fuel/energy) increased slightly, contributing to a net increase of about 50 million tonnes between the two factors. Offsetting these was a marked reduction in energy intensity (energy/GDP), reducing emis-sions by 3,300 million tonnes. Analysis of the two subperiods shows that the increase in emissions due to growth in per capita GDP was almost entirely offset by the increase in energy intensity during the first subpe-riod (1994–96 to 1999–2001), while only a third was offset during the second subperiod (1999–2001 to 2004–06). The net increase in emis-sions in subperiod 2 was more than double that in subperiod 1.
The foregoing discussion suggests the concept of offsetting. Because most economies grow over time, everything else being equal, CO
2 emis-
sions would increase with economic growth. Where GDP growth (the sum of GDP/population and population in figure E.1) is positive, this study defines an offsetting coefficient: the ratio of the negative value of the sum of the changes in emissions of the three factors sensitive to energy policies—fossil fuel mix, fossil fuel share in total energy, and energy intensity—to the change in emissions related to GDP growth. The offsetting coefficient is positive if the three factors sensitive to energy policies move in a way that lowers the potential increase in emissions. Emissions and GDP are then said to be “decoupled” in accord with a framework developed by the Organisation for Economic Co-operation and Development (OECD). Under the OECD concept, relative decoupling occurs if the offsetting coefficient is positive but less than 100 percent, and absolute decoupling occurs if the coefficient is greater than 100 per-cent and the total emissions of the economy fall. A negative offsetting coefficient means that the combined effect of the three factors sensitive to energy policies is to amplify rather than mitigate the growth of CO
2 emis-
sions—for example, if energy intensity increases rather than declines.Globally, the offsetting coefficient was much higher in subperiod 1
than in subperiod 2 (table E.1). The first subperiod, however, had fea-tures peculiar to the 1990s: the transition economies were being restruc-tured and were disposing of unproductive capital, and their aggregate GDP increased at about half the global rate while their energy consump-tion fell. In fact, for several transition economies, including the Russian Federation, four of the five decomposition factors led to a fall in emis-sions in both subperiods; and only in subperiod 2 did total emissions increase. The table shows that the transition economies were able to off-set double the emissions increase from GDP growth during subperiod 1 but less than 100 percent during subperiod 2. If the transition economies are excluded from the data—on the reasoning that their performance in
Changes in CO2 Emissions from Energy Use4
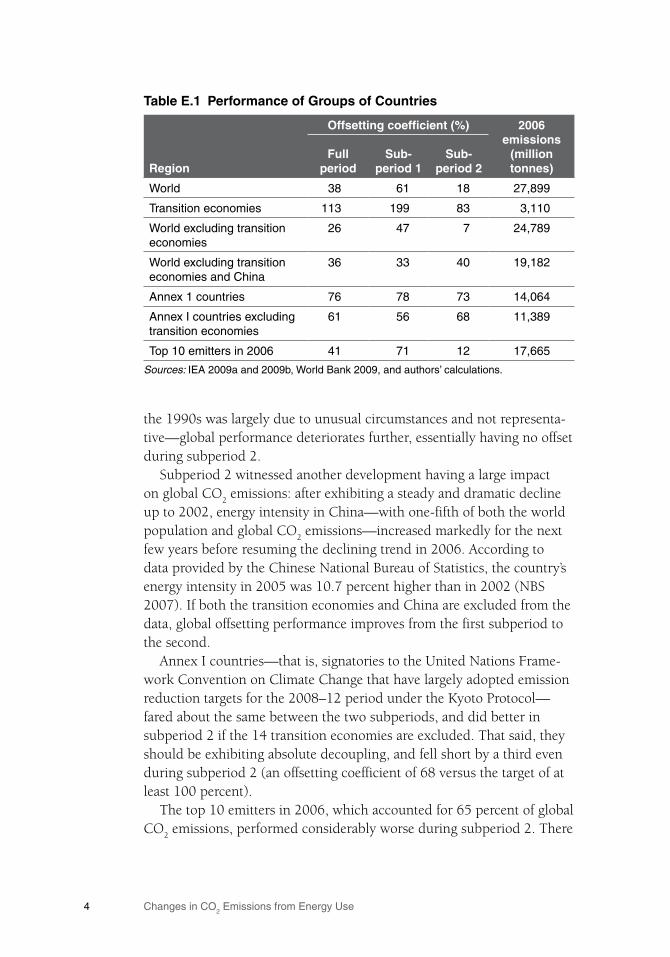
the 1990s was largely due to unusual circumstances and not representa-tive—global performance deteriorates further, essentially having no offset during subperiod 2.
Subperiod 2 witnessed another development having a large impact on global CO
2 emissions: after exhibiting a steady and dramatic decline
up to 2002, energy intensity in China—with one-fifth of both the world population and global CO
2 emissions—increased markedly for the next
few years before resuming the declining trend in 2006. According to data provided by the Chinese National Bureau of Statistics, the country’s energy intensity in 2005 was 10.7 percent higher than in 2002 (NBS 2007). If both the transition economies and China are excluded from the data, global offsetting performance improves from the first subperiod to the second.
Annex I countries—that is, signatories to the United Nations Frame-work Convention on Climate Change that have largely adopted emission reduction targets for the 2008–12 period under the Kyoto Protocol—fared about the same between the two subperiods, and did better in subperiod 2 if the 14 transition economies are excluded. That said, they should be exhibiting absolute decoupling, and fell short by a third even during subperiod 2 (an offsetting coefficient of 68 versus the target of at least 100 percent).
The top 10 emitters in 2006, which accounted for 65 percent of global CO
2 emissions, performed considerably worse during subperiod 2. There
TableE.1 PerformanceofGroupsofCountries
Region
Offsettingcoefficient(%) 2006emissions
(milliontonnes)
Fullperiod
Sub-period1
Sub-period2
World 38 61 18 27,899
Transition economies 113 199 83 3,110
World excluding transition economies
26 47 7 24,789
World excluding transition economies and China
36 33 40 19,182
Annex 1 countries 76 78 73 14,064
Annex I countries excluding transition economies
61 56 68 11,389
Top 10 emitters in 2006 41 71 12 17,665
Sources: IEA 2009a and 2009b, World Bank 2009, and authors’ calculations.
5Extractive Industries for Development Series
were marked differences in individual country performance, stages of development, and emissions per capita. Five out of 10 offset emissions from GDP growth more in the second subperiod than in the first, includ-ing three of the top five emitters. Among the five countries with per capita GDP at purchasing power parity within 11 percent of each other in 2006—Canada, Germany, Italy, Japan, and the United Kingdom—the offsetting coefficient for the full period ranged from 25 percent for Italy to 145 percent for Germany and averaged 74 percent. The United States—whose per capita GDP was one-third higher than the average of the next five richest countries (Canada, Germany, Italy, Japan, and the United Kingdom) and whose per capita emissions were twice that of the five-country average—fared worse, with an offsetting coefficient of 66 percent during the same period.
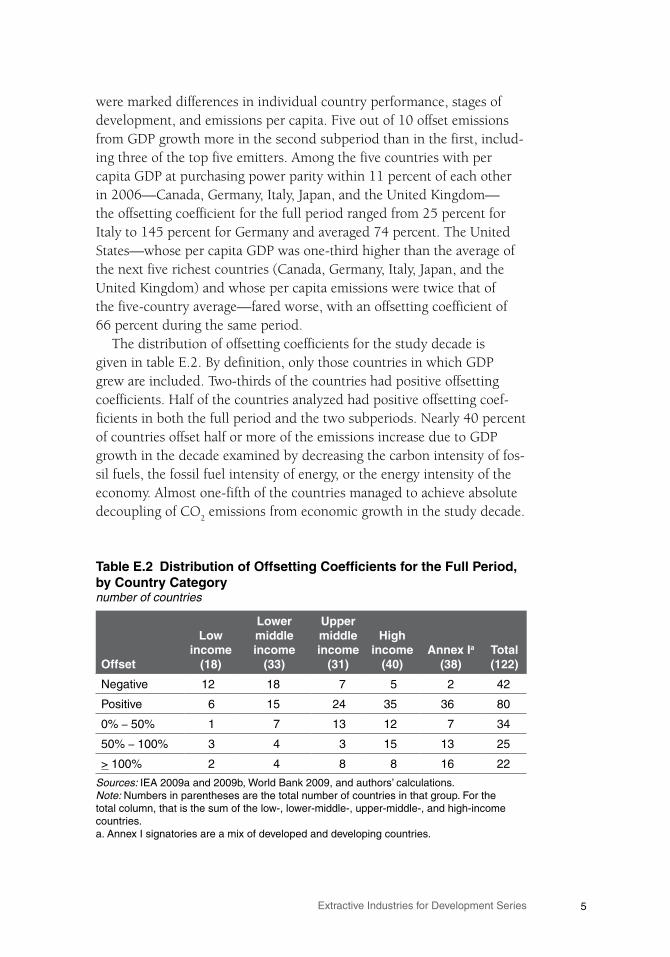
The distribution of offsetting coefficients for the study decade is given in table E.2. By definition, only those countries in which GDP grew are included. Two-thirds of the countries had positive offsetting coefficients. Half of the countries analyzed had positive offsetting coef-ficients in both the full period and the two subperiods. Nearly 40 percent of countries offset half or more of the emissions increase due to GDP growth in the decade examined by decreasing the carbon intensity of fos-sil fuels, the fossil fuel intensity of energy, or the energy intensity of the economy. Almost one-fifth of the countries managed to achieve absolute decoupling of CO
2 emissions from economic growth in the study decade.
TableE.2 DistributionofOffsettingCoefficientsfortheFullPeriod,byCountryCategorynumber of countries
Offset
Lowincome
(18)
Lowermiddleincome
(33)
Uppermiddleincome
(31)
Highincome
(40)AnnexIa
(38)Total
(122)
Negative 12 18 7 5 2 42
Positive 6 15 24 35 36 80
0% – 50% 1 7 13 12 7 34
50% – 100% 3 4 3 15 13 25
> 100% 2 4 8 8 16 22
Sources: IEA 2009a and 2009b, World Bank 2009, and authors’ calculations.Note: Numbers in parentheses are the total number of countries in that group. For the total column, that is the sum of the low-, lower-middle-, upper-middle-, and high-income countries.a. Annex I signatories are a mix of developed and developing countries.
Changes in CO2 Emissions from Energy Use6
By income, the percentage of countries with varying degrees of offset-ting tended to increase with rising income. The exceptionally strong per-formance of Annex I countries relative to high-income countries is due in part to the fact that 14 of 38 Annex I countries are transition economies: 12 of the 14 transition economies that are Annex I countries showed absolute decoupling. Although not shown in the table, a much higher percentage of countries across all categories showed absolute decoupling in subperiod 1 than in subperiod 2. For example, the share of Annex I countries with offsetting coefficients greater than 100 percent fell from 46 percent in subperiod 1 to 13 percent during subperiod 2.
Countries in the early stages of development tended to show less offsetting. In table E.2, the highest percentage of countries with a nega-tive offsetting coefficient were low income, and virtually none showed absolute decoupling. However, this finding must be taken in the context of their very low per capita emissions today. Many countries where per capita emissions are markedly below even the most stringent stabilization target levels considered by international bodies are extremely poor and would not be expected to follow a development path in which total emis-sions from energy use would decline or even stabilize in the near term. Different metrics of emissions in each country—absolute levels, emis-sions per capita, and emissions per unit of economic output—enter into discussions of the efforts each country should make as its contribution to slowing global warming. Spence (2009) proposes an approach to global emissions mitigation that takes into account a country’s current level of per capita emissions as well as its level of economic development. The recently proposed Greenhouse Rights Development framework details a similar approach and suggests a development threshold of welfare below which people should not be expected to share the costs of climate change mitigation (Baer and others 2008).
Several studies have used longer time periods to assess CO2 emissions
trajectories, such as the recently released E3G publication on the Group of 20 countries (Vivid Economics 2009). The present study points to unique circumstances resulting in a marked shift in trends around the beginning of this decade, with a slowdown of the decline in global emis-sions growth in the decade’s second half as compared to its first. Con-sequently, projecting emissions trends observed predominantly in the 1990s could be misleading, and the findings of such studies should be interpreted with caution.
The IEA database permits disaggregation of economywide emissions and energy consumption data by three sectors: (1) agriculture, fisheries,
7Extractive Industries for Development Series
and forestry (referred to as agriculture hereafter); (2) manufacturing and energy production (industry); and (3) the rest of the economy (service sector). Decomposition analysis by sector means that energy intensity can be separated into two factors, the first related to the effects of changes in sector levels of energy intensity (the energy required to produce a unit of sector GDP), and the second related to changes in sector share of total GDP.
Extended decomposition that includes the sector structure of GDP shows that, for the full period, the service sector’s share of global GDP increased at the expense of agriculture and industry. Because the service sector had a lower energy intensity than industry, although higher than that of agriculture, there was a small overall reduction in total use of energy for a given amount of GDP. At the same time, the service sector registered a significant reduction in energy intensity, contributing signifi-cantly to the offsetting effect, while the carbon intensity of fossil fuels and the fossil fuel share of energy analyzed at the sector level made minor contributions. Without the decrease in the energy intensity of the global service sector, the increase in total emissions would have been almost 50 percent higher. The industrial sector showed a drop in the carbon intensity of fossil fuels and the fossil fuel intensity of energy during sub-period 1, but this trend was reversed in subperiod 2.
The interpretation of findings here should be tempered by the fact that the IEA and U.S. EIA databases were not in agreement regarding the effects of the carbon intensity of fossil fuels; further, in developing coun-tries, moving households to modern forms of energy may entail increas-ing, rather than decreasing, the fossil fuel intensity of energy. This paper nonetheless suggests that these two factors make minor contributions, and that understanding the role of changing energy intensity is key to understanding changes in CO
2 emissions. The study points to the need
for further work on end-use energy intensity as well as energy supply intensity and drivers of changes at the sectoral level.

9Extractive Industries for Development Series
Chapter1
Background
Increasing evidence on the extent and effects of global warming, coupled with ongoing negotiations on policies to mitigate its effects, is focus-ing attention on the major contribution made by CO
2 emissions. Most
industrialized countries have committed to reducing their CO2 emissions
below 1990 levels by 2012 and are expected to reduce absolute levels of emissions significantly further by 2020. Many developing countries are expected to moderate their growth of emissions compared to country-specific business-as-usual trajectories.
It is generally accepted that emissions tend to grow with an economy’s level of income unless policies are undertaken to decouple the two. Anal-ysis of the extent to which different countries have or have not managed to curb the growth of CO
2 emissions relative to their economic growth
in the recent past can provide insights on future potential changes. It can also identify countries from which successful lessons might be gleaned.
Decomposition analysis enables detailed accounting for changes in emissions. Factors relating to the mix of fossil fuels, the share of fossil fuels in total energy consumption, the energy required to produce a unit of GDP, GDP per capita, and population can be brought together in a framework that allows the contribution of changes in each factor to be related to changes in total emissions.
Many studies have used decomposition analysis of emissions for selected groups of countries. Bacon and Bhattacharya (2007) briefly reviewed a number of these studies and provided a decomposition of CO
2 emissions from the energy sector for the 70 countries with the great-
est level of emissions. Their analysis was based on the change in emis-sions between 1994 and 2004. Bosch (2009) analyzed the decomposition of CO
2 emissions from the world’s top emitting countries for the period
1971 to 2005.The present study extends the 2007 publication in a number of direc-
tions. It updates the earlier study by adding data for 2005 and 2006, and provides results based on emissions and energy data from the Interna-tional Energy Agency for 123 countries. For a limited group of countries,
Changes in CO2 Emissions from Energy Use10
the study extends the decomposition analysis further by adding a factor relating to changes in the sectoral composition of GDP based on a divi-sion of the economy into agriculture, fisheries, and forestry; industry including energy production; and the rest of the economy.
Bacon and Bhattacharya (2007) used data provided by the U.S. Energy Information Administration because of its wider coverage. However, the U.S. EIA database does not allow disaggregation into the three sectors. Aside from differences in the numerical values of the data themselves, an important difference between the U.S. EIA and IEA databases is that the former excludes biomass from the primary energy supply except where biomass is used in power generation, while the latter includes biomass consumed outside the power sector. The IEA approach provides more comprehensive coverage of energy consumption in developing countries where biomass use, particularly by low-income households, can be wide-spread. Decomposition results based on U.S. EIA data are provided in the second half of appendix B.
The results of the current and 2007 studies are not strictly comparable for several reasons:
1. The beginning and end data points for the change in emissions are based on three-year averages in the present study (as opposed to single years in the previous report) in order to moderate the effect of temporary and unrepresentative jumps in the data series.
2. As noted, the data source used here is primarily the IEA, rather than the U.S. EIA as used in the earlier study. Although supple-mentary calculations based on the U.S. EIA are included in appendix B, these cannot be directly compared to the 2007 study because of revisions to earlier years’ data that have subsequently been made by the U.S. EIA. Further—and again, as noted above—the IEA, but not the U.S. EIA, includes biomass utilization outside the power sector, which is important in lower-income developing countries.
3. The IEA data format makes it possible to extend the analysis to shifts among three major sectors. Sectoral differences in the relative importance of the decomposition factors enable a more focused understanding of where changes in the pattern of emis-sions have been occurring.
11Extractive Industries for Development Series
Chapter2
LevelsandIntensitiesofEmissions
Different metrics of emissions in each country—the absolute level, emis-sions per capita, and emissions per unit of economic output—enter into discussions of the efforts each country should make as its contribution to slowing global warming. These metrics are briefly discussed here.
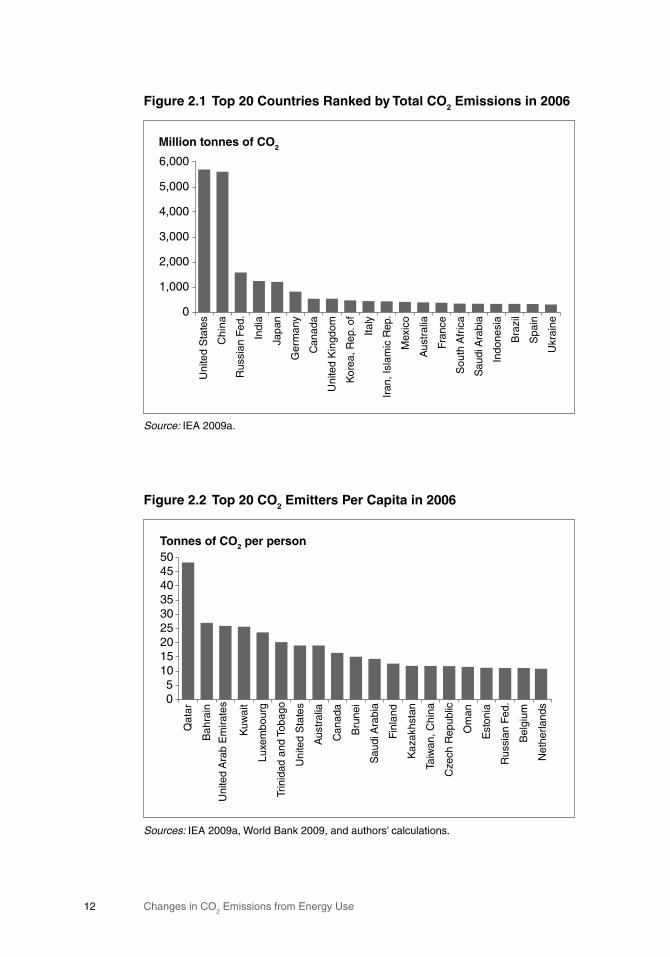
The top 20 countries in terms of CO2 emissions from fossil fuel
combustion accounted for 78 percent of global emissions in 2006 (fig-ure 2.1).1 The United States and China alone accounted for two-fifths of these emissions. Averaged across the world, CO
2 emissions amounted to
4.3 tonnes per person, an increase from 3.8 tonnes in 1994. The 2006 per capita level of CO
2 emissions is about twice as high as the level cur-
rently estimated by experts (approximately 2 tonnes) for stabilizing atmospheric concentrations of CO
2 at 400 parts per million and green-
house gas concentrations at 490 parts per million (IPCC 2007). The top per capita emitter released 10 times the global average (figure 2.2); half of the top 20 emitters on a per capita basis are major hydrocarbon pro-ducers.
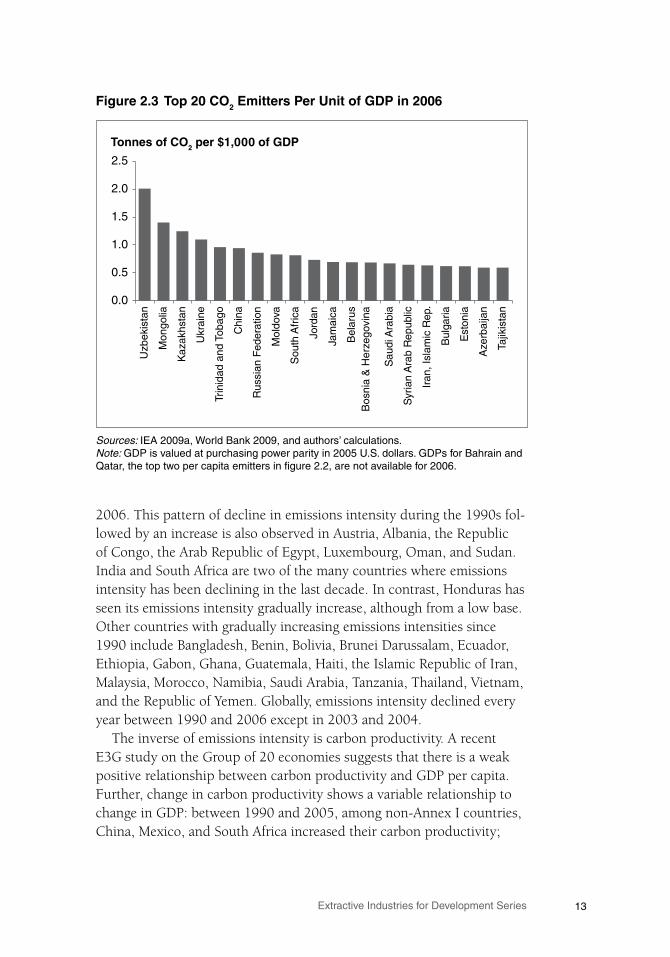
Figure 2.3 shows 20 economies that are most CO2-intensive for a unit
of GPD. GDP is measured at purchasing power parity. Among the coun-tries are low-income net importers of fossil fuels, suggesting that reduc-ing the CO
2 intensity of such economies could result in both global and
local benefits in terms of improved energy security and balance of pay-ments (Bacon and Kojima 2008).
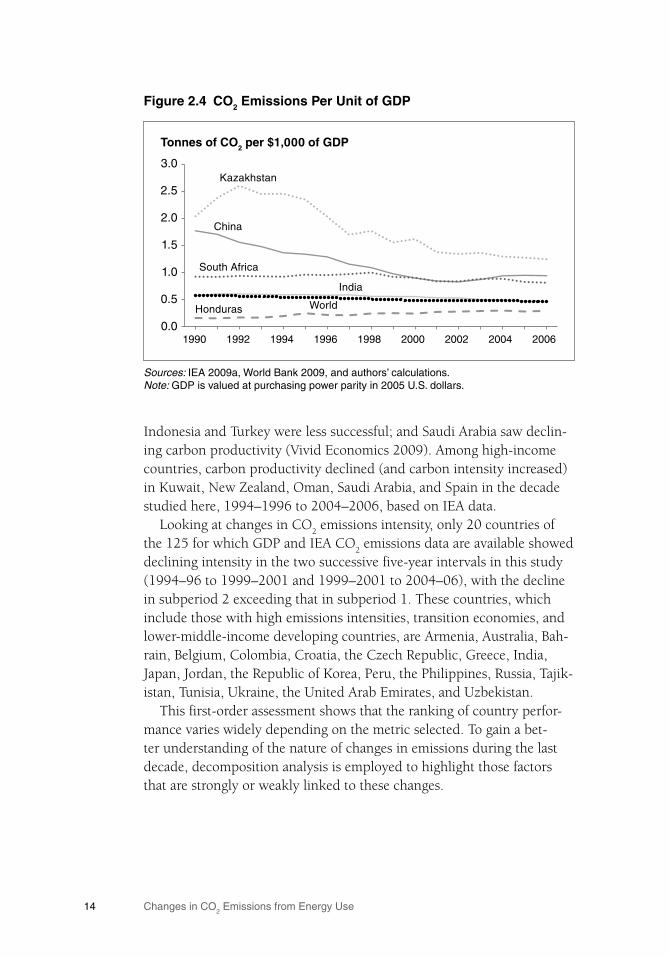
Declines in emissions intensities as measured by GDP have followed a variety of trends in recent years. A few examples are shown in figure 2.4. Kazakhstan is typical of former Soviet Union republics, where the inten-sity of emissions fell rapidly in the 1990s. China’s intensity fell until the early part of this decade and then rose somewhat, resulting in essentially no net reduction in the country’s energy intensity between 2000 and
1As discussed here, CO2 emissions exclude those from land use changes.
Changes in CO2 Emissions from Energy Use12
Figure2.2Top20CO2EmittersPerCapitain2006
Sources: IEA 2009a, World Bank 2009, and authors’ calculations.
Tonnes of CO2 per person
05
101520253035404550
Qat
ar
Bah
rain
Uni
ted
Ara
b E
mira
tes
Kuw
ait
Luxe
mbo
urg
Trin
idad
and
Tob
ago
Uni
ted
Sta
tes
Aus
tral
ia
Can
ada
Bru
nei
Sau
di A
rabi
a
Fin
land
Kaz
akhs
tan
Taiw
an, C
hina
Cze
ch R
epub
lic
Om
an
Est
onia
Rus
sian
Fed
.
Bel
gium
Net
herla
nds
Figure2.1Top20CountriesRankedbyTotalCO2Emissionsin2006
Source: IEA 2009a.
Million tonnes of CO2
0
1,000
2,000
3,000
4,000
5,000
6,000
Uni
ted
Sta
tes
Chi
na
Rus
sian
Fed
.
Indi
a
Japa
n
Ger
man
y
Can
ada
Uni
ted
Kin
gdom
Kor
ea, R
ep. o
f
Italy
Iran
, Isl
amic
Rep
.
Mex
ico
Aus
tral
ia
Fran
ce
Sou
th A
fric
a
Sau
di A
rabi
a
Indo
nesi
a
Bra
zil
Spa
in
Ukr
aine
13Extractive Industries for Development Series
2006. This pattern of decline in emissions intensity during the 1990s fol-lowed by an increase is also observed in Austria, Albania, the Republic of Congo, the Arab Republic of Egypt, Luxembourg, Oman, and Sudan. India and South Africa are two of the many countries where emissions intensity has been declining in the last decade. In contrast, Honduras has seen its emissions intensity gradually increase, although from a low base. Other countries with gradually increasing emissions intensities since 1990 include Bangladesh, Benin, Bolivia, Brunei Darussalam, Ecuador, Ethiopia, Gabon, Ghana, Guatemala, Haiti, the Islamic Republic of Iran, Malaysia, Morocco, Namibia, Saudi Arabia, Tanzania, Thailand, Vietnam, and the Republic of Yemen. Globally, emissions intensity declined every year between 1990 and 2006 except in 2003 and 2004.
The inverse of emissions intensity is carbon productivity. A recent E3G study on the Group of 20 economies suggests that there is a weak positive relationship between carbon productivity and GDP per capita. Further, change in carbon productivity shows a variable relationship to change in GDP: between 1990 and 2005, among non-Annex I countries, China, Mexico, and South Africa increased their carbon productivity;
Figure2.3Top20CO2EmittersPerUnitofGDPin2006
Sources: IEA 2009a, World Bank 2009, and authors’ calculations.Note: GDP is valued at purchasing power parity in 2005 U.S. dollars. GDPs for Bahrain and Qatar, the top two per capita emitters in figure 2.2, are not available for 2006.
Tonnes of CO2 per $1,000 of GDP
0.0
0.5
1.0
1.5
2.0
2.5
Uzb
ekis
tan
Mon
golia
Kaz
akhs
tan
Ukr
aine
Trin
idad
and
Tob
ago
Chi
na
Rus
sian
Fed
erat
ion
Mol
dova
Sou
th A
fric
a
Jord
an
Jam
aica
Bel
arus
Bos
nia
& H
erze
govi
na
Sau
di A
rabi
a
Syr
ian
Ara
b R
epub
lic
Iran
, Isl
amic
Rep
.
Bul
garia
Est
onia
Aze
rbai
jan
Tajik
ista
n
Changes in CO2 Emissions from Energy Use14
Figure2.4 CO2EmissionsPerUnitofGDP
Sources: IEA 2009a, World Bank 2009, and authors’ calculations.Note: GDP is valued at purchasing power parity in 2005 U.S. dollars.
Tonnes of CO2 per $1,000 of GDP
0.0
0.5
1.0
1.5
2.0
2.5
3.0
1990 1992 1994 1996 1998 2000 2002 2004 2006
Kazakhstan
China
South Africa
India
WorldHonduras
Indonesia and Turkey were less successful; and Saudi Arabia saw declin-ing carbon productivity (Vivid Economics 2009). Among high-income countries, carbon productivity declined (and carbon intensity increased) in Kuwait, New Zealand, Oman, Saudi Arabia, and Spain in the decade studied here, 1994–1996 to 2004–2006, based on IEA data.
Looking at changes in CO2 emissions intensity, only 20 countries of
the 125 for which GDP and IEA CO2 emissions data are available showed
declining intensity in the two successive five-year intervals in this study (1994–96 to 1999–2001 and 1999–2001 to 2004–06), with the decline in subperiod 2 exceeding that in subperiod 1. These countries, which include those with high emissions intensities, transition economies, and lower-middle-income developing countries, are Armenia, Australia, Bah-rain, Belgium, Colombia, Croatia, the Czech Republic, Greece, India, Japan, Jordan, the Republic of Korea, Peru, the Philippines, Russia, Tajik-istan, Tunisia, Ukraine, the United Arab Emirates, and Uzbekistan.
This first-order assessment shows that the ranking of country perfor-mance varies widely depending on the metric selected. To gain a bet-ter understanding of the nature of changes in emissions during the last decade, decomposition analysis is employed to highlight those factors that are strongly or weakly linked to these changes.
15Extractive Industries for Development Series
Chapter3
Methodology
CO2 emissions can be broken down into several contributing factors
using a Kaya-type identity (Kaya 1990).
Five-FactorDecompositionFollowing Bacon and Bhattacharya (2007), this study expresses emis-sions as follows:
Ei (E
i /FF
i) × (FF
i /TE
i) × (TE
i /GDP
i) × (GDP
i /POP
i) × (POP
i)
Ci × S
i × I
i × G
i × P
i
where
Ei is the amount of CO
2 emitted from fossil fuels in a year in country i,
FFi is the amount of fossil fuel consumed,
TEi is the total primary energy supply for domestic consumption,
GDPi is gross domestic product,
POPi is population.
The change in a country’s emissions (Ei) between two time periods, 0
and 1, can be written according to identity 1. The identity at time 0 can be written in the compact form
E(0) C(0) × S(0) × I(0) × G(0) × P(0)
and similarly for time 1. The change in the emissions between the two periods can be related to the sum of effects linked to changes in each of the factors: the carbon intensity of fossil fuels (C
eff), the fossil fuel share
in energy (Seff
), the energy intensity of the economy (Ieff
), GDP per capita (G
eff), and total population (P
eff):
Ei E(1) − E(0) C
eff + S
eff + I
eff + G
eff + P
eff.
These changes can be precisely linked in an additive form using decomposition analysis (Ang 2004; Bacon and Bhattacharya 2007). More
(1)
(2)
Changes in CO2 Emissions from Energy Use16
specifically, the effects can be calculated using the logarithmic mean Divisia index:
Ceff
= {[E(1) − E(0)]/log[E(1)/E(0)]} × log[C(1)/C(0)].
Using the decomposition method, the carbon intensity effect (Ceff
) identifies what would have been the change in CO
2 emissions if the fossil
fuel mix had changed but all other factors had remained constant. Other effects are calculated similarly, allowing a one-at-a-time identification of the impact of changes in each factor in identity 1. The particular form of decomposition used allows the effects to be added so as to equal the total change in CO
2 emissions. In the absence of an additive decomposition,
the relative importance of the different changes that contribute to the total change in emissions would be difficult to evaluate.
The years selected for decomposition for times 0, 1, and 2 in this study are 1994−96, 1999−2001, and 2004−06. The full period is between 1994−96 and 2004−06, the first subperiod is between 1994−96 and 1999−2001, and the second subperiod is between 1999−2001 and 2004−06.
The set of variables from which identity 2 is constructed contains two factors that increase over time for most countries—income per capita and total population—and three others that can be decreased: the carbon intensity of fossil fuels (highest for coal and lowest for natural gas), the fossil fuel intensity of total energy consumption (which can be decreased by shifting to renewable and nuclear energy), and the energy intensity of an economy (which can be decreased through energy conservation, energy efficiency improvement, and structural changes in the economy). Following Bacon and Bhattacharya (2007), the extent to which net decreases in C
eff, S
eff, and I
eff offset net increases in G
eff and P
eff is termed
the offsetting coefficient:
Offsetting coefficient X = − (Ceff
+ Seff
+ Ieff
)/(Geff
+ Peff
).
In this study, X is defined only if Geff
+ Peff
is positive. Combining terms to correspond to the offsetting definition, a shortened version of iden-tity 1 can be written as
Ei (E
i /GDP
i) × (GDP
i).
Offsetting is then equal to
X = −log{[E(1)/GDP(1)]/[E(0)/GDP(0)]}/log[GDP(1)/GDP(0)]
(3)
(4)
17Extractive Industries for Development Series
For small changes in emissions and GDP, equation 3 can be simplified to
X = 1 − gE/g
G
where gE represents the rate of growth of emissions and g
G the rate of
growth of GDP. The right-hand side of equation 4 in turn is equal to 1 minus the elasticity of emissions with respect to GDP.
The offsetting coefficient has also been termed the decoupling index (Diakoulaki and Mandaraka 2007). By this concept, strong decoupling exists if total emissions fall while GDP increases (that is, offsetting is more than 100 percent); if emissions rise less than GDP (offsetting is positive but less than 100 percent), decoupling is termed weak. This classification is consistent with that of the OECD (2002), focusing on movements in the ratio of emissions to GDP; the OECD termed the two cases absolute and relative decoupling, respectively.
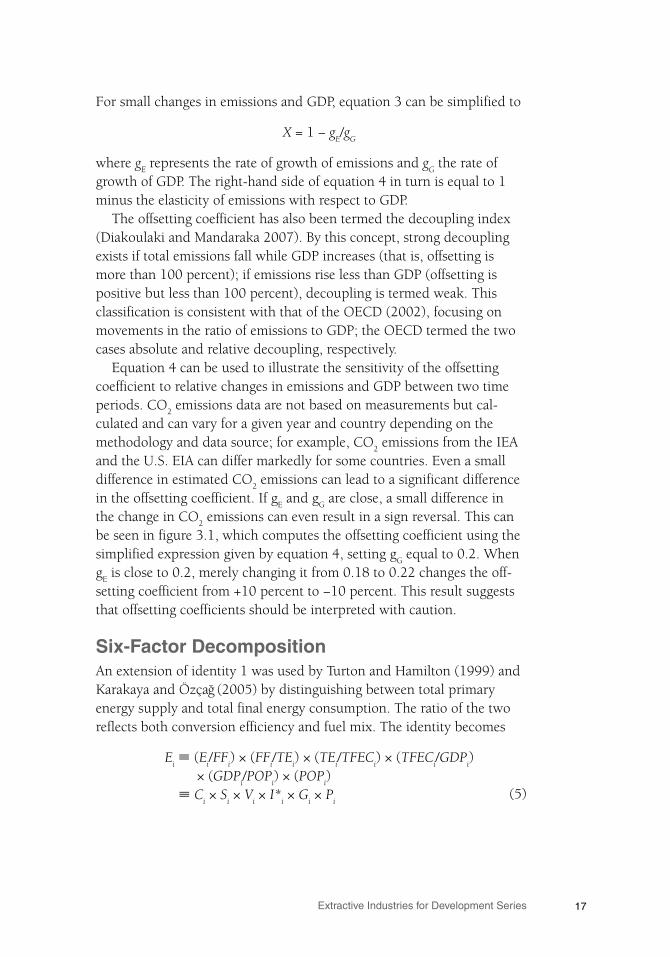
Equation 4 can be used to illustrate the sensitivity of the offsetting coefficient to relative changes in emissions and GDP between two time periods. CO
2 emissions data are not based on measurements but cal-
culated and can vary for a given year and country depending on the methodology and data source; for example, CO
2 emissions from the IEA
and the U.S. EIA can differ markedly for some countries. Even a small difference in estimated CO
2 emissions can lead to a significant difference
in the offsetting coefficient. If gE and g
G are close, a small difference in
the change in CO2 emissions can even result in a sign reversal. This can
be seen in figure 3.1, which computes the offsetting coefficient using the simplified expression given by equation 4, setting g
G equal to 0.2. When
gE is close to 0.2, merely changing it from 0.18 to 0.22 changes the off-
setting coefficient from +10 percent to −10 percent. This result suggests that offsetting coefficients should be interpreted with caution.
Six-FactorDecompositionAn extension of identity 1 was used by Turton and Hamilton (1999) and Karakaya and Özça ̌g (2005) by distinguishing between total primary energy supply and total final energy consumption. The ratio of the two reflects both conversion efficiency and fuel mix. The identity becomes
Ei (E
i/FF
i) × (FF
i/TE
i) × (TE
i/TFEC
i) × (TFEC
i/GDP
i)
× (GDPi/POP
i) × (POP
i)
Ci × S
i × V
i × I*
i × G
i × P
i(5)
Changes in CO2 Emissions from Energy Use18
where TFECi is the amount of total final energy consumption. Energy
intensity in identity 5 is defined with respect to total final energy con-sumed rather than total primary energy. The equivalent for identity 2 becomes
E Ceff
+ Seff
+ Veff
+I*eff
+ Heff
+ Geff
+ Peff
..
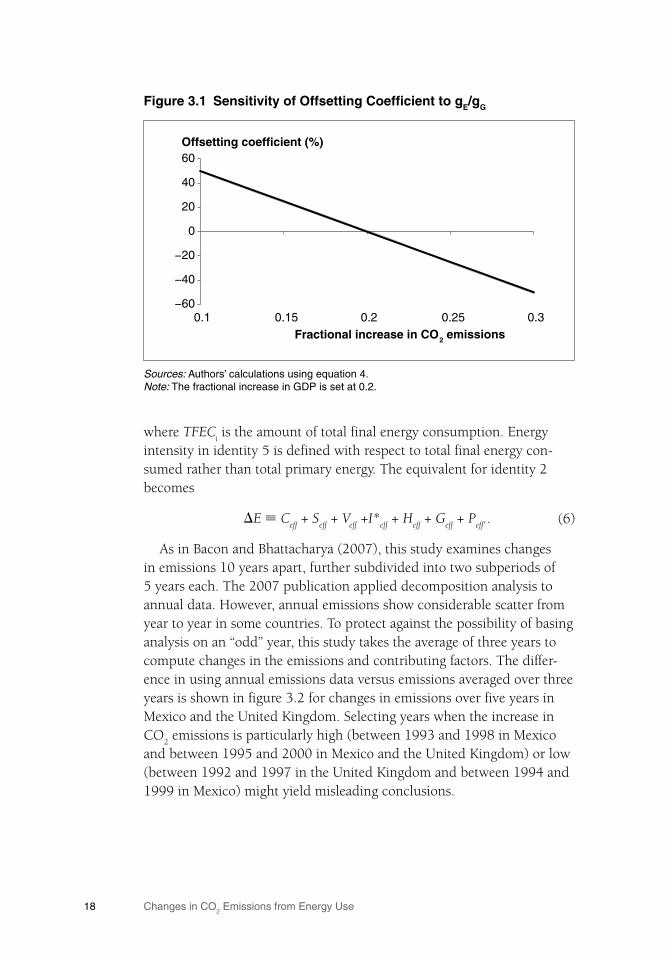
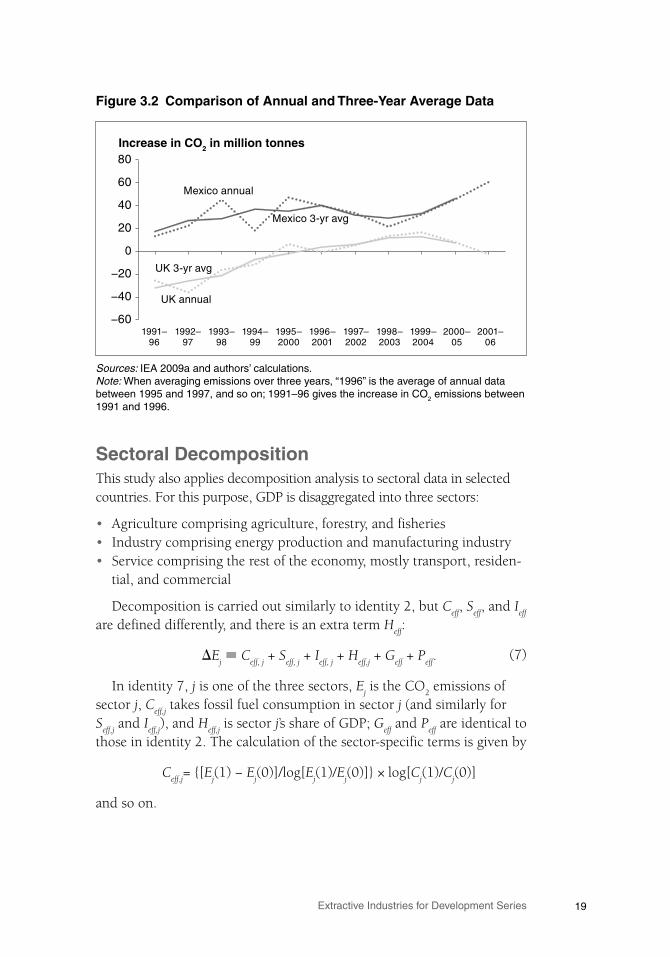
As in Bacon and Bhattacharya (2007), this study examines changes in emissions 10 years apart, further subdivided into two subperiods of 5 years each. The 2007 publication applied decomposition analysis to annual data. However, annual emissions show considerable scatter from year to year in some countries. To protect against the possibility of basing analysis on an “odd” year, this study takes the average of three years to compute changes in the emissions and contributing factors. The differ-ence in using annual emissions data versus emissions averaged over three years is shown in figure 3.2 for changes in emissions over five years in Mexico and the United Kingdom. Selecting years when the increase in CO
2 emissions is particularly high (between 1993 and 1998 in Mexico
and between 1995 and 2000 in Mexico and the United Kingdom) or low (between 1992 and 1997 in the United Kingdom and between 1994 and 1999 in Mexico) might yield misleading conclusions.
(6)
Figure3.1 SensitivityofOffsettingCoefficienttogE/gG
Sources: Authors’ calculations using equation 4.Note: The fractional increase in GDP is set at 0.2.
−60
−40
−20
0
20
40
60
0.1 0.15 0.2 0.25 0.3Fractional increase in CO2 emissions
Offsetting coefficient (%)
19Extractive Industries for Development Series
Figure3.2 ComparisonofAnnualandThree-YearAverageData
Sources: IEA 2009a and authors’ calculations.Note: When averaging emissions over three years, “1996” is the average of annual data between 1995 and 1997, and so on; 1991–96 gives the increase in CO2 emissions between 1991 and 1996.
Increase in CO2 in million tonnes
−60
−40
−20
0
20
40
60
80
1991–96
1993–98
1995–2000
1997–2002
1999–2004
2001–06
Mexico annual
Mexico 3-yr avg
UK annual
UK 3-yr avg
1992–97
2000–05
1998–2003
1996–2001
1994–99
SectoralDecompositionThis study also applies decomposition analysis to sectoral data in selected countries. For this purpose, GDP is disaggregated into three sectors:
• Agriculture comprising agriculture, forestry, and fisheries• Industry comprising energy production and manufacturing industry• Service comprising the rest of the economy, mostly transport, residen-
tial, and commercial
Decomposition is carried out similarly to identity 2, but Ceff
, Seff
, and Ieff
are defined differently, and there is an extra term H
eff:
Ej C
eff, j + S
eff, j + I
eff, j + H
eff,j + G
eff + P
eff.
In identity 7, j is one of the three sectors, Ej is the CO
2 emissions of
sector j, Ceff,j
takes fossil fuel consumption in sector j (and similarly for S
eff,j and I
eff,j), and H
eff,j is sector j’s share of GDP; G
eff and P
eff are identical to
those in identity 2. The calculation of the sector-specific terms is given by
Ceff,j
= {[Ej(1) − E
j(0)]/log[E
j(1)/E
j(0)]} × log[C
j(1)/C
j(0)]
and so on.
(7)
Changes in CO2 Emissions from Energy Use20
This form of the identity adds more detail by analyzing, sector by sec-tor, changes in emissions due to changes in fossil fuel mix and changes in share of fossil fuels in total energy. In addition, changes in aggregate energy intensity of GDP are replaced by changes in energy intensity for each sector and by changes in the sector shares in aggregated GDP. For example, if services as a whole are less energy intensive than industry—as is the case globally—then a shift in the composition of GDP toward services and away from industry would tend to decrease total emissions, even if the energy intensity of each sector remained unchanged.
See appendix A for more information on the data used and their han-dling.
21Extractive Industries for Development Series
Chapter4
Results
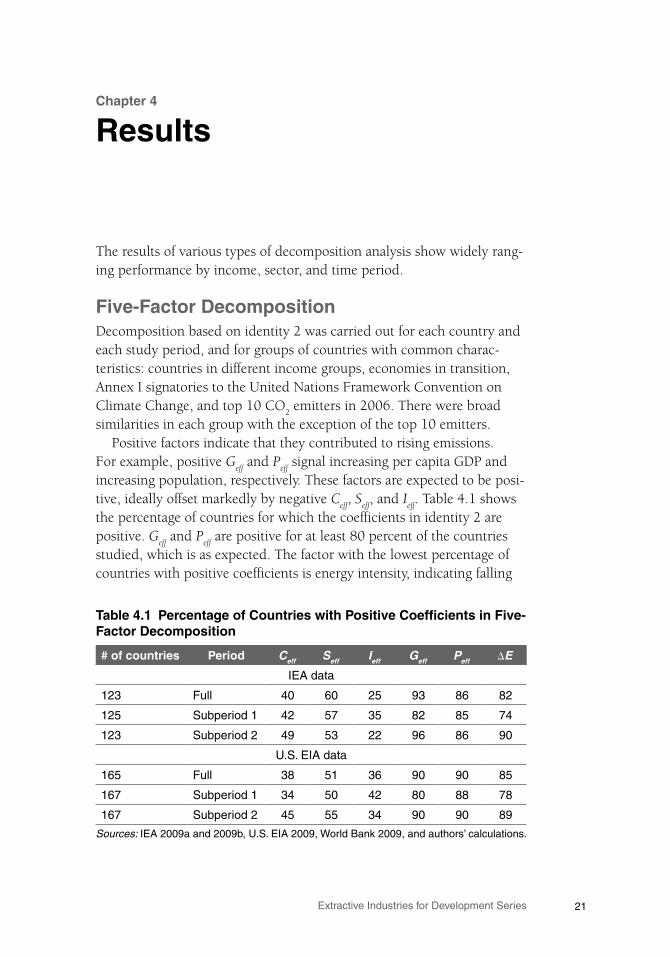
The results of various types of decomposition analysis show widely rang-ing performance by income, sector, and time period.
Five-FactorDecompositionDecomposition based on identity 2 was carried out for each country and each study period, and for groups of countries with common charac-teristics: countries in different income groups, economies in transition, Annex I signatories to the United Nations Framework Convention on Climate Change, and top 10 CO
2 emitters in 2006. There were broad
similarities in each group with the exception of the top 10 emitters. Positive factors indicate that they contributed to rising emissions.
For example, positive Geff
and Peff
signal increasing per capita GDP and increasing population, respectively. These factors are expected to be posi-tive, ideally offset markedly by negative C
eff, S
eff, and I
eff. Table 4.1 shows
the percentage of countries for which the coefficients in identity 2 are positive. G
eff and P
eff are positive for at least 80 percent of the countries
studied, which is as expected. The factor with the lowest percentage of countries with positive coefficients is energy intensity, indicating falling
Table4.1 PercentageofCountrieswithPositiveCoefficientsinFive-FactorDecomposition
#ofcountries Period Ceff Seff Ieff Geff Peff E
IEA data
123 Full 40 60 25 93 86 82
125 Subperiod 1 42 57 35 82 85 74
123 Subperiod 2 49 53 22 96 86 90
U.S. EIA data
165 Full 38 51 36 90 90 85
167 Subperiod 1 34 50 42 80 88 78
167 Subperiod 2 45 55 34 90 90 89
Sources: IEA 2009a and 2009b, U.S. EIA 2009, World Bank 2009, and authors’ calculations.
Changes in CO2 Emissions from Energy Use22
energy intensity in two-thirds or more of the countries studied. Fossil fuel intensity, in contrast, increased for more than half the countries. A contributing factor to this increase in developing countries is declining traditional use of biomass, which is, nonetheless, a positive move for a variety of reasons: traditional biomass typically causes health-harming indoor air pollution, all too often requires hours of manual collection, and can lead to declining forest cover. The carbon intensity of fossil fuels declined in more than 50 percent of the countries in each of the study periods.
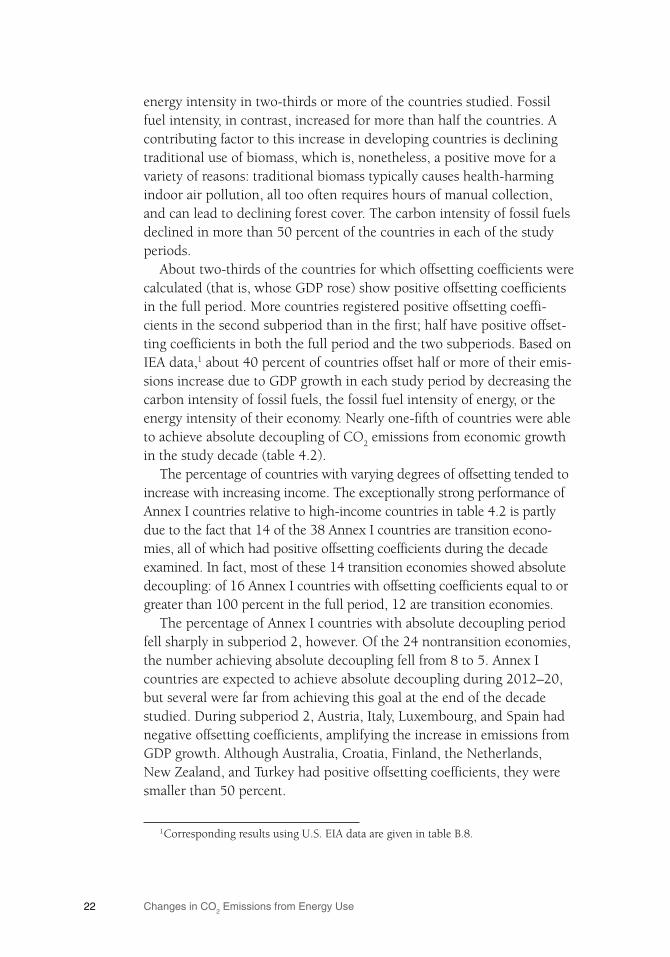
About two-thirds of the countries for which offsetting coefficients were calculated (that is, whose GDP rose) show positive offsetting coefficients in the full period. More countries registered positive offsetting coeffi-cients in the second subperiod than in the first; half have positive offset-ting coefficients in both the full period and the two subperiods. Based on IEA data,1 about 40 percent of countries offset half or more of their emis-sions increase due to GDP growth in each study period by decreasing the carbon intensity of fossil fuels, the fossil fuel intensity of energy, or the energy intensity of their economy. Nearly one-fifth of countries were able to achieve absolute decoupling of CO
2 emissions from economic growth
in the study decade (table 4.2). The percentage of countries with varying degrees of offsetting tended to
increase with increasing income. The exceptionally strong performance of Annex I countries relative to high-income countries in table 4.2 is partly due to the fact that 14 of the 38 Annex I countries are transition econo-mies, all of which had positive offsetting coefficients during the decade examined. In fact, most of these 14 transition economies showed absolute decoupling: of 16 Annex I countries with offsetting coefficients equal to or greater than 100 percent in the full period, 12 are transition economies.
The percentage of Annex I countries with absolute decoupling period fell sharply in subperiod 2, however. Of the 24 nontransition economies, the number achieving absolute decoupling fell from 8 to 5. Annex I countries are expected to achieve absolute decoupling during 2012–20, but several were far from achieving this goal at the end of the decade studied. During subperiod 2, Austria, Italy, Luxembourg, and Spain had negative offsetting coefficients, amplifying the increase in emissions from GDP growth. Although Australia, Croatia, Finland, the Netherlands, New Zealand, and Turkey had positive offsetting coefficients, they were smaller than 50 percent.
1 Corresponding results using U.S. EIA data are given in table B.8.
23Extractive Industries for Development Series
Table B.7 shows the ratios of offsetting coefficients obtained using the two different data sets. As equation 3 shows, X is a function only of CO
2
emissions and GDP. Because the same database was used for GDP, ratios that differ from 1 in table B.7 are due entirely to differences in CO
2 emis-
sions between the IEA and U.S. EIA databases. Decomposition analysis of global CO
2 emissions for the three study
periods is shown in figure 4.1. By far the greatest offsetting factor is the decrease in the world economy’s energy intensity. The figure shows that the reduction in energy intensity was smaller while the fossil fuel inten-sity of energy increased during subperiod 2.
Table4.2 DistributionofOffsettingCoefficientsbyCountryCategory
PeriodandoffsetLow
income
Lowermiddleincome
Uppermiddleincome
Highincome AnnexI Totala
Number of countries
Full period 18 33 31 40 38 122
Subperiod 1 19 31 29 41 35 120
Subperiod 2 19 32 32 40 38 123
All three periods 17 30 29 40 35 116
Percentage of countries
Positiveoffset
Full period 33 45 77 88 95 66
Subperiod 1 42 45 59 83 89 61
Subperiod 2 58 69 91 80 89 76
All three periods 29 33 52 70 80 50
Offset>50%
Full period 28 24 35 58 76 39
Subperiod 1 37 23 38 56 71 40
Subperiod 2 32 31 47 55 74 43
All three periods 12 13 21 43 60 25
Offset>100%
Full period 11 12 26 20 42 18
Subperiod 1 21 10 28 32 46 23
Subperiod 2 16 3 9 13 13 10
All three periods 6 3 3 8 9 5
Sources: IEA 2009a and 2009b, World Bank 2009, and authors’ calculations.a. Total is the sum of low-, lower-middle-, upper-middle-, and high-income countries.
Changes in CO2 Emissions from Energy Use24
Figure4.1 DecompositionAnalysisofGlobalCO2Emissions
Sources: IEA 2009a and 2009b, World Bank 2009, and authors’ calculations.
−4,000
−3,000
−2,000
−1,000
0
1,000
2,000
3,000
4,000
5,000
6,000
Full period(1994–96 to
2004–06)
Subperiod 1(1994–96 to1999–2001)
Subperiod 2(1999–2001 to
2004–06)
Million tonnes of CO2
CO2 /fossil fuel
Fossil fuel/energy
Energy/GDP
GDP/population
Popu-lation
Net increasein emissions
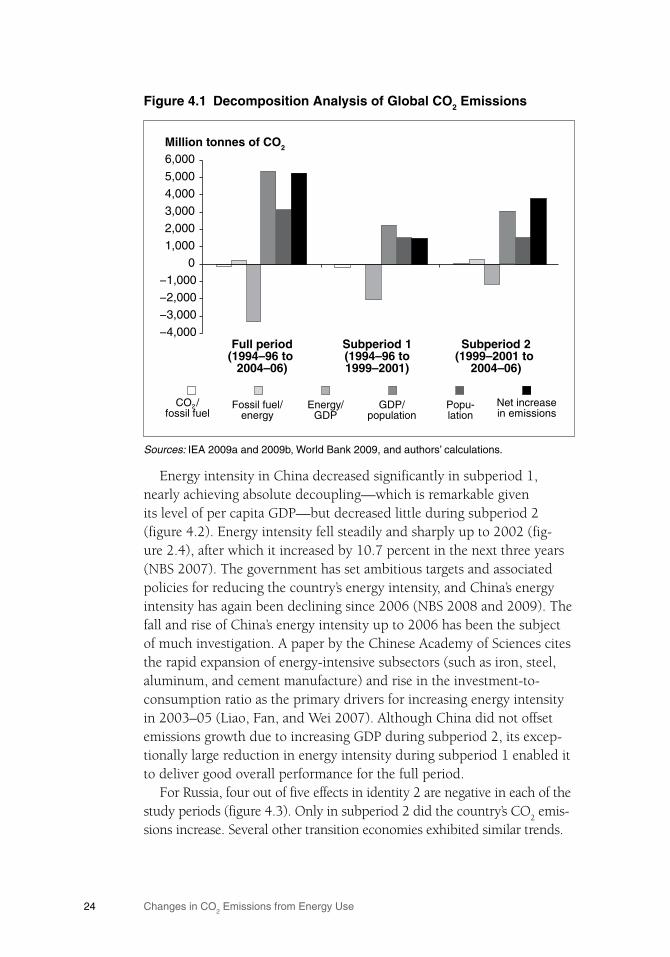
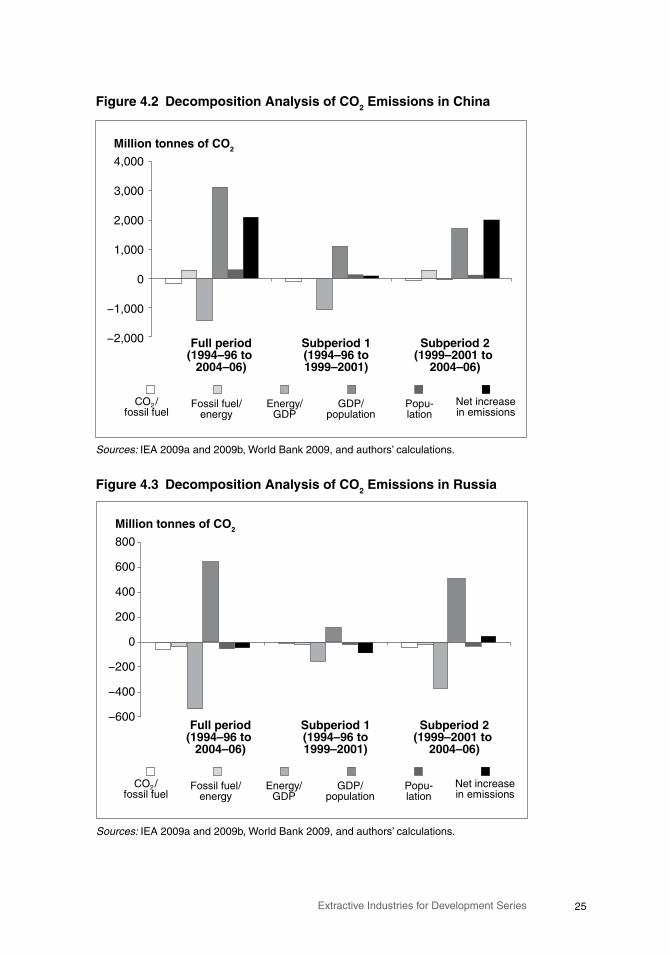
Energy intensity in China decreased significantly in subperiod 1, nearly achieving absolute decoupling—which is remarkable given its level of per capita GDP—but decreased little during subperiod 2 (figure 4.2). Energy intensity fell steadily and sharply up to 2002 (fig-ure 2.4), after which it increased by 10.7 percent in the next three years (NBS 2007). The government has set ambitious targets and associated policies for reducing the country’s energy intensity, and China’s energy intensity has again been declining since 2006 (NBS 2008 and 2009). The fall and rise of China’s energy intensity up to 2006 has been the subject of much investigation. A paper by the Chinese Academy of Sciences cites the rapid expansion of energy-intensive subsectors (such as iron, steel, aluminum, and cement manufacture) and rise in the investment-to-consumption ratio as the primary drivers for increasing energy intensity in 2003–05 (Liao, Fan, and Wei 2007). Although China did not offset emissions growth due to increasing GDP during subperiod 2, its excep-tionally large reduction in energy intensity during subperiod 1 enabled it to deliver good overall performance for the full period.
For Russia, four out of five effects in identity 2 are negative in each of the study periods (figure 4.3). Only in subperiod 2 did the country’s CO
2 emis-
sions increase. Several other transition economies exhibited similar trends.
25Extractive Industries for Development Series
Figure4.2 DecompositionAnalysisofCO2EmissionsinChina
Sources: IEA 2009a and 2009b, World Bank 2009, and authors’ calculations.
−2,000
−1,000
Million tonnes of CO2
Full period(1994–96 to
2004–06)
Subperiod 1(1994–96 to1999–2001)
Subperiod 2(1999–2001 to
2004–06)
CO2 /fossil fuel
Fossil fuel/energy
Energy/GDP
GDP/population
Popu-lation
Net increasein emissions
0
1,000
2,000
3,000
4,000
Figure4.3 DecompositionAnalysisofCO2EmissionsinRussia
Sources: IEA 2009a and 2009b, World Bank 2009, and authors’ calculations.
Million tonnes of CO2
Full period(1994–96 to
2004–06)
Subperiod 1(1994–96 to1999–2001)
Subperiod 2(1999–2001 to
2004–06)
CO2 /fossil fuel
Fossil fuel/energy
Energy/GDP
GDP/population
Popu-lation
Net increasein emissions
−600
−400
−200
0
200
400
600
800
Changes in CO2 Emissions from Energy Use26
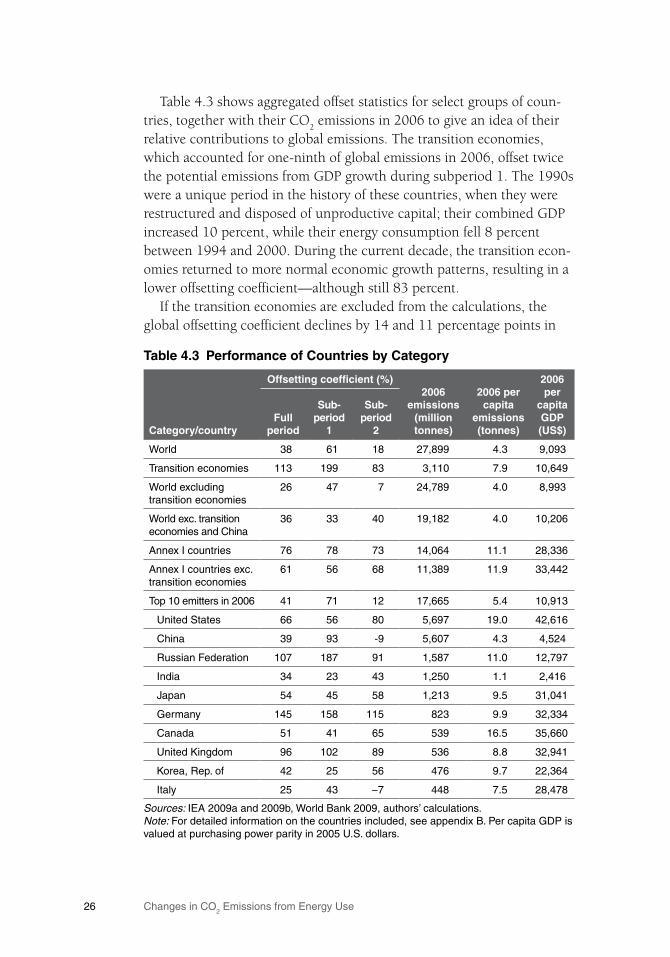
Table 4.3 shows aggregated offset statistics for select groups of coun-tries, together with their CO
2 emissions in 2006 to give an idea of their
relative contributions to global emissions. The transition economies, which accounted for one-ninth of global emissions in 2006, offset twice the potential emissions from GDP growth during subperiod 1. The 1990s were a unique period in the history of these countries, when they were restructured and disposed of unproductive capital; their combined GDP increased 10 percent, while their energy consumption fell 8 percent between 1994 and 2000. During the current decade, the transition econ-omies returned to more normal economic growth patterns, resulting in a lower offsetting coefficient—although still 83 percent.
If the transition economies are excluded from the calculations, the global offsetting coefficient declines by 14 and 11 percentage points in
Table4.3 PerformanceofCountriesbyCategory
Category/country
Offsettingcoefficient(%)2006
emissions(milliontonnes)
2006percapita
emissions(tonnes)
2006per
capitaGDP(US$)
Fullperiod
Sub-period
1
Sub-period
2
World 38 61 18 27,899 4.3 9,093
Transition economies 113 199 83 3,110 7.9 10,649
World excluding transition economies
26 47 7 24,789 4.0 8,993
World exc. transition economies and China
36 33 40 19,182 4.0 10,206
Annex I countries 76 78 73 14,064 11.1 28,336
Annex I countries exc. transition economies
61 56 68 11,389 11.9 33,442
Top 10 emitters in 2006 41 71 12 17,665 5.4 10,913
United States 66 56 80 5,697 19.0 42,616
China 39 93 -9 5,607 4.3 4,524
Russian Federation 107 187 91 1,587 11.0 12,797
India 34 23 43 1,250 1.1 2,416
Japan 54 45 58 1,213 9.5 31,041
Germany 145 158 115 823 9.9 32,334
Canada 51 41 65 539 16.5 35,660
United Kingdom 96 102 89 536 8.8 32,941
Korea, Rep. of 42 25 56 476 9.7 22,364
Italy 25 43 −7 448 7.5 28,478
Sources: IEA 2009a and 2009b, World Bank 2009, authors’ calculations.Note: For detailed information on the countries included, see appendix B. Per capita GDP is valued at purchasing power parity in 2005 U.S. dollars.
27Extractive Industries for Development Series
the subperiods 1 and 2, respectively, resulting in essentially no offset-ting during subperiod 2. If both the transition economies and China are excluded—leaving two-thirds of global emissions in 2006—the degree of offsetting actually improves from the first subperiod to the second.
Annex I countries fared reasonably well on the whole. When the tran-sition economies are excluded, leaving mostly Annex II countries,2 the offsetting coefficient increased in subperiod 2, although falling far short of the minimum target of 100 percent needed to decrease CO
2 emissions.
The top 10 emitters in 2006 performed poorly in subperiod 2, but there was wide variation in the performance of individual countries and their income levels. Three of the top five emitters—which accounted for 55 percent of global CO
2 emissions in 2006—improved their offset-
ting between the two subperiods; and the offsetting coefficient decreased by about 100 percentage points for the remaining two, although both started from positions of significant offsetting. Germany is the only coun-try that maintained absolute decoupling in both subperiods. For the full period, Germany and Russia achieved absolute decoupling, and the United Kingdom came close.
The top 10 emitters are at very different stages of economic develop-ment, and the per capita GDP of the United States, the richest country among them in 2006, was 18 and 9 times that of India and China, respectively. Similarly, the United States as the highest per capita emitter generated 17 and 4 times the per capita emissions of India and China. Among the five countries with per capita GDP within 11 percent of each other in 2006—Japan, Germany, Canada, United Kingdom, and Italy, which are the five richest countries after the United States—the offsetting coefficient for the full period ranged from 25 percent for Italy to 145 per-cent for Germany and averaged 74 percent. By contrast, the United States, whose per capita GDP was one-third higher than the average of the above five countries and whose per capita emissions were twice their average, had an offsetting coefficient of 66 percent during the same period.
Results based on identity 2 for each country and each study period are tabulated in appendix B. The first three tables in the appendix show results using energy and emissions data from the IEA; the next three show results using data from the U.S. EIA. As mentioned earlier, aside from data differences, the greatest difference between the two data sets is that the IEA includes biomass consumed outside the power sector in its
2 Annex II countries are Annex I countries excluding Turkey and those countries that were economies in transition in 1992.
Changes in CO2 Emissions from Energy Use28
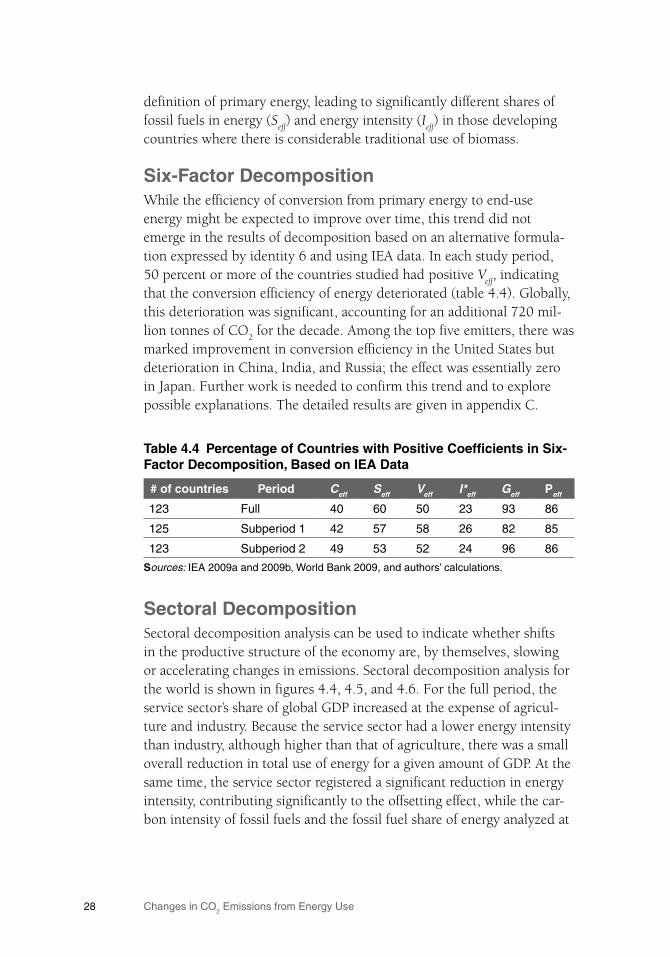
Table4.4 PercentageofCountrieswithPositiveCoefficientsinSix-FactorDecomposition,BasedonIEAData
#ofcountries Period Ceff Seff Veff I*eff Geff Peff
123 Full 40 60 50 23 93 86
125 Subperiod 1 42 57 58 26 82 85
123 Subperiod 2 49 53 52 24 96 86
Sources: IEA 2009a and 2009b, World Bank 2009, and authors’ calculations.
definition of primary energy, leading to significantly different shares of fossil fuels in energy (S
eff) and energy intensity (I
eff) in those developing
countries where there is considerable traditional use of biomass.
Six-FactorDecompositionWhile the efficiency of conversion from primary energy to end-use energy might be expected to improve over time, this trend did not emerge in the results of decomposition based on an alternative formula-tion expressed by identity 6 and using IEA data. In each study period, 50 percent or more of the countries studied had positive V
eff, indicating
that the conversion efficiency of energy deteriorated (table 4.4). Globally, this deterioration was significant, accounting for an additional 720 mil-lion tonnes of CO
2 for the decade. Among the top five emitters, there was
marked improvement in conversion efficiency in the United States but deterioration in China, India, and Russia; the effect was essentially zero in Japan. Further work is needed to confirm this trend and to explore possible explanations. The detailed results are given in appendix C.
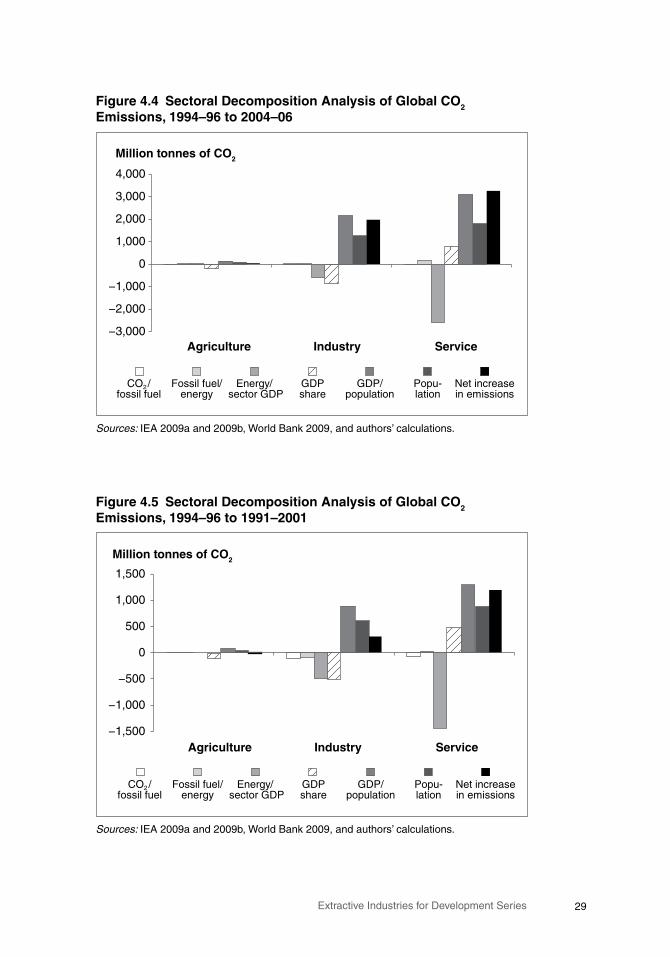
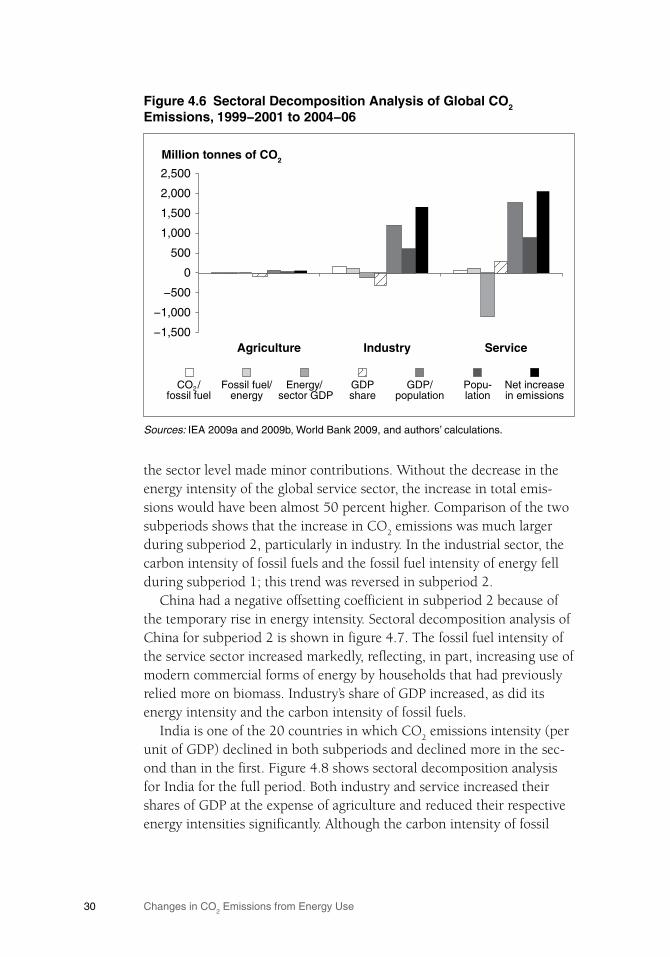
SectoralDecompositionSectoral decomposition analysis can be used to indicate whether shifts in the productive structure of the economy are, by themselves, slowing or accelerating changes in emissions. Sectoral decomposition analysis for the world is shown in figures 4.4, 4.5, and 4.6. For the full period, the service sector’s share of global GDP increased at the expense of agricul-ture and industry. Because the service sector had a lower energy intensity than industry, although higher than that of agriculture, there was a small overall reduction in total use of energy for a given amount of GDP. At the same time, the service sector registered a significant reduction in energy intensity, contributing significantly to the offsetting effect, while the car-bon intensity of fossil fuels and the fossil fuel share of energy analyzed at
29Extractive Industries for Development Series
Figure4.4 SectoralDecompositionAnalysisofGlobalCO2Emissions,1994–96to2004–06
Sources: IEA 2009a and 2009b, World Bank 2009, and authors’ calculations.
Million tonnes of CO2
CO2 /fossil fuel
Fossil fuel/energy
Energy/ sector GDP
GDP/population
Popu-lation
Net increasein emissions
−3,000
−2,000
−1,000
0
1,000
2,000
3,000
4,000
Agriculture Industry Service
GDPshare
Figure4.5 SectoralDecompositionAnalysisofGlobalCO2Emissions,1994–96to1991–2001
Sources: IEA 2009a and 2009b, World Bank 2009, and authors’ calculations.
Million tonnes of CO2
CO2 /fossil fuel
Fossil fuel/energy
Energy/ sector GDP
GDP/population
Popu-lation
Net increasein emissions
Agriculture Industry Service
GDPshare
−1,500
−1,000
−500
0
500
1,000
1,500
Changes in CO2 Emissions from Energy Use30
the sector level made minor contributions. Without the decrease in the energy intensity of the global service sector, the increase in total emis-sions would have been almost 50 percent higher. Comparison of the two subperiods shows that the increase in CO
2 emissions was much larger
during subperiod 2, particularly in industry. In the industrial sector, the carbon intensity of fossil fuels and the fossil fuel intensity of energy fell during subperiod 1; this trend was reversed in subperiod 2.
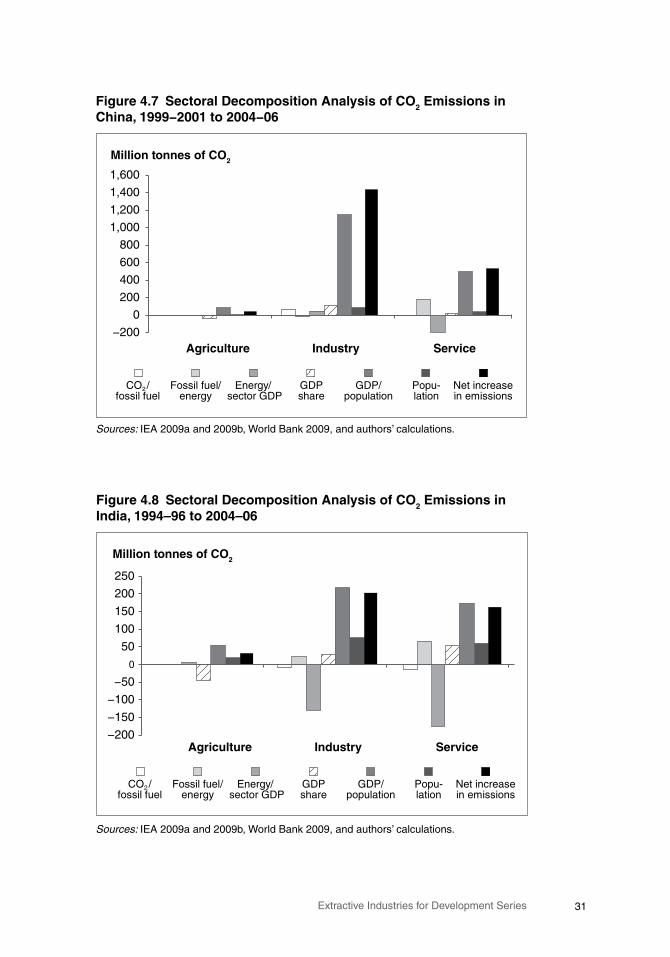
China had a negative offsetting coefficient in subperiod 2 because of the temporary rise in energy intensity. Sectoral decomposition analysis of China for subperiod 2 is shown in figure 4.7. The fossil fuel intensity of the service sector increased markedly, reflecting, in part, increasing use of modern commercial forms of energy by households that had previously relied more on biomass. Industry’s share of GDP increased, as did its energy intensity and the carbon intensity of fossil fuels.
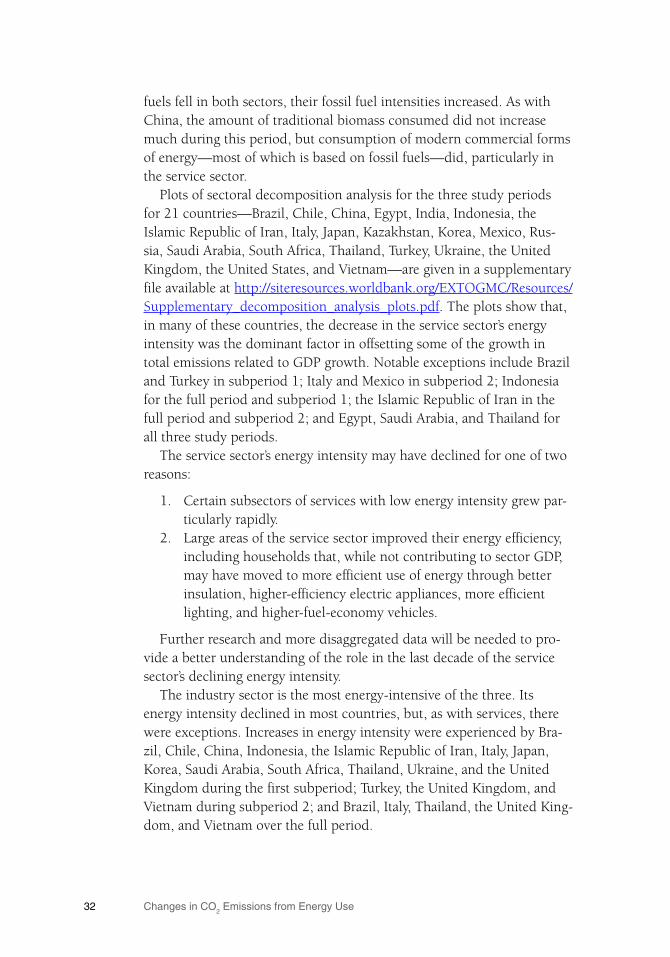
India is one of the 20 countries in which CO2 emissions intensity (per
unit of GDP) declined in both subperiods and declined more in the sec-ond than in the first. Figure 4.8 shows sectoral decomposition analysis for India for the full period. Both industry and service increased their shares of GDP at the expense of agriculture and reduced their respective energy intensities significantly. Although the carbon intensity of fossil
Figure4.6 SectoralDecompositionAnalysisofGlobalCO2Emissions,1999−2001to2004−06
Sources: IEA 2009a and 2009b, World Bank 2009, and authors’ calculations.
Million tonnes of CO2
CO2 /fossil fuel
Fossil fuel/energy
Energy/ sector GDP
GDP/population
Popu-lation
Net increasein emissions
Agriculture Industry Service
GDPshare
−1,500
−1,000
−500
0
500
1,000
1,500
2,000
2,500
31Extractive Industries for Development Series
Figure4.7 SectoralDecompositionAnalysisofCO2EmissionsinChina,1999−2001to2004−06
Sources: IEA 2009a and 2009b, World Bank 2009, and authors’ calculations.
−200
0
200
400
600
800
1,000
1,200
1,400
1,600
Million tonnes of CO2
CO2 /fossil fuel
Fossil fuel/energy
Energy/ sector GDP
GDP/population
Popu-lation
Net increasein emissions
Agriculture Industry Service
GDPshare
Figure4.8 SectoralDecompositionAnalysisofCO2EmissionsinIndia,1994–96to2004–06
Sources: IEA 2009a and 2009b, World Bank 2009, and authors’ calculations.
−200
−150
−100
−50
0
50
100
150
200
250
Million tonnes of CO2
CO2 /fossil fuel
Fossil fuel/energy
Energy/ sector GDP
GDP/population
Popu-lation
Net increasein emissions
Agriculture Industry Service
GDPshare
Changes in CO2 Emissions from Energy Use32
fuels fell in both sectors, their fossil fuel intensities increased. As with China, the amount of traditional biomass consumed did not increase much during this period, but consumption of modern commercial forms of energy—most of which is based on fossil fuels—did, particularly in the service sector.
Plots of sectoral decomposition analysis for the three study periods for 21 countries—Brazil, Chile, China, Egypt, India, Indonesia, the Islamic Republic of Iran, Italy, Japan, Kazakhstan, Korea, Mexico, Rus-sia, Saudi Arabia, South Africa, Thailand, Turkey, Ukraine, the United Kingdom, the United States, and Vietnam—are given in a supplementary file available at http://siteresources.worldbank.org/EXTOGMC/Resources/Supplementary_decomposition_analysis_plots.pdf. The plots show that, in many of these countries, the decrease in the service sector’s energy intensity was the dominant factor in offsetting some of the growth in total emissions related to GDP growth. Notable exceptions include Brazil and Turkey in subperiod 1; Italy and Mexico in subperiod 2; Indonesia for the full period and subperiod 1; the Islamic Republic of Iran in the full period and subperiod 2; and Egypt, Saudi Arabia, and Thailand for all three study periods.
The service sector’s energy intensity may have declined for one of two reasons:
1. Certain subsectors of services with low energy intensity grew par-ticularly rapidly.
2. Large areas of the service sector improved their energy efficiency, including households that, while not contributing to sector GDP, may have moved to more efficient use of energy through better insulation, higher-efficiency electric appliances, more efficient lighting, and higher-fuel-economy vehicles.
Further research and more disaggregated data will be needed to pro-vide a better understanding of the role in the last decade of the service sector’s declining energy intensity.
The industry sector is the most energy-intensive of the three. Its energy intensity declined in most countries, but, as with services, there were exceptions. Increases in energy intensity were experienced by Bra-zil, Chile, China, Indonesia, the Islamic Republic of Iran, Italy, Japan, Korea, Saudi Arabia, South Africa, Thailand, Ukraine, and the United Kingdom during the first subperiod; Turkey, the United Kingdom, and Vietnam during subperiod 2; and Brazil, Italy, Thailand, the United King-dom, and Vietnam over the full period.
33Extractive Industries for Development Series
Chapter5
Conclusions
This study finds that, at the global level, the increase in CO2 emissions
was greater in the second half of the decade examined than in the first half, even though more countries had positive offsetting coefficients dur-ing the latter subperiod. More rapid growth of GDP accounts for some of this increase. Although a reduction in energy intensity offset some of this growth in each subperiod, its effect was weaker in the second sub-period—a finding of some concern. Also of concern is the fact that the carbon emissions intensity of fossil fuels and fossil fuel mix declined in the subperiod 1 but rose in subperiod 2.
Several studies have used longer time periods to assess CO2 emissions
trajectories, such as the recently released E3G publication on the Group of 20 countries (Vivid Economics 2009). The present study points to unique circumstances resulting in a marked shift in trends around the beginning of this decade, with a slowdown of the decline in global emis-sions growth in the decade’s second half as compared to its first. Con-sequently, projecting emissions trends observed predominantly in the 1990s into the future could be misleading.
When the decomposition analysis was carried out using sectoral data, the fall in energy intensity in the service sector in both subperiods was significant, while the effect was considerably smaller in the industrial sec-tor.
Examination of the top five emitters confirms the importance of the decrease in the service sector’s energy intensity, apart from Japan in the subperiod 1 and China in subperiod 2 where the energy intensity increased. In China (all three study periods), India (all three study peri-ods), and Japan (subperiod 2), fossil fuel intensity rose, partly negating the effects of reduced energy intensity.
Analyzing the results by income shows that absolute decoupling tended to occur more in upper-middle and high-income countries. A notable feature of this trend is high representation of transition econo-mies, which decoupled so strongly in subperiod 1 as to compensate for their weaker performance during subperiod 2 to deliver good overall
Changes in CO2 Emissions from Energy Use34
performance for the full period. Because many transition economies are Annex I signatories, the latter as a whole did much better than high-income countries on average in subperiod 1.
Countries in the early stages of development tended to show less off-setting, and virtually none showed absolute decoupling. However, this finding must be taken in the context of their very low per capita emis-sions today. Many countries—where per capita emissions are markedly below even the most stringent stabilization target levels considered by international bodies—are extremely poor and would not be expected to follow a development path in which total emissions from energy use would decline or even stabilize in the near term. As suggested by Spence (2009), emissions from these countries will, and should be permitted to, increase for the foreseeable future, mitigated by their own planning and policy efforts toward energy efficiency and low-carbon energy sources. The recently proposed Greenhouse Rights Development framework details a similar approach and suggests a development threshold of wel-fare below which people should not expected to share the costs of cli-mate change mitigation (Baer and others 2008).
Even though decoupling was not as strong globally in the second subperiod as in the first, the good performance of several countries across the entire income spectrum indicates the potential for wider improvements as governments engage with the task of increasing energy efficiency and energy conservation, thereby slowing the growth of CO
2
emissions. As low-income countries develop, they will be better able to take advantage of a menu of options and achieve stronger decoupling by following these examples.
35Extractive Industries for Development Series
AppendixA
DataTreatment
IEA energy data are from extended energy balances of OECD and non-OECD countries. For five-factor decomposition analysis, energy in the analysis is total primary energy supply in the database. Individual fossil fuel contributions are summed. The IEA presents CO
2 emissions cal-
culated using both the Intergovernmental Panel on Climate Change’s Reference Approach and its Tier 1 Sectoral Approach. This study takes the latter and sums all CO
2 emissions except those from industrial and
municipal wastes.Turton and Hamilton (1999) point out that the assumptions used by
the IEA for determining the notional thermal efficiency of nuclear and hydroelectric power can have a large influence on energy use data for those countries deriving a large proportion of energy from these fuels.
For sectoral decomposition, energy consumption is based on final energy consumed in each sector except electricity and heat, for which fuel sources for power and heat production are apportioned to each sec-tor according to its final consumption. Losses in the transmission and distribution of energy, heat, and fuels are apportioned similarly. CO
2
emissions are based on the distribution of different fossil fuels consumed. This approach differs from that for the five-factor decomposition analy-sis, which is based only on primary energy. The differences are generally small except in countries with significant charcoal consumption (where charcoal rather than biomass consumption is taken for sectoral decom-position); blast furnace gas, gas works gas, coke oven coke (Egypt); and coal- or gas-to-liquids (South Africa). These differences can produce results for C
eff that differ appreciably from those obtained in the five-
factor analysis.The U.S. EIA data are updated regularly, and historical data are fre-
quently revised. CO2 emissions data used in the 2007 publication are
generally higher in the most recent update than in the previous publica-tion. The U.S. EIA CO
2 emissions data should be closer to the IEA’s CO
2
emissions data using the Intergovernmental Panel on Climate Change’s Reference Approach, but using the latter did not narrow the gap in the
Changes in CO2 Emissions from Energy Use36
results based on the U.S. EIA and IEA databases (for example, the results in table B.7) markedly.
Population and GDP data are taken from the World Bank’s World Development Indicators. Bahrain, Cambodia, and Myanmar had all the requisite data except for GDP in 2006, enabling decomposition analysis only for the first subperiod. GDP data were missing for Chad, Cuba, Iraq, the Democratic Republic of Korea, Monaco, Palau, Qatar, Somalia, Turk-menistan, and Zimbabwe.
37Extractive Industries for Development Series
AppendixB
ResultsforFive-FactorDecomposition
This appendix presents the results of decomposition analysis according to identity 2 based on emissions and energy consumption data from the IEA and U.S. EIA for the full period and the two subperiods. In all cases, data are first averaged over three consecutive years, with the midyear representing the year of interest. The results of calculations using IEA data are provided first (tables B.1 through B.3, followed by the results using U.S. EIA data (tables B.4 through B.6). From IEA, the required data were available for 123 countries for the full period. In addition, Bahrain, Cambodia, Libya, and Myanmar had GDP data to enable decomposition for one subperiod. From U.S. EIA, the required data were available for 165 countries. In addition, Bahrain, Libya, Maldives, and Myanmar had data to enable decomposition for one subperiod. The U.S. EIA tables also show the results for Taiwan, China. For all six tables, calculations were also carried out for the world.
Using IEA data, calculations were carried out for Annex I countries (except Liechtenstein and Monaco, for which data were not available), Annex I countries excluding the 14 transition economies (Belarus, Bul-garia, Croatia, Czech Republic, Estonia, Hungary, Latvia, Lithuania, Poland, Romania, Russia, Slovak Republic, Slovenia, and Ukraine), all transition economies for which data were available (Albania, Armenia, Azerbaijan, Belarus, Bosnia and Herzegovina, Bulgaria, Croatia, Czech Republic, Estonia, Georgia, Hungary, Kazakhstan, Kyrgyz Republic, Lat-via, Lithuania, the Former Yugoslavia Republic of Macedonia, Moldova, Poland, Romania, Russia, Serbia, Slovak Republic, Slovenia, Tajikistan, Ukraine, and Uzbekistan), the world excluding the transition economies, the world excluding the transition economies and China, and for the top 10 CO
2 emitters in 2006 (the United States, China, Russia, India, Japan,
Germany, Canada, the United Kingdom, Korea, and Italy).

Changes in CO2 Emissions from Energy Use38
To give an indication of the degree of discrepancies between the two data sets, table B.7 tabulates the ratio of the offsetting coefficients calcu-lated from IEA and U.S. EIA data.
Distribution of offsetting coefficients among different categories of countries using U.S. EIA data are given in table B.8. The IEA equivalent of this table is provided in the main text in table 4.2.
Offsetting coefficients are not given where GDP declined over the time interval in question:
• Bulgaria subperiod 1• Burundi subperiod 1• Central African Republic subperiod 2• Democratic Republic of Congo full period and subperiod 1• Djibouti subperiod 1• Guinea-Bissau all three periods• Haiti subperiod 2• Liberia subperiod 2• Moldova subperiod 1• Papua New Guinea subperiod 1• Romania subperiod 1• Seychelles subperiod 2• Sierra Leone subperiod 1• Solomon Islands full period and subperiod 1• Ukraine subperiod 1

39Extractive Industries for Development Series
TableB.1 DecompositionAnalysisbetween1994–96and2004–06BasedonIEADatamillion tonnes of CO2
Category/country Ceff Seff Ieff Geff Peff E X(%)
Albania −0.2 0.9 −0.1 1.5 0.0 2.1 −37
Algeria 2 0 −5 16 11 24 11
Angola 0.8 0.9 −2.6 3.1 1.6 3.7 20
Argentina −2 2 −3 12 14 22 13
Armenia −0.1 −0.2 −1.5 3.0 −0.2 1.0 64
Australia 21 2 −46 82 40 99 19
Austria 1 −2 0 12 2 13 6
Azerbaijan −1 0 −30 27 3 −1 105
Bangladesh 0.2 5.0 −2.3 8.8 5.2 17 −21
Belarus −4 −1 −34 41 −3 −1 102
Belgium −10 −4 −17 21 4 −5 121
Benin 0.1 1.8 −0.2 0.2 0.4 2.2 −297
Bolivia 0.1 0.7 0.1 1.1 2.0 3.9 −27
Bosnia & Herzegovina 0 2 −1 10 1 12 −19
Botswana −0.1 0.3 −1.5 1.9 0.6 1.1 55
Brazil 7 −2 13 28 41 88 −27
Brunei Darussalam −0.2 0.0 0.0 −0.3 1.2 0.7 24
Bulgaria 3 −4 −19 17 −4 −7 157
Cameroon −0.06 −0.06 −0.50 0.48 0.65 0.51 55
Canada −11 16 −91 119 48 82 51
Chile −3 1 1 14 6 19 7
China −182 291 −1,444 3,132 310 2,107 39
Colombia −2 4 −16 5 9 2 87
Congo, Dem. Rep. of 0.9 −1.2 0.6 −0.6 0.6 0.2 n.a.
Congo, Rep. of −0.1 0.3 0.1 0.1 0.2 0.5 −99
Costa Rica −0.2 −1.0 0.2 1.2 1.1 1.3 45
Côte d’Ivoire 0.1 1.2 0.7 −0.3 1.0 2.7 −295
Croatia 1.3 −0.1 −3.3 7.9 −0.6 5.1 30
Cyprus 0.6 0.0 −1.1 1.4 0.8 1.6 27
Czech Republic −2 −13 −20 33 −1 −3 108
Denmark −3 −7 −14 10 2 −12 205
Dominican Republic 2.0 0.7 −3.9 5.4 2.4 6.6 16
Ecuador −1.9 1.3 1.6 3.3 2.7 6.9 −16
Egypt, Arab Rep. of 2 2 10 28 21 63 −29
El Salvador 0.0 −0.1 0.2 0.6 0.9 1.5 −6
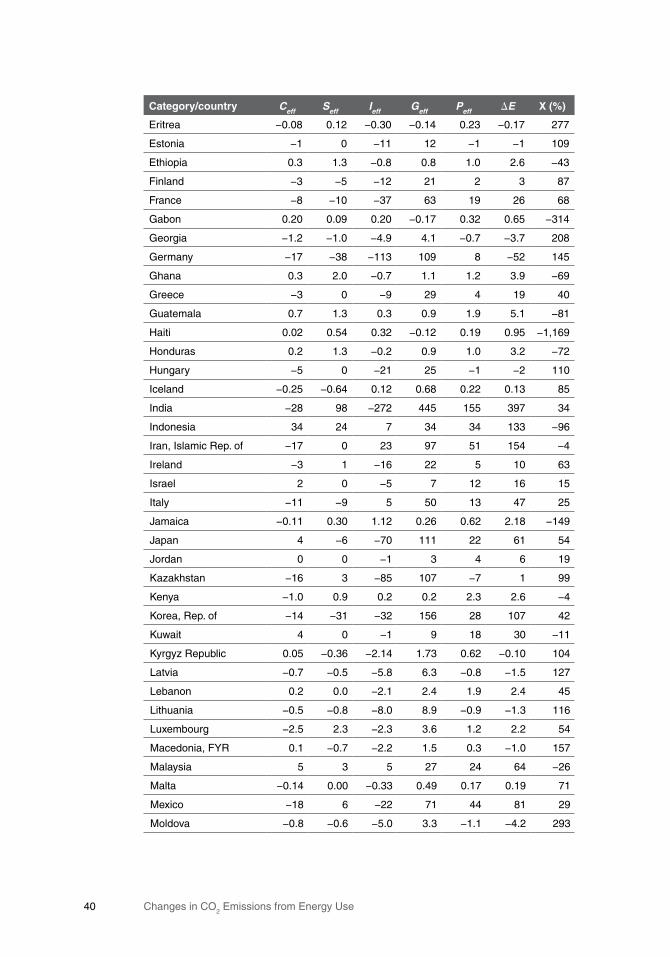
Changes in CO2 Emissions from Energy Use40
Category/country Ceff Seff Ieff Geff Peff E X(%)
Eritrea −0.08 0.12 −0.30 −0.14 0.23 −0.17 277
Estonia −1 0 −11 12 −1 −1 109
Ethiopia 0.3 1.3 −0.8 0.8 1.0 2.6 −43
Finland −3 −5 −12 21 2 3 87
France −8 −10 −37 63 19 26 68
Gabon 0.20 0.09 0.20 −0.17 0.32 0.65 −314
Georgia −1.2 −1.0 −4.9 4.1 −0.7 −3.7 208
Germany −17 −38 −113 109 8 −52 145
Ghana 0.3 2.0 −0.7 1.1 1.2 3.9 −69
Greece −3 0 −9 29 4 19 40
Guatemala 0.7 1.3 0.3 0.9 1.9 5.1 −81
Haiti 0.02 0.54 0.32 −0.12 0.19 0.95 −1,169
Honduras 0.2 1.3 −0.2 0.9 1.0 3.2 −72
Hungary −5 0 −21 25 −1 −2 110
Iceland −0.25 −0.64 0.12 0.68 0.22 0.13 85
India −28 98 −272 445 155 397 34
Indonesia 34 24 7 34 34 133 −96
Iran, Islamic Rep. of −17 0 23 97 51 154 −4
Ireland −3 1 −16 22 5 10 63
Israel 2 0 −5 7 12 16 15
Italy −11 −9 5 50 13 47 25
Jamaica −0.11 0.30 1.12 0.26 0.62 2.18 −149
Japan 4 −6 −70 111 22 61 54
Jordan 0 0 −1 3 4 6 19
Kazakhstan −16 3 −85 107 −7 1 99
Kenya −1.0 0.9 0.2 0.2 2.3 2.6 −4
Korea, Rep. of −14 −31 −32 156 28 107 42
Kuwait 4 0 −1 9 18 30 −11
Kyrgyz Republic 0.05 −0.36 −2.14 1.73 0.62 −0.10 104
Latvia −0.7 −0.5 −5.8 6.3 −0.8 −1.5 127
Lebanon 0.2 0.0 −2.1 2.4 1.9 2.4 45
Lithuania −0.5 −0.8 −8.0 8.9 −0.9 −1.3 116
Luxembourg −2.5 2.3 −2.3 3.6 1.2 2.2 54
Macedonia, FYR 0.1 −0.7 −2.2 1.5 0.3 −1.0 157
Malaysia 5 3 5 27 24 64 −26
Malta −0.14 0.00 −0.33 0.49 0.17 0.19 71
Mexico −18 6 −22 71 44 81 29
Moldova −0.8 −0.6 −5.0 3.3 −1.1 −4.2 293
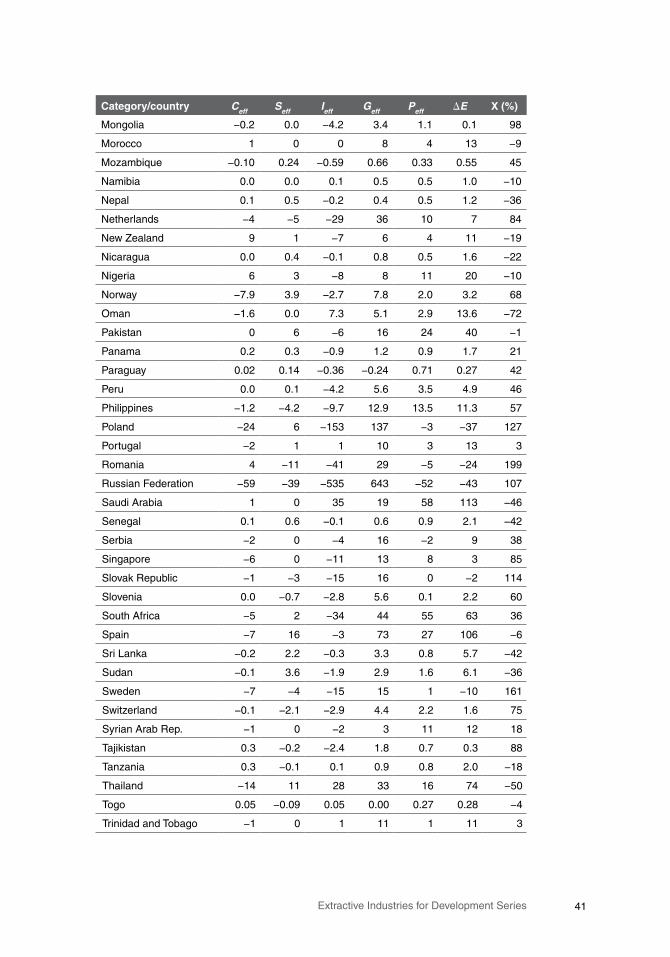
41Extractive Industries for Development Series
Category/country Ceff Seff Ieff Geff Peff E X(%)
Mongolia −0.2 0.0 −4.2 3.4 1.1 0.1 98
Morocco 1 0 0 8 4 13 −9
Mozambique −0.10 0.24 −0.59 0.66 0.33 0.55 45
Namibia 0.0 0.0 0.1 0.5 0.5 1.0 −10
Nepal 0.1 0.5 −0.2 0.4 0.5 1.2 −36
Netherlands −4 −5 −29 36 10 7 84
New Zealand 9 1 −7 6 4 11 −19
Nicaragua 0.0 0.4 −0.1 0.8 0.5 1.6 −22
Nigeria 6 3 −8 8 11 20 −10
Norway −7.9 3.9 −2.7 7.8 2.0 3.2 68
Oman −1.6 0.0 7.3 5.1 2.9 13.6 −72
Pakistan 0 6 −6 16 24 40 −1
Panama 0.2 0.3 −0.9 1.2 0.9 1.7 21
Paraguay 0.02 0.14 −0.36 −0.24 0.71 0.27 42
Peru 0.0 0.1 −4.2 5.6 3.5 4.9 46
Philippines −1.2 −4.2 −9.7 12.9 13.5 11.3 57
Poland −24 6 −153 137 −3 −37 127
Portugal −2 1 1 10 3 13 3
Romania 4 −11 −41 29 −5 −24 199
Russian Federation −59 −39 −535 643 −52 −43 107
Saudi Arabia 1 0 35 19 58 113 −46
Senegal 0.1 0.6 −0.1 0.6 0.9 2.1 −42
Serbia −2 0 −4 16 −2 9 38
Singapore −6 0 −11 13 8 3 85
Slovak Republic −1 −3 −15 16 0 −2 114
Slovenia 0.0 −0.7 −2.8 5.6 0.1 2.2 60
South Africa −5 2 −34 44 55 63 36
Spain −7 16 −3 73 27 106 −6
Sri Lanka −0.2 2.2 −0.3 3.3 0.8 5.7 −42
Sudan −0.1 3.6 −1.9 2.9 1.6 6.1 −36
Sweden −7 −4 −15 15 1 −10 161
Switzerland −0.1 −2.1 −2.9 4.4 2.2 1.6 75
Syrian Arab Rep. −1 0 −2 3 11 12 18
Tajikistan 0.3 −0.2 −2.4 1.8 0.7 0.3 88
Tanzania 0.3 −0.1 0.1 0.9 0.8 2.0 −18
Thailand −14 11 28 33 16 74 −50
Togo 0.05 −0.09 0.05 0.00 0.27 0.28 −4
Trinidad and Tobago −1 0 1 11 1 11 3
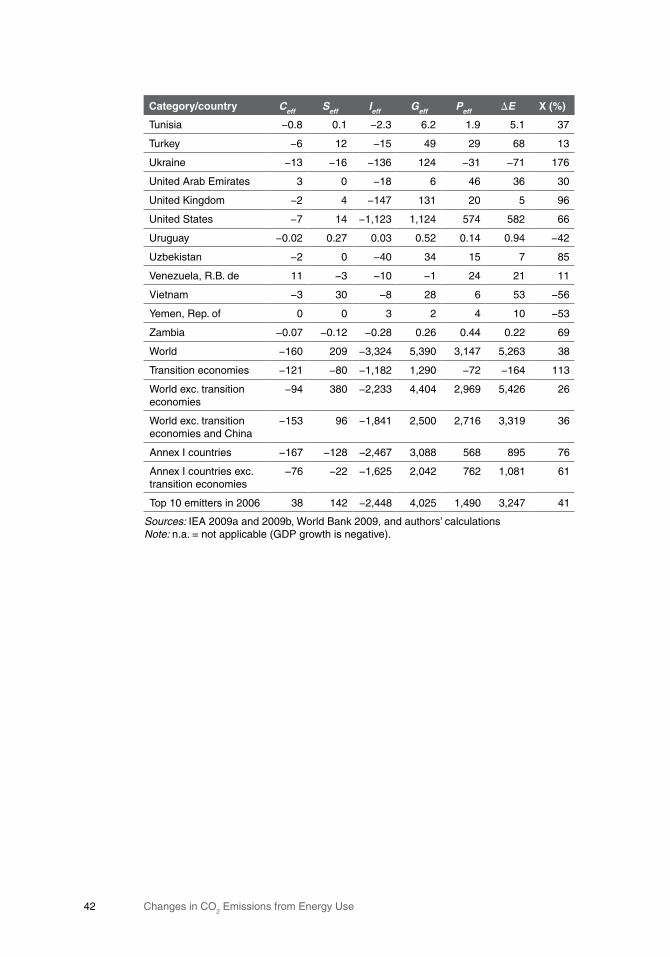
Changes in CO2 Emissions from Energy Use42
Category/country Ceff Seff Ieff Geff Peff E X(%)
Tunisia −0.8 0.1 −2.3 6.2 1.9 5.1 37
Turkey −6 12 −15 49 29 68 13
Ukraine −13 −16 −136 124 −31 −71 176
United Arab Emirates 3 0 −18 6 46 36 30
United Kingdom −2 4 −147 131 20 5 96
United States −7 14 −1,123 1,124 574 582 66
Uruguay −0.02 0.27 0.03 0.52 0.14 0.94 −42
Uzbekistan −2 0 −40 34 15 7 85
Venezuela, R.B. de 11 −3 −10 −1 24 21 11
Vietnam −3 30 −8 28 6 53 −56
Yemen, Rep. of 0 0 3 2 4 10 −53
Zambia −0.07 −0.12 −0.28 0.26 0.44 0.22 69
World −160 209 −3,324 5,390 3,147 5,263 38
Transition economies −121 −80 −1,182 1,290 −72 −164 113
World exc. transition economies
−94 380 −2,233 4,404 2,969 5,426 26
World exc. transition economies and China
−153 96 −1,841 2,500 2,716 3,319 36
Annex I countries −167 −128 −2,467 3,088 568 895 76
Annex I countries exc. transition economies
−76 −22 −1,625 2,042 762 1,081 61
Top 10 emitters in 2006 38 142 −2,448 4,025 1,490 3,247 41
Sources: IEA 2009a and 2009b, World Bank 2009, and authors’ calculationsNote: n.a. = not applicable (GDP growth is negative).
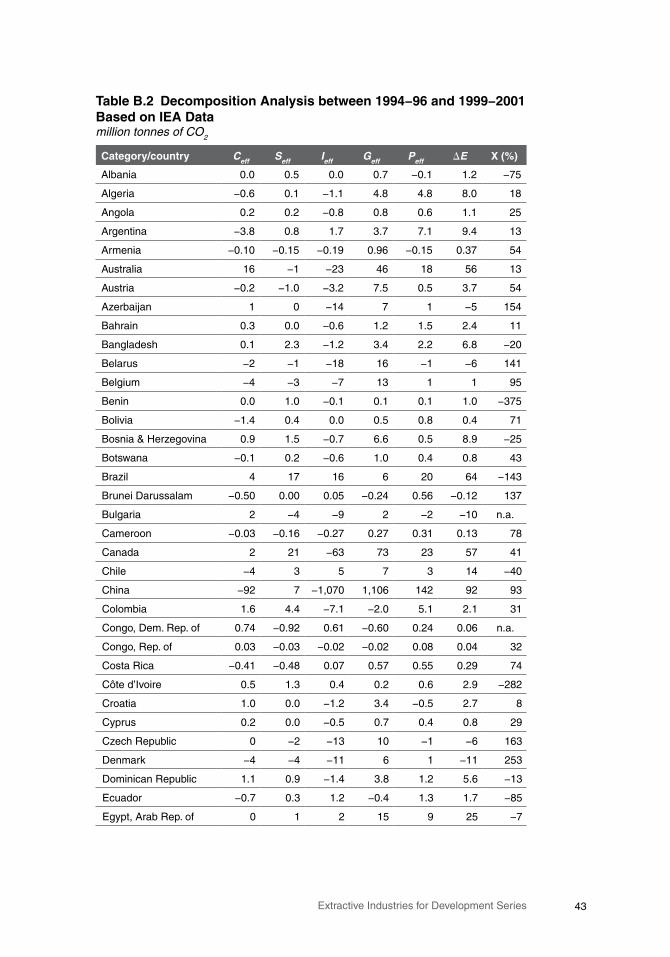
43Extractive Industries for Development Series
TableB.2 DecompositionAnalysisbetween1994−96and1999−2001BasedonIEADatamillion tonnes of CO2
Category/country Ceff Seff Ieff Geff Peff E X(%)
Albania 0.0 0.5 0.0 0.7 −0.1 1.2 −75
Algeria −0.6 0.1 −1.1 4.8 4.8 8.0 18
Angola 0.2 0.2 −0.8 0.8 0.6 1.1 25
Argentina −3.8 0.8 1.7 3.7 7.1 9.4 13
Armenia −0.10 −0.15 −0.19 0.96 −0.15 0.37 54
Australia 16 −1 −23 46 18 56 13
Austria −0.2 −1.0 −3.2 7.5 0.5 3.7 54
Azerbaijan 1 0 −14 7 1 −5 154
Bahrain 0.3 0.0 −0.6 1.2 1.5 2.4 11
Bangladesh 0.1 2.3 −1.2 3.4 2.2 6.8 −20
Belarus −2 −1 −18 16 −1 −6 141
Belgium −4 −3 −7 13 1 1 95
Benin 0.0 1.0 −0.1 0.1 0.1 1.0 −375
Bolivia −1.4 0.4 0.0 0.5 0.8 0.4 71
Bosnia & Herzegovina 0.9 1.5 −0.7 6.6 0.5 8.9 −25
Botswana −0.1 0.2 −0.6 1.0 0.4 0.8 43
Brazil 4 17 16 6 20 64 −143
Brunei Darussalam −0.50 0.00 0.05 −0.24 0.56 −0.12 137
Bulgaria 2 −4 −9 2 −2 −10 n.a.
Cameroon −0.03 −0.16 −0.27 0.27 0.31 0.13 78
Canada 2 21 −63 73 23 57 41
Chile −4 3 5 7 3 14 −40
China −92 7 −1,070 1,106 142 92 93
Colombia 1.6 4.4 −7.1 −2.0 5.1 2.1 31
Congo, Dem. Rep. of 0.74 −0.92 0.61 −0.60 0.24 0.06 n.a.
Congo, Rep. of 0.03 −0.03 −0.02 −0.02 0.08 0.04 32
Costa Rica −0.41 −0.48 0.07 0.57 0.55 0.29 74
Côte d’Ivoire 0.5 1.3 0.4 0.2 0.6 2.9 −282
Croatia 1.0 0.0 −1.2 3.4 −0.5 2.7 8
Cyprus 0.2 0.0 −0.5 0.7 0.4 0.8 29
Czech Republic 0 −2 −13 10 −1 −6 163
Denmark −4 −4 −11 6 1 −11 253
Dominican Republic 1.1 0.9 −1.4 3.8 1.2 5.6 −13
Ecuador −0.7 0.3 1.2 −0.4 1.3 1.7 −85
Egypt, Arab Rep. of 0 1 2 15 9 25 −7
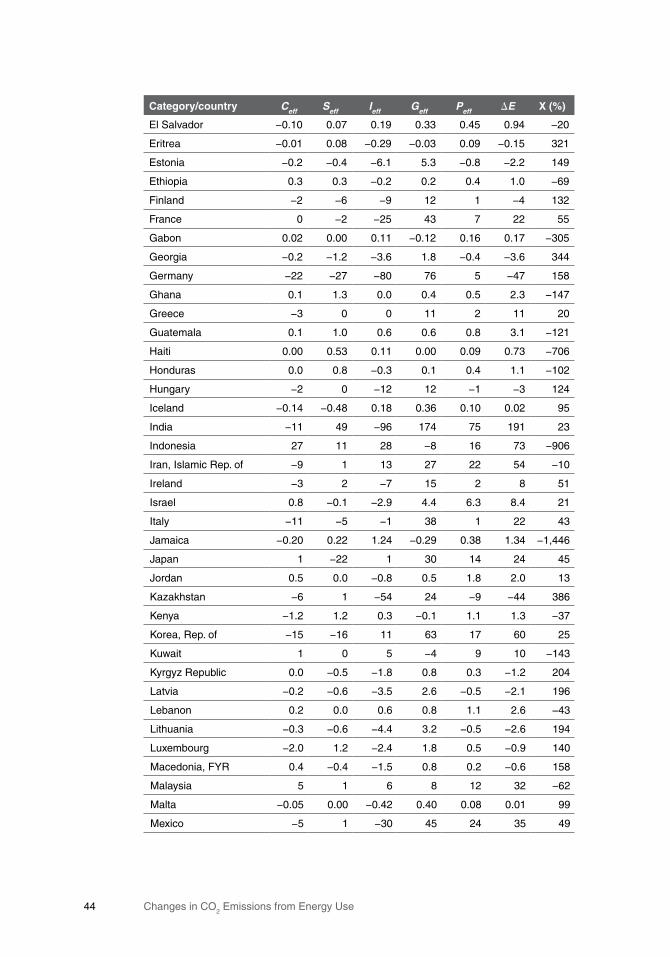
Changes in CO2 Emissions from Energy Use44
Category/country Ceff Seff Ieff Geff Peff E X(%)
El Salvador −0.10 0.07 0.19 0.33 0.45 0.94 −20
Eritrea −0.01 0.08 −0.29 −0.03 0.09 −0.15 321
Estonia −0.2 −0.4 −6.1 5.3 −0.8 −2.2 149
Ethiopia 0.3 0.3 −0.2 0.2 0.4 1.0 −69
Finland −2 −6 −9 12 1 −4 132
France 0 −2 −25 43 7 22 55
Gabon 0.02 0.00 0.11 −0.12 0.16 0.17 −305
Georgia −0.2 −1.2 −3.6 1.8 −0.4 −3.6 344
Germany −22 −27 −80 76 5 −47 158
Ghana 0.1 1.3 0.0 0.4 0.5 2.3 −147
Greece −3 0 0 11 2 11 20
Guatemala 0.1 1.0 0.6 0.6 0.8 3.1 −121
Haiti 0.00 0.53 0.11 0.00 0.09 0.73 −706
Honduras 0.0 0.8 −0.3 0.1 0.4 1.1 −102
Hungary −2 0 −12 12 −1 −3 124
Iceland −0.14 −0.48 0.18 0.36 0.10 0.02 95
India −11 49 −96 174 75 191 23
Indonesia 27 11 28 −8 16 73 −906
Iran, Islamic Rep. of −9 1 13 27 22 54 −10
Ireland −3 2 −7 15 2 8 51
Israel 0.8 −0.1 −2.9 4.4 6.3 8.4 21
Italy −11 −5 −1 38 1 22 43
Jamaica −0.20 0.22 1.24 −0.29 0.38 1.34 −1,446
Japan 1 −22 1 30 14 24 45
Jordan 0.5 0.0 −0.8 0.5 1.8 2.0 13
Kazakhstan −6 1 −54 24 −9 −44 386
Kenya −1.2 1.2 0.3 −0.1 1.1 1.3 −37
Korea, Rep. of −15 −16 11 63 17 60 25
Kuwait 1 0 5 −4 9 10 −143
Kyrgyz Republic 0.0 −0.5 −1.8 0.8 0.3 −1.2 204
Latvia −0.2 −0.6 −3.5 2.6 −0.5 −2.1 196
Lebanon 0.2 0.0 0.6 0.8 1.1 2.6 −43
Lithuania −0.3 −0.6 −4.4 3.2 −0.5 −2.6 194
Luxembourg −2.0 1.2 −2.4 1.8 0.5 −0.9 140
Macedonia, FYR 0.4 −0.4 −1.5 0.8 0.2 −0.6 158
Malaysia 5 1 6 8 12 32 −62
Malta −0.05 0.00 −0.42 0.40 0.08 0.01 99
Mexico −5 1 −30 45 24 35 49

45Extractive Industries for Development Series
Category/country Ceff Seff Ieff Geff Peff E X(%)
Moldova −0.8 −0.3 −2.8 −0.4 −0.5 −4.8 n.a.
Mongolia 0.0 0.0 −2.3 0.9 0.5 −0.9 162
Morocco 0 0 1 2 2 5 −29
Mozambique −0.16 0.20 −0.28 0.29 0.15 0.20 54
Myanmar 0.0 0.9 −2.3 2.3 0.4 1.3 51
Namibia −0.02 −0.12 −0.04 0.09 0.24 0.16 52
Nepal 0.1 0.9 −0.1 0.2 0.3 1.4 −165
Netherlands −2 −4 −28 27 5 −1 102
New Zealand 3.7 1.3 −1.3 2.5 1.4 7.7 −95
Nicaragua 0.0 0.6 −0.3 0.4 0.3 1.0 −45
Nigeria 6.0 −0.5 −1.1 0.1 4.9 9.3 −86
Norway −3.0 1.1 −1.9 4.9 1.0 2.0 66
Oman −0.5 0.0 3.9 1.3 1.7 6.3 −112
Pakistan 0 4 1 3 11 18 −35
Panama −0.5 0.3 0.3 0.5 0.5 1.1 −10
Paraguay 0.04 0.10 0.01 −0.29 0.37 0.24 −181
Peru −0.5 0.4 −0.7 1.5 1.8 2.5 25
Philippines 0.7 −4.3 2.4 4.5 6.7 10.0 11
Poland −11 2 −110 81 −1 −39 149
Portugal −1.7 2.0 2.1 9.2 1.1 12.6 −23
Romania 2 −9 −18 −3 −1 −30 n.a.
Russian Federation −14 −19 −152 118 −20 −86 187
Saudi Arabia 4 0 13 −2 25 41 −74
Senegal 0.1 0.3 0.2 0.3 0.4 1.2 −89
Serbia 0.6 −1.5 −2.9 2.8 −1.2 −2.2 241
Singapore 0 0 −11 5 5 −1 105
Slovak Republic −1.2 −1.8 −6.7 7.0 0.2 −2.5 134
Slovenia 0.0 −0.1 −1.4 2.9 0.0 1.3 54
South Africa 6 −4 −21 4 33 18 52
Spain −5 7 1 44 6 53 −8
Sri Lanka 0.0 1.8 0.1 1.6 0.3 3.8 −106
Sudan −1.4 1.8 −0.8 0.9 0.6 1.1 31
Sweden −1 −4 −10 9 0 −6 166
Switzerland −0.4 −0.7 −1.7 2.8 0.8 0.8 77
Syrian Arab Rep. −1.7 0.0 4.1 0.1 5.1 7.6 −46
Tajikistan 0.15 −0.23 −0.51 −0.25 0.34 −0.50 617
Tanzania 0.36 −0.74 0.03 0.19 0.31 0.13 73
Thailand −8 6 20 −5 8 21 −507
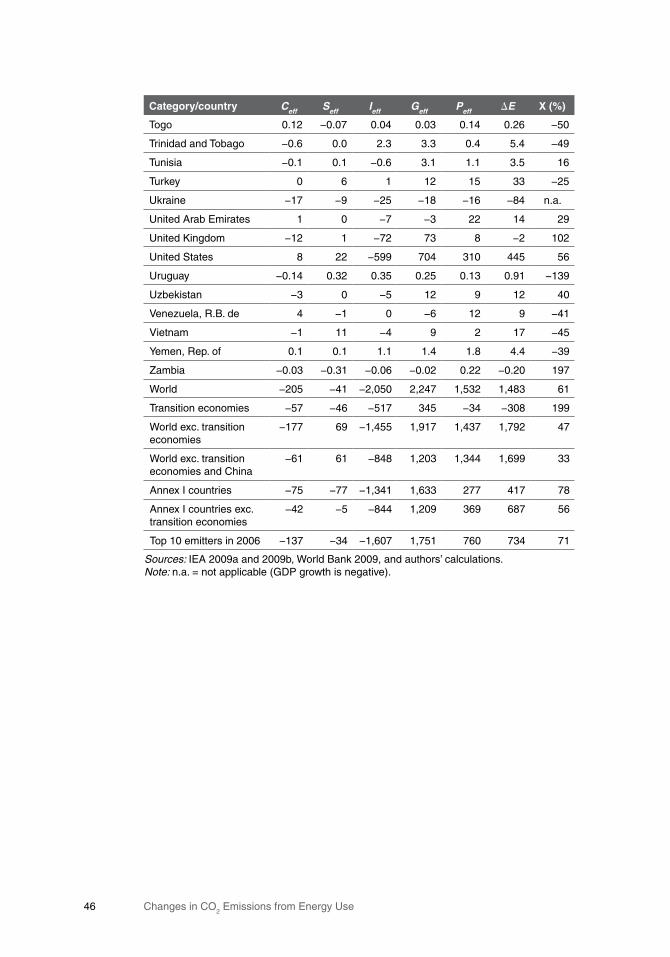
Changes in CO2 Emissions from Energy Use46
Category/country Ceff Seff Ieff Geff Peff E X(%)
Togo 0.12 −0.07 0.04 0.03 0.14 0.26 −50
Trinidad and Tobago −0.6 0.0 2.3 3.3 0.4 5.4 −49
Tunisia −0.1 0.1 −0.6 3.1 1.1 3.5 16
Turkey 0 6 1 12 15 33 −25
Ukraine −17 −9 −25 −18 −16 −84 n.a.
United Arab Emirates 1 0 −7 −3 22 14 29
United Kingdom −12 1 −72 73 8 −2 102
United States 8 22 −599 704 310 445 56
Uruguay −0.14 0.32 0.35 0.25 0.13 0.91 −139
Uzbekistan −3 0 −5 12 9 12 40
Venezuela, R.B. de 4 −1 0 −6 12 9 −41
Vietnam −1 11 −4 9 2 17 −45
Yemen, Rep. of 0.1 0.1 1.1 1.4 1.8 4.4 −39
Zambia −0.03 −0.31 −0.06 −0.02 0.22 −0.20 197
World −205 −41 −2,050 2,247 1,532 1,483 61
Transition economies −57 −46 −517 345 −34 −308 199
World exc. transition economies
−177 69 −1,455 1,917 1,437 1,792 47
World exc. transition economies and China
−61 61 −848 1,203 1,344 1,699 33
Annex I countries −75 −77 −1,341 1,633 277 417 78
Annex I countries exc. transition economies
−42 −5 −844 1,209 369 687 56
Top 10 emitters in 2006 −137 −34 −1,607 1,751 760 734 71
Sources: IEA 2009a and 2009b, World Bank 2009, and authors’ calculations.Note: n.a. = not applicable (GDP growth is negative).

47Extractive Industries for Development Series
TableB.3 DecompositionAnalysisbetween1999–2001and2004–06BasedonIEADatamillion tonnes of CO2
Category/country Ceff Seff Ieff Geff Peff E X(%)
Albania −0.33 0.48 −0.17 0.86 0.08 0.92 2
Algeria 2 0 −3 11 6 16 6
Angola 0.6 0.7 −1.9 2.3 0.9 2.7 17
Argentina 2 1 −5 8 7 13 13
Armenia 0.02 −0.09 −1.33 2.10 −0.08 0.64 68
Australia 5 3 −23 36 23 43 26
Austria 1 −1 4 4 2 10 −71
Azerbaijan −1 0 −14 18 1 3 83
Bangladesh 0 3 −1 5 3 10 −21
Belarus −2 1 −15 23 −1 5 74
Belgium −6 −1 −10 8 2 −6 156
Benin 0.1 0.6 0.0 0.1 0.3 1.2 −196
Bolivia 1.7 0.2 0.1 0.6 1.0 3.6 −131
Bosnia & Herzegovina −1.1 1.1 0.0 3.1 0.4 3.5 1
Botswana 0.05 0.13 −0.99 0.89 0.25 0.33 71
Brazil 3 −22 −4 25 22 24 49
Brunei Darussalam 0.36 0.00 −0.11 0.01 0.56 0.83 −45
Bulgaria 1 0 −9 13 −2 3 75
Cambodia −0.1 0.9 −0.8 1.1 0.3 1.3 5
Cameroon −0.02 0.11 −0.22 0.19 0.32 0.39 25
Canada −14 −6 −28 47 26 25 65
Chile 0.6 −2.2 −4.7 8.5 3.1 5.3 54
China −62 286 −50 1,714 127 2,015 −9
Colombia −3.3 0.0 −8.8 7.5 4.5 −0.2 102
Congo, Dem. Rep. of 0.15 −0.28 −0.08 0.06 0.32 0.17 55
Congo, Rep. of −0.13 0.31 0.09 0.08 0.09 0.45 −163
Costa Rica 0.2 −0.5 0.2 0.6 0.5 1.0 12
Côte d’Ivoire −0.55 −0.10 0.52 −0.63 0.54 −0.22 −142
Croatia 0.3 −0.1 −2.2 4.6 −0.1 2.4 46
Cyprus 0.36 −0.02 −0.60 0.66 0.40 0.80 25
Czech Republic −1 −11 −7 23 0 3 86
Denmark 0.4 −2.5 −2.7 3.1 0.8 −0.9 123
Dominican Republic 1.0 −0.3 −3.0 1.9 1.4 0.9 72
Ecuador −1.1 1.0 0.2 3.9 1.2 5.2 −1
Egypt, Arab Rep. of 3 2 9 12 12 38 −59
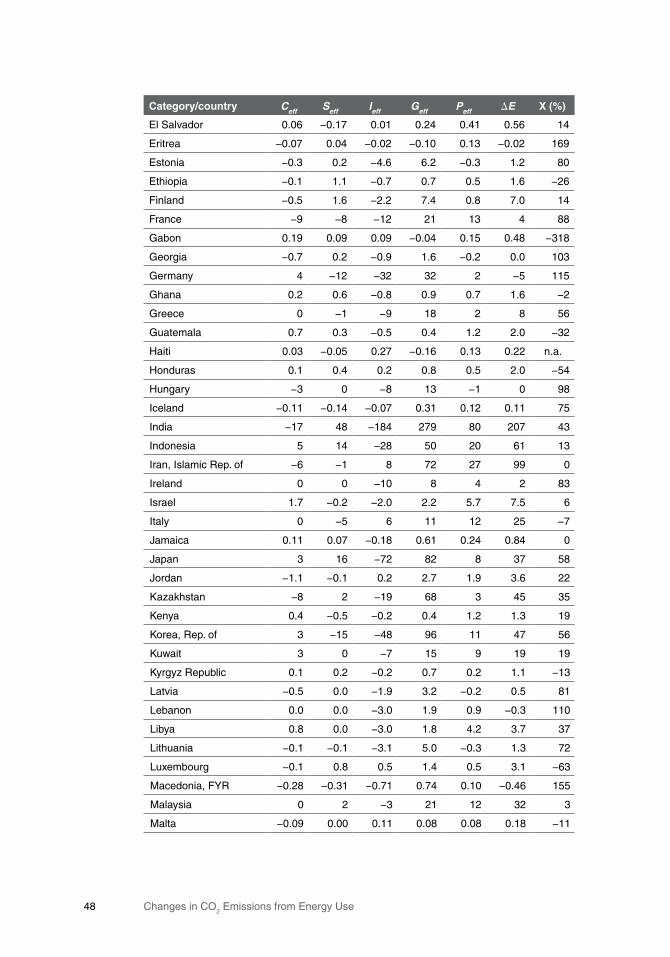
Changes in CO2 Emissions from Energy Use48
Category/country Ceff Seff Ieff Geff Peff E X(%)
El Salvador 0.06 −0.17 0.01 0.24 0.41 0.56 14
Eritrea −0.07 0.04 −0.02 −0.10 0.13 −0.02 169
Estonia −0.3 0.2 −4.6 6.2 −0.3 1.2 80
Ethiopia −0.1 1.1 −0.7 0.7 0.5 1.6 −26
Finland −0.5 1.6 −2.2 7.4 0.8 7.0 14
France −9 −8 −12 21 13 4 88
Gabon 0.19 0.09 0.09 −0.04 0.15 0.48 −318
Georgia −0.7 0.2 −0.9 1.6 −0.2 0.0 103
Germany 4 −12 −32 32 2 −5 115
Ghana 0.2 0.6 −0.8 0.9 0.7 1.6 −2
Greece 0 −1 −9 18 2 8 56
Guatemala 0.7 0.3 −0.5 0.4 1.2 2.0 −32
Haiti 0.03 −0.05 0.27 −0.16 0.13 0.22 n.a.
Honduras 0.1 0.4 0.2 0.8 0.5 2.0 −54
Hungary −3 0 −8 13 −1 0 98
Iceland −0.11 −0.14 −0.07 0.31 0.12 0.11 75
India −17 48 −184 279 80 207 43
Indonesia 5 14 −28 50 20 61 13
Iran, Islamic Rep. of −6 −1 8 72 27 99 0
Ireland 0 0 −10 8 4 2 83
Israel 1.7 −0.2 −2.0 2.2 5.7 7.5 6
Italy 0 −5 6 11 12 25 −7
Jamaica 0.11 0.07 −0.18 0.61 0.24 0.84 0
Japan 3 16 −72 82 8 37 58
Jordan −1.1 −0.1 0.2 2.7 1.9 3.6 22
Kazakhstan −8 2 −19 68 3 45 35
Kenya 0.4 −0.5 −0.2 0.4 1.2 1.3 19
Korea, Rep. of 3 −15 −48 96 11 47 56
Kuwait 3 0 −7 15 9 19 19
Kyrgyz Republic 0.1 0.2 −0.2 0.7 0.2 1.1 −13
Latvia −0.5 0.0 −1.9 3.2 −0.2 0.5 81
Lebanon 0.0 0.0 −3.0 1.9 0.9 −0.3 110
Libya 0.8 0.0 −3.0 1.8 4.2 3.7 37
Lithuania −0.1 −0.1 −3.1 5.0 −0.3 1.3 72
Luxembourg −0.1 0.8 0.5 1.4 0.5 3.1 −63
Macedonia, FYR −0.28 −0.31 −0.71 0.74 0.10 −0.46 155
Malaysia 0 2 −3 21 12 32 3
Malta −0.09 0.00 0.11 0.08 0.08 0.18 −11
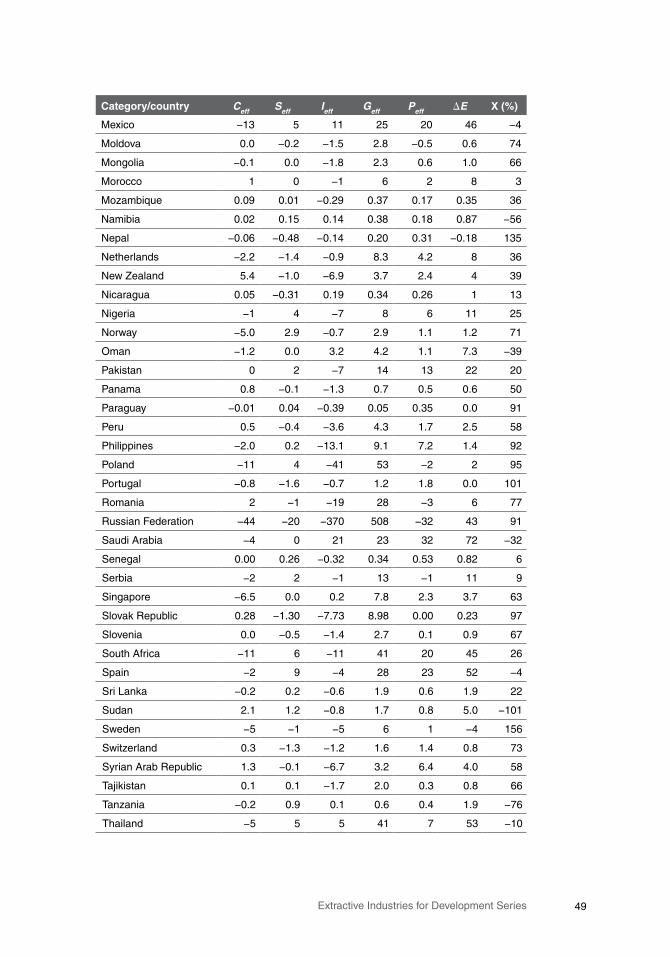
49Extractive Industries for Development Series
Category/country Ceff Seff Ieff Geff Peff E X(%)
Mexico −13 5 11 25 20 46 −4
Moldova 0.0 −0.2 −1.5 2.8 −0.5 0.6 74
Mongolia −0.1 0.0 −1.8 2.3 0.6 1.0 66
Morocco 1 0 −1 6 2 8 3
Mozambique 0.09 0.01 −0.29 0.37 0.17 0.35 36
Namibia 0.02 0.15 0.14 0.38 0.18 0.87 −56
Nepal −0.06 −0.48 −0.14 0.20 0.31 −0.18 135
Netherlands −2.2 −1.4 −0.9 8.3 4.2 8 36
New Zealand 5.4 −1.0 −6.9 3.7 2.4 4 39
Nicaragua 0.05 −0.31 0.19 0.34 0.26 1 13
Nigeria −1 4 −7 8 6 11 25
Norway −5.0 2.9 −0.7 2.9 1.1 1.2 71
Oman −1.2 0.0 3.2 4.2 1.1 7.3 −39
Pakistan 0 2 −7 14 13 22 20
Panama 0.8 −0.1 −1.3 0.7 0.5 0.6 50
Paraguay −0.01 0.04 −0.39 0.05 0.35 0.0 91
Peru 0.5 −0.4 −3.6 4.3 1.7 2.5 58
Philippines −2.0 0.2 −13.1 9.1 7.2 1.4 92
Poland −11 4 −41 53 −2 2 95
Portugal −0.8 −1.6 −0.7 1.2 1.8 0.0 101
Romania 2 −1 −19 28 −3 6 77
Russian Federation −44 −20 −370 508 −32 43 91
Saudi Arabia −4 0 21 23 32 72 −32
Senegal 0.00 0.26 −0.32 0.34 0.53 0.82 6
Serbia −2 2 −1 13 −1 11 9
Singapore −6.5 0.0 0.2 7.8 2.3 3.7 63
Slovak Republic 0.28 −1.30 −7.73 8.98 0.00 0.23 97
Slovenia 0.0 −0.5 −1.4 2.7 0.1 0.9 67
South Africa −11 6 −11 41 20 45 26
Spain −2 9 −4 28 23 52 −4
Sri Lanka −0.2 0.2 −0.6 1.9 0.6 1.9 22
Sudan 2.1 1.2 −0.8 1.7 0.8 5.0 −101
Sweden −5 −1 −5 6 1 −4 156
Switzerland 0.3 −1.3 −1.2 1.6 1.4 0.8 73
Syrian Arab Republic 1.3 −0.1 −6.7 3.2 6.4 4.0 58
Tajikistan 0.1 0.1 −1.7 2.0 0.3 0.8 66
Tanzania −0.2 0.9 0.1 0.6 0.4 1.9 −76
Thailand −5 5 5 41 7 53 −10
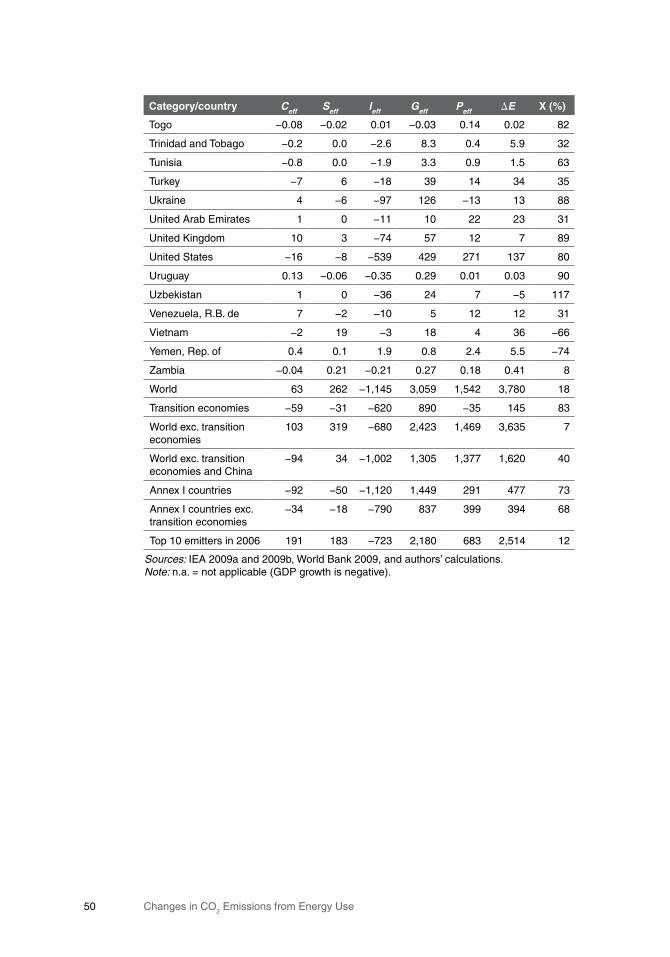
Changes in CO2 Emissions from Energy Use50
Category/country Ceff Seff Ieff Geff Peff E X(%)
Togo −0.08 −0.02 0.01 −0.03 0.14 0.02 82
Trinidad and Tobago −0.2 0.0 −2.6 8.3 0.4 5.9 32
Tunisia −0.8 0.0 −1.9 3.3 0.9 1.5 63
Turkey −7 6 −18 39 14 34 35
Ukraine 4 −6 −97 126 −13 13 88
United Arab Emirates 1 0 −11 10 22 23 31
United Kingdom 10 3 −74 57 12 7 89
United States −16 −8 −539 429 271 137 80
Uruguay 0.13 −0.06 −0.35 0.29 0.01 0.03 90
Uzbekistan 1 0 −36 24 7 −5 117
Venezuela, R.B. de 7 −2 −10 5 12 12 31
Vietnam −2 19 −3 18 4 36 −66
Yemen, Rep. of 0.4 0.1 1.9 0.8 2.4 5.5 −74
Zambia −0.04 0.21 −0.21 0.27 0.18 0.41 8
World 63 262 −1,145 3,059 1,542 3,780 18
Transition economies −59 −31 −620 890 −35 145 83
World exc. transition economies
103 319 −680 2,423 1,469 3,635 7
World exc. transition economies and China
−94 34 −1,002 1,305 1,377 1,620 40
Annex I countries −92 −50 −1,120 1,449 291 477 73
Annex I countries exc. transition economies
−34 −18 −790 837 399 394 68
Top 10 emitters in 2006 191 183 −723 2,180 683 2,514 12
Sources: IEA 2009a and 2009b, World Bank 2009, and authors’ calculations.Note: n.a. = not applicable (GDP growth is negative).
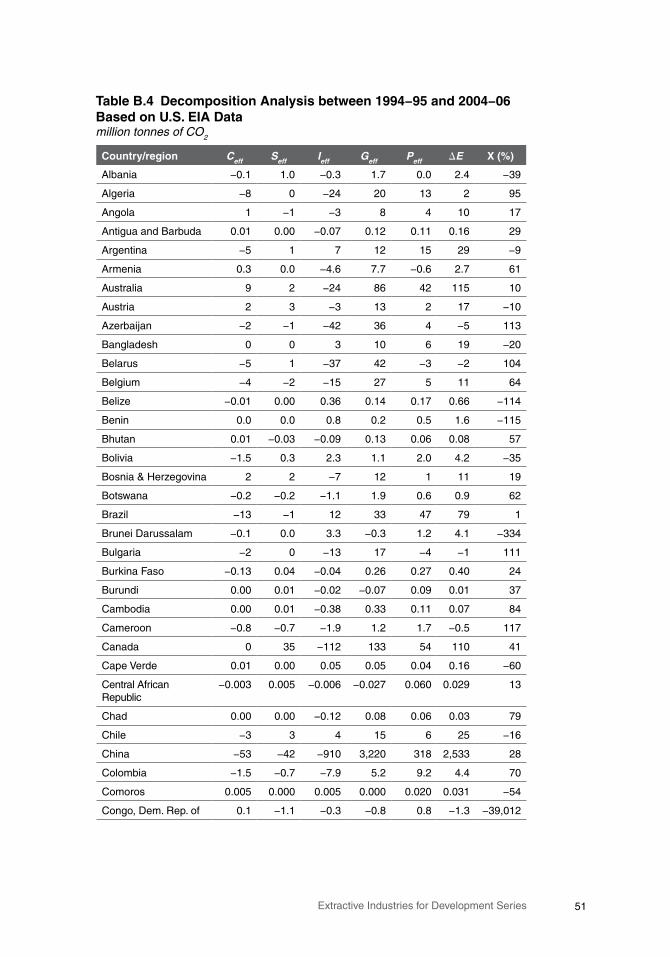
51Extractive Industries for Development Series
TableB.4 DecompositionAnalysisbetween1994−95and2004−06BasedonU.S.EIADatamillion tonnes of CO2
Country/region Ceff Seff Ieff Geff Peff E X(%)
Albania −0.1 1.0 −0.3 1.7 0.0 2.4 −39
Algeria −8 0 −24 20 13 2 95
Angola 1 −1 −3 8 4 10 17
Antigua and Barbuda 0.01 0.00 −0.07 0.12 0.11 0.16 29
Argentina −5 1 7 12 15 29 −9
Armenia 0.3 0.0 −4.6 7.7 −0.6 2.7 61
Australia 9 2 −24 86 42 115 10
Austria 2 3 −3 13 2 17 −10
Azerbaijan −2 −1 −42 36 4 −5 113
Bangladesh 0 0 3 10 6 19 −20
Belarus −5 1 −37 42 −3 −2 104
Belgium −4 −2 −15 27 5 11 64
Belize −0.01 0.00 0.36 0.14 0.17 0.66 −114
Benin 0.0 0.0 0.8 0.2 0.5 1.6 −115
Bhutan 0.01 −0.03 −0.09 0.13 0.06 0.08 57
Bolivia −1.5 0.3 2.3 1.1 2.0 4.2 −35
Bosnia & Herzegovina 2 2 −7 12 1 11 19
Botswana −0.2 −0.2 −1.1 1.9 0.6 0.9 62
Brazil −13 −1 12 33 47 79 1
Brunei Darussalam −0.1 0.0 3.3 −0.3 1.2 4.1 −334
Bulgaria −2 0 −13 17 −4 −1 111
Burkina Faso −0.13 0.04 −0.04 0.26 0.27 0.40 24
Burundi 0.00 0.01 −0.02 −0.07 0.09 0.01 37
Cambodia 0.00 0.01 −0.38 0.33 0.11 0.07 84
Cameroon −0.8 −0.7 −1.9 1.2 1.7 −0.5 117
Canada 0 35 −112 133 54 110 41
Cape Verde 0.01 0.00 0.05 0.05 0.04 0.16 −60
Central African Republic
−0.003 0.005 −0.006 −0.027 0.060 0.029 13
Chad 0.00 0.00 −0.12 0.08 0.06 0.03 79
Chile −3 3 4 15 6 25 −16
China −53 −42 −910 3,220 318 2,533 28
Colombia −1.5 −0.7 −7.9 5.2 9.2 4.4 70
Comoros 0.005 0.000 0.005 0.000 0.020 0.031 −54
Congo, Dem. Rep. of 0.1 −1.1 −0.3 −0.8 0.8 −1.3 −39,012
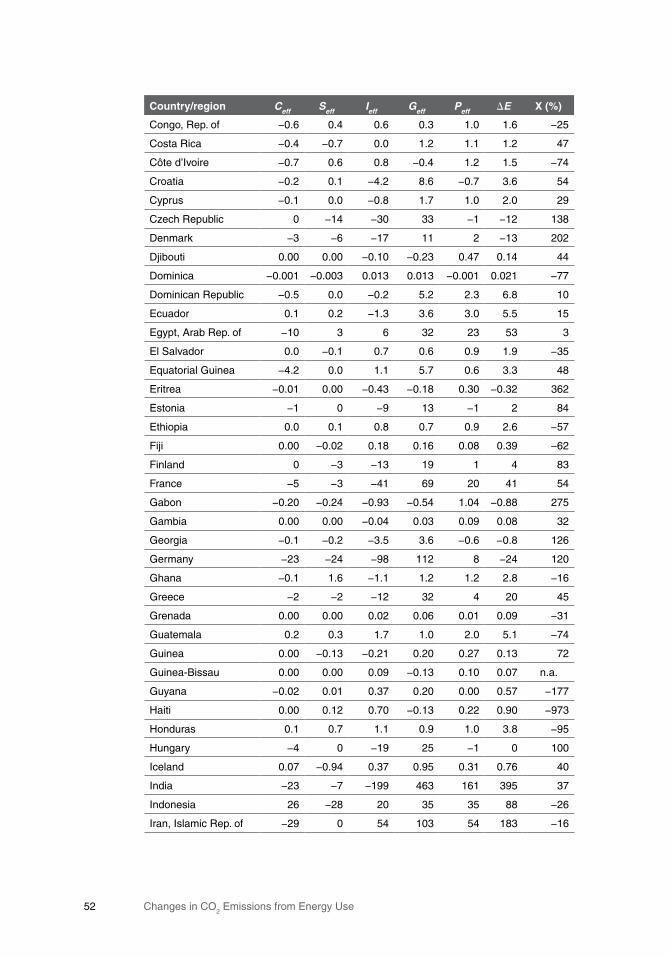
Changes in CO2 Emissions from Energy Use52
Country/region Ceff Seff Ieff Geff Peff E X(%)
Congo, Rep. of −0.6 0.4 0.6 0.3 1.0 1.6 −25
Costa Rica −0.4 −0.7 0.0 1.2 1.1 1.2 47
Côte d’Ivoire −0.7 0.6 0.8 −0.4 1.2 1.5 −74
Croatia −0.2 0.1 −4.2 8.6 −0.7 3.6 54
Cyprus −0.1 0.0 −0.8 1.7 1.0 2.0 29
Czech Republic 0 −14 −30 33 −1 −12 138
Denmark −3 −6 −17 11 2 −13 202
Djibouti 0.00 0.00 −0.10 −0.23 0.47 0.14 44
Dominica −0.001 −0.003 0.013 0.013 −0.001 0.021 −77
Dominican Republic −0.5 0.0 −0.2 5.2 2.3 6.8 10
Ecuador 0.1 0.2 −1.3 3.6 3.0 5.5 15
Egypt, Arab Rep. of −10 3 6 32 23 53 3
El Salvador 0.0 −0.1 0.7 0.6 0.9 1.9 −35
Equatorial Guinea −4.2 0.0 1.1 5.7 0.6 3.3 48
Eritrea −0.01 0.00 −0.43 −0.18 0.30 −0.32 362
Estonia −1 0 −9 13 −1 2 84
Ethiopia 0.0 0.1 0.8 0.7 0.9 2.6 −57
Fiji 0.00 −0.02 0.18 0.16 0.08 0.39 −62
Finland 0 −3 −13 19 1 4 83
France −5 −3 −41 69 20 41 54
Gabon −0.20 −0.24 −0.93 −0.54 1.04 −0.88 275
Gambia 0.00 0.00 −0.04 0.03 0.09 0.08 32
Georgia −0.1 −0.2 −3.5 3.6 −0.6 −0.8 126
Germany −23 −24 −98 112 8 −24 120
Ghana −0.1 1.6 −1.1 1.2 1.2 2.8 −16
Greece −2 −2 −12 32 4 20 45
Grenada 0.00 0.00 0.02 0.06 0.01 0.09 −31
Guatemala 0.2 0.3 1.7 1.0 2.0 5.1 −74
Guinea 0.00 −0.13 −0.21 0.20 0.27 0.13 72
Guinea-Bissau 0.00 0.00 0.09 −0.13 0.10 0.07 n.a.
Guyana −0.02 0.01 0.37 0.20 0.00 0.57 −177
Haiti 0.00 0.12 0.70 −0.13 0.22 0.90 −973
Honduras 0.1 0.7 1.1 0.9 1.0 3.8 −95
Hungary −4 0 −19 25 −1 0 100
Iceland 0.07 −0.94 0.37 0.95 0.31 0.76 40
India −23 −7 −199 463 161 395 37
Indonesia 26 −28 20 35 35 88 −26
Iran, Islamic Rep. of −29 0 54 103 54 183 −16
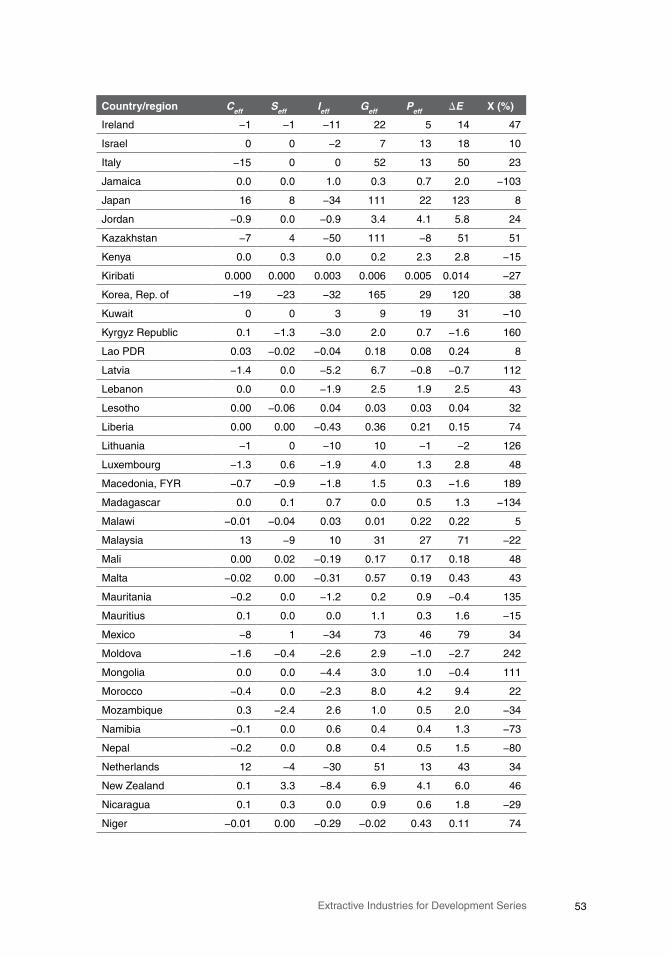
53Extractive Industries for Development Series
Country/region Ceff Seff Ieff Geff Peff E X(%)
Ireland −1 −1 −11 22 5 14 47
Israel 0 0 −2 7 13 18 10
Italy −15 0 0 52 13 50 23
Jamaica 0.0 0.0 1.0 0.3 0.7 2.0 −103
Japan 16 8 −34 111 22 123 8
Jordan −0.9 0.0 −0.9 3.4 4.1 5.8 24
Kazakhstan −7 4 −50 111 −8 51 51
Kenya 0.0 0.3 0.0 0.2 2.3 2.8 −15
Kiribati 0.000 0.000 0.003 0.006 0.005 0.014 −27
Korea, Rep. of −19 −23 −32 165 29 120 38
Kuwait 0 0 3 9 19 31 −10
Kyrgyz Republic 0.1 −1.3 −3.0 2.0 0.7 −1.6 160
Lao PDR 0.03 −0.02 −0.04 0.18 0.08 0.24 8
Latvia −1.4 0.0 −5.2 6.7 −0.8 −0.7 112
Lebanon 0.0 0.0 −1.9 2.5 1.9 2.5 43
Lesotho 0.00 −0.06 0.04 0.03 0.03 0.04 32
Liberia 0.00 0.00 −0.43 0.36 0.21 0.15 74
Lithuania −1 0 −10 10 −1 −2 126
Luxembourg −1.3 0.6 −1.9 4.0 1.3 2.8 48
Macedonia, FYR −0.7 −0.9 −1.8 1.5 0.3 −1.6 189
Madagascar 0.0 0.1 0.7 0.0 0.5 1.3 −134
Malawi −0.01 −0.04 0.03 0.01 0.22 0.22 5
Malaysia 13 −9 10 31 27 71 −22
Mali 0.00 0.02 −0.19 0.17 0.17 0.18 48
Malta −0.02 0.00 −0.31 0.57 0.19 0.43 43
Mauritania −0.2 0.0 −1.2 0.2 0.9 −0.4 135
Mauritius 0.1 0.0 0.0 1.1 0.3 1.6 −15
Mexico −8 1 −34 73 46 79 34
Moldova −1.6 −0.4 −2.6 2.9 −1.0 −2.7 242
Mongolia 0.0 0.0 −4.4 3.0 1.0 −0.4 111
Morocco −0.4 0.0 −2.3 8.0 4.2 9.4 22
Mozambique 0.3 −2.4 2.6 1.0 0.5 2.0 −34
Namibia −0.1 0.0 0.6 0.4 0.4 1.3 −73
Nepal −0.2 0.0 0.8 0.4 0.5 1.5 −80
Netherlands 12 −4 −30 51 13 43 34
New Zealand 0.1 3.3 −8.4 6.9 4.1 6.0 46
Nicaragua 0.1 0.3 0.0 0.9 0.6 1.8 −29
Niger −0.01 0.00 −0.29 −0.02 0.43 0.11 74
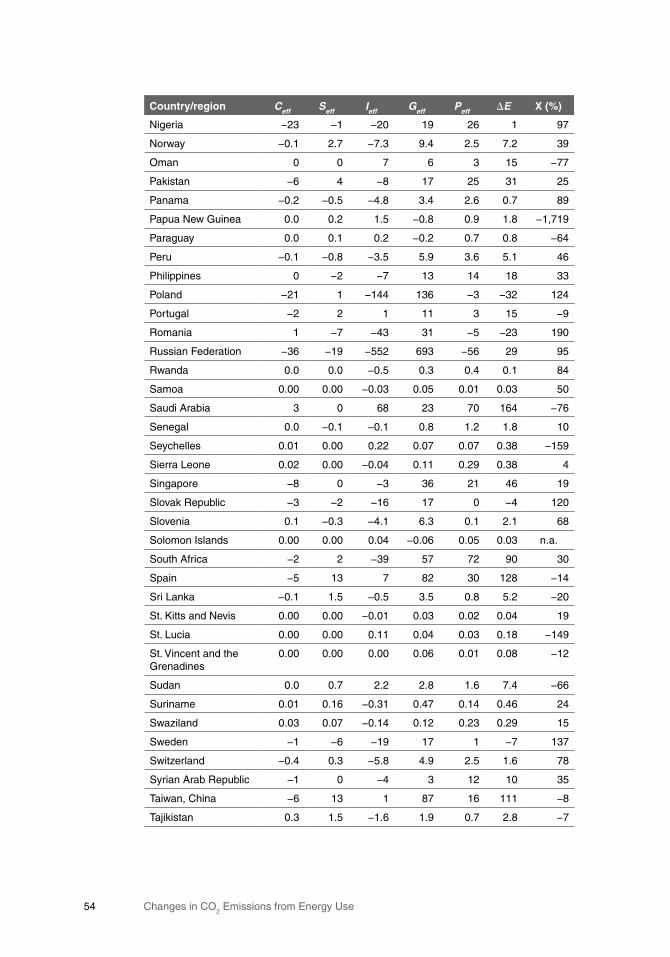
Changes in CO2 Emissions from Energy Use54
Country/region Ceff Seff Ieff Geff Peff E X(%)
Nigeria −23 −1 −20 19 26 1 97
Norway −0.1 2.7 −7.3 9.4 2.5 7.2 39
Oman 0 0 7 6 3 15 −77
Pakistan −6 4 −8 17 25 31 25
Panama −0.2 −0.5 −4.8 3.4 2.6 0.7 89
Papua New Guinea 0.0 0.2 1.5 −0.8 0.9 1.8 −1,719
Paraguay 0.0 0.1 0.2 −0.2 0.7 0.8 −64
Peru −0.1 −0.8 −3.5 5.9 3.6 5.1 46
Philippines 0 −2 −7 13 14 18 33
Poland −21 1 −144 136 −3 −32 124
Portugal −2 2 1 11 3 15 −9
Romania 1 −7 −43 31 −5 −23 190
Russian Federation −36 −19 −552 693 −56 29 95
Rwanda 0.0 0.0 −0.5 0.3 0.4 0.1 84
Samoa 0.00 0.00 −0.03 0.05 0.01 0.03 50
Saudi Arabia 3 0 68 23 70 164 −76
Senegal 0.0 −0.1 −0.1 0.8 1.2 1.8 10
Seychelles 0.01 0.00 0.22 0.07 0.07 0.38 −159
Sierra Leone 0.02 0.00 −0.04 0.11 0.29 0.38 4
Singapore −8 0 −3 36 21 46 19
Slovak Republic −3 −2 −16 17 0 −4 120
Slovenia 0.1 −0.3 −4.1 6.3 0.1 2.1 68
Solomon Islands 0.00 0.00 0.04 −0.06 0.05 0.03 n.a.
South Africa −2 2 −39 57 72 90 30
Spain −5 13 7 82 30 128 −14
Sri Lanka −0.1 1.5 −0.5 3.5 0.8 5.2 −20
St. Kitts and Nevis 0.00 0.00 −0.01 0.03 0.02 0.04 19
St. Lucia 0.00 0.00 0.11 0.04 0.03 0.18 −149
St. Vincent and the Grenadines
0.00 0.00 0.00 0.06 0.01 0.08 −12
Sudan 0.0 0.7 2.2 2.8 1.6 7.4 −66
Suriname 0.01 0.16 −0.31 0.47 0.14 0.46 24
Swaziland 0.03 0.07 −0.14 0.12 0.23 0.29 15
Sweden −1 −6 −19 17 1 −7 137
Switzerland −0.4 0.3 −5.8 4.9 2.5 1.6 78
Syrian Arab Republic −1 0 −4 3 12 10 35
Taiwan, China −6 13 1 87 16 111 −8
Tajikistan 0.3 1.5 −1.6 1.9 0.7 2.8 −7
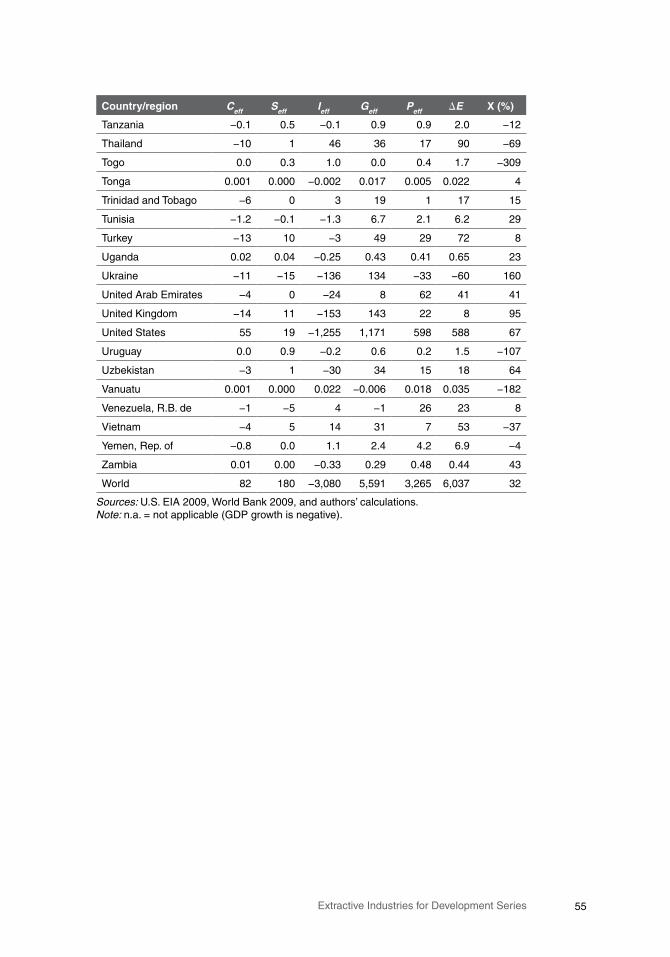
55Extractive Industries for Development Series
Country/region Ceff Seff Ieff Geff Peff E X(%)
Tanzania −0.1 0.5 −0.1 0.9 0.9 2.0 −12
Thailand −10 1 46 36 17 90 −69
Togo 0.0 0.3 1.0 0.0 0.4 1.7 −309
Tonga 0.001 0.000 −0.002 0.017 0.005 0.022 4
Trinidad and Tobago −6 0 3 19 1 17 15
Tunisia −1.2 −0.1 −1.3 6.7 2.1 6.2 29
Turkey −13 10 −3 49 29 72 8
Uganda 0.02 0.04 −0.25 0.43 0.41 0.65 23
Ukraine −11 −15 −136 134 −33 −60 160
United Arab Emirates −4 0 −24 8 62 41 41
United Kingdom −14 11 −153 143 22 8 95
United States 55 19 −1,255 1,171 598 588 67
Uruguay 0.0 0.9 −0.2 0.6 0.2 1.5 −107
Uzbekistan −3 1 −30 34 15 18 64
Vanuatu 0.001 0.000 0.022 −0.006 0.018 0.035 −182
Venezuela, R.B. de −1 −5 4 −1 26 23 8
Vietnam −4 5 14 31 7 53 −37
Yemen, Rep. of −0.8 0.0 1.1 2.4 4.2 6.9 −4
Zambia 0.01 0.00 −0.33 0.29 0.48 0.44 43
World 82 180 −3,080 5,591 3,265 6,037 32
Sources: U.S. EIA 2009, World Bank 2009, and authors’ calculations.Note: n.a. = not applicable (GDP growth is negative).
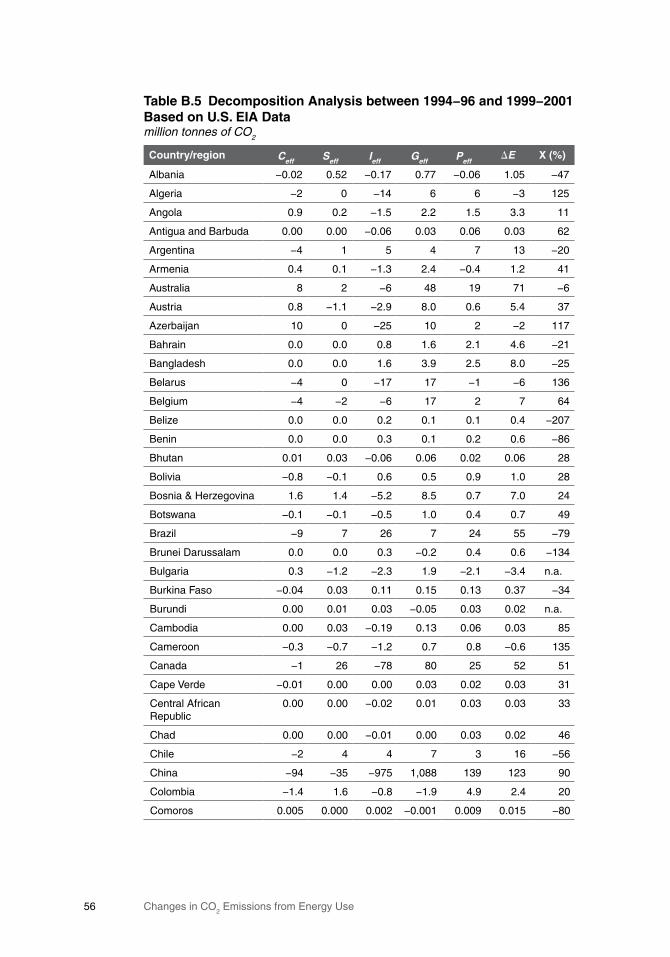
Changes in CO2 Emissions from Energy Use56
TableB.5 DecompositionAnalysisbetween1994−96and1999−2001BasedonU.S.EIADatamillion tonnes of CO2
Country/region Ceff Seff Ieff Geff PeffE X(%)
Albania −0.02 0.52 −0.17 0.77 −0.06 1.05 −47
Algeria −2 0 −14 6 6 −3 125
Angola 0.9 0.2 −1.5 2.2 1.5 3.3 11
Antigua and Barbuda 0.00 0.00 −0.06 0.03 0.06 0.03 62
Argentina −4 1 5 4 7 13 −20
Armenia 0.4 0.1 −1.3 2.4 −0.4 1.2 41
Australia 8 2 −6 48 19 71 −6
Austria 0.8 −1.1 −2.9 8.0 0.6 5.4 37
Azerbaijan 10 0 −25 10 2 −2 117
Bahrain 0.0 0.0 0.8 1.6 2.1 4.6 −21
Bangladesh 0.0 0.0 1.6 3.9 2.5 8.0 −25
Belarus −4 0 −17 17 −1 −6 136
Belgium −4 −2 −6 17 2 7 64
Belize 0.0 0.0 0.2 0.1 0.1 0.4 −207
Benin 0.0 0.0 0.3 0.1 0.2 0.6 −86
Bhutan 0.01 0.03 −0.06 0.06 0.02 0.06 28
Bolivia −0.8 −0.1 0.6 0.5 0.9 1.0 28
Bosnia & Herzegovina 1.6 1.4 −5.2 8.5 0.7 7.0 24
Botswana −0.1 −0.1 −0.5 1.0 0.4 0.7 49
Brazil −9 7 26 7 24 55 −79
Brunei Darussalam 0.0 0.0 0.3 −0.2 0.4 0.6 −134
Bulgaria 0.3 −1.2 −2.3 1.9 −2.1 −3.4 n.a.
Burkina Faso −0.04 0.03 0.11 0.15 0.13 0.37 −34
Burundi 0.00 0.01 0.03 −0.05 0.03 0.02 n.a.
Cambodia 0.00 0.03 −0.19 0.13 0.06 0.03 85
Cameroon −0.3 −0.7 −1.2 0.7 0.8 −0.6 135
Canada −1 26 −78 80 25 52 51
Cape Verde −0.01 0.00 0.00 0.03 0.02 0.03 31
Central African Republic
0.00 0.00 −0.02 0.01 0.03 0.03 33
Chad 0.00 0.00 −0.01 0.00 0.03 0.02 46
Chile −2 4 4 7 3 16 −56
China −94 −35 −975 1,088 139 123 90
Colombia −1.4 1.6 −0.8 −1.9 4.9 2.4 20
Comoros 0.005 0.000 0.002 −0.001 0.009 0.015 −80
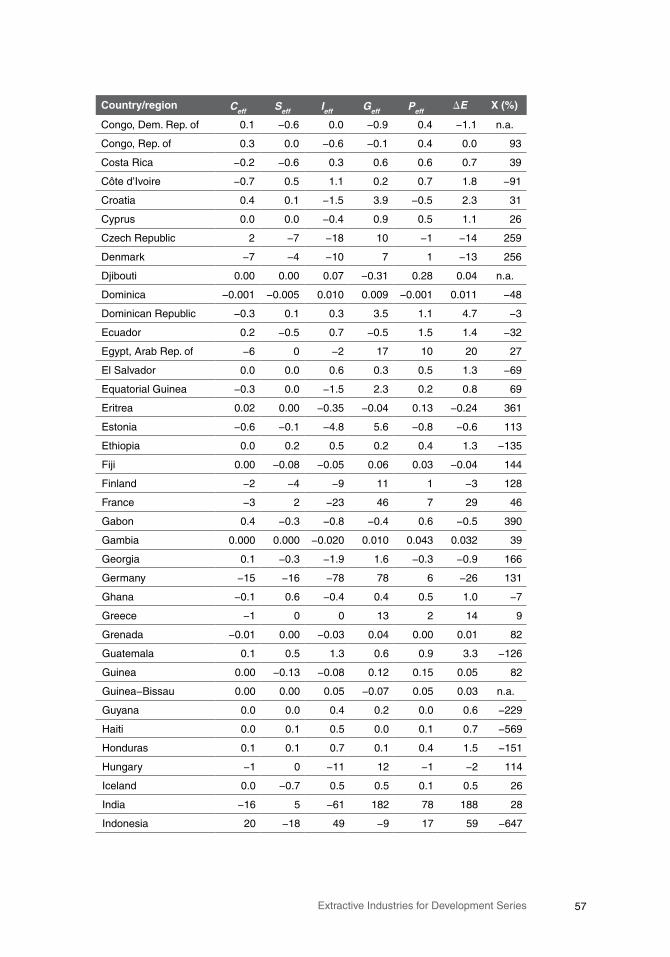
57Extractive Industries for Development Series
Country/region Ceff Seff Ieff Geff PeffE X(%)
Congo, Dem. Rep. of 0.1 −0.6 0.0 −0.9 0.4 −1.1 n.a.
Congo, Rep. of 0.3 0.0 −0.6 −0.1 0.4 0.0 93
Costa Rica −0.2 −0.6 0.3 0.6 0.6 0.7 39
Côte d’Ivoire −0.7 0.5 1.1 0.2 0.7 1.8 −91
Croatia 0.4 0.1 −1.5 3.9 −0.5 2.3 31
Cyprus 0.0 0.0 −0.4 0.9 0.5 1.1 26
Czech Republic 2 −7 −18 10 −1 −14 259
Denmark −7 −4 −10 7 1 −13 256
Djibouti 0.00 0.00 0.07 −0.31 0.28 0.04 n.a.
Dominica −0.001 −0.005 0.010 0.009 −0.001 0.011 −48
Dominican Republic −0.3 0.1 0.3 3.5 1.1 4.7 −3
Ecuador 0.2 −0.5 0.7 −0.5 1.5 1.4 −32
Egypt, Arab Rep. of −6 0 −2 17 10 20 27
El Salvador 0.0 0.0 0.6 0.3 0.5 1.3 −69
Equatorial Guinea −0.3 0.0 −1.5 2.3 0.2 0.8 69
Eritrea 0.02 0.00 −0.35 −0.04 0.13 −0.24 361
Estonia −0.6 −0.1 −4.8 5.6 −0.8 −0.6 113
Ethiopia 0.0 0.2 0.5 0.2 0.4 1.3 −135
Fiji 0.00 −0.08 −0.05 0.06 0.03 −0.04 144
Finland −2 −4 −9 11 1 −3 128
France −3 2 −23 46 7 29 46
Gabon 0.4 −0.3 −0.8 −0.4 0.6 −0.5 390
Gambia 0.000 0.000 −0.020 0.010 0.043 0.032 39
Georgia 0.1 −0.3 −1.9 1.6 −0.3 −0.9 166
Germany −15 −16 −78 78 6 −26 131
Ghana −0.1 0.6 −0.4 0.4 0.5 1.0 −7
Greece −1 0 0 13 2 14 9
Grenada −0.01 0.00 −0.03 0.04 0.00 0.01 82
Guatemala 0.1 0.5 1.3 0.6 0.9 3.3 −126
Guinea 0.00 −0.13 −0.08 0.12 0.15 0.05 82
Guinea−Bissau 0.00 0.00 0.05 −0.07 0.05 0.03 n.a.
Guyana 0.0 0.0 0.4 0.2 0.0 0.6 −229
Haiti 0.0 0.1 0.5 0.0 0.1 0.7 −569
Honduras 0.1 0.1 0.7 0.1 0.4 1.5 −151
Hungary −1 0 −11 12 −1 −2 114
Iceland 0.0 −0.7 0.5 0.5 0.1 0.5 26
India −16 5 −61 182 78 188 28
Indonesia 20 −18 49 −9 17 59 −647
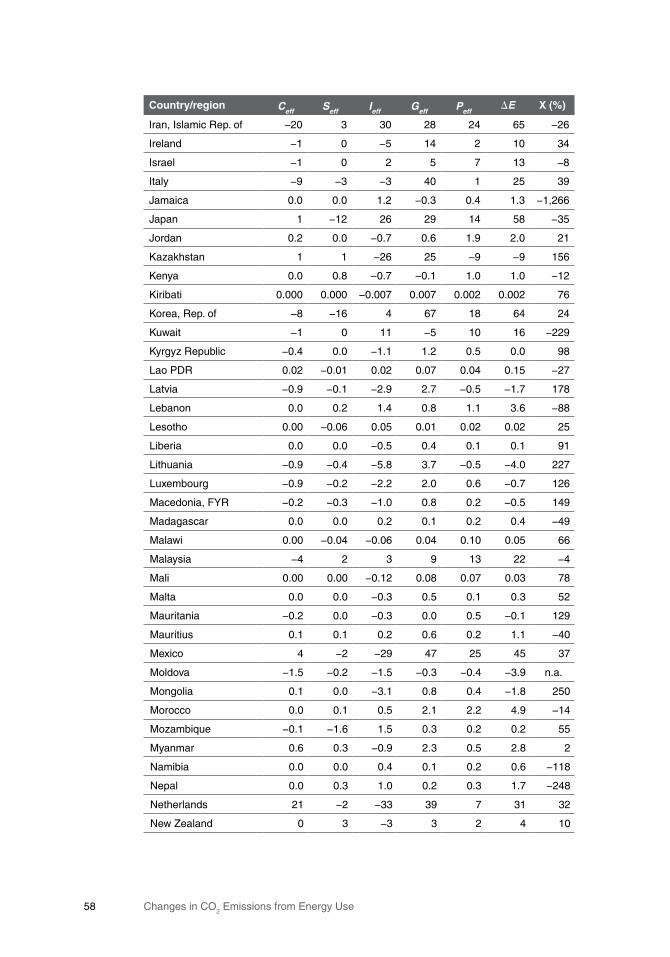
Changes in CO2 Emissions from Energy Use58
Country/region Ceff Seff Ieff Geff PeffE X(%)
Iran, Islamic Rep. of −20 3 30 28 24 65 −26
Ireland −1 0 −5 14 2 10 34
Israel −1 0 2 5 7 13 −8
Italy −9 −3 −3 40 1 25 39
Jamaica 0.0 0.0 1.2 −0.3 0.4 1.3 −1,266
Japan 1 −12 26 29 14 58 −35
Jordan 0.2 0.0 −0.7 0.6 1.9 2.0 21
Kazakhstan 1 1 −26 25 −9 −9 156
Kenya 0.0 0.8 −0.7 −0.1 1.0 1.0 −12
Kiribati 0.000 0.000 −0.007 0.007 0.002 0.002 76
Korea, Rep. of −8 −16 4 67 18 64 24
Kuwait −1 0 11 −5 10 16 −229
Kyrgyz Republic −0.4 0.0 −1.1 1.2 0.5 0.0 98
Lao PDR 0.02 −0.01 0.02 0.07 0.04 0.15 −27
Latvia −0.9 −0.1 −2.9 2.7 −0.5 −1.7 178
Lebanon 0.0 0.2 1.4 0.8 1.1 3.6 −88
Lesotho 0.00 −0.06 0.05 0.01 0.02 0.02 25
Liberia 0.0 0.0 −0.5 0.4 0.1 0.1 91
Lithuania −0.9 −0.4 −5.8 3.7 −0.5 −4.0 227
Luxembourg −0.9 −0.2 −2.2 2.0 0.6 −0.7 126
Macedonia, FYR −0.2 −0.3 −1.0 0.8 0.2 −0.5 149
Madagascar 0.0 0.0 0.2 0.1 0.2 0.4 −49
Malawi 0.00 −0.04 −0.06 0.04 0.10 0.05 66
Malaysia −4 2 3 9 13 22 −4
Mali 0.00 0.00 −0.12 0.08 0.07 0.03 78
Malta 0.0 0.0 −0.3 0.5 0.1 0.3 52
Mauritania −0.2 0.0 −0.3 0.0 0.5 −0.1 129
Mauritius 0.1 0.1 0.2 0.6 0.2 1.1 −40
Mexico 4 −2 −29 47 25 45 37
Moldova −1.5 −0.2 −1.5 −0.3 −0.4 −3.9 n.a.
Mongolia 0.1 0.0 −3.1 0.8 0.4 −1.8 250
Morocco 0.0 0.1 0.5 2.1 2.2 4.9 −14
Mozambique −0.1 −1.6 1.5 0.3 0.2 0.2 55
Myanmar 0.6 0.3 −0.9 2.3 0.5 2.8 2
Namibia 0.0 0.0 0.4 0.1 0.2 0.6 −118
Nepal 0.0 0.3 1.0 0.2 0.3 1.7 −248
Netherlands 21 −2 −33 39 7 31 32
New Zealand 0 3 −3 3 2 4 10
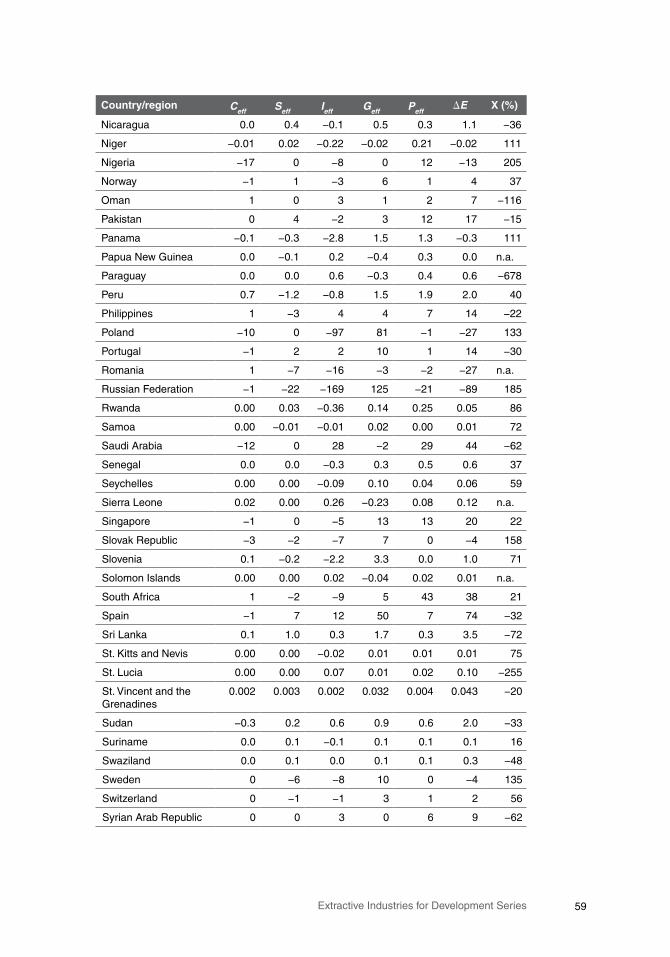
59Extractive Industries for Development Series
Country/region Ceff Seff Ieff Geff PeffE X(%)
Nicaragua 0.0 0.4 −0.1 0.5 0.3 1.1 −36
Niger −0.01 0.02 −0.22 −0.02 0.21 −0.02 111
Nigeria −17 0 −8 0 12 −13 205
Norway −1 1 −3 6 1 4 37
Oman 1 0 3 1 2 7 −116
Pakistan 0 4 −2 3 12 17 −15
Panama −0.1 −0.3 −2.8 1.5 1.3 −0.3 111
Papua New Guinea 0.0 −0.1 0.2 −0.4 0.3 0.0 n.a.
Paraguay 0.0 0.0 0.6 −0.3 0.4 0.6 −678
Peru 0.7 −1.2 −0.8 1.5 1.9 2.0 40
Philippines 1 −3 4 4 7 14 −22
Poland −10 0 −97 81 −1 −27 133
Portugal −1 2 2 10 1 14 −30
Romania 1 −7 −16 −3 −2 −27 n.a.
Russian Federation −1 −22 −169 125 −21 −89 185
Rwanda 0.00 0.03 −0.36 0.14 0.25 0.05 86
Samoa 0.00 −0.01 −0.01 0.02 0.00 0.01 72
Saudi Arabia −12 0 28 −2 29 44 −62
Senegal 0.0 0.0 −0.3 0.3 0.5 0.6 37
Seychelles 0.00 0.00 −0.09 0.10 0.04 0.06 59
Sierra Leone 0.02 0.00 0.26 −0.23 0.08 0.12 n.a.
Singapore −1 0 −5 13 13 20 22
Slovak Republic −3 −2 −7 7 0 −4 158
Slovenia 0.1 −0.2 −2.2 3.3 0.0 1.0 71
Solomon Islands 0.00 0.00 0.02 −0.04 0.02 0.01 n.a.
South Africa 1 −2 −9 5 43 38 21
Spain −1 7 12 50 7 74 −32
Sri Lanka 0.1 1.0 0.3 1.7 0.3 3.5 −72
St. Kitts and Nevis 0.00 0.00 −0.02 0.01 0.01 0.01 75
St. Lucia 0.00 0.00 0.07 0.01 0.02 0.10 −255
St. Vincent and the Grenadines
0.002 0.003 0.002 0.032 0.004 0.043 −20
Sudan −0.3 0.2 0.6 0.9 0.6 2.0 −33
Suriname 0.0 0.1 −0.1 0.1 0.1 0.1 16
Swaziland 0.0 0.1 0.0 0.1 0.1 0.3 −48
Sweden 0 −6 −8 10 0 −4 135
Switzerland 0 −1 −1 3 1 2 56
Syrian Arab Republic 0 0 3 0 6 9 −62
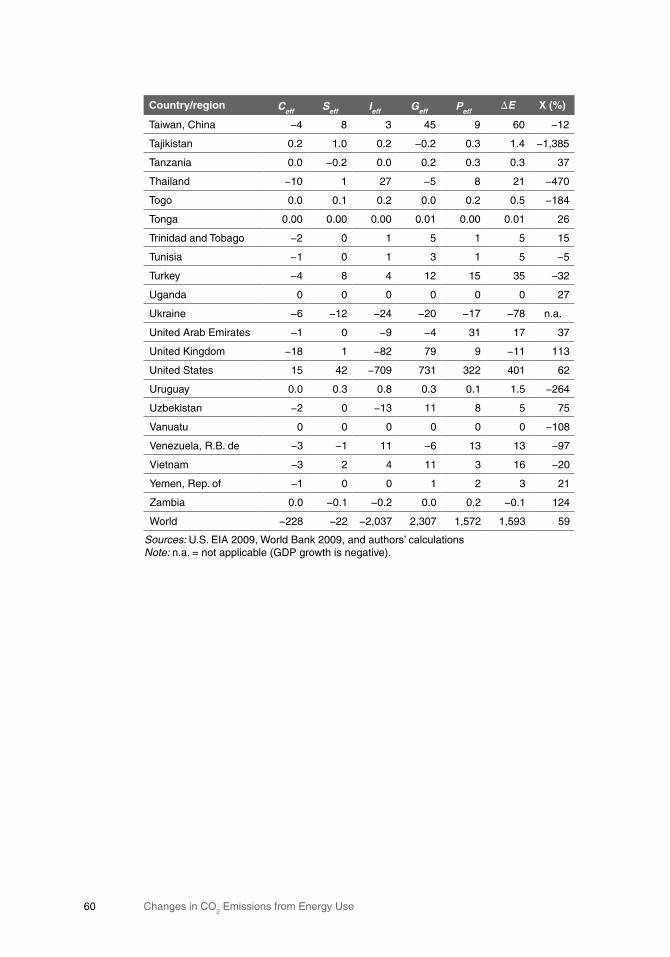
Changes in CO2 Emissions from Energy Use60
Country/region Ceff Seff Ieff Geff PeffE X(%)
Taiwan, China −4 8 3 45 9 60 −12
Tajikistan 0.2 1.0 0.2 −0.2 0.3 1.4 −1,385
Tanzania 0.0 −0.2 0.0 0.2 0.3 0.3 37
Thailand −10 1 27 −5 8 21 −470
Togo 0.0 0.1 0.2 0.0 0.2 0.5 −184
Tonga 0.00 0.00 0.00 0.01 0.00 0.01 26
Trinidad and Tobago −2 0 1 5 1 5 15
Tunisia −1 0 1 3 1 5 −5
Turkey −4 8 4 12 15 35 −32
Uganda 0 0 0 0 0 0 27
Ukraine −6 −12 −24 −20 −17 −78 n.a.
United Arab Emirates −1 0 −9 −4 31 17 37
United Kingdom −18 1 −82 79 9 −11 113
United States 15 42 −709 731 322 401 62
Uruguay 0.0 0.3 0.8 0.3 0.1 1.5 −264
Uzbekistan −2 0 −13 11 8 5 75
Vanuatu 0 0 0 0 0 0 −108
Venezuela, R.B. de −3 −1 11 −6 13 13 −97
Vietnam −3 2 4 11 3 16 −20
Yemen, Rep. of −1 0 0 1 2 3 21
Zambia 0.0 −0.1 −0.2 0.0 0.2 −0.1 124
World −228 −22 −2,037 2,307 1,572 1,593 59
Sources: U.S. EIA 2009, World Bank 2009, and authors’ calculationsNote: n.a. = not applicable (GDP growth is negative).

61Extractive Industries for Development Series
TableB.6 DecompositionAnalysisbetween1999−2001and2004−06BasedonU.S.EIADatamillion tonnes of CO2
Country/region Ceff Seff Ieff Geff Peff E X(%)
Albania −0.1 0.5 −0.1 0.9 0.1 1.3 −30
Algeria −6 0 −9 13 6 5 75
Angola 0.4 −0.9 −1.3 6.0 2.4 6.6 21
Antigua and Barbuda 0.01 0.00 −0.01 0.09 0.04 0.13 4
Argentina −1 0 1 9 7 16 −1
Armenia −0.1 −0.2 −3.5 5.4 −0.2 1.5 71
Australia 1 0 −19 38 24 44 29
Austria 1 4 0 4 2 11 −85
Azerbaijan −12 −1 −18 25 2 −3 111
Bangladesh 0 0 2 6 3 11 −15
Belarus −1 1 −18 23 −1 4 82
Belgium 0 0 −9 10 3 5 64
Belize −0.01 0.01 0.06 0.11 0.12 0.30 −30
Benin 0.00 0.00 0.59 0.07 0.32 0.98 −153
Bhutan 0.00 −0.06 −0.03 0.08 0.04 0.02 81
Bolivia −0.6 0.5 1.7 0.6 1.0 3.2 −102
Bosnia & Herzegovina −0.3 1.2 −0.7 3.3 0.4 3.8 −3
Botswana −0.14 −0.09 −0.67 0.88 0.25 0.22 80
Brazil −3 −9 −16 28 25 25 54
Brunei Darussalam −0.2 0.0 3.0 0.0 0.6 3.5 −456
Bulgaria −2 1 −10 15 −2 2 85
Burkina Faso −0.10 0.01 −0.18 0.13 0.17 0.03 91
Burundi 0.000 −0.001 −0.046 −0.019 0.062 −0.004 110
Cambodia 0.00 −0.02 −0.19 0.20 0.05 0.04 82
Cameroon −0.45 −0.05 −0.68 0.47 0.78 0.06 95
Canada 1 8 −31 51 29 58 27
Cape Verde 0.02 0.00 0.06 0.02 0.02 0.13 −189
Central African Republic 0.000 0.000 0.011 −0.038 0.026 −0.001 n.a.
Chad 0.00 0.00 −0.11 0.09 0.03 0.01 88
Chile −1 −1 0 9 3 10 23
China 76 5 426 1,771 131 2,409 −27
Colombia −0.1 −2.4 −7.3 7.3 4.4 2.0 83
Comoros 0.000 0.000 0.003 0.001 0.011 0.016 −33
Congo, Dem. Rep. of 0.05 −0.45 −0.24 0.07 0.37 −0.18 141
Congo, Rep. of −1.0 0.3 1.3 0.4 0.5 1.5 −83
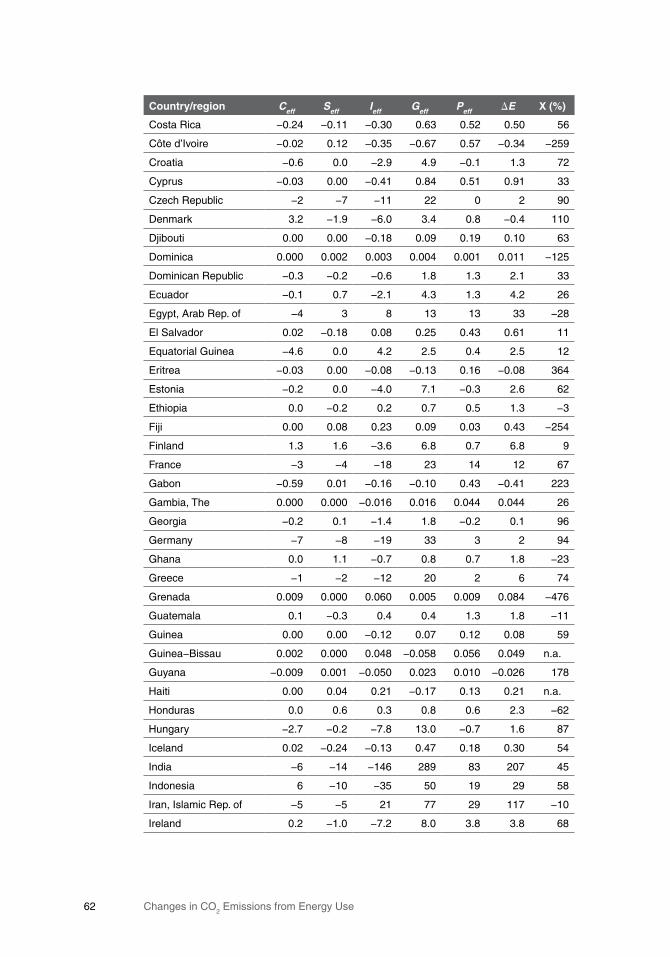
Changes in CO2 Emissions from Energy Use62
Country/region Ceff Seff Ieff Geff Peff E X(%)
Costa Rica −0.24 −0.11 −0.30 0.63 0.52 0.50 56
Côte d’Ivoire −0.02 0.12 −0.35 −0.67 0.57 −0.34 −259
Croatia −0.6 0.0 −2.9 4.9 −0.1 1.3 72
Cyprus −0.03 0.00 −0.41 0.84 0.51 0.91 33
Czech Republic −2 −7 −11 22 0 2 90
Denmark 3.2 −1.9 −6.0 3.4 0.8 −0.4 110
Djibouti 0.00 0.00 −0.18 0.09 0.19 0.10 63
Dominica 0.000 0.002 0.003 0.004 0.001 0.011 −125
Dominican Republic −0.3 −0.2 −0.6 1.8 1.3 2.1 33
Ecuador −0.1 0.7 −2.1 4.3 1.3 4.2 26
Egypt, Arab Rep. of −4 3 8 13 13 33 −28
El Salvador 0.02 −0.18 0.08 0.25 0.43 0.61 11
Equatorial Guinea −4.6 0.0 4.2 2.5 0.4 2.5 12
Eritrea −0.03 0.00 −0.08 −0.13 0.16 −0.08 364
Estonia −0.2 0.0 −4.0 7.1 −0.3 2.6 62
Ethiopia 0.0 −0.2 0.2 0.7 0.5 1.3 −3
Fiji 0.00 0.08 0.23 0.09 0.03 0.43 −254
Finland 1.3 1.6 −3.6 6.8 0.7 6.8 9
France −3 −4 −18 23 14 12 67
Gabon −0.59 0.01 −0.16 −0.10 0.43 −0.41 223
Gambia, The 0.000 0.000 −0.016 0.016 0.044 0.044 26
Georgia −0.2 0.1 −1.4 1.8 −0.2 0.1 96
Germany −7 −8 −19 33 3 2 94
Ghana 0.0 1.1 −0.7 0.8 0.7 1.8 −23
Greece −1 −2 −12 20 2 6 74
Grenada 0.009 0.000 0.060 0.005 0.009 0.084 −476
Guatemala 0.1 −0.3 0.4 0.4 1.3 1.8 −11
Guinea 0.00 0.00 −0.12 0.07 0.12 0.08 59
Guinea−Bissau 0.002 0.000 0.048 −0.058 0.056 0.049 n.a.
Guyana −0.009 0.001 −0.050 0.023 0.010 −0.026 178
Haiti 0.00 0.04 0.21 −0.17 0.13 0.21 n.a.
Honduras 0.0 0.6 0.3 0.8 0.6 2.3 −62
Hungary −2.7 −0.2 −7.8 13.0 −0.7 1.6 87
Iceland 0.02 −0.24 −0.13 0.47 0.18 0.30 54
India −6 −14 −146 289 83 207 45
Indonesia 6 −10 −35 50 19 29 58
Iran, Islamic Rep. of −5 −5 21 77 29 117 −10
Ireland 0.2 −1.0 −7.2 8.0 3.8 3.8 68
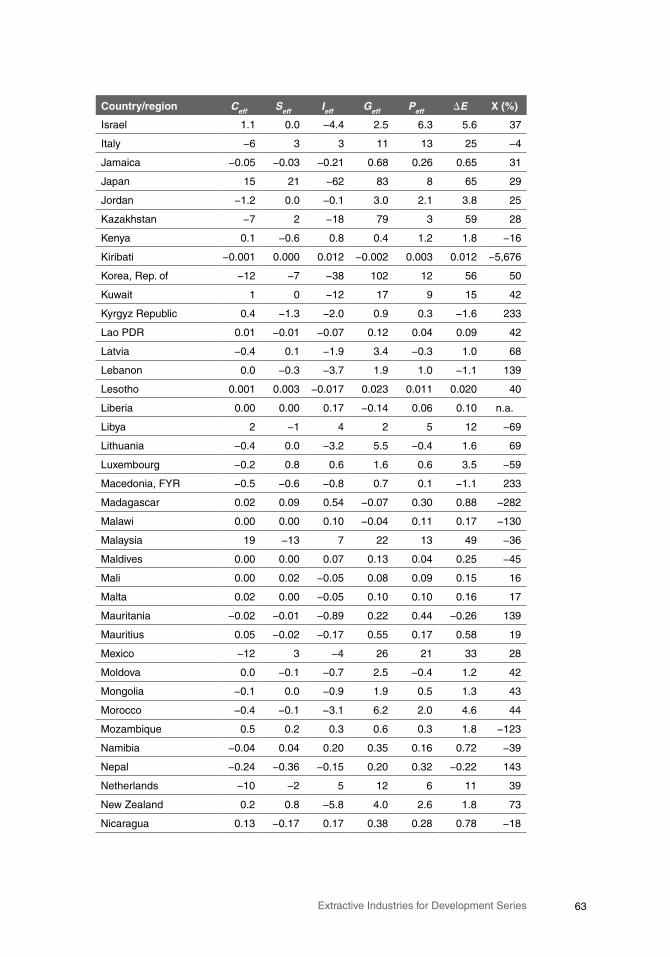
63Extractive Industries for Development Series
Country/region Ceff Seff Ieff Geff Peff E X(%)
Israel 1.1 0.0 −4.4 2.5 6.3 5.6 37
Italy −6 3 3 11 13 25 −4
Jamaica −0.05 −0.03 −0.21 0.68 0.26 0.65 31
Japan 15 21 −62 83 8 65 29
Jordan −1.2 0.0 −0.1 3.0 2.1 3.8 25
Kazakhstan −7 2 −18 79 3 59 28
Kenya 0.1 −0.6 0.8 0.4 1.2 1.8 −16
Kiribati −0.001 0.000 0.012 −0.002 0.003 0.012 −5,676
Korea, Rep. of −12 −7 −38 102 12 56 50
Kuwait 1 0 −12 17 9 15 42
Kyrgyz Republic 0.4 −1.3 −2.0 0.9 0.3 −1.6 233
Lao PDR 0.01 −0.01 −0.07 0.12 0.04 0.09 42
Latvia −0.4 0.1 −1.9 3.4 −0.3 1.0 68
Lebanon 0.0 −0.3 −3.7 1.9 1.0 −1.1 139
Lesotho 0.001 0.003 −0.017 0.023 0.011 0.020 40
Liberia 0.00 0.00 0.17 −0.14 0.06 0.10 n.a.
Libya 2 −1 4 2 5 12 −69
Lithuania −0.4 0.0 −3.2 5.5 −0.4 1.6 69
Luxembourg −0.2 0.8 0.6 1.6 0.6 3.5 −59
Macedonia, FYR −0.5 −0.6 −0.8 0.7 0.1 −1.1 233
Madagascar 0.02 0.09 0.54 −0.07 0.30 0.88 −282
Malawi 0.00 0.00 0.10 −0.04 0.11 0.17 −130
Malaysia 19 −13 7 22 13 49 −36
Maldives 0.00 0.00 0.07 0.13 0.04 0.25 −45
Mali 0.00 0.02 −0.05 0.08 0.09 0.15 16
Malta 0.02 0.00 −0.05 0.10 0.10 0.16 17
Mauritania −0.02 −0.01 −0.89 0.22 0.44 −0.26 139
Mauritius 0.05 −0.02 −0.17 0.55 0.17 0.58 19
Mexico −12 3 −4 26 21 33 28
Moldova 0.0 −0.1 −0.7 2.5 −0.4 1.2 42
Mongolia −0.1 0.0 −0.9 1.9 0.5 1.3 43
Morocco −0.4 −0.1 −3.1 6.2 2.0 4.6 44
Mozambique 0.5 0.2 0.3 0.6 0.3 1.8 −123
Namibia −0.04 0.04 0.20 0.35 0.16 0.72 −39
Nepal −0.24 −0.36 −0.15 0.20 0.32 −0.22 143
Netherlands −10 −2 5 12 6 11 39
New Zealand 0.2 0.8 −5.8 4.0 2.6 1.8 73
Nicaragua 0.13 −0.17 0.17 0.38 0.28 0.78 −18
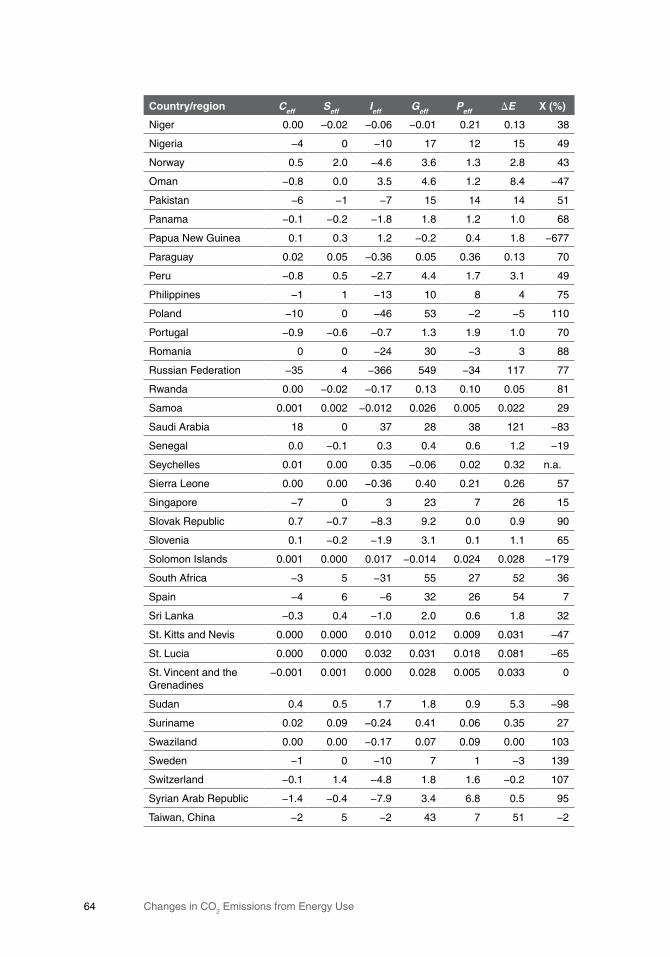
Changes in CO2 Emissions from Energy Use64
Country/region Ceff Seff Ieff Geff Peff E X(%)
Niger 0.00 −0.02 −0.06 −0.01 0.21 0.13 38
Nigeria −4 0 −10 17 12 15 49
Norway 0.5 2.0 −4.6 3.6 1.3 2.8 43
Oman −0.8 0.0 3.5 4.6 1.2 8.4 −47
Pakistan −6 −1 −7 15 14 14 51
Panama −0.1 −0.2 −1.8 1.8 1.2 1.0 68
Papua New Guinea 0.1 0.3 1.2 −0.2 0.4 1.8 −677
Paraguay 0.02 0.05 −0.36 0.05 0.36 0.13 70
Peru −0.8 0.5 −2.7 4.4 1.7 3.1 49
Philippines −1 1 −13 10 8 4 75
Poland −10 0 −46 53 −2 −5 110
Portugal −0.9 −0.6 −0.7 1.3 1.9 1.0 70
Romania 0 0 −24 30 −3 3 88
Russian Federation −35 4 −366 549 −34 117 77
Rwanda 0.00 −0.02 −0.17 0.13 0.10 0.05 81
Samoa 0.001 0.002 −0.012 0.026 0.005 0.022 29
Saudi Arabia 18 0 37 28 38 121 −83
Senegal 0.0 −0.1 0.3 0.4 0.6 1.2 −19
Seychelles 0.01 0.00 0.35 −0.06 0.02 0.32 n.a.
Sierra Leone 0.00 0.00 −0.36 0.40 0.21 0.26 57
Singapore −7 0 3 23 7 26 15
Slovak Republic 0.7 −0.7 −8.3 9.2 0.0 0.9 90
Slovenia 0.1 −0.2 −1.9 3.1 0.1 1.1 65
Solomon Islands 0.001 0.000 0.017 −0.014 0.024 0.028 −179
South Africa −3 5 −31 55 27 52 36
Spain −4 6 −6 32 26 54 7
Sri Lanka −0.3 0.4 −1.0 2.0 0.6 1.8 32
St. Kitts and Nevis 0.000 0.000 0.010 0.012 0.009 0.031 −47
St. Lucia 0.000 0.000 0.032 0.031 0.018 0.081 −65
St. Vincent and the Grenadines
−0.001 0.001 0.000 0.028 0.005 0.033 0
Sudan 0.4 0.5 1.7 1.8 0.9 5.3 −98
Suriname 0.02 0.09 −0.24 0.41 0.06 0.35 27
Swaziland 0.00 0.00 −0.17 0.07 0.09 0.00 103
Sweden −1 0 −10 7 1 −3 139
Switzerland −0.1 1.4 −4.8 1.8 1.6 −0.2 107
Syrian Arab Republic −1.4 −0.4 −7.9 3.4 6.8 0.5 95
Taiwan, China −2 5 −2 43 7 51 −2
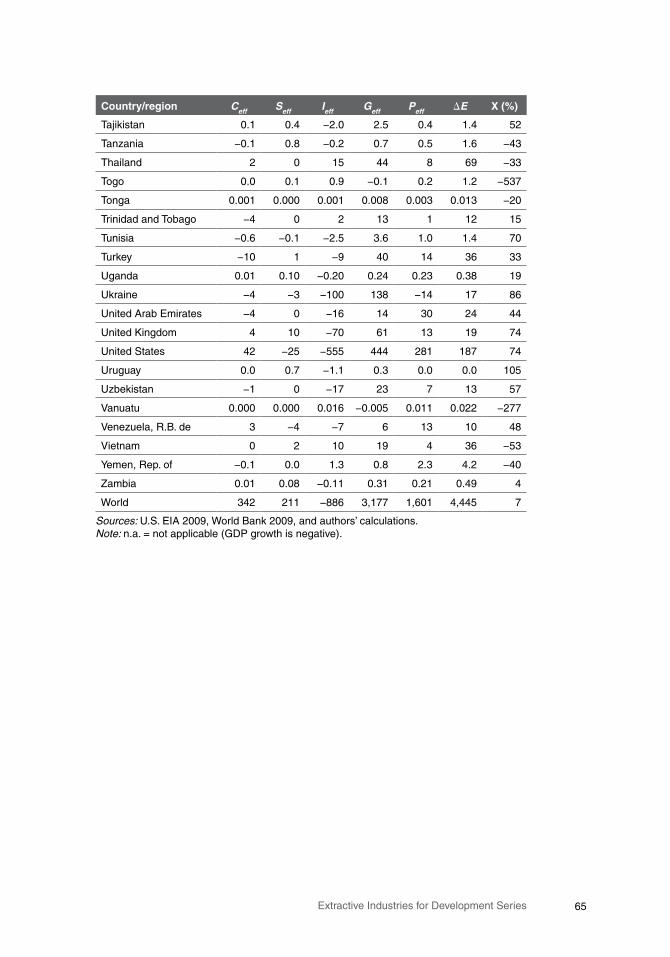
65Extractive Industries for Development Series
Country/region Ceff Seff Ieff Geff Peff E X(%)
Tajikistan 0.1 0.4 −2.0 2.5 0.4 1.4 52
Tanzania −0.1 0.8 −0.2 0.7 0.5 1.6 −43
Thailand 2 0 15 44 8 69 −33
Togo 0.0 0.1 0.9 −0.1 0.2 1.2 −537
Tonga 0.001 0.000 0.001 0.008 0.003 0.013 −20
Trinidad and Tobago −4 0 2 13 1 12 15
Tunisia −0.6 −0.1 −2.5 3.6 1.0 1.4 70
Turkey −10 1 −9 40 14 36 33
Uganda 0.01 0.10 −0.20 0.24 0.23 0.38 19
Ukraine −4 −3 −100 138 −14 17 86
United Arab Emirates −4 0 −16 14 30 24 44
United Kingdom 4 10 −70 61 13 19 74
United States 42 −25 −555 444 281 187 74
Uruguay 0.0 0.7 −1.1 0.3 0.0 0.0 105
Uzbekistan −1 0 −17 23 7 13 57
Vanuatu 0.000 0.000 0.016 −0.005 0.011 0.022 −277
Venezuela, R.B. de 3 −4 −7 6 13 10 48
Vietnam 0 2 10 19 4 36 −53
Yemen, Rep. of −0.1 0.0 1.3 0.8 2.3 4.2 −40
Zambia 0.01 0.08 −0.11 0.31 0.21 0.49 4
World 342 211 −886 3,177 1,601 4,445 7
Sources: U.S. EIA 2009, World Bank 2009, and authors’ calculations.Note: n.a. = not applicable (GDP growth is negative).
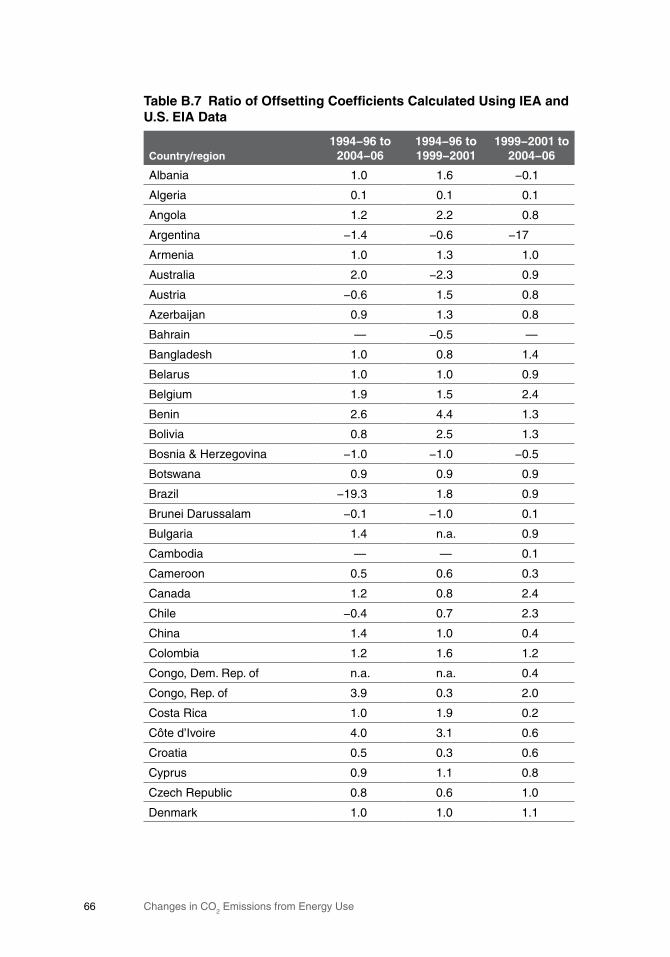
Changes in CO2 Emissions from Energy Use66
TableB.7 RatioofOffsettingCoefficientsCalculatedUsingIEAandU.S.EIAData
Country/region1994−96to
2004−061994−96to1999−2001
1999−2001to2004−06
Albania 1.0 1.6 −0.1
Algeria 0.1 0.1 0.1
Angola 1.2 2.2 0.8
Argentina −1.4 −0.6 −17
Armenia 1.0 1.3 1.0
Australia 2.0 −2.3 0.9
Austria −0.6 1.5 0.8
Azerbaijan 0.9 1.3 0.8
Bahrain — −0.5 —
Bangladesh 1.0 0.8 1.4
Belarus 1.0 1.0 0.9
Belgium 1.9 1.5 2.4
Benin 2.6 4.4 1.3
Bolivia 0.8 2.5 1.3
Bosnia & Herzegovina −1.0 −1.0 −0.5
Botswana 0.9 0.9 0.9
Brazil −19.3 1.8 0.9
Brunei Darussalam −0.1 −1.0 0.1
Bulgaria 1.4 n.a. 0.9
Cambodia — — 0.1
Cameroon 0.5 0.6 0.3
Canada 1.2 0.8 2.4
Chile −0.4 0.7 2.3
China 1.4 1.0 0.4
Colombia 1.2 1.6 1.2
Congo, Dem. Rep. of n.a. n.a. 0.4
Congo, Rep. of 3.9 0.3 2.0
Costa Rica 1.0 1.9 0.2
Côte d’Ivoire 4.0 3.1 0.6
Croatia 0.5 0.3 0.6
Cyprus 0.9 1.1 0.8
Czech Republic 0.8 0.6 1.0
Denmark 1.0 1.0 1.1
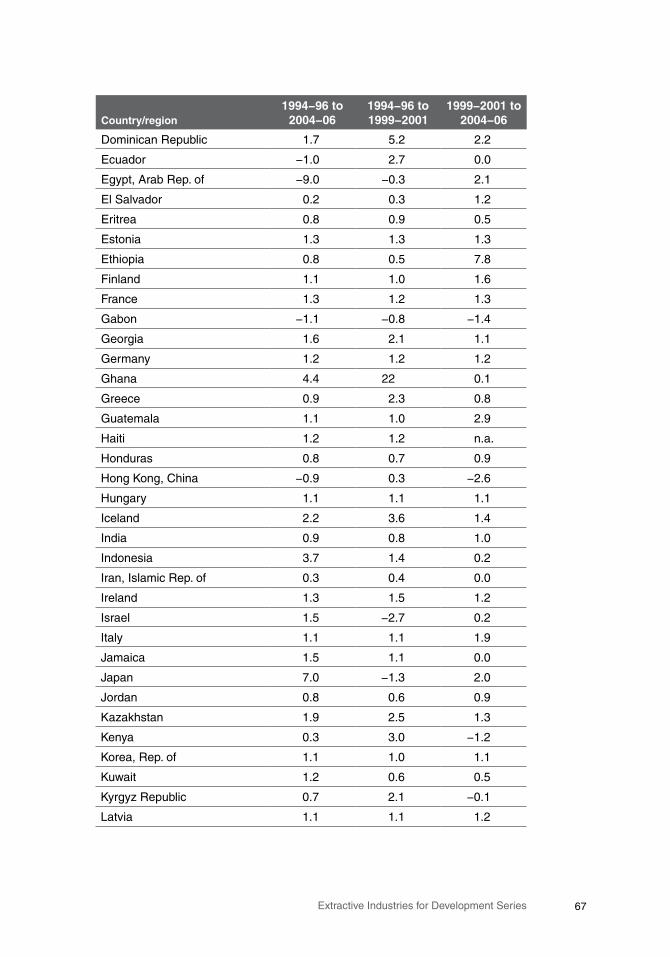
67Extractive Industries for Development Series
Country/region1994−96to
2004−061994−96to1999−2001
1999−2001to2004−06
Dominican Republic 1.7 5.2 2.2
Ecuador −1.0 2.7 0.0
Egypt, Arab Rep. of −9.0 −0.3 2.1
El Salvador 0.2 0.3 1.2
Eritrea 0.8 0.9 0.5
Estonia 1.3 1.3 1.3
Ethiopia 0.8 0.5 7.8
Finland 1.1 1.0 1.6
France 1.3 1.2 1.3
Gabon −1.1 −0.8 −1.4
Georgia 1.6 2.1 1.1
Germany 1.2 1.2 1.2
Ghana 4.4 22 0.1
Greece 0.9 2.3 0.8
Guatemala 1.1 1.0 2.9
Haiti 1.2 1.2 n.a.
Honduras 0.8 0.7 0.9
Hong Kong, China −0.9 0.3 −2.6
Hungary 1.1 1.1 1.1
Iceland 2.2 3.6 1.4
India 0.9 0.8 1.0
Indonesia 3.7 1.4 0.2
Iran, Islamic Rep. of 0.3 0.4 0.0
Ireland 1.3 1.5 1.2
Israel 1.5 −2.7 0.2
Italy 1.1 1.1 1.9
Jamaica 1.5 1.1 0.0
Japan 7.0 −1.3 2.0
Jordan 0.8 0.6 0.9
Kazakhstan 1.9 2.5 1.3
Kenya 0.3 3.0 −1.2
Korea, Rep. of 1.1 1.0 1.1
Kuwait 1.2 0.6 0.5
Kyrgyz Republic 0.7 2.1 −0.1
Latvia 1.1 1.1 1.2
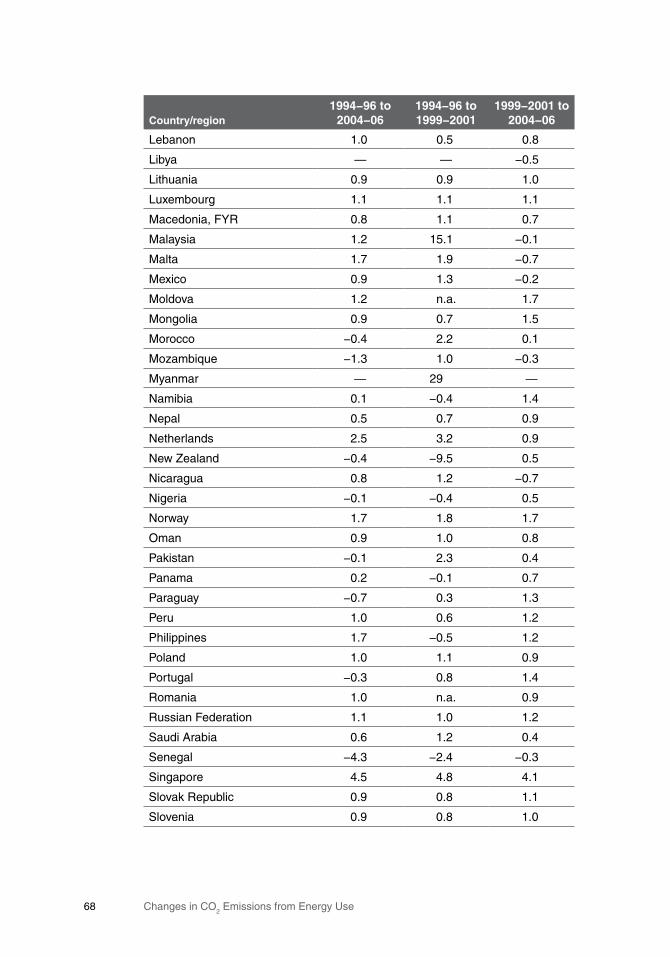
Changes in CO2 Emissions from Energy Use68
Country/region1994−96to
2004−061994−96to1999−2001
1999−2001to2004−06
Lebanon 1.0 0.5 0.8
Libya — — −0.5
Lithuania 0.9 0.9 1.0
Luxembourg 1.1 1.1 1.1
Macedonia, FYR 0.8 1.1 0.7
Malaysia 1.2 15.1 −0.1
Malta 1.7 1.9 −0.7
Mexico 0.9 1.3 −0.2
Moldova 1.2 n.a. 1.7
Mongolia 0.9 0.7 1.5
Morocco −0.4 2.2 0.1
Mozambique −1.3 1.0 −0.3
Myanmar — 29 —
Namibia 0.1 −0.4 1.4
Nepal 0.5 0.7 0.9
Netherlands 2.5 3.2 0.9
New Zealand −0.4 −9.5 0.5
Nicaragua 0.8 1.2 −0.7
Nigeria −0.1 −0.4 0.5
Norway 1.7 1.8 1.7
Oman 0.9 1.0 0.8
Pakistan −0.1 2.3 0.4
Panama 0.2 −0.1 0.7
Paraguay −0.7 0.3 1.3
Peru 1.0 0.6 1.2
Philippines 1.7 −0.5 1.2
Poland 1.0 1.1 0.9
Portugal −0.3 0.8 1.4
Romania 1.0 n.a. 0.9
Russian Federation 1.1 1.0 1.2
Saudi Arabia 0.6 1.2 0.4
Senegal −4.3 −2.4 −0.3
Singapore 4.5 4.8 4.1
Slovak Republic 0.9 0.8 1.1
Slovenia 0.9 0.8 1.0
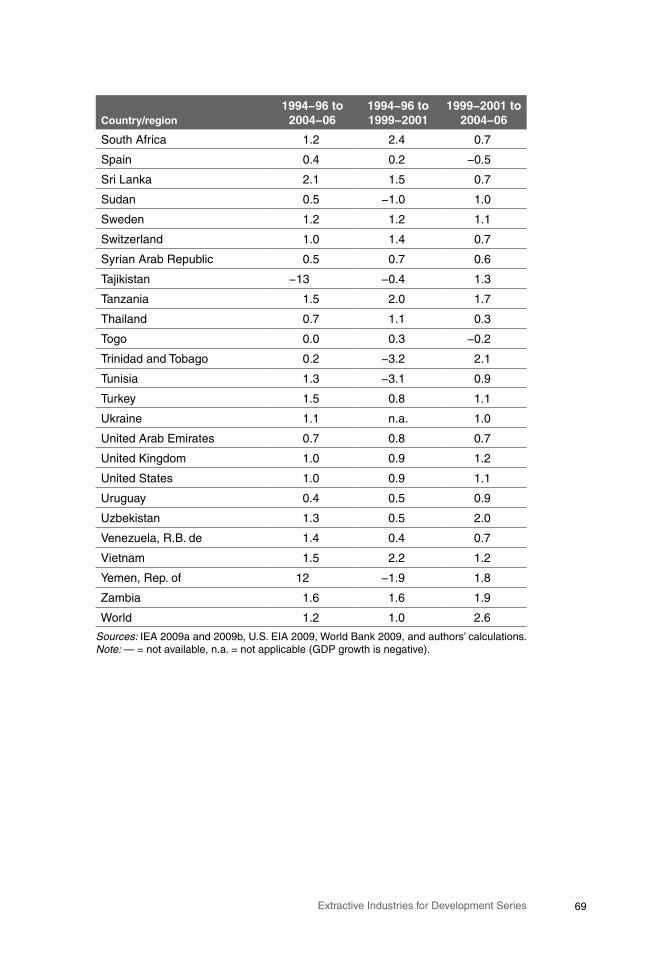
69Extractive Industries for Development Series
Country/region1994−96to
2004−061994−96to1999−2001
1999−2001to2004−06
South Africa 1.2 2.4 0.7
Spain 0.4 0.2 −0.5
Sri Lanka 2.1 1.5 0.7
Sudan 0.5 −1.0 1.0
Sweden 1.2 1.2 1.1
Switzerland 1.0 1.4 0.7
Syrian Arab Republic 0.5 0.7 0.6
Tajikistan −13 −0.4 1.3
Tanzania 1.5 2.0 1.7
Thailand 0.7 1.1 0.3
Togo 0.0 0.3 −0.2
Trinidad and Tobago 0.2 −3.2 2.1
Tunisia 1.3 −3.1 0.9
Turkey 1.5 0.8 1.1
Ukraine 1.1 n.a. 1.0
United Arab Emirates 0.7 0.8 0.7
United Kingdom 1.0 0.9 1.2
United States 1.0 0.9 1.1
Uruguay 0.4 0.5 0.9
Uzbekistan 1.3 0.5 2.0
Venezuela, R.B. de 1.4 0.4 0.7
Vietnam 1.5 2.2 1.2
Yemen, Rep. of 12 −1.9 1.8
Zambia 1.6 1.6 1.9
World 1.2 1.0 2.6
Sources: IEA 2009a and 2009b, U.S. EIA 2009, World Bank 2009, and authors’ calculations.Note: — = not available, n.a. = not applicable (GDP growth is negative).
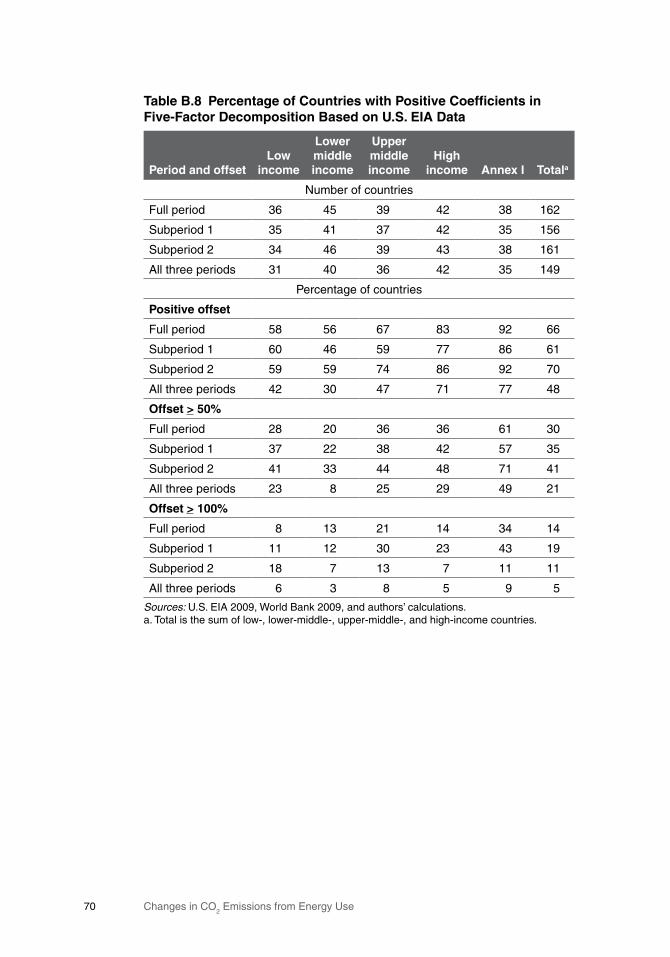
Changes in CO2 Emissions from Energy Use70
TableB.8 PercentageofCountrieswithPositiveCoefficientsinFive-FactorDecompositionBasedonU.S.EIAData
PeriodandoffsetLow
income
Lowermiddleincome
Uppermiddleincome
Highincome AnnexI Totala
Number of countries
Full period 36 45 39 42 38 162
Subperiod 1 35 41 37 42 35 156
Subperiod 2 34 46 39 43 38 161
All three periods 31 40 36 42 35 149
Percentage of countries
Positiveoffset
Full period 58 56 67 83 92 66
Subperiod 1 60 46 59 77 86 61
Subperiod 2 59 59 74 86 92 70
All three periods 42 30 47 71 77 48
Offset>50%
Full period 28 20 36 36 61 30
Subperiod 1 37 22 38 42 57 35
Subperiod 2 41 33 44 48 71 41
All three periods 23 8 25 29 49 21
Offset>100%
Full period 8 13 21 14 34 14
Subperiod 1 11 12 30 23 43 19
Subperiod 2 18 7 13 7 11 11
All three periods 6 3 8 5 9 5
Sources: U.S. EIA 2009, World Bank 2009, and authors’ calculations.a. Total is the sum of low-, lower-middle-, upper-middle-, and high-income countries.
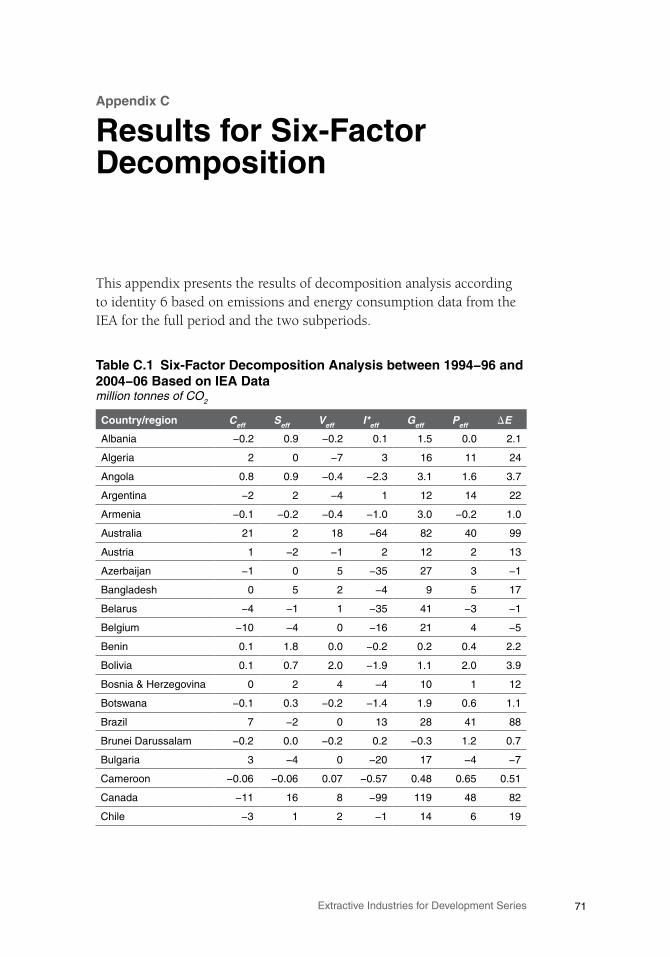
71Extractive Industries for Development Series
AppendixC
ResultsforSix-FactorDecomposition
This appendix presents the results of decomposition analysis according to identity 6 based on emissions and energy consumption data from the IEA for the full period and the two subperiods.
TableC.1 Six-FactorDecompositionAnalysisbetween1994−96and2004−06BasedonIEADatamillion tonnes of CO2
Country/region Ceff Seff Veff I*eff Geff Peff E
Albania −0.2 0.9 −0.2 0.1 1.5 0.0 2.1
Algeria 2 0 −7 3 16 11 24
Angola 0.8 0.9 −0.4 −2.3 3.1 1.6 3.7
Argentina −2 2 −4 1 12 14 22
Armenia −0.1 −0.2 −0.4 −1.0 3.0 −0.2 1.0
Australia 21 2 18 −64 82 40 99
Austria 1 −2 −1 2 12 2 13
Azerbaijan −1 0 5 −35 27 3 −1
Bangladesh 0 5 2 −4 9 5 17
Belarus −4 −1 1 −35 41 −3 −1
Belgium −10 −4 0 −16 21 4 −5
Benin 0.1 1.8 0.0 −0.2 0.2 0.4 2.2
Bolivia 0.1 0.7 2.0 −1.9 1.1 2.0 3.9
Bosnia & Herzegovina 0 2 4 −4 10 1 12
Botswana −0.1 0.3 −0.2 −1.4 1.9 0.6 1.1
Brazil 7 −2 0 13 28 41 88
Brunei Darussalam −0.2 0.0 −0.2 0.2 −0.3 1.2 0.7
Bulgaria 3 −4 0 −20 17 −4 −7
Cameroon −0.06 −0.06 0.07 −0.57 0.48 0.65 0.51
Canada −11 16 8 −99 119 48 82
Chile −3 1 2 −1 14 6 19
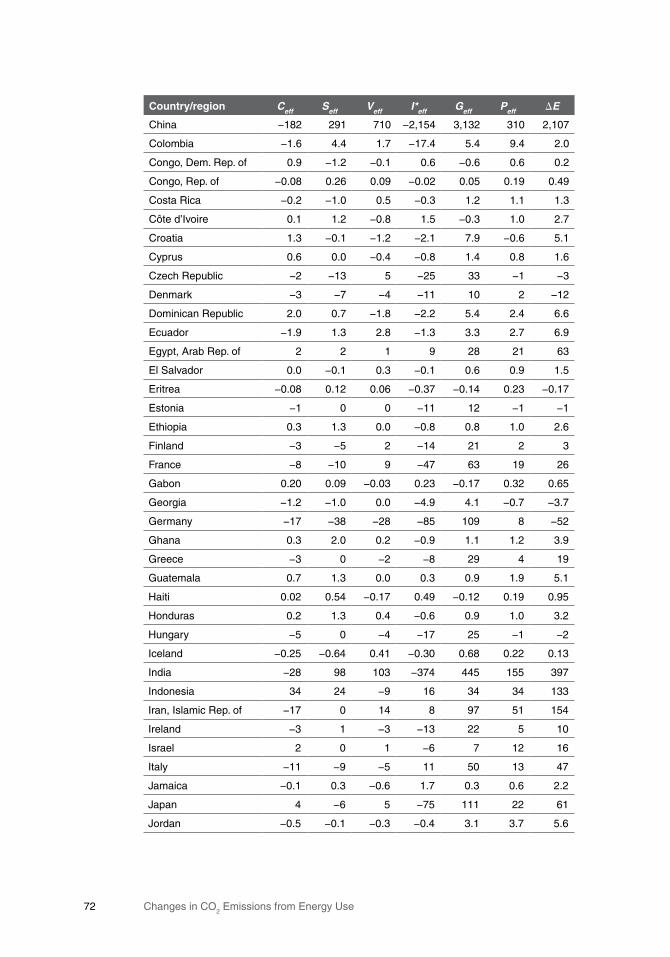
Changes in CO2 Emissions from Energy Use72
Country/region Ceff Seff Veff I*eff Geff Peff E
China −182 291 710 −2,154 3,132 310 2,107
Colombia −1.6 4.4 1.7 −17.4 5.4 9.4 2.0
Congo, Dem. Rep. of 0.9 −1.2 −0.1 0.6 −0.6 0.6 0.2
Congo, Rep. of −0.08 0.26 0.09 −0.02 0.05 0.19 0.49
Costa Rica −0.2 −1.0 0.5 −0.3 1.2 1.1 1.3
Côte d’Ivoire 0.1 1.2 −0.8 1.5 −0.3 1.0 2.7
Croatia 1.3 −0.1 −1.2 −2.1 7.9 −0.6 5.1
Cyprus 0.6 0.0 −0.4 −0.8 1.4 0.8 1.6
Czech Republic −2 −13 5 −25 33 −1 −3
Denmark −3 −7 −4 −11 10 2 −12
Dominican Republic 2.0 0.7 −1.8 −2.2 5.4 2.4 6.6
Ecuador −1.9 1.3 2.8 −1.3 3.3 2.7 6.9
Egypt, Arab Rep. of 2 2 1 9 28 21 63
El Salvador 0.0 −0.1 0.3 −0.1 0.6 0.9 1.5
Eritrea −0.08 0.12 0.06 −0.37 −0.14 0.23 −0.17
Estonia −1 0 0 −11 12 −1 −1
Ethiopia 0.3 1.3 0.0 −0.8 0.8 1.0 2.6
Finland −3 −5 2 −14 21 2 3
France −8 −10 9 −47 63 19 26
Gabon 0.20 0.09 −0.03 0.23 −0.17 0.32 0.65
Georgia −1.2 −1.0 0.0 −4.9 4.1 −0.7 −3.7
Germany −17 −38 −28 −85 109 8 −52
Ghana 0.3 2.0 0.2 −0.9 1.1 1.2 3.9
Greece −3 0 −2 −8 29 4 19
Guatemala 0.7 1.3 0.0 0.3 0.9 1.9 5.1
Haiti 0.02 0.54 −0.17 0.49 −0.12 0.19 0.95
Honduras 0.2 1.3 0.4 −0.6 0.9 1.0 3.2
Hungary −5 0 −4 −17 25 −1 −2
Iceland −0.25 −0.64 0.41 −0.30 0.68 0.22 0.13
India −28 98 103 −374 445 155 397
Indonesia 34 24 −9 16 34 34 133
Iran, Islamic Rep. of −17 0 14 8 97 51 154
Ireland −3 1 −3 −13 22 5 10
Israel 2 0 1 −6 7 12 16
Italy −11 −9 −5 11 50 13 47
Jamaica −0.1 0.3 −0.6 1.7 0.3 0.6 2.2
Japan 4 −6 5 −75 111 22 61
Jordan −0.5 −0.1 −0.3 −0.4 3.1 3.7 5.6

73Extractive Industries for Development Series
Country/region Ceff Seff Veff I*eff Geff Peff E
Kazakhstan −16 3 17 −102 107 −7 1
Kenya −1.0 0.9 0.5 −0.4 0.2 2.3 2.6
Korea, Rep. of −14 −31 33 −66 156 28 107
Kuwait 4 0 3 −3 9 18 30
Kyrgyz Republic 0.1 −0.4 0.0 −2.1 1.7 0.6 −0.1
Latvia −0.7 −0.5 −0.7 −5.2 6.3 −0.8 −1.5
Lebanon 0.2 0.0 0.9 −3.0 2.4 1.9 2.4
Lithuania −0.5 −0.8 −0.5 −7.6 8.9 −0.9 −1.3
Luxembourg −2.5 2.3 −0.6 −1.7 3.6 1.2 2.2
Macedonia, FYR 0.1 −0.7 −0.8 −1.4 1.5 0.3 −1.0
Malaysia 5 3 −4 9 27 24 64
Malta −0.1 0.0 0.2 −0.6 0.5 0.2 0.2
Mexico −18 6 44 −65 71 44 81
Moldova −0.8 −0.6 −0.3 −4.6 3.3 −1.1 −4.2
Mongolia −0.2 0.0 −0.3 −4.0 3.4 1.1 0.1
Morocco 1 0 1 −1 8 4 13
Mozambique −0.10 0.24 0.02 −0.61 0.66 0.33 0.55
Namibia 0.0 0.0 0.0 0.1 0.5 0.5 1.0
Nepal 0.1 0.5 0.0 −0.2 0.4 0.5 1.2
Netherlands −4 −5 −2 −27 36 10 7
New Zealand 9 1 −2 −5 6 4 11
Nicaragua 0.0 0.4 −0.1 0.0 0.8 0.5 1.6
Nigeria 6 3 0 −7 8 11 20
Norway −7.9 3.9 3.6 −6.2 7.8 2.0 3.2
Oman −2 0 2 5 5 3 14
Pakistan 0 6 0 −6 16 24 40
Panama 0.2 0.3 −0.3 −0.6 1.2 0.9 1.7
Paraguay 0.02 0.14 0.10 −0.47 −0.24 0.71 0.27
Peru 0.0 0.1 0.6 −4.8 5.6 3.5 4.9
Philippines −1 −4 15 −24 13 14 11
Poland −24 6 −4 −149 137 −3 −37
Portugal −2 1 0 2 10 3 13
Romania 4 −11 −9 −32 29 −5 −24
Russian Federation −59 −39 166 −700 643 −52 −43
Saudi Arabia 1 0 −29 64 19 58 113
Senegal 0.1 0.6 0.1 −0.2 0.6 0.9 2.1
Serbia −2 0 −5 1 16 −2 9
Singapore −6 0 −20 8 13 8 3
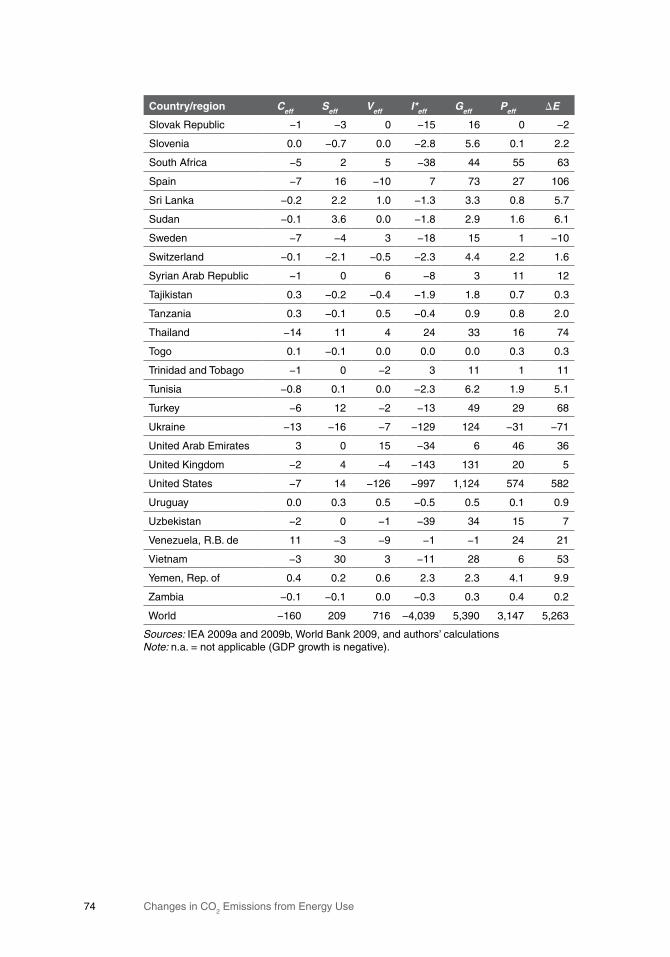
Changes in CO2 Emissions from Energy Use74
Country/region Ceff Seff Veff I*eff Geff Peff E
Slovak Republic −1 −3 0 −15 16 0 −2
Slovenia 0.0 −0.7 0.0 −2.8 5.6 0.1 2.2
South Africa −5 2 5 −38 44 55 63
Spain −7 16 −10 7 73 27 106
Sri Lanka −0.2 2.2 1.0 −1.3 3.3 0.8 5.7
Sudan −0.1 3.6 0.0 −1.8 2.9 1.6 6.1
Sweden −7 −4 3 −18 15 1 −10
Switzerland −0.1 −2.1 −0.5 −2.3 4.4 2.2 1.6
Syrian Arab Republic −1 0 6 −8 3 11 12
Tajikistan 0.3 −0.2 −0.4 −1.9 1.8 0.7 0.3
Tanzania 0.3 −0.1 0.5 −0.4 0.9 0.8 2.0
Thailand −14 11 4 24 33 16 74
Togo 0.1 −0.1 0.0 0.0 0.0 0.3 0.3
Trinidad and Tobago −1 0 −2 3 11 1 11
Tunisia −0.8 0.1 0.0 −2.3 6.2 1.9 5.1
Turkey −6 12 −2 −13 49 29 68
Ukraine −13 −16 −7 −129 124 −31 −71
United Arab Emirates 3 0 15 −34 6 46 36
United Kingdom −2 4 −4 −143 131 20 5
United States −7 14 −126 −997 1,124 574 582
Uruguay 0.0 0.3 0.5 −0.5 0.5 0.1 0.9
Uzbekistan −2 0 −1 −39 34 15 7
Venezuela, R.B. de 11 −3 −9 −1 −1 24 21
Vietnam −3 30 3 −11 28 6 53
Yemen, Rep. of 0.4 0.2 0.6 2.3 2.3 4.1 9.9
Zambia −0.1 −0.1 0.0 −0.3 0.3 0.4 0.2
World −160 209 716 −4,039 5,390 3,147 5,263
Sources: IEA 2009a and 2009b, World Bank 2009, and authors’ calculationsNote: n.a. = not applicable (GDP growth is negative).

75Extractive Industries for Development Series
TableC.2 Six-FactorDecompositionAnalysisbetween1994−96and1999−2001BasedonIEADatamillion tonnes of CO2
Country/region Ceff Seff Veff I*eff Geff Peff E
Albania 0.0 0.5 −0.2 0.2 0.7 −0.1 1.2
Algeria −0.6 0.1 0.7 −1.9 4.8 4.8 8.0
Angola 0.2 0.2 0.0 −0.8 0.8 0.6 1.1
Argentina −3.8 0.8 −0.7 2.3 3.7 7.1 9.4
Armenia −0.10 −0.15 0.38 −0.57 0.96 −0.15 0.37
Australia 16 −1 7 −31 46 18 56
Austria −0.2 −1.0 −1.8 −1.4 7.5 0.5 3.7
Azerbaijan 0.8 −0.1 4.3 −18.2 7.2 1.4 −4.7
Bahrain 0.3 0.0 0.9 −1.6 1.2 1.5 2.4
Bangladesh 0.1 2.3 0.9 −2.1 3.4 2.2 6.8
Belarus −2.2 −1.2 −1.2 −16.4 16.1 −1.1 −6.1
Belgium −4.4 −2.9 −0.6 −6.2 13.5 1.3 0.8
Benin 0.0 1.0 0.0 −0.2 0.1 0.1 1.0
Bolivia −1.4 0.4 1.3 −1.2 0.5 0.8 0.4
Bosnia & Herzegovina 0.9 1.5 3.1 −3.8 6.6 0.5 8.9
Botswana −0.1 0.2 −0.2 −0.5 1.0 0.4 0.8
Brazil 4 17 −3 19 6 20 64
Brunei Darussalam −0.50 0.00 0.11 −0.05 −0.24 0.56 −0.12
Bulgaria 2 −4 2 −11 2 −2 −10
Cameroon −0.03 −0.16 0.01 −0.28 0.27 0.31 0.13
Canada 2 21 3 −66 73 23 57
Chile −4 3 1 4 7 3 14
China −92 7 221 −1,291 1,106 142 92
Colombia 1.6 4.4 0.2 −7.2 −2.0 5.1 2.1
Congo, Dem. Rep. of 0.74 −0.92 −0.05 0.66 −0.60 0.24 0.06
Congo, Rep. of 0.034 −0.035 0.032 −0.050 −0.016 0.076 0.040
Costa Rica −0.41 −0.48 0.49 −0.41 0.57 0.55 0.29
Côte d’Ivoire 0.5 1.3 −0.2 0.5 0.2 0.6 2.9
Croatia 1.0 0.0 −0.6 −0.6 3.4 −0.5 2.7
Cyprus 0.24 −0.02 −0.13 −0.42 0.72 0.42 0.81
Czech Republic −0.5 −1.7 2.5 −15.1 9.8 −0.8 −5.7
Denmark −4 −4 −3 −8 6 1 −11
Dominican Republic 1.1 0.9 −1.4 0.0 3.8 1.2 5.6
Ecuador −0.7 0.3 0.6 0.6 −0.4 1.3 1.7
Egypt, Arab Rep. of 0 1 0 1 15 9 25
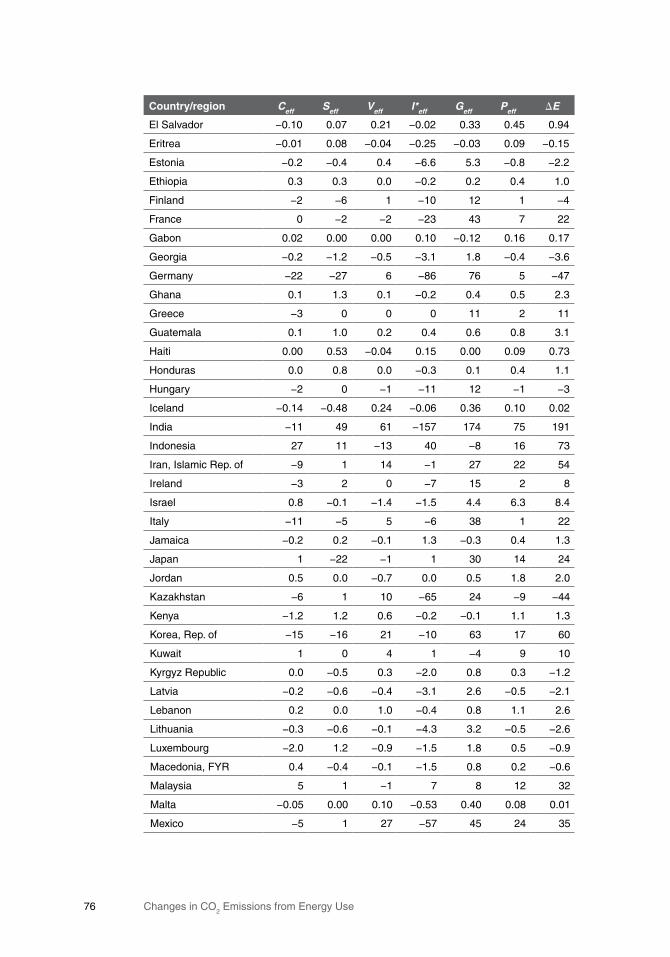
Changes in CO2 Emissions from Energy Use76
Country/region Ceff Seff Veff I*eff Geff Peff E
El Salvador −0.10 0.07 0.21 −0.02 0.33 0.45 0.94
Eritrea −0.01 0.08 −0.04 −0.25 −0.03 0.09 −0.15
Estonia −0.2 −0.4 0.4 −6.6 5.3 −0.8 −2.2
Ethiopia 0.3 0.3 0.0 −0.2 0.2 0.4 1.0
Finland −2 −6 1 −10 12 1 −4
France 0 −2 −2 −23 43 7 22
Gabon 0.02 0.00 0.00 0.10 −0.12 0.16 0.17
Georgia −0.2 −1.2 −0.5 −3.1 1.8 −0.4 −3.6
Germany −22 −27 6 −86 76 5 −47
Ghana 0.1 1.3 0.1 −0.2 0.4 0.5 2.3
Greece −3 0 0 0 11 2 11
Guatemala 0.1 1.0 0.2 0.4 0.6 0.8 3.1
Haiti 0.00 0.53 −0.04 0.15 0.00 0.09 0.73
Honduras 0.0 0.8 0.0 −0.3 0.1 0.4 1.1
Hungary −2 0 −1 −11 12 −1 −3
Iceland −0.14 −0.48 0.24 −0.06 0.36 0.10 0.02
India −11 49 61 −157 174 75 191
Indonesia 27 11 −13 40 −8 16 73
Iran, Islamic Rep. of −9 1 14 −1 27 22 54
Ireland −3 2 0 −7 15 2 8
Israel 0.8 −0.1 −1.4 −1.5 4.4 6.3 8.4
Italy −11 −5 5 −6 38 1 22
Jamaica −0.2 0.2 −0.1 1.3 −0.3 0.4 1.3
Japan 1 −22 −1 1 30 14 24
Jordan 0.5 0.0 −0.7 0.0 0.5 1.8 2.0
Kazakhstan −6 1 10 −65 24 −9 −44
Kenya −1.2 1.2 0.6 −0.2 −0.1 1.1 1.3
Korea, Rep. of −15 −16 21 −10 63 17 60
Kuwait 1 0 4 1 −4 9 10
Kyrgyz Republic 0.0 −0.5 0.3 −2.0 0.8 0.3 −1.2
Latvia −0.2 −0.6 −0.4 −3.1 2.6 −0.5 −2.1
Lebanon 0.2 0.0 1.0 −0.4 0.8 1.1 2.6
Lithuania −0.3 −0.6 −0.1 −4.3 3.2 −0.5 −2.6
Luxembourg −2.0 1.2 −0.9 −1.5 1.8 0.5 −0.9
Macedonia, FYR 0.4 −0.4 −0.1 −1.5 0.8 0.2 −0.6
Malaysia 5 1 −1 7 8 12 32
Malta −0.05 0.00 0.10 −0.53 0.40 0.08 0.01
Mexico −5 1 27 −57 45 24 35
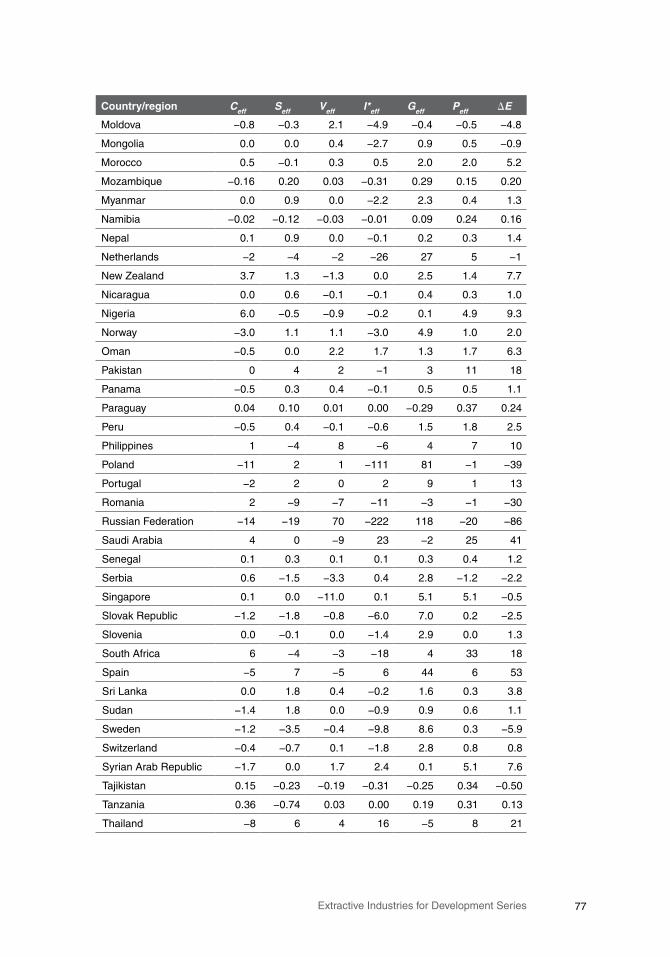
77Extractive Industries for Development Series
Country/region Ceff Seff Veff I*eff Geff Peff E
Moldova −0.8 −0.3 2.1 −4.9 −0.4 −0.5 −4.8
Mongolia 0.0 0.0 0.4 −2.7 0.9 0.5 −0.9
Morocco 0.5 −0.1 0.3 0.5 2.0 2.0 5.2
Mozambique −0.16 0.20 0.03 −0.31 0.29 0.15 0.20
Myanmar 0.0 0.9 0.0 −2.2 2.3 0.4 1.3
Namibia −0.02 −0.12 −0.03 −0.01 0.09 0.24 0.16
Nepal 0.1 0.9 0.0 −0.1 0.2 0.3 1.4
Netherlands −2 −4 −2 −26 27 5 −1
New Zealand 3.7 1.3 −1.3 0.0 2.5 1.4 7.7
Nicaragua 0.0 0.6 −0.1 −0.1 0.4 0.3 1.0
Nigeria 6.0 −0.5 −0.9 −0.2 0.1 4.9 9.3
Norway −3.0 1.1 1.1 −3.0 4.9 1.0 2.0
Oman −0.5 0.0 2.2 1.7 1.3 1.7 6.3
Pakistan 0 4 2 −1 3 11 18
Panama −0.5 0.3 0.4 −0.1 0.5 0.5 1.1
Paraguay 0.04 0.10 0.01 0.00 −0.29 0.37 0.24
Peru −0.5 0.4 −0.1 −0.6 1.5 1.8 2.5
Philippines 1 −4 8 −6 4 7 10
Poland −11 2 1 −111 81 −1 −39
Portugal −2 2 0 2 9 1 13
Romania 2 −9 −7 −11 −3 −1 −30
Russian Federation −14 −19 70 −222 118 −20 −86
Saudi Arabia 4 0 −9 23 −2 25 41
Senegal 0.1 0.3 0.1 0.1 0.3 0.4 1.2
Serbia 0.6 −1.5 −3.3 0.4 2.8 −1.2 −2.2
Singapore 0.1 0.0 −11.0 0.1 5.1 5.1 −0.5
Slovak Republic −1.2 −1.8 −0.8 −6.0 7.0 0.2 −2.5
Slovenia 0.0 −0.1 0.0 −1.4 2.9 0.0 1.3
South Africa 6 −4 −3 −18 4 33 18
Spain −5 7 −5 6 44 6 53
Sri Lanka 0.0 1.8 0.4 −0.2 1.6 0.3 3.8
Sudan −1.4 1.8 0.0 −0.9 0.9 0.6 1.1
Sweden −1.2 −3.5 −0.4 −9.8 8.6 0.3 −5.9
Switzerland −0.4 −0.7 0.1 −1.8 2.8 0.8 0.8
Syrian Arab Republic −1.7 0.0 1.7 2.4 0.1 5.1 7.6
Tajikistan 0.15 −0.23 −0.19 −0.31 −0.25 0.34 −0.50
Tanzania 0.36 −0.74 0.03 0.00 0.19 0.31 0.13
Thailand −8 6 4 16 −5 8 21
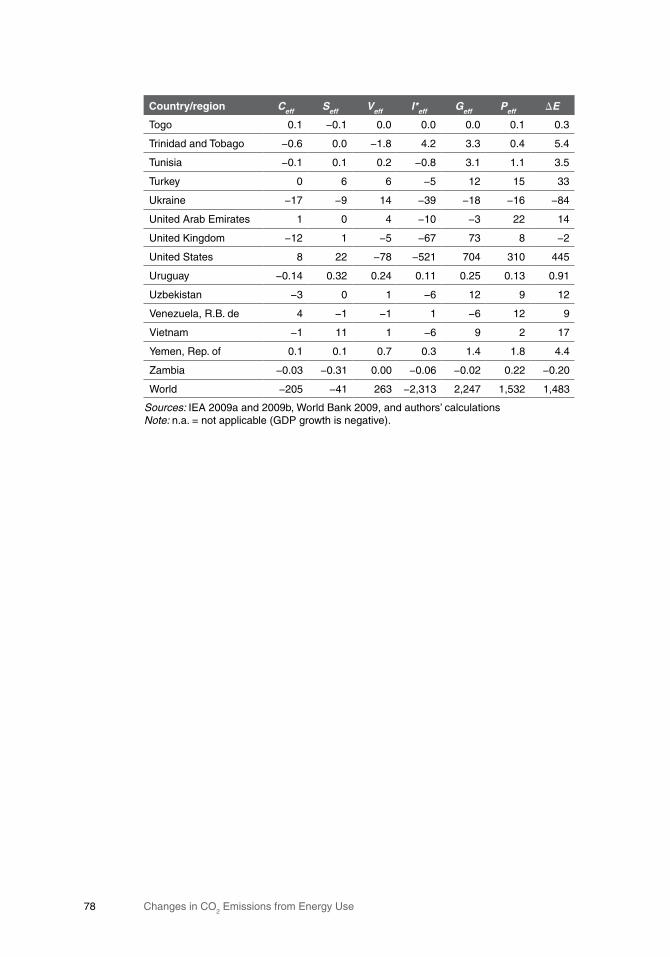
Changes in CO2 Emissions from Energy Use78
Country/region Ceff Seff Veff I*eff Geff Peff E
Togo 0.1 −0.1 0.0 0.0 0.0 0.1 0.3
Trinidad and Tobago −0.6 0.0 −1.8 4.2 3.3 0.4 5.4
Tunisia −0.1 0.1 0.2 −0.8 3.1 1.1 3.5
Turkey 0 6 6 −5 12 15 33
Ukraine −17 −9 14 −39 −18 −16 −84
United Arab Emirates 1 0 4 −10 −3 22 14
United Kingdom −12 1 −5 −67 73 8 −2
United States 8 22 −78 −521 704 310 445
Uruguay −0.14 0.32 0.24 0.11 0.25 0.13 0.91
Uzbekistan −3 0 1 −6 12 9 12
Venezuela, R.B. de 4 −1 −1 1 −6 12 9
Vietnam −1 11 1 −6 9 2 17
Yemen, Rep. of 0.1 0.1 0.7 0.3 1.4 1.8 4.4
Zambia −0.03 −0.31 0.00 −0.06 −0.02 0.22 −0.20
World −205 −41 263 −2,313 2,247 1,532 1,483
Sources: IEA 2009a and 2009b, World Bank 2009, and authors’ calculationsNote: n.a. = not applicable (GDP growth is negative).

79Extractive Industries for Development Series
TableC.3 Six-FactorDecompositionAnalysisbetween1999−2001and2004−06BasedonIEADatamillion tonnes of CO2
Country/region Ceff Seff Veff I*eff Geff Peff E
Albania −0.33 0.48 0.04 −0.21 0.86 0.08 0.92
Algeria 2 0 −8 5 11 6 16
Angola 0.6 0.7 −0.4 −1.5 2.3 0.9 2.7
Argentina 2 1 −4 −1 8 7 13
Armenia 0.0 −0.1 −0.9 −0.4 2.1 −0.1 0.6
Australia 5 3 11 −34 36 23 43
Austria 1.0 −1.0 0.6 3.4 3.9 1.7 9.6
Azerbaijan −1 0 0 −15 18 1 3
Bangladesh 0 3 1 −2 5 3 10
Belarus −2 1 2 −17 23 −1 5
Belgium −6 −1 1 −11 8 2 −6
Benin 0.1 0.6 0.0 0.0 0.1 0.3 1.2
Bolivia 1.7 0.2 0.5 −0.4 0.6 1.0 3.6
Bosnia & Herzegovina −1.1 1.1 −0.1 0.0 3.1 0.4 3.5
Botswana 0.1 0.1 0.0 −1.0 0.9 0.3 0.3
Brazil 3 −22 3 −8 25 22 24
Brunei Darussalam 0.36 0.00 −0.31 0.21 0.01 0.56 0.83
Bulgaria 0.6 −0.1 −1.3 −8.1 13.5 −1.8 2.9
Cambodia −0.1 0.9 0.0 −0.8 1.1 0.3 1.3
Cameroon 0.0 0.1 0.1 −0.3 0.2 0.3 0.4
Canada −14 −6 5 −33 47 26 25
Chile 0.6 −2.2 0.6 −5.3 8.5 3.1 5.3
China −62 286 427 −477 1,714 127 2,015
Colombia −3.3 0.0 1.6 −10.4 7.5 4.5 −0.2
Congo, Dem. Rep. of 0.15 −0.28 −0.02 −0.06 0.06 0.32 0.17
Congo, Rep. of −0.13 0.31 0.05 0.05 0.08 0.09 0.45
Costa Rica 0.2 −0.5 0.0 0.1 0.6 0.5 1.0
Côte d’Ivoire −0.5 −0.1 −0.8 1.3 −0.6 0.5 −0.2
Croatia 0.3 −0.1 −0.7 −1.5 4.6 −0.1 2.4
Cyprus 0.36 −0.02 −0.26 −0.34 0.66 0.40 0.80
Czech Republic −1.5 −10.6 2.4 −9.7 22.8 −0.3 3.1
Denmark 0.4 −2.5 −0.4 −2.2 3.1 0.8 −0.9
Dominican Republic 1.0 −0.3 −0.5 −2.6 1.9 1.4 0.9
Ecuador −1.1 1.0 2.2 −2.1 3.9 1.2 5.2
Egypt, Arab Rep. of 3 2 0 9 12 12 38
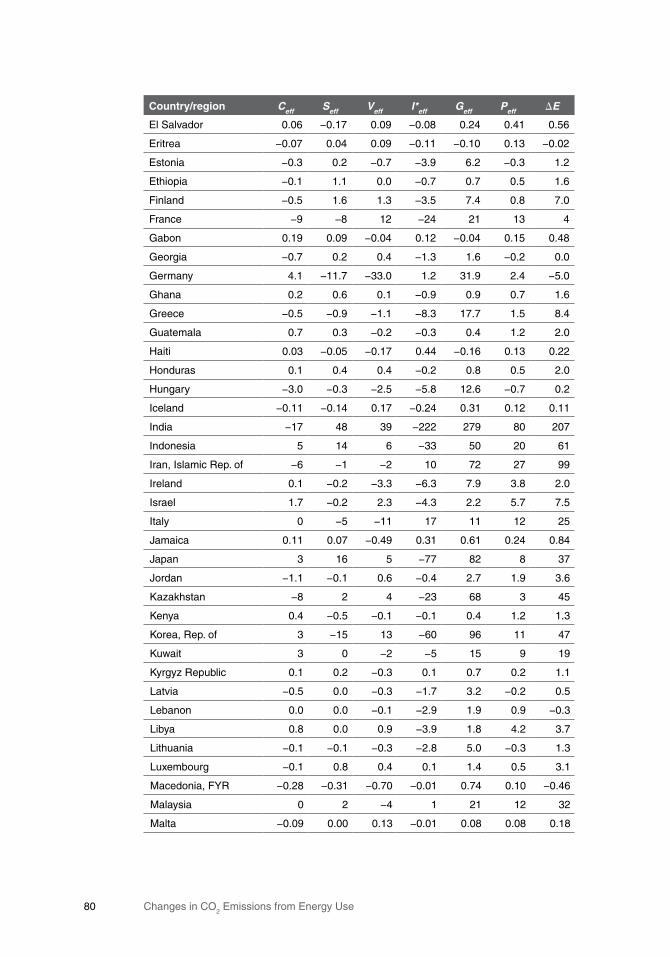
Changes in CO2 Emissions from Energy Use80
Country/region Ceff Seff Veff I*eff Geff Peff E
El Salvador 0.06 −0.17 0.09 −0.08 0.24 0.41 0.56
Eritrea −0.07 0.04 0.09 −0.11 −0.10 0.13 −0.02
Estonia −0.3 0.2 −0.7 −3.9 6.2 −0.3 1.2
Ethiopia −0.1 1.1 0.0 −0.7 0.7 0.5 1.6
Finland −0.5 1.6 1.3 −3.5 7.4 0.8 7.0
France −9 −8 12 −24 21 13 4
Gabon 0.19 0.09 −0.04 0.12 −0.04 0.15 0.48
Georgia −0.7 0.2 0.4 −1.3 1.6 −0.2 0.0
Germany 4.1 −11.7 −33.0 1.2 31.9 2.4 −5.0
Ghana 0.2 0.6 0.1 −0.9 0.9 0.7 1.6
Greece −0.5 −0.9 −1.1 −8.3 17.7 1.5 8.4
Guatemala 0.7 0.3 −0.2 −0.3 0.4 1.2 2.0
Haiti 0.03 −0.05 −0.17 0.44 −0.16 0.13 0.22
Honduras 0.1 0.4 0.4 −0.2 0.8 0.5 2.0
Hungary −3.0 −0.3 −2.5 −5.8 12.6 −0.7 0.2
Iceland −0.11 −0.14 0.17 −0.24 0.31 0.12 0.11
India −17 48 39 −222 279 80 207
Indonesia 5 14 6 −33 50 20 61
Iran, Islamic Rep. of −6 −1 −2 10 72 27 99
Ireland 0.1 −0.2 −3.3 −6.3 7.9 3.8 2.0
Israel 1.7 −0.2 2.3 −4.3 2.2 5.7 7.5
Italy 0 −5 −11 17 11 12 25
Jamaica 0.11 0.07 −0.49 0.31 0.61 0.24 0.84
Japan 3 16 5 −77 82 8 37
Jordan −1.1 −0.1 0.6 −0.4 2.7 1.9 3.6
Kazakhstan −8 2 4 −23 68 3 45
Kenya 0.4 −0.5 −0.1 −0.1 0.4 1.2 1.3
Korea, Rep. of 3 −15 13 −60 96 11 47
Kuwait 3 0 −2 −5 15 9 19
Kyrgyz Republic 0.1 0.2 −0.3 0.1 0.7 0.2 1.1
Latvia −0.5 0.0 −0.3 −1.7 3.2 −0.2 0.5
Lebanon 0.0 0.0 −0.1 −2.9 1.9 0.9 −0.3
Libya 0.8 0.0 0.9 −3.9 1.8 4.2 3.7
Lithuania −0.1 −0.1 −0.3 −2.8 5.0 −0.3 1.3
Luxembourg −0.1 0.8 0.4 0.1 1.4 0.5 3.1
Macedonia, FYR −0.28 −0.31 −0.70 −0.01 0.74 0.10 −0.46
Malaysia 0 2 −4 1 21 12 32
Malta −0.09 0.00 0.13 −0.01 0.08 0.08 0.18
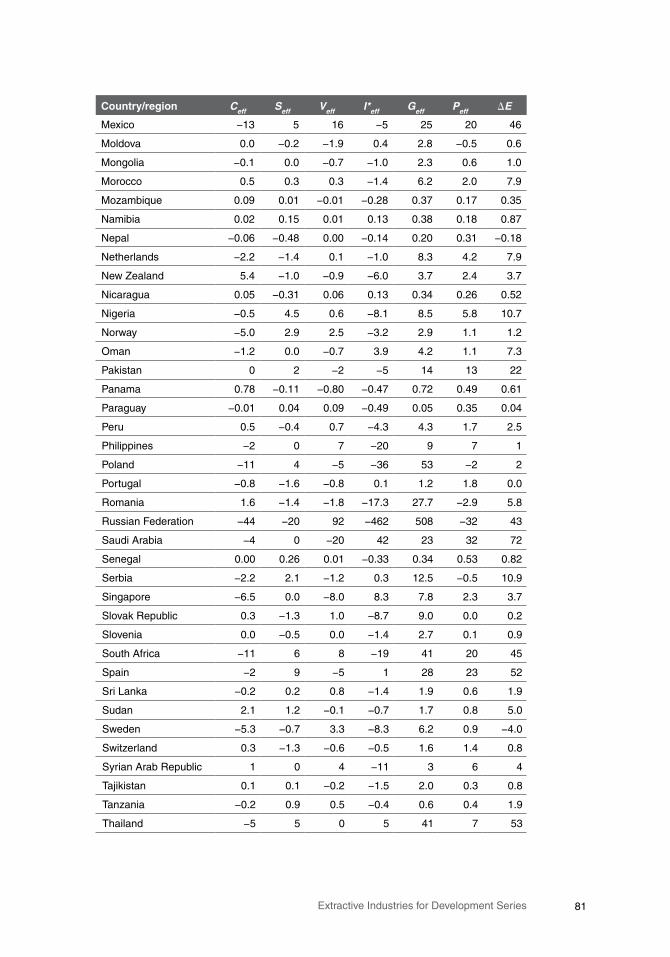
81Extractive Industries for Development Series
Country/region Ceff Seff Veff I*eff Geff Peff E
Mexico −13 5 16 −5 25 20 46
Moldova 0.0 −0.2 −1.9 0.4 2.8 −0.5 0.6
Mongolia −0.1 0.0 −0.7 −1.0 2.3 0.6 1.0
Morocco 0.5 0.3 0.3 −1.4 6.2 2.0 7.9
Mozambique 0.09 0.01 −0.01 −0.28 0.37 0.17 0.35
Namibia 0.02 0.15 0.01 0.13 0.38 0.18 0.87
Nepal −0.06 −0.48 0.00 −0.14 0.20 0.31 −0.18
Netherlands −2.2 −1.4 0.1 −1.0 8.3 4.2 7.9
New Zealand 5.4 −1.0 −0.9 −6.0 3.7 2.4 3.7
Nicaragua 0.05 −0.31 0.06 0.13 0.34 0.26 0.52
Nigeria −0.5 4.5 0.6 −8.1 8.5 5.8 10.7
Norway −5.0 2.9 2.5 −3.2 2.9 1.1 1.2
Oman −1.2 0.0 −0.7 3.9 4.2 1.1 7.3
Pakistan 0 2 −2 −5 14 13 22
Panama 0.78 −0.11 −0.80 −0.47 0.72 0.49 0.61
Paraguay −0.01 0.04 0.09 −0.49 0.05 0.35 0.04
Peru 0.5 −0.4 0.7 −4.3 4.3 1.7 2.5
Philippines −2 0 7 −20 9 7 1
Poland −11 4 −5 −36 53 −2 2
Portugal −0.8 −1.6 −0.8 0.1 1.2 1.8 0.0
Romania 1.6 −1.4 −1.8 −17.3 27.7 −2.9 5.8
Russian Federation −44 −20 92 −462 508 −32 43
Saudi Arabia −4 0 −20 42 23 32 72
Senegal 0.00 0.26 0.01 −0.33 0.34 0.53 0.82
Serbia −2.2 2.1 −1.2 0.3 12.5 −0.5 10.9
Singapore −6.5 0.0 −8.0 8.3 7.8 2.3 3.7
Slovak Republic 0.3 −1.3 1.0 −8.7 9.0 0.0 0.2
Slovenia 0.0 −0.5 0.0 −1.4 2.7 0.1 0.9
South Africa −11 6 8 −19 41 20 45
Spain −2 9 −5 1 28 23 52
Sri Lanka −0.2 0.2 0.8 −1.4 1.9 0.6 1.9
Sudan 2.1 1.2 −0.1 −0.7 1.7 0.8 5.0
Sweden −5.3 −0.7 3.3 −8.3 6.2 0.9 −4.0
Switzerland 0.3 −1.3 −0.6 −0.5 1.6 1.4 0.8
Syrian Arab Republic 1 0 4 −11 3 6 4
Tajikistan 0.1 0.1 −0.2 −1.5 2.0 0.3 0.8
Tanzania −0.2 0.9 0.5 −0.4 0.6 0.4 1.9
Thailand −5 5 0 5 41 7 53
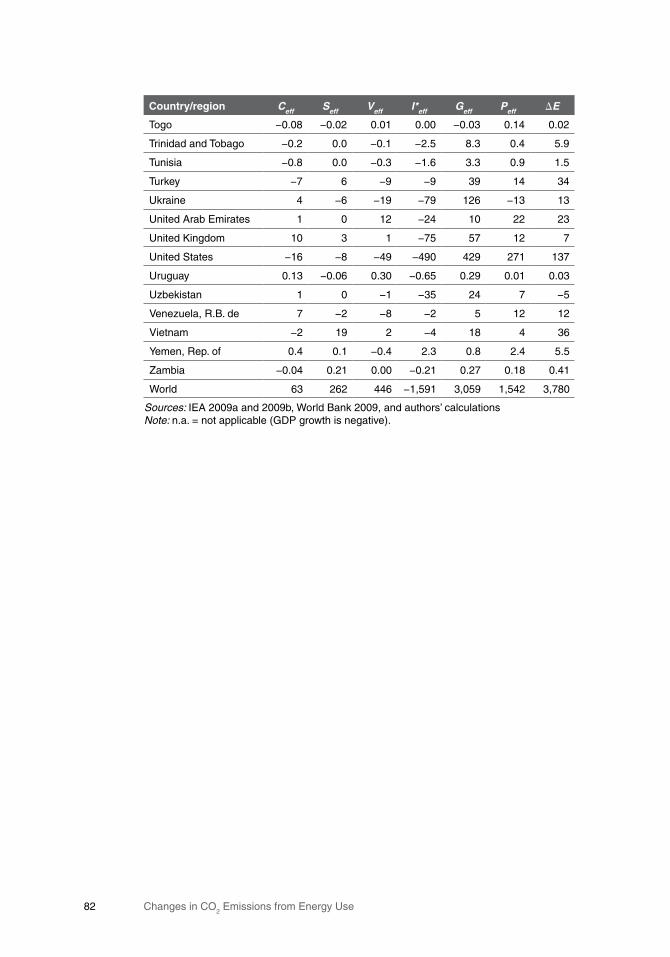
Changes in CO2 Emissions from Energy Use82
Country/region Ceff Seff Veff I*eff Geff Peff E
Togo −0.08 −0.02 0.01 0.00 −0.03 0.14 0.02
Trinidad and Tobago −0.2 0.0 −0.1 −2.5 8.3 0.4 5.9
Tunisia −0.8 0.0 −0.3 −1.6 3.3 0.9 1.5
Turkey −7 6 −9 −9 39 14 34
Ukraine 4 −6 −19 −79 126 −13 13
United Arab Emirates 1 0 12 −24 10 22 23
United Kingdom 10 3 1 −75 57 12 7
United States −16 −8 −49 −490 429 271 137
Uruguay 0.13 −0.06 0.30 −0.65 0.29 0.01 0.03
Uzbekistan 1 0 −1 −35 24 7 −5
Venezuela, R.B. de 7 −2 −8 −2 5 12 12
Vietnam −2 19 2 −4 18 4 36
Yemen, Rep. of 0.4 0.1 −0.4 2.3 0.8 2.4 5.5
Zambia −0.04 0.21 0.00 −0.21 0.27 0.18 0.41
World 63 262 446 −1,591 3,059 1,542 3,780
Sources: IEA 2009a and 2009b, World Bank 2009, and authors’ calculationsNote: n.a. = not applicable (GDP growth is negative).
83Extractive Industries for Development Series
References
Ang, B. W. 2004. “Decomposition Analysis for Policymaking in Energy: Which Is the Preferred Method?” Energy Policy 32(9): 1131–39.
Bacon, Robert, and Soma Bhattacharya. 2007. Growth and CO2 Emissions: How Do
Different Countries Fare? Environment Department Papers 113. Washington, DC: World Bank. http://go.worldbank.org/EJ8ASPDSP2.
Bacon, Robert, and Masami Kojima. 2008. Vulnerability to Oil Price Increases: A Decomposition Analysis of 161 Countries. Extractive Industries for Develop-ment Series #1. Washington, DC: World Bank. http://siteresources.world-bank.org/INTOGMC/Resources/eid1_oil_price_vulnerability.pdf.
Baer, Paul, Tom Athanasiou, Sivan Kartha, and Eric Kemp-Benedict. 2008. The Greenhouse Development Rights Framework. Revised 2nd edition. Berlin: Heinrich Böll Foundation, Christian Aid, EcoEquity, and the Stockholm Environment Institute. www.sei-us.org/climate-and-energy/GDR-second-edition.pdf.
Bosch, Robert. 2009. “Assessment of Global Mitigation Progress: A Decomposi-tion of CO
2 Emissions for the World’s Top Emitting Countries.” www.usaee.
org/usaee2009/submissions/OnlineProceedings/IAEE2009_Paper_545_Dirk%20C%20Boehm.pdf.
Diakoulaki, D., and M. Mandaraka. 2007. “Decomposition Analysis for Assess-ing the Progress in Decoupling Industrial Growth from CO
2 Emissions in
the EU Manufacturing Sector.” Energy Economics 29(4): 636–64.
IEA (International Energy Agency). 2009a. CO2 Emissions from Fuel Combustion
(Detailed Estimates). Vol. 2008 release 01. Database edition. Paris: Organisa-tion for Economic Co-operation and Development.
—. 2009b. IEA World Energy Statistics and Balances. Database edition. Paris: Organisation for Economic Co-operation and Development.
IPCC (Intergovernmental Panel on Climate Change). 2007. “Chapter 3: Issues Related to Mitigation in the Long Term Context.” In B. Metz, O. R. David-son, P. R. Bosch, R. Dave, and L. A. Meyer, eds., Mitigation and Climate Change. Cambridge, UK: Cambridge University Press. www.ipcc.ch/pdf/assessment-report/ar4/wg3/ar4-wg3-chapter3.pdf.
Karakaya, Etem, and Mustafa Özça ̌g . 2005. “Driving Forces of CO2 Emissions in
Central Asia: A Decomposition Analysis of Air Pollution From Fossil Fuel Combustion.” Arid Ecosystems Journal 11(26–27): 49–57.
Changes in CO2 Emissions from Energy Use84
Kaya, Y. 1990. “Impact of Carbon Dioxide Emission Control on GNP Growth: Interpretation of Proposed Scenarios.” Paper presented to Intergovernmental Panel on Climate Change Energy and Industry Sub-group, Response Strate-gies Working Group. Paris.
Liao, Hua, Ying Fan, and Yi-Ming Wei. 2007. “What Induced China’s Energy Intensity to Fluctuate: 1997–2006?” Energy Policy 35(9): 4640–49
NBS (National Bureau of Statistics of China). 2007. “Statistical Communique of the People’s Republic of China on the 2006 National Economic and Social Development.” February 28. www.stats.gov.cn/english/newsandcomingevents/t20070301_402388091.htm.
—. 2008. “Statistical Communique of the People’s Republic of China on the 2007 National Economic and Social Development.” February 28. www.stats.gov.cn/was40/gjtjj_en_detail.jsp?channelid=4920&record=10.
—. 2009. “Communique on Energy Consumption per Unit of GDP by Regions in 2008.” June 30. www.stats.gov.cn/was40/gjtjj_en_detail.jsp?channelid=4920&record=1.
OECD (Organisation for Economic Co-operation and Development). 2002. Indi-cators to Measure Decoupling of Environmental Pressure from Economic Growth. SG/SD(2002)1/FINAL. Paris: OECD.
Spence, Michael. 2009. Climate Change, Mitigation, and Developing Country Growth. Commission on Growth and Development Working Paper 64. Washington, DC: World Bank. www.growthcommission.org/storage/cgdev/documents/gcwp064812web.pdf.
Turton, Hal, and Clive Hamilton. 1999. Population Growth and Greenhouse Gas Emissions. Sources, Trends and Projections in Australia. Discussion Paper Num-ber 26. Melbourne: The Australia Institute.
U.S. EIA (Energy Information Administration). 2009. “International Data.” www.eia.doe.gov/emeu/international/contents.html.
Vivid Economics. 2009. G20 Low Carbon Competitiveness. Report prepared for the Climate Institute and E3G. www.e3g.org/images/uploads/G20_Low_Carbon_Competitiveness_Report.pdf.
World Bank. 2009. World Development Indicators. Online subscription database.
ExtractiveIndustriesforDevelopmentSeries
#10 GovernmentResponsetoOilPriceVolatility:Experienceof49DevelopingCountries
#9 GuidanceNoteforTaskTeamLeaders:MainstreamingGenderintoExtractiveIndustriesProjects
#8 MiningforEquity:GenderDimensionsoftheExtractiveIndustries
#7 GuidanceNotesfortheImplementationofFinancialSuretyforMineClosure
#6 ChangingPatternsofHouseholdExpendituresonEnergy:ACaseStudyofIndonesiaandPakistan
#5 EmergingPlayersinGlobalMining
#4 MiningCadastres:PromotingTransparentAccesstoMineralResources
#3 ExtractiveIndustriesValueChain:AComprehensiveIntegratedApproachtoDevelopingExtractiveIndustries
#2 ChangesinEnd-UserPetroleumProductPrices:AComparisonof48Countries
#1 VulnerabilitytoOilPriceIncreases:ADecompositionAnalysisof161Countries


The World Bank Oil, Gas, and Mining Policy Division
The World Bank Group's role in the oil, gas, and mining sectors focuses on ensur-ing that its current interventions facilitate the extractive industries' contribution to poverty alleviation and economic growth through the promotion of good gover-nance and sustainable development.
The Oil, Gas, and Mining Policy Division serves as the Bank's global sector man-agement unit on extractive industries and related issues for all the regions of the world. It is part of the Oil, Gas, Mining, and Chemicals Department, a joint World Bank/International Finance Corporation department.
Through loans/credits/grants, technical assistance, policy dialogue, and analytical work, the Division leads a work program with multiple activities in more than 70 countries, of which almost half are in Sub-Saharan Africa. More specifically, the Division:
• Advises governments on legal, fiscal, and regulatory issues and on institutional arrangements as they relate to natural resources, as well as on good governance practices.
• Assists governments in setting up environmental and social safeguards in projects in order to promote the sustainable development of extractive industries.
• Helps governments formulate policies that promote private sector growth and foreign direct and domestic private sector investments.
• Advises governments on how to increase the access of the poor to clean commercial energy and to assess options for protecting the poor from high fuel prices.
The Oil, Gas, and Mining Policy Division serves as a global technical advi sor that supports sustainable development by building capacity and provid ing extractive industry sector-related advisory services to resource-rich developing country gov-ernments. The Division also carries out an advocacy role through its man agement of the following global programs:
• The Extractive Industries Transparency Initiative (EITI) Multi-Donor Trust Fund, which supports countries in implementing EITI programs.
• The Global Gas Flaring Reduction (GGFR) Public-Private Partnership, which brings governments and oil companies together to reduce gas flaring.
• The Communities and Small-Scale Mining (CASM) Partnership, which promotes an integrated approach to addressing issues faced by artisanal and small-scale miners.
• The Gender and Extractive Industries Program, which addresses gender issues in extractive industries.
• The Petroleum Governance Initiative (PGI), which promotes petroleum governance frameworks, including linkages to environmental and community issues.

The World Bank1818 H Street, N.W.Washington, D.C. 20433USA
www.worldbank.org/ogmc (or /oil or /gas or /mining)www.ifc.org/ogmc (or /oil or /gas or /mining)