Embed Size (px)
Citation preview
EIHA16/D10_Beachlitter
MSFD Descriptor :4 - Marine food websMSFD Commission Criteria: 4.2 - Proportion of selected species at the top of food webs; 4.3 - Abundance/distribution of key trophic groups/species
Change in Mean Trophic Level of Marine Predators in the Bay of Biscay
Area
ass
esse
d in
blu
e
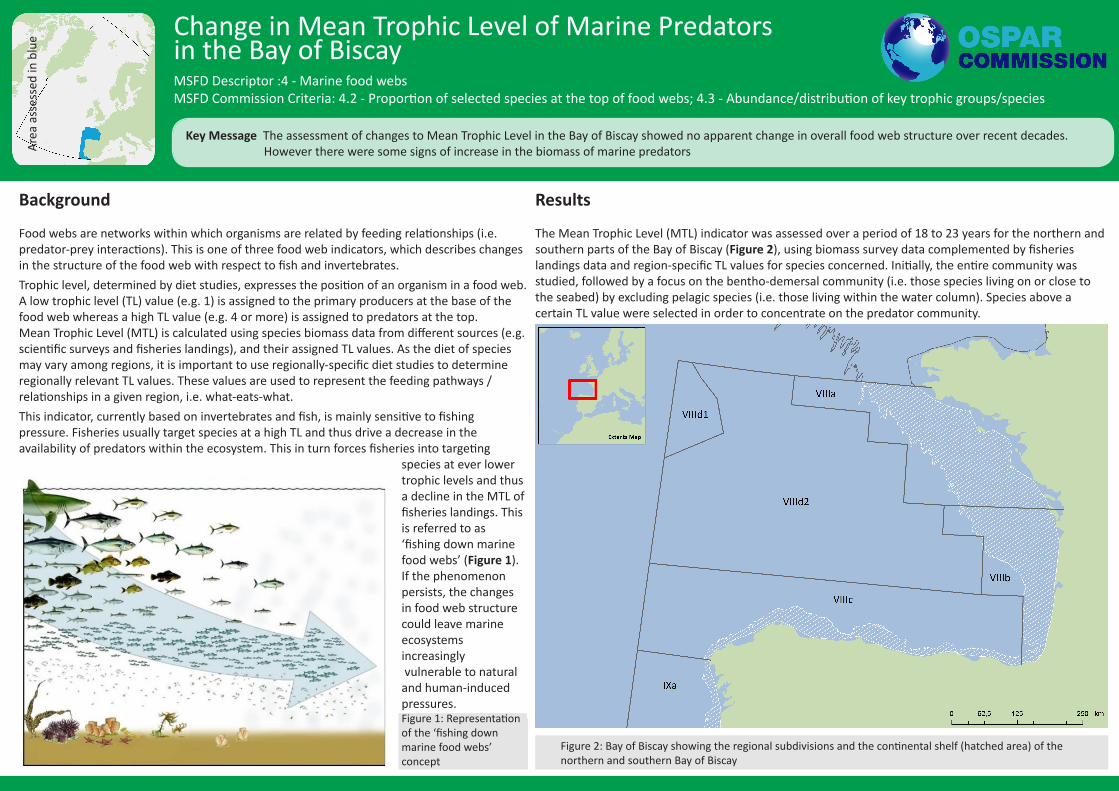
Key Message The assessment of changes to Mean Trophic Level in the Bay of Biscay showed no apparent change in overall food web structure over recent decades. However there were some signs of increase in the biomass of marine predators
Background
Food webs are networks within which organisms are related by feeding relationships (i.e. predator-prey interactions). This is one of three food web indicators, which describes changes in the structure of the food web with respect to fish and invertebrates. Trophic level, determined by diet studies, expresses the position of an organism in a food web. A low trophic level (TL) value (e.g. 1) is assigned to the primary producers at the base of the food web whereas a high TL value (e.g. 4 or more) is assigned to predators at the top.Mean Trophic Level (MTL) is calculated using species biomass data from different sources (e.g. scientific surveys and fisheries landings), and their assigned TL values. As the diet of species may vary among regions, it is important to use regionally-specific diet studies to determine regionally relevant TL values. These values are used to represent the feeding pathways / relationships in a given region, i.e. what-eats-what. This indicator, currently based on invertebrates and fish, is mainly sensitive to fishing pressure. Fisheries usually target species at a high TL and thus drive a decrease in the availability of predators within the ecosystem. This in turn forces fisheries into targeting
species at ever lower trophic levels and thus a decline in the MTL of fisheries landings. This is referred to as ‘fishing down marine food webs’ (Figure 1). If the phenomenon persists, the changes in food web structure could leave marine ecosystems increasingly vulnerable to natural and human-induced pressures.Figure 1: Representation of the ‘fishing down marine food webs’ concept
Results
The Mean Trophic Level (MTL) indicator was assessed over a period of 18 to 23 years for the northern and southern parts of the Bay of Biscay (Figure 2), using biomass survey data complemented by fisheries landings data and region-specific TL values for species concerned. Initially, the entire community was studied, followed by a focus on the bentho-demersal community (i.e. those species living on or close to the seabed) by excluding pelagic species (i.e. those living within the water column). Species above a certain TL value were selected in order to concentrate on the predator community.
Figure 2: Bay of Biscay showing the regional subdivisions and the continental shelf (hatched area) of the northern and southern Bay of Biscay
Conclusion
The Mean Trophic Level (MTL) in the southern and northern Bay of Biscay showed no apparent change in the overall food web structure resulting from fishing pressure (MTL 2.0 in Table 1). However there were some signs of improvements when focusing in on the predator community (MTL 3.25 and 4.0 in Table 1).Using the MTL indicator results from survey data complemented by those from landings data, reinforces the signal of food web state. In the same way, using regional trophic level values provides a better view of community structure within the study region and strengthens the accuracy of this assessment. Examining the community as a whole (both with and without pelagic species) as well as focusing specifically on predators, makes it possible to detect changes in food web structure.
Knowledge Gaps
Understanding the feeding relationships between species occurring in a specific region is essential to conduct a robust assessment of the food web, whether using the MTL indicator or any other Trophic Level based indicator. It is not currently possible to apply the MTL indicator anywhere other than the Bay of Biscay, owing to a lack of detailed information on feeding interactions and region-specific Trophic Level (TL) values. Repeated dietary studies implemented at the (sub)-regional scale and the computation of TL values would help fill this gap in knowledge. To improve the assessment of the state of the food web, further work on the MTL indicator could include: incorporating additional datasets on biological compartments that are not currently included (e.g. benthos, mammals, or birds); investigating the influence of various anthropogenic pressures; exploring finer geographic scales; and further defining assessment values.
Change in Mean Trophic Level of Marine Predators in the Bay of Biscay
Results cont...
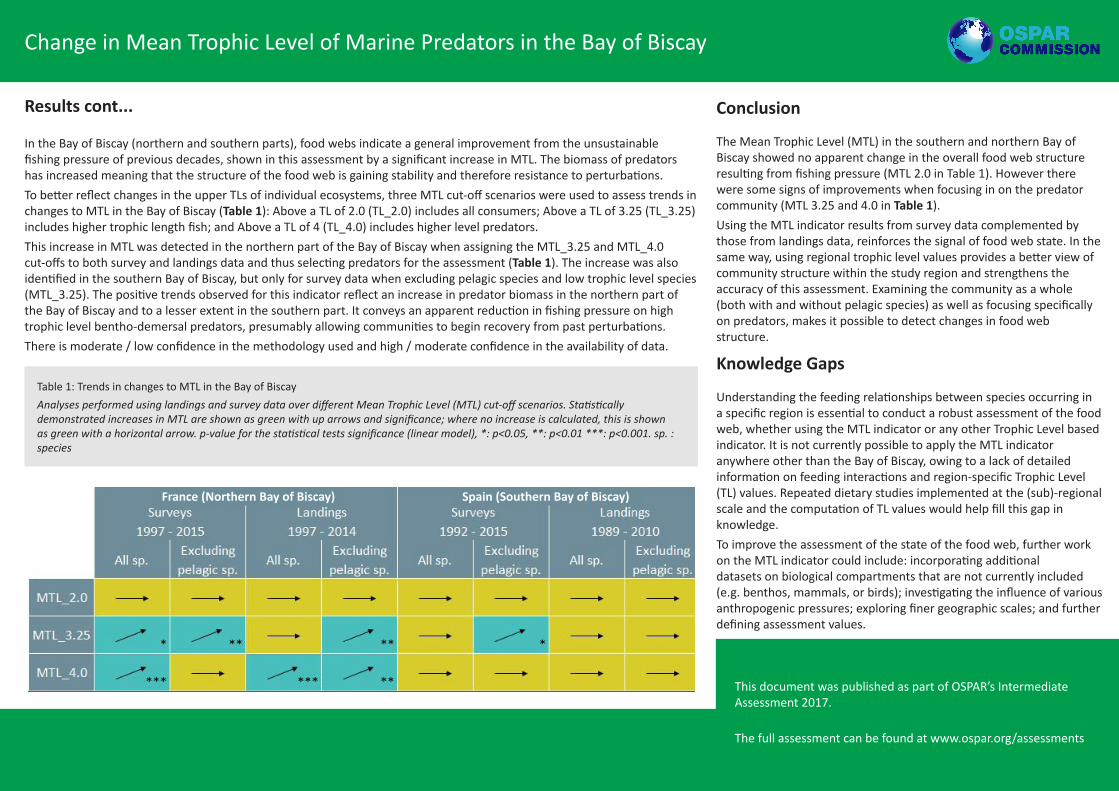
In the Bay of Biscay (northern and southern parts), food webs indicate a general improvement from the unsustainable fishing pressure of previous decades, shown in this assessment by a significant increase in MTL. The biomass of predators has increased meaning that the structure of the food web is gaining stability and therefore resistance to perturbations.To better reflect changes in the upper TLs of individual ecosystems, three MTL cut-off scenarios were used to assess trends in changes to MTL in the Bay of Biscay (Table 1): Above a TL of 2.0 (TL_2.0) includes all consumers; Above a TL of 3.25 (TL_3.25) includes higher trophic length fish; and Above a TL of 4 (TL_4.0) includes higher level predators. This increase in MTL was detected in the northern part of the Bay of Biscay when assigning the MTL_3.25 and MTL_4.0 cut-offs to both survey and landings data and thus selecting predators for the assessment (Table 1). The increase was also identified in the southern Bay of Biscay, but only for survey data when excluding pelagic species and low trophic level species (MTL_3.25). The positive trends observed for this indicator reflect an increase in predator biomass in the northern part of the Bay of Biscay and to a lesser extent in the southern part. It conveys an apparent reduction in fishing pressure on high trophic level bentho-demersal predators, presumably allowing communities to begin recovery from past perturbations. There is moderate / low confidence in the methodology used and high / moderate confidence in the availability of data.
This document was published as part of OSPAR’s Intermediate Assessment 2017.
The full assessment can be found at www.ospar.org/assessments
France (Northern Bay of Biscay) Spain (Southern Bay of Biscay)
Table 1: Trends in changes to MTL in the Bay of BiscayAnalyses performed using landings and survey data over different Mean Trophic Level (MTL) cut-off scenarios. Statistically demonstrated increases in MTL are shown as green with up arrows and significance; where no increase is calculated, this is shown as green with a horizontal arrow. p-value for the statistical tests significance (linear model), *: p<0.05, **: p<0.01 ***: p<0.001. sp. : species