Embed Size (px)
Citation preview
Challenges in using indicators to quantify ecosystems services for a CBA in the framework of ECLAIRE
Wilfried Winiwarter
ECLAIRE
• Measurements at different scales• Modelling at different scales• Integrated Risk Assessment
and Policy Tools
• http://www.eclaire-fp7.eu/• Coordinated by CEH Edinburgh
(Mark Sutton)
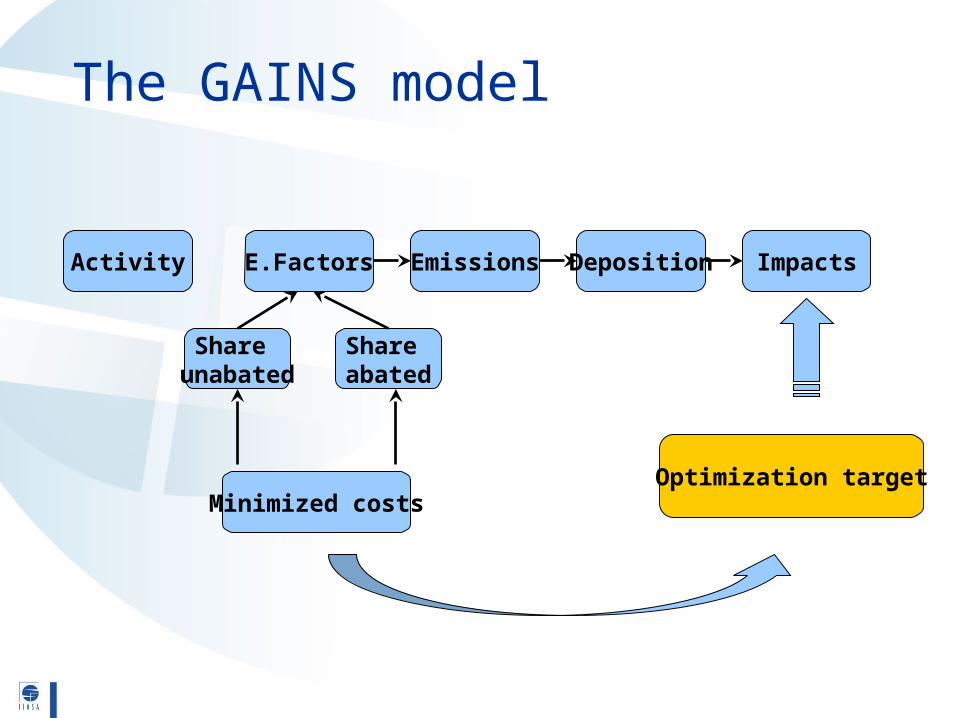
The GAINS model
Minimized costs
Share unabated
ImpactsEmissions DepositionActivity E.Factors
Share abated
Optimization target
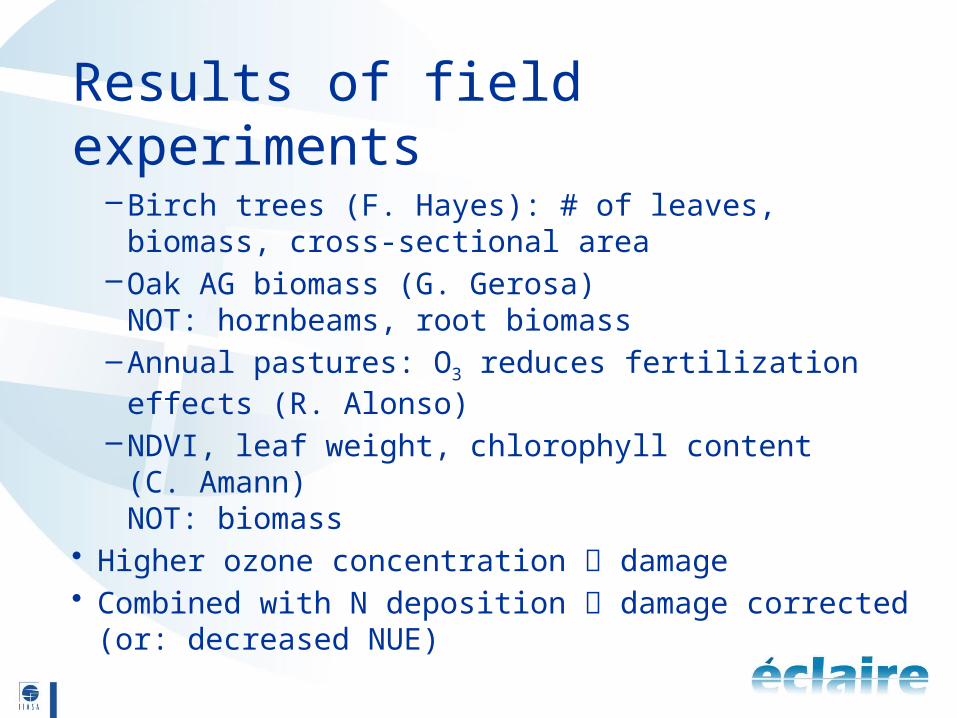
Results of field experiments
– Birch trees (F. Hayes): # of leaves, biomass, cross-sectional area
– Oak AG biomass (G. Gerosa) NOT: hornbeams, root biomass
– Annual pastures: O3 reduces fertilization effects (R. Alonso)
– NDVI, leaf weight, chlorophyll content (C. Amann)NOT: biomass
• Higher ozone concentration damage• Combined with N deposition damage corrected (or:
decreased NUE)
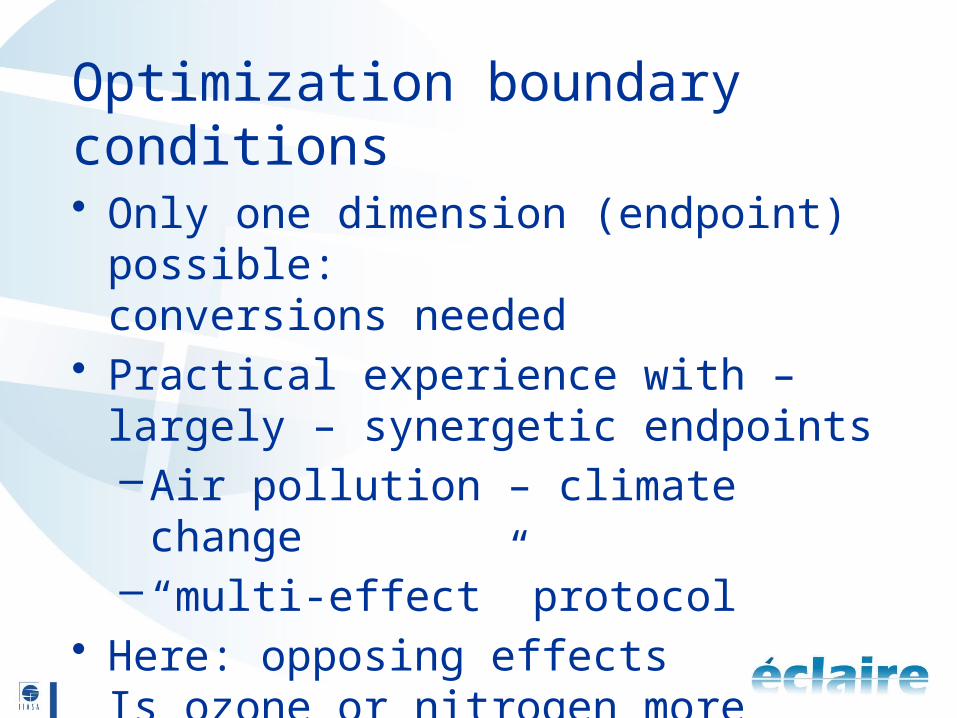
Optimization boundary conditions
• Only one dimension (endpoint) possible: conversions needed
• Practical experience with – largely – synergetic endpoints–Air pollution – climate change– “multi-effect” protocol
• Here: opposing effectsIs ozone or nitrogen more important?
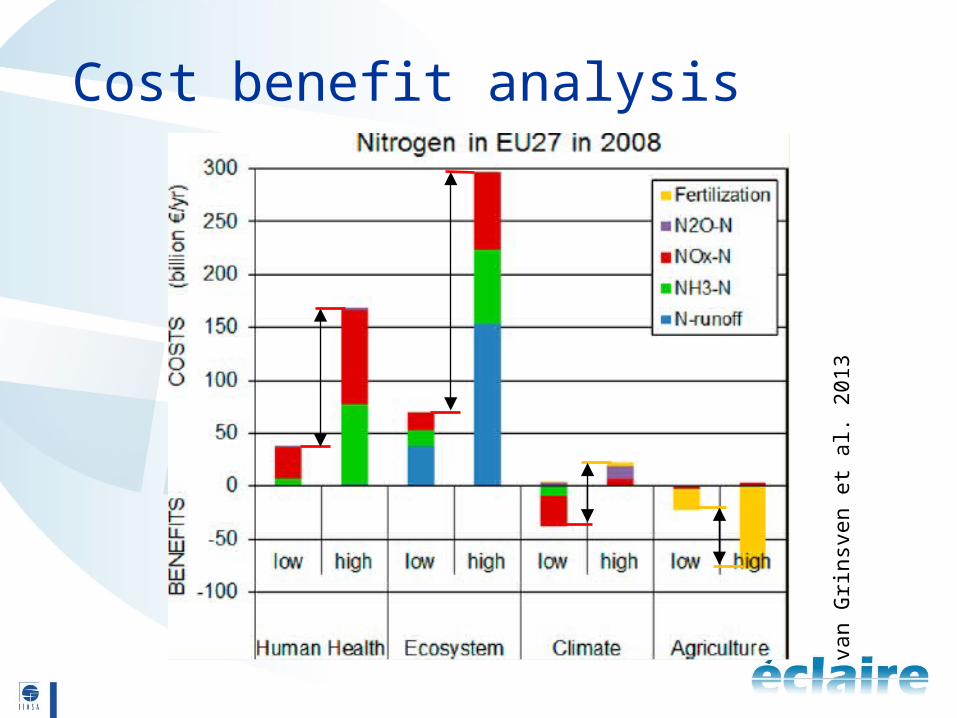
Cost benefit analysis
van
Grin
sven
et a
l. 20
13
Valuation of ecosystems services
• Framework (Mike Holland)–Quantification of benefits–Treat those services qualitatively, for
which quantification can not be given
–Here: additional forest biomass due to N–Quantification of biodiversity value is
difficult
Focus on market values ?
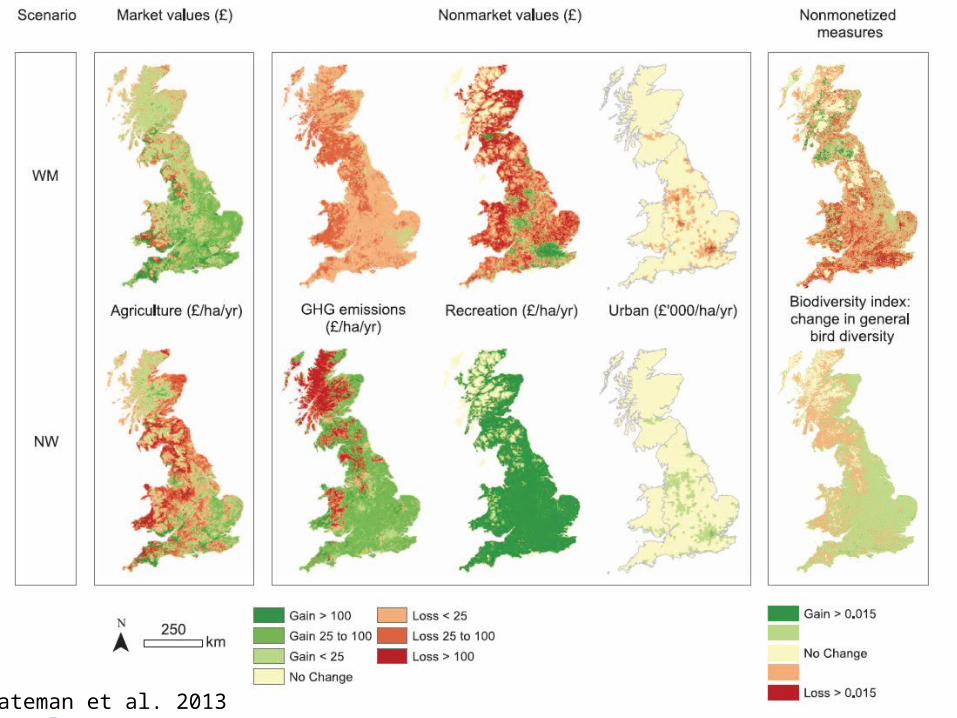
Bateman et al. 2013
Biodiversity indicators
“No net loss of biodiversity”
Endpoints:• Species number / preferential species• Red list species / sensitive species• Indicator species
• E.g. “relative environmental sustainability” or “positive indicator species” concepts
Conclusions
“No net loss of biodiversity”
Endpoints:• Species number• Red list species• Indicator species
• E.g. “relative environmental sustainability” or “positive indicator species” concepts