Embed Size (px)
Citation preview

Challenges in Ocean Science
Jake Rice

Approach and Intent of Talk
• What the talk is NOT – an overview of all areas of ocean science activity– a shopping list of what scientists are asking for most
stridently• What it tries to present
– What challenges are “special” for ocean science– Given ALL areas of science (ocean or terrestrial) confront
challenges, how does ocean science try to meet those challenges (in a couple of areas)
– How ocean Science can address challenges in ways relevant for ocean Policy

What makes Ocean Science difficult
• We can understand terrestrial dynamics because we live on land– Anthropomorphism must be kept under control,
but we can’t avoid understanding by analogy– On Land we see and experience “how it works”
• Science can help quantify and enrich our understanding of what is happening around us
• But even in science we often explain by analogy as well as inference
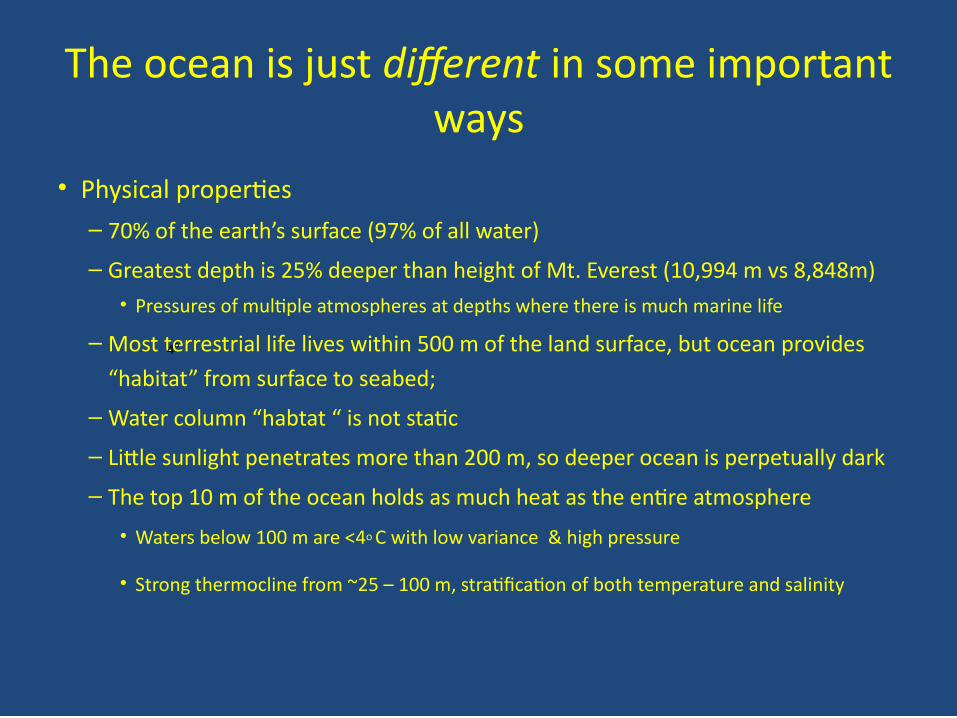
The ocean is just different in some important ways
• Physical properties– 70% of the earth’s surface (97% of all water)
– Greatest depth is 25% deeper than height of Mt. Everest (10,994 m vs 8,848m)• Pressures of multiple atmospheres at depths where there is much marine life
– Most terrestrial life lives within 500 m of the land surface, but ocean provides “habitat” from surface to seabed;
– Water column “habtat “ is not static
– Little sunlight penetrates more than 200 m, so deeper ocean is perpetually dark
– The top 10 m of the ocean holds as much heat as the entire atmosphere
• Waters below 100 m are <4o C with low variance & high pressure
• Strong thermocline from ~25 – 100 m, stratification of both temperature and salinity
4o

The ocean is just different in some important ways
• Biological / Ecological properties– ~ 36 phyla of Animals but ~19 ONLY marine
• Many small and rare – but just VERY different• < 10% of animal species in the sea have been described
– Some key groups are radially symmetrical• So nervous system & brains have different history
– Predation of even top predators is more size-based than species-based
Our understanding of the ocean needs to pay more attention to evidence and less to “perception” than our understanding of land and its bio-physical systemsLooking at land as a socio-ecological system (sensu Ostrom) more intuitive than looking at the sea that way

Where has this been understood and applied well
• IPCC and treatment of the ocean in climate change physics and chemistry
• AR 1 (414 pages) – Treatment of the ocean– Chapter on coupled Ocean–climate models – 22 pages – Processes and Modelling – 1.5 pages of 90– Model Validation – 2 pages of 30– Equilibrium Scenario Conditions – 4 pages of 41– Impacts on Ecosystems – 4 pages of 24
• AR 5 – WG I (chapters on oceans)– Observations on the Oceans – 62 pages – Sea Level changes – 80 pages– 20-35% of several other chapters
• Special Report on Ocean and Cryosphere – due early 2019

Ocean convey belt and movement of heat
• Why is it slowing down (cycle is 500 years)• What are the implications for climate

Ocean acidificationNot mentioned in IPCC Assessment Report 1 (1990
Stand alone bullet in the SPM• Ocean acidification is
quantified by decreases in pH13. The pH of ocean surface water has decreased by 0.1 since the beginning of the industrial era (high confidence), corresponding to a 26% increase in hydrogen ion concentration
Only by Assessment report 5 (2013) is it treatedAnd a separate SPM Figure IPCC AR 5 WG I SPM fig 4b

Ocean Acidification AR 5 – WG 1
• Important enough to be in all scenarios (WG 1)– Earth System Models project a global increase in
ocean acidification for all RCP scenarios. The corresponding decrease in surface ocean pH by the end of 21st century is in the range of 0.06 to 0.07 for RCP2.6, 0.14 to 0.15 for RCP4.5, 0.20 to 0.21 for RCP6.0, and 0.30 to 0.32 for RCP8.5
• Plus full sections in Chapters 3 (Observations ) and 6 (Scenarios & Projections), plus figures and FAQs in each section

Ocean Acidification – AR 5 WG II (adaptation)
• Developing countries and small islands within the tropics …will be impacted directly … ocean acidification … (high confidence).
• Coastal acidification is projected to continue but with large and uncertain regional and local variations (high confidence).
• Also high confidence of detrimental impacts on coral reefs and shellfish, “… a number of other impacts, many of which are still poorly understood.”
• Impacts of ocean acidification range from changes in organismal physiology and behavior to population dynamics (medium to high confidence) and will affect marine ecosystems for centuries if emissions continue (high confidence).
• Occurs several times as stressor of human adaptation in ocean and coastal areas, particularly with regard to food provisioning and changes in distribution of speces of commercial and recreational uses.

This illustrates several ocean science challenges
• New things of concern keep cropping up• Confidence s high that change is occurring
– Time series are short - for ocean acidity in coastal waters, few before 2005
– Hence rate and trajectory both poorly known– Links from physics to biology to society are necessary
• Attribution of causality weakens with every step from initial physical property to human well-being (which is a strong policy motivator)

Physical Property
System dynamics
Biological impactEcosystem
Impacts
Human Uses
Human Well - Being
ATTRIBUTION STRENGTH

Meeting challenges through Strengthening the Information Base about the Ocean

GOOS
• Global Ocean Observing System• Started by visionaries in the 1980s • Coordinated by IOC-UNESCO - over 100
member countries)• The data streams essential for almost all
climate change modelling, plotting trajectories of pollution spills etc.


What the ARGO / GOOS system records (EOVs)
OCEAN BIOLOGY• Abundance and distribution : Fish, Benthic invertebrates; Marine turtles,
birds, mammals; Zooplankton; Phytoplankton and Particulate matter• Cover and composition: Hard coral; Macroalgal and seagrass ; Mangrove ; • Microbe biomass and diversity (*emerging) OCEAN CHEMISTRY• Oxygen & Nitrous oxide • Nutrients & Ocean colour (Spec Sheet under development) • Inorganic carbon; Stable carbon isotopes & dissolved organic carbonOCEAN PHYSICS• Sea state; Sea surface height, salinity & temperature; surface currents• Ocean surface stress & Ocean surface heat flux; Sea ice• Subsurface currents , salinity & temperature; Tracers
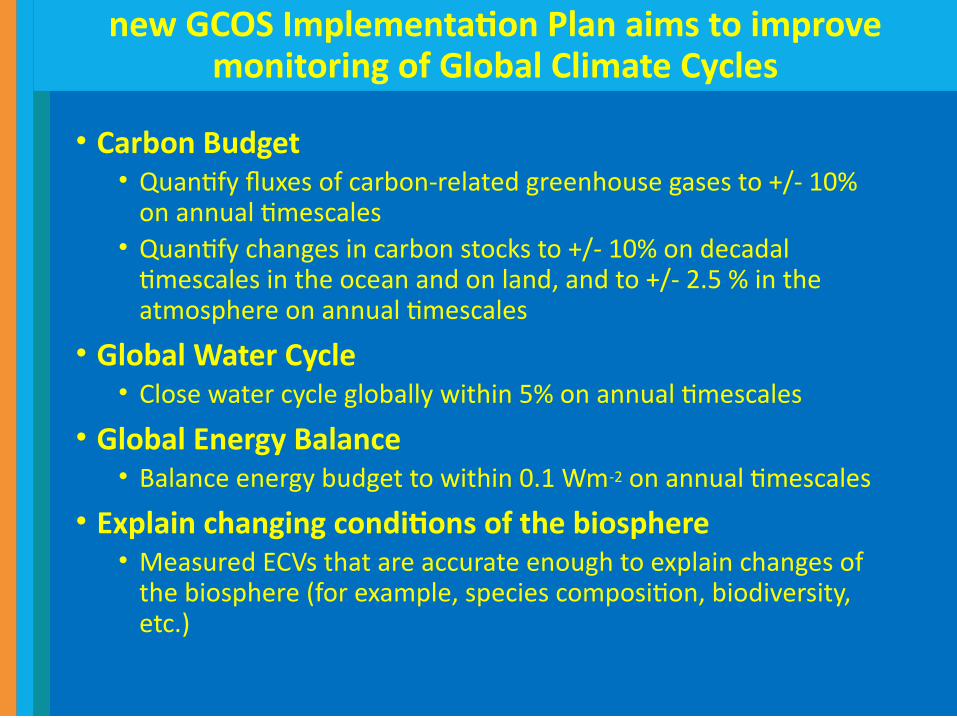
new GCOS Implementation Plan aims to improve monitoring of Global Climate Cycles
• Carbon Budget• Quantify fluxes of carbon-related greenhouse gases to +/- 10%
on annual timescales• Quantify changes in carbon stocks to +/- 10% on decadal
timescales in the ocean and on land, and to +/- 2.5 % in the atmosphere on annual timescales
• Global Water Cycle• Close water cycle globally within 5% on annual timescales
• Global Energy Balance• Balance energy budget to within 0.1 Wm-2 on annual timescales
• Explain changing conditions of the biosphere• Measured ECVs that are accurate enough to explain changes of
the biosphere (for example, species composition, biodiversity, etc.)

Phenomena to capture
Marine Monitoring
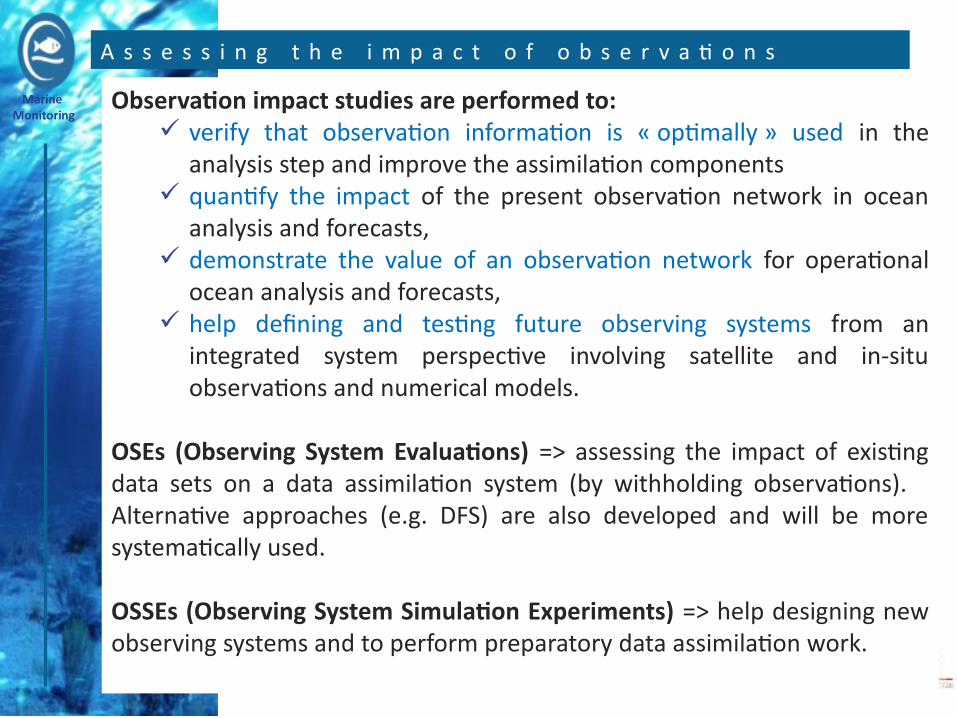
A s s e s s i n g t h e i m p a c t o f o b s e r v a ti o n s
Observation impact studies are performed to: verify that observation information is « optimally » used in the
analysis step and improve the assimilation components quantify the impact of the present observation network in ocean
analysis and forecasts, demonstrate the value of an observation network for operational
ocean analysis and forecasts, help defining and testing future observing systems from an
integrated system perspective involving satellite and in-situ observations and numerical models.
OSEs (Observing System Evaluations) => assessing the impact of existing data sets on a data assimilation system (by withholding observations). Alternative approaches (e.g. DFS) are also developed and will be more systematically used.
OSSEs (Observing System Simulation Experiments) => help designing new observing systems and to perform preparatory data assimilation work.

Marine Monitoring
I m p a c t o f t h e a l ti m e t e r c o n s t e l l a ti o n ( O S E )
Studies performed to assess the impact of the number of altimeter on the quality of ocean analyses and forecasts.
Forecast error is divided by 2 when moving from 1 to 4 altimeters.
Hamon et al., 2017
7-day sea level forecast errors : PSY3OSE1 - PSY3OSE4
Variance of 7-day sea level forecast error
Marine Monitoring
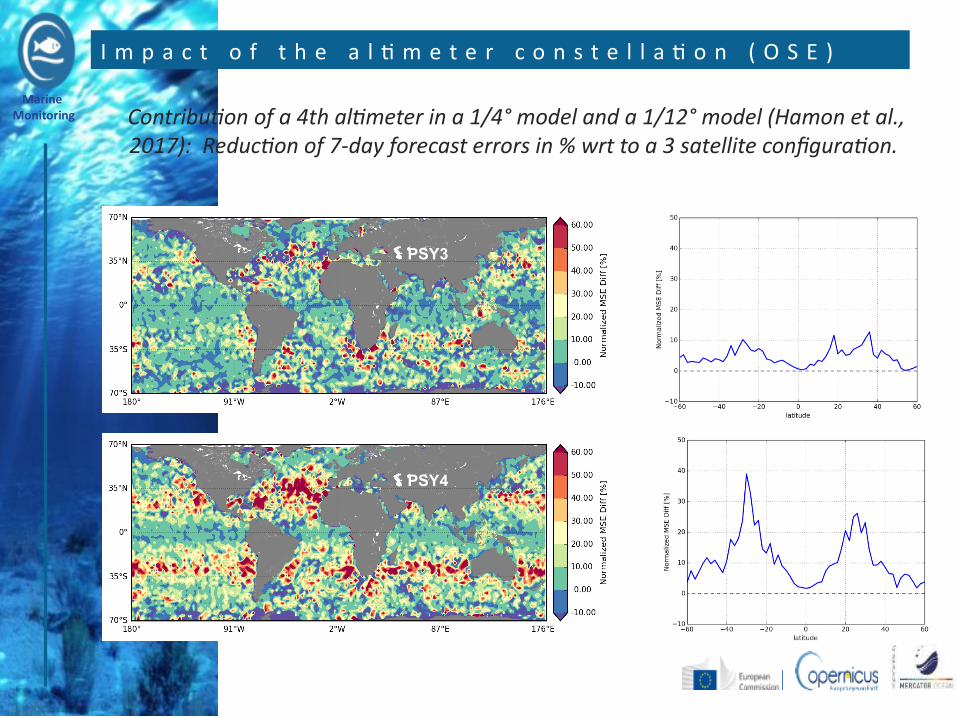
I m p a c t o f t h e a l ti m e t e r c o n s t e l l a ti o n ( O S E )
PSY3
PSY4
Contribution of a 4th altimeter in a 1/4° model and a 1/12° model (Hamon et al., 2017): Reduction of 7-day forecast errors in % wrt to a 3 satellite configuration.
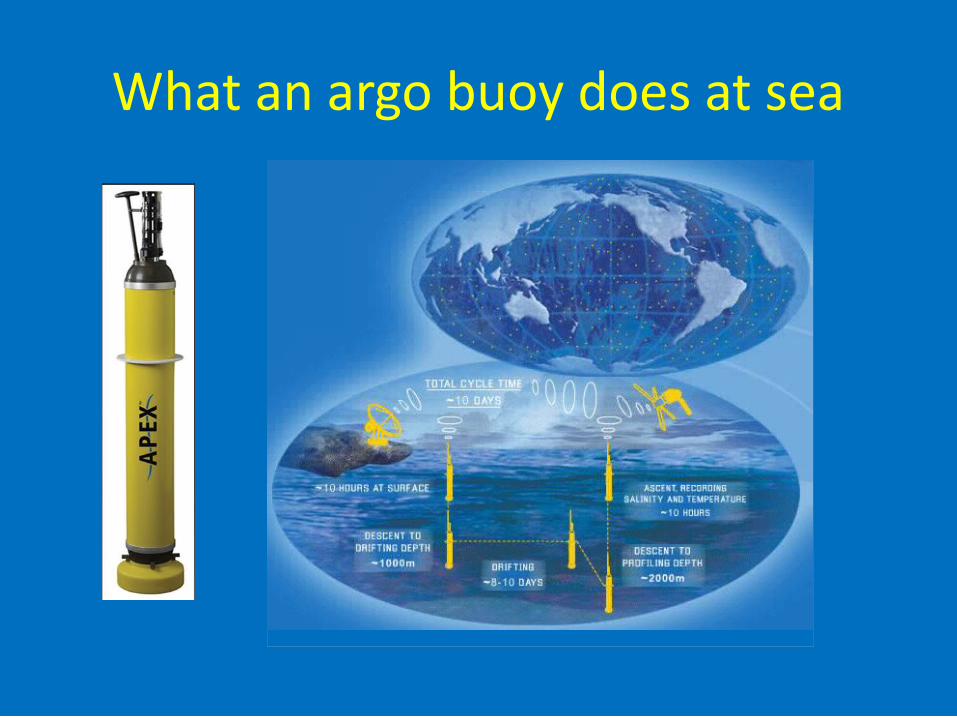
What an argo buoy does at sea

How extensive is the coverage?
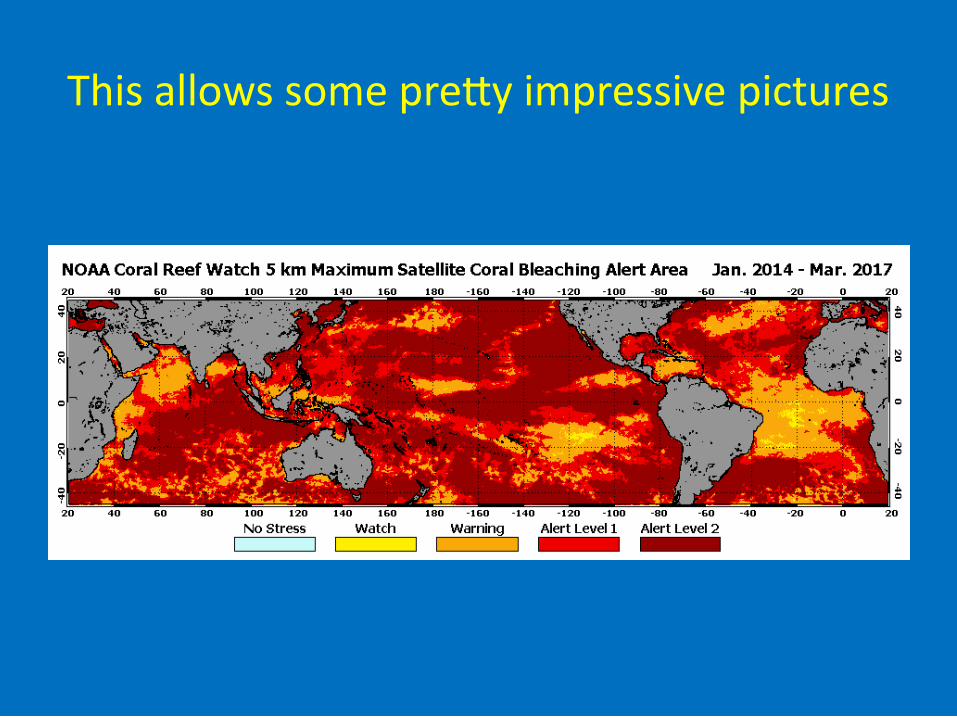
This allows some pretty impressive pictures

But this comes at a cost ….• Each buoy acquisition costs ~ $15,000 (USD)• Cost for data processing and buoy servicing $15,000 yr• Cost for hardware and personel 24 Mil per yr• Each buoy lasts about 4 years under normal circumstance• It took 3,000 buoys to get sufficient coverage to allow measurements• BUT MOST ARGO DATA AR AVAILABLE FOR FREE• Seabed mapping requires other instruments
• 100 % mapped to 5 km resolution• Only 5% mapped to resolution of hundreds of meters• ROVs cost $10,00s to millions depending on what sensors and
depth you want

GOOS is far from alone in trying to improve information about the ocean
• OBIS and GOBI for biodiversity information• FIGIS and FIRMS by FAO for fisheries and related
data• Birdlife International for seabirds and sevveral
competng marine mammal databases• General bathymetric chart of the Ocean• WCMC for protected areas, CDB EBSAs etc• Some university ones like Ran Legacy database,
FishBase etc

Addressing the Challenges through Strengthening the Understanding of Biological and Ecosystem Impacts and Changes

Fisheries and Stock Dynamics
• In contrast to ocean acidification, we’ve been assessing and managing stocks for decades.– Track record was weak to poor 1950s to 1990s. Since
2000s improved in many capacity-rich areas– Data streams more numerous and more complex– Analytical algorithms also more sophisticated
• Now now being made more complex still– Oceanographic and Climate Drivers– Integrating social sciences, includng Management
Strategy Evaluations

The infamous “stock recruit relationship” (from 1930s)
How far down the biomass axis is optimal?Central question given LOSC specifies Bmsy as minimum standard
What is causing all the scatter in the data?
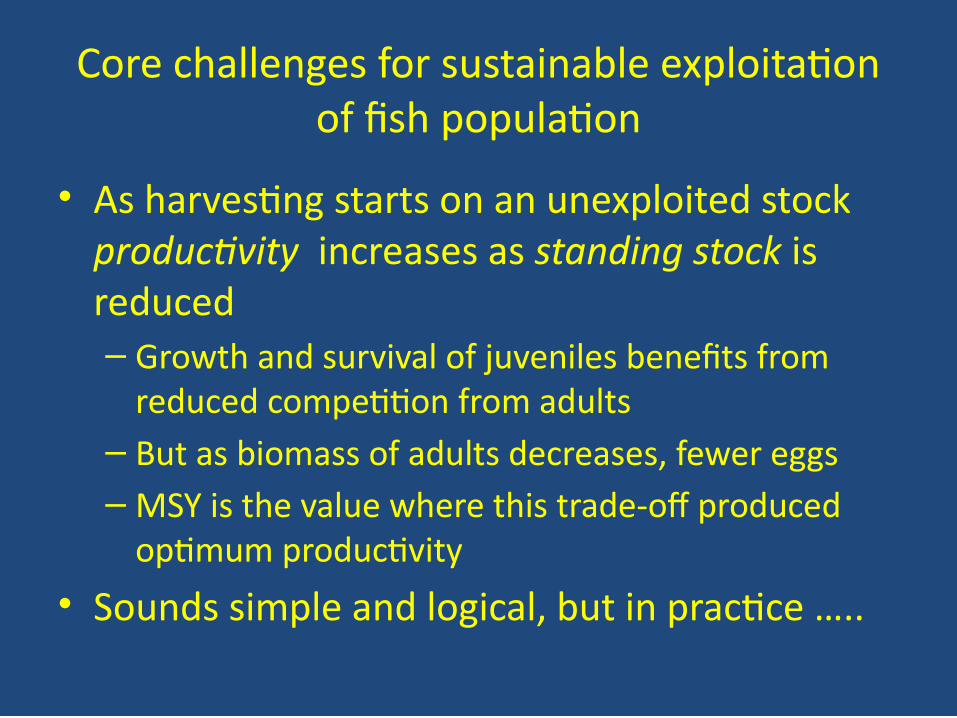
Core challenges for sustainable exploitation of fish population
• As harvesting starts on an unexploited stock productivity increases as standing stock is reduced – Growth and survival of juveniles benefits from
reduced competition from adults– But as biomass of adults decreases, fewer eggs– MSY is the value where this trade-off produced
optimum productivity• Sounds simple and logical, but in practice …..
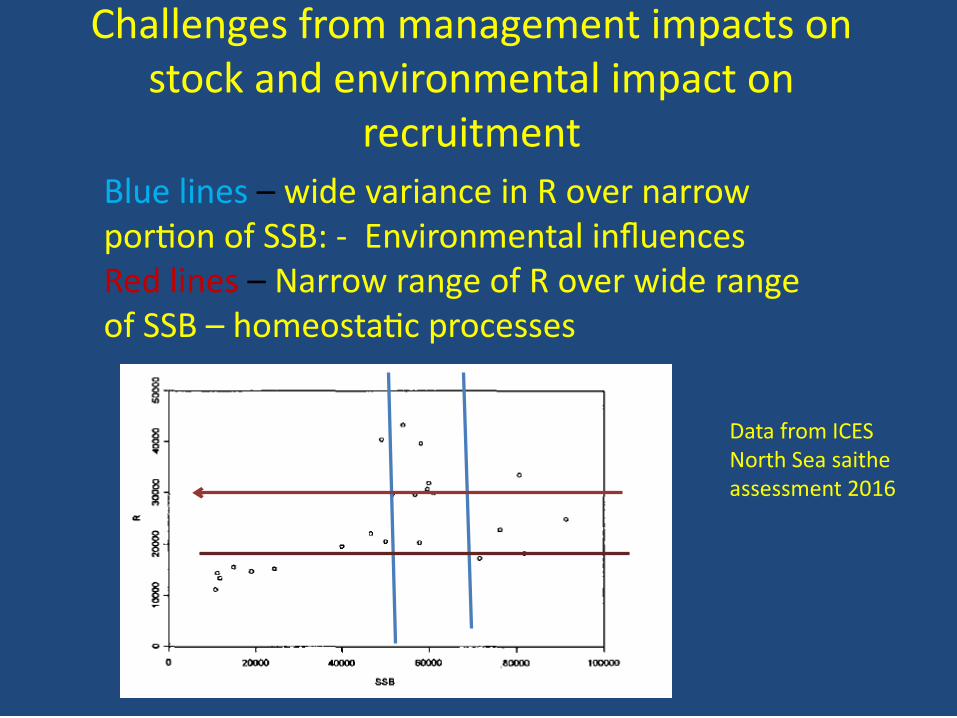
Challenges from management impacts on stock and environmental impact on
recruitmentBlue lines – wide variance in R over narrow portion of SSB: - Environmental influencesRed lines – Narrow range of R over wide range of SSB – homeostatic processes
Data from ICES North Sea saithe assessment 2016

SO why not just “be precautionary”
• Meets the criteria for application of precaution– Moderate to high uncertainty in
• estimation (accuracy of assessments) • Incomplete knowledge of dynamic processes • Processes have high inherent variance
– Depletion of adult biomass will have serious consequences, sooner ot later
• “Being precautionary” not straightforward– Anecdote of PA working group
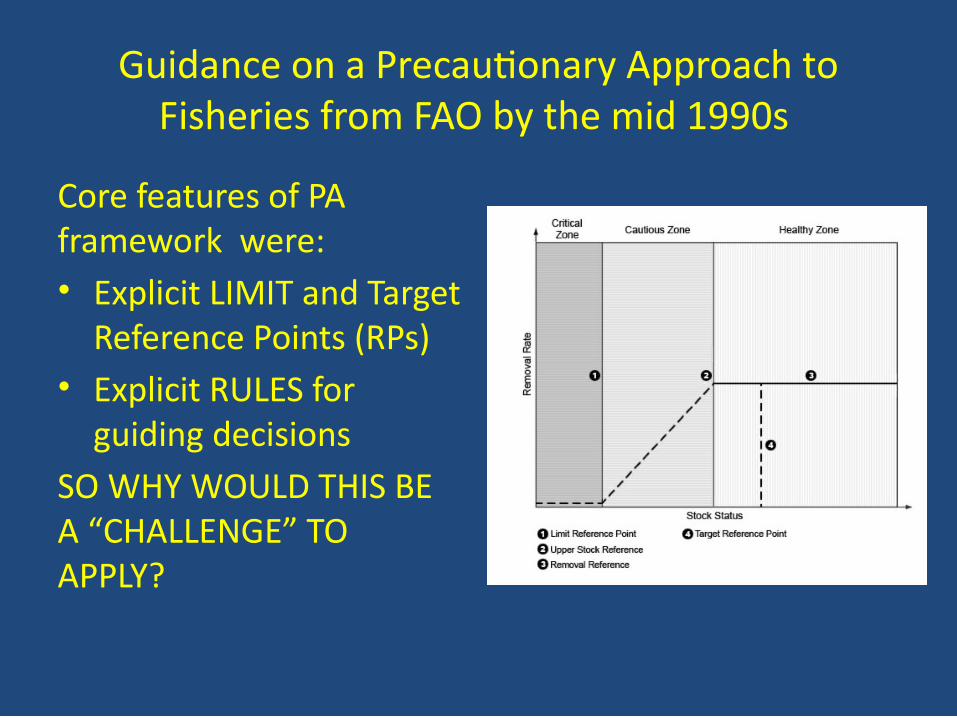
Guidance on a Precautionary Approach to Fisheries from FAO by the mid 1990s
Core features of PA framework were:• Explicit LIMIT and Target
Reference Points (RPs)• Explicit RULES for
guiding decisions SO WHY WOULD THIS BE A “CHALLENGE” TO APPLY?
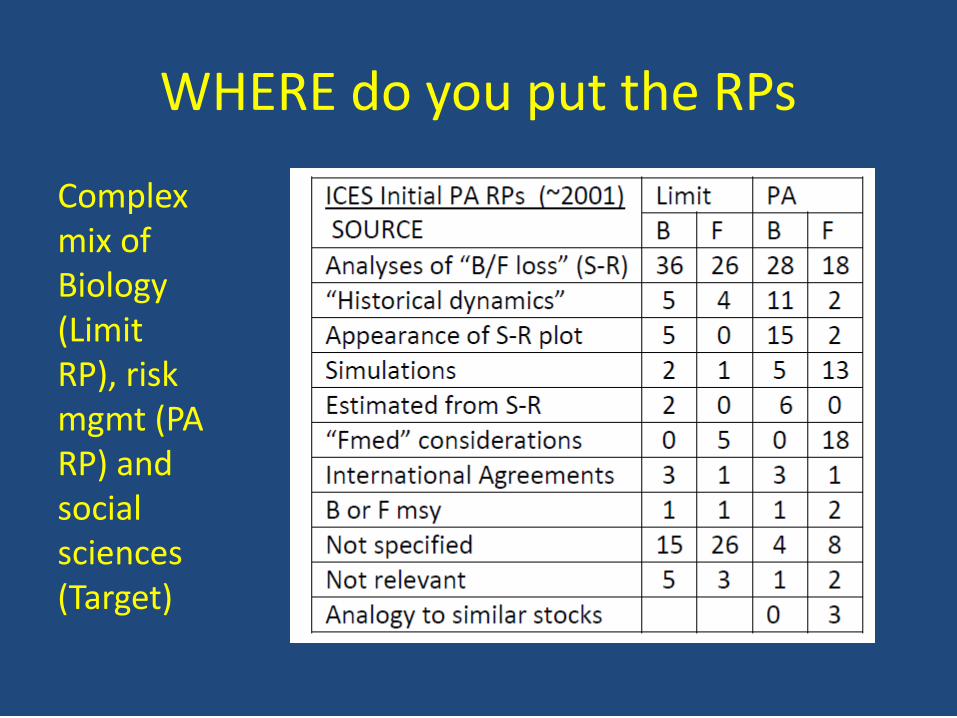
WHERE do you put the RPs
Complex mix of Biology (Limit RP), risk mgmt (PA RP) and social sciences (Target)
So what is the message and the challenge here
• The implementation of the science precautionary framework is inconsistent and perhaps arbitrary
• We need to be more explicit about how we ar putting the biological variation, the risk management choices and the social science dimensions into our practices
1995 2000 2005
0.5
1.0
1.5
2.0
2.5
Year
Ave
rage
Z
4-82-3
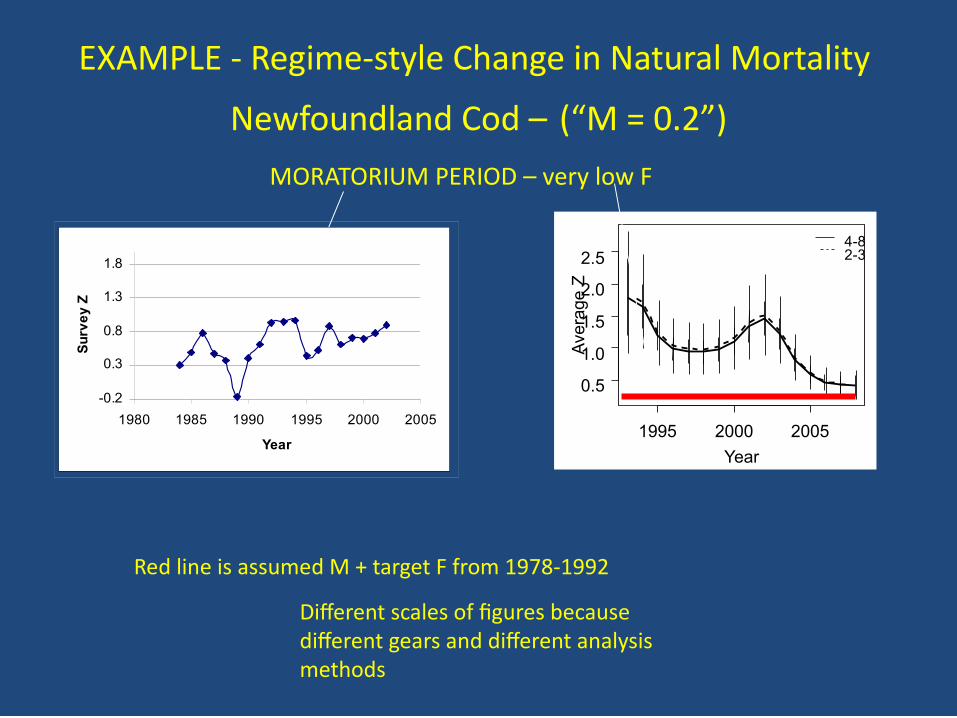
EXAMPLE - Regime-style Change in Natural Mortality
Newfoundland Cod – (“M = 0.2”)
Different scales of figures because different gears and different analysis methods
MORATORIUM PERIOD – very low F
Red line is assumed M + target F from 1978-1992
-0.2
0.3
0.8
1.3
1.8
1980 1985 1990 1995 2000 2005
Year
Su
rve
y Z

So a parameter becomes a pdf.

This is greater complexity, but also opportunity to generalize the risk management framework
Why do we want to generalize the approach• It is not just fish stocks and fishing mortality that
need to be conserved and regulated• Ecosystem Approach, Aichi Targets and SDGs
have established responsibility for protection of ecosystem structure and function generally and for management of all human-induced pressures
• The concept of Precaution is intended to be generally applicable

Assumptions underlying 3 stage model in fisheries
1. A state of the stock exists that is considered healthy, or within safe biological limits
2. When the index of stock status is in the “healthy” or “safe” zone, an exploitation rate exists that is sustainable in the long term.
3. A biologically based LIMIT exists, below which the stock is at unacceptable risk of “serious or irreversible harm”.
4. When the index of stock status is at or below the limit, exploitation is to be as close to zero as is possible to achieve
5. There is uncertainty about the position of the limit, the annual estimates of stock status, and inertia and uncertainty about the ability of management to reduce exploitation as the limit is approached. (PRECAUTIONARY Reference Points)
6. When the index of stock status falls below the precautionary reference point, exploitation is to be reduced.

Generalizing these Assumptions
Spawning biomass is a STRUCTURAL property of a fish population
Recruitment is a FUNCTIONAL property,So framework based on weak dependency of some
function on some structural property, SO: 1 & 3 – Do healthy and damaged states exist?
Preconditions to use the property in management; 2 & 4 – Do Sustainable rate and near-zero rate of impacts exist?
(Precondition to use the property in mgmt)5 Uncertainty & inertia are likely to exist 6 ON/Off management often unpopular and unwise

Tasks to undertake for generalization of framework
• Task 1 – Select indices for the X-axis. – Some structural property of an ecosystem that is
measurable and responsive to management• Task 2 – Select indices for the Y-axis
– Some function important to the system being managed that is linked to the structural feature (x)
• Task 3 – Determining the sustainable rate of impact – Look for non-linearity in S-F relationship– Take the point of maximum curvature

Tasks to undertake for generalization of framework
• Task 4 – Position of Limit Reference Points on Biodiversity Axes – Limits are legal and conceptual anchor for framework– In Fisheries advice - from stock-recruit relationship
A - convex
B - flat
C – Linearly proportional
Spawning stock biomass
Recr
uitm
ent

And this may even work even for pressure – response linkages (DPSIR)
Conceptual approach Real field data
Illustrative of how challenges are being faced; NOT established practice
What about the blending of social science with the framework
• A whole afternoon on its own• Some excellent lecturers coming on this topic• From the established natural science PA framework it
comes in two key ways1. Establishing the Targets (later in course)2. Bringing the fisheries directly into the analyses –
Management Strategy Evaluations– Simulate both the performance of the stock AND of the
fisheries – scenario based– POWERFUL but very demanding of experts

Management Strategy Evaluation – Management Strategies to Test

Management Strategy EvaluationsObjectives to Achieve

Where does this take usPositives
Everything is transparent and empiricalCan consider dynamics of stocks, ecosystems, individual fishers, fishing fleets and communities, as user needs requireResults are probabilistic and risk basedCan weight influence of inputs by factors like reliability, preferences, legal constraints
Costs to get the positivesIf all evidence based, need huge amounts of informationIf based on alternative hypotheses. boundaries between “evidence” and “preconceptions” become foggy quicklyDisplaying and communicating results becomes very demanding
Can “show it all” and users inundated with figures and plotsCan select subset of “most important” results, but then who picks “most”

Illustrations from a “Best Practices” paper
From Punt et al. Fish and Fisheries, 2016, 17, 303–334

What has crept in here -
• The combination of bio-ecological science with the social and economic sciences
• Not a challenging field of science but a challenge to science• Ocean sustainability might be promising area for progress
on true SES approaches (sensu Ostrom) – More foundational knowledge from observation than from theory,
so more flexibility to broaden scope of questions and of answers– Multi-dimensionality of decisions fully acknowledged– Globalization of economies and climate change both making
historical status quo untenable – change accepted as inevitable• Listen to the rest of the course and decide for yourselves

Strengthening the Ability of Evidence to contribute to Policy

What influences impact of science on policy?
• Area of study in its own right– NOT core to most science curricula
• Many scientists frustrated with lack of impact of research findings on policy decisions
• Many policy makers frustrated with inability to get the information they feel they need.
Balloon anecdote

The Assessment of Assessments
• The start-up phase towards a Regular Process for global reporting and assessment of the state of the marine environment – WSSD …keep the oceans under permanent review.– UN General Assembly Resolution in 2005
• ~ 25 Experts, 4 volumes + Annexes (2011)• Considered all the major assessment initiatives of the
day• Results are basis for Regular Process and WOA
– Alan Simcock’s upcoming lectures…

Key Findings
• Lots on the assessment coverage thematically, regionally, by discipline, by type of institution
• Highlights assessment is a process as well as a product– Important for policy-makers to recognize both
• Assessments with sound process essential – “Everyone is entitled to his own opinion, but not to his own
facts” D.P. Moynihan• Three properties are central to effectiveness of
assessments –Credibility, Legitimacy, Relevance

The three foundations of a sound science – policy interface
• Credibility – Does the full spectrum of experts in a field concur with the core of the science advice (even if they quarrel about the edges)– The IPCC experience with “consensus” and certainty terms
• Legitimacy – Do the people whose lives may be affected by a policy decision consider the processes producing the advice were rigorous, fair and appropriately inclusive.– The IPBES experience with “values and worldviews”
• Relevance - Did the science advice actually inform the policy dialogue– Answer the question asked or that should have been asked

Best Practices for:• Setting Objectives and Scope of assessment• Maintaining the Science/Policy Relationship• Modalities for Stakeholder Participation• Criteria and processes for Nomination and Selection of Experts• Sourcing, quality assurance, availability, and accessibility of data and
information• Treatment of Lack of Consensus among Experts and of Uncertainties• Effective Communication with diverse audiences• Capacity Building and Networking of “communities”• Post-Assessment Evaluation of advice and actions• Institutional Arrangements

So where have we been?
• What are the special challenges of science in the ocean?
• How do those challenges result in new problems continuing to emerge (Ocean acidification)
• How address the special challenges – Strengthening the information bases (oceanography)– Strengthening understanding of processes and linkages
(sustainable fisheries)– Integrating disciplines and knowledge systems– Making the science advice reliable and powerful