Embed Size (px)
Citation preview
M A R C H 2 6 , 2 0 1 5 | N A T I O N A L P R E S S C L U B , W A S H I N G T O N , D C
Gordon van Welie P R E S I D E N T & C E O
Gas-Electric Interdependency: The Realities of Keeping the Lights On
Challenges Facing the New England Power System

ISO New England is Implementing Solutions to the Region’s Top Reliability Risks
Reliability requires a flexible, high-performance fleet:
• Natural Gas Dependency
– “Just-in-time” fuel delivery presents an immediate risk to reliability
• Power Plant Retirements
– New England will need new ways to meet peak demand as aging plants close
• Renewable Resource Integration
– Balancing variable generation with reliability will require changes in system operations
2

Wholesale Markets Have Resulted in Efficiency Gains in New England’s Power Generation Fleet
• Markets reveal a resource’s true operating cost – Fuel is the primary driver of operating costs – The value of New England’s energy markets has fallen from 2008 as
low-cost natural gas displaced older, fossil-fired generators
• Gas-fired generators are becoming more efficient – Improvements in technology have made some newer generators more
economic than older resources
• Region has invested in cleaner technologies ahead of much of the rest of the country
3

Region Has Seen Tremendous Growth In Gas-fired Generation
0
2,000
4,000
6,000
8,000
10,000
12,000
14,000
1997 1999 2001 2003 2005 2007 2009 2011 2013
Natural Gas
Oil
Biomass
Fuel Cell
Hydro
Solar
Wind
Nuclear uprate
Cumulative New Generating Capacity in New England
4

Total Value of Markets Varies with Fuel Costs Annual wholesale market costs have ranged from $6 billion to $14 billion
12.1
5.9
7.3 6.7
5.2
8.0 9.1
1.5
1.8 1.6
1.3
1.2
1.1 1.1
$0
$2
$4
$6
$8
$10
$12
$14
$16
2008 2009 2010 2011 2012 2013 2014
Energy Market
Ancillary Markets
Capacity Market
Annual Value of Wholesale Electricity Markets (in billions)
5
Source: 2013 Report of the Consumer Liaison Group, Appendix C; 2014 data is preliminary and subject to reconciliation

NEW ENGLAND'S GENERATION FLEET IS UNDERGOING A DRAMATIC TRANSFORMATION Oil- and coal-fired resources are retiring, natural gas has become the predominant fuel source

Dramatic Changes in the Energy Mix The fuels used to produce New England’s electric energy have shifted as a result of economic and environmental factors
31%
22% 18%
15% 13%
1.7%
34%
1% 5%
44%
15%
1%
Nuclear Oil Coal Natural Gas Hydro and Other
Renewables
Pumped Storage
2000 2014
Percent of Total Electric Energy Production by Fuel Type (2000 vs. 2014)
7
Source: ISO New England Net Energy and Peak Load by Source Other renewables include landfill gas, biomass, other biomass gas, wind, solar, municipal solid waste, and miscellaneous fuels

MA 480 MW
ME 3,080 MW
NH 65
MW
VT 30
MW
All Proposed Generation
8
Developers propose >5 GW of gas-fired generation and approximately 4 GW wind; wind is mostly onshore in northern New England and offshore in southern New England
Wind Proposals
Proposed Generation Is Primarily Gas and Wind
Source: ISO Generator Interconnection Queue (January 2015) FERC Jurisdictional Proposals Only
ME 3,330 MW
NH 63
MW
VT 127 MW
MA 467 MW
Natural gas 57% Wind
42%
Other 1%

Generation At Risk
Source: Generator Retirement Study, ISO New England, 2012.
Yarmouth
Newington
Schiller
Merrimack
Mt. Tom
Brayton Pt.
Canal
MysticSalem Harbor
BridgeportNorwalk
New Haven
MiddletownMontville
Generation At Risk
Source: Generator Retirement Study, ISO New England, 2012.
Region Is Losing Non-Gas Resources
• Salem Harbor Station (749 MW) – 4 units (coal & oil)
• Vermont Yankee Station (604 MW) – 1 unit (nuclear)
• Norwalk Harbor Station (342 MW) – 3 units (oil)
• Brayton Point Station (1,535 MW) – 4 units (coal & oil)
• Mount Tom Station (143 MW) – 1 unit (coal)
• Additional retirements are looming
Major Retirements Underway:
W. Springfield
9
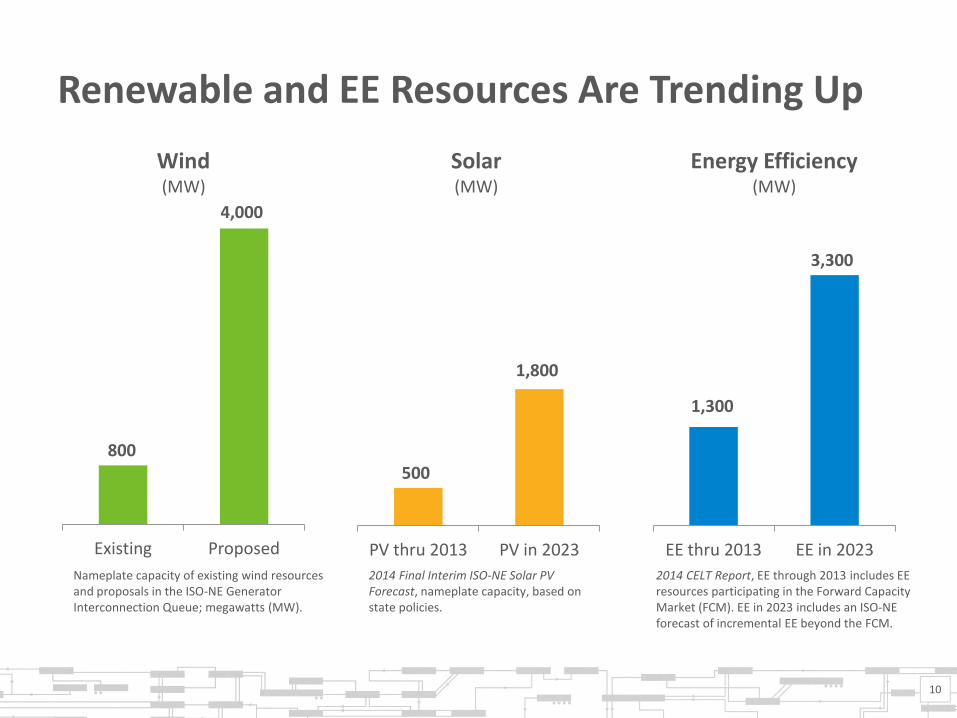
Renewable and EE Resources Are Trending Up
800
4,000
Existing Proposed
Wind (MW)
Nameplate capacity of existing wind resources and proposals in the ISO-NE Generator Interconnection Queue; megawatts (MW).
1,300
3,300
EE thru 2013 EE in 2023
Energy Efficiency (MW)
2014 CELT Report, EE through 2013 includes EE resources participating in the Forward Capacity Market (FCM). EE in 2023 includes an ISO-NE forecast of incremental EE beyond the FCM.
500
1,800
PV thru 2013 PV in 2023
Solar (MW)
2014 Final Interim ISO-NE Solar PV Forecast, nameplate capacity, based on state policies.
10
11
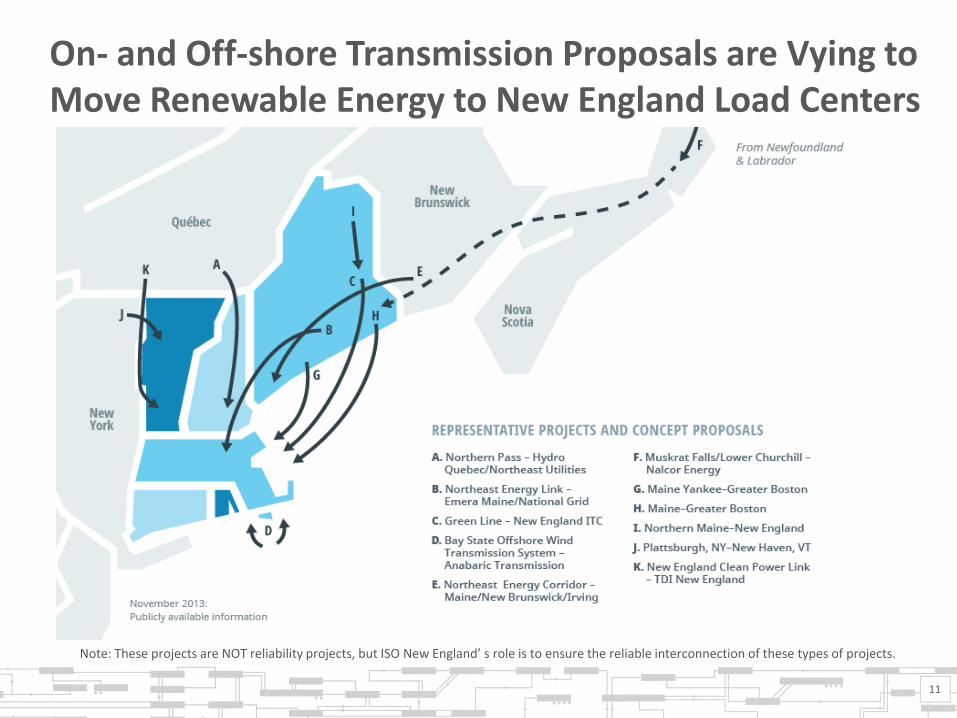
On- and Off-shore Transmission Proposals are Vying to Move Renewable Energy to New England Load Centers
Note: These projects are NOT reliability projects, but ISO New England’ s role is to ensure the reliable interconnection of these types of projects.

WHAT ARE THE REGION’S INFRASTRUCTURE CHALLENGES AND HOW DOES IT SOLVE THEM?

New England is Working to Optimize Use of Existing Resources and Incentivize Additional Infrastructure
• New England has taken steps to increase efficiencies with existing infrastructure, and to drive investment in additional infrastructure – ISO-NE has proposed and implemented short and long-term market changes
to ensure resource adequacy, resource performance and proper price formation
– FERC has approved a pair of ISO-NE-designed short-term winter programs to increase fuel assurance during periods of significant pipeline constraints (mainly relying on oil), until long-term changes become effective
– Increased communications and operational interfaces with natural gas pipelines. This has led to a better understanding of the gas industry and helped develop decision-support tools for our system operators
• Region will still need additional infrastructure to meet growing demand for natural gas and renewable energy
13

Natural Gas Infrastructure Can’t Meet the Demands for Home Heating and Power Generation
• Cost-of-service, state-regulated, Local Distribution Companies (LDCs) enter into firm, long-term contracts with pipelines to guarantee gas delivery for home heating; merchant generators do not make comparable long-term fuel arrangements because they cannot be assured of cost recovery
• Regional pipelines have become severely constrained as the demands for gas have increased by both sectors – Significant reliability challenges arise in the winter when demand for gas
for home heating peaks – LDCs are entering into forward contracts to meet their needs
• Pipeline constraints expose the region to additional risks – Unexpected interruption in current pipeline infrastructure or unscheduled
outage of non-gas generators during stressed system conditions – Growing exposure to uncertain oil supply chain – Region will be challenged to handle multiple risks simultaneously
14

ISO-NE/ICF International Research Confirms Need for New Pipeline Infrastructure or Significant, Timely Investments in Alternative Sources of Electrical Energy
• Demand for gas for home heating continues to limit gas supply for power generation
• Spot LNG supplies are unpredictable and very sensitive to relative pricing
• Pipeline constraints limit gas supplies and compromise electric reliability, especially in winter season – Outages or unplanned events create
reliability concerns year-round as well
• New England Governors’ studies have yielded similar findings
15

U.S. Department of Energy Is Examining New England’s Energy Infrastructure Challenges
• U.S. Department of Energy (DOE) is studying energy infrastructure challenges as part of its Quadrennial Energy Review (QER)
• ISO-NE worked extensively with DOE throughout 2014 to articulate New England’s challenges – ISO-NE has highlighted the region’s
increasing reliance on natural gas-fired resources and the need for additional energy infrastructure
• DOE’s initial report is expected in March 2015 (focused on transmission, storage, and distribution of energy)
16

Natural Gas and Wholesale Electricity Prices are Linked Because of New England’s heavy reliance on natural gas as a fuel source, natural gas typically sets the price for wholesale electricity
17
Elec
tric
En
ergy
$/M
Wh
Fu
el $/M
MB
tu
$0
$5
$10
$15
$20
$25
$30
$0
$20
$40
$60
$80
$100
$120
$140
$160
$180
Wholesale Electricity at New England Hub (Real-Time LMP) Natural Gas
Monthly Average Natural Gas and Wholesale Electricity Prices in New England

Resource Performance Issues Drove ISO to Propose Changes to the Capacity Market Design
• Capacity payments have been poorly linked to resource performance
• Consequences for non-performance have been negligible
• We have seen pervasive and worsening performance problems with existing generators
• Resource owners have lacked incentive to make investments to ensure they can provide energy and reserves when needed
• Market design has delayed exit of poor performers; created a bias in the FCM to clear less-reliable resources
• Lack of investment poses serious threats to system reliability
18
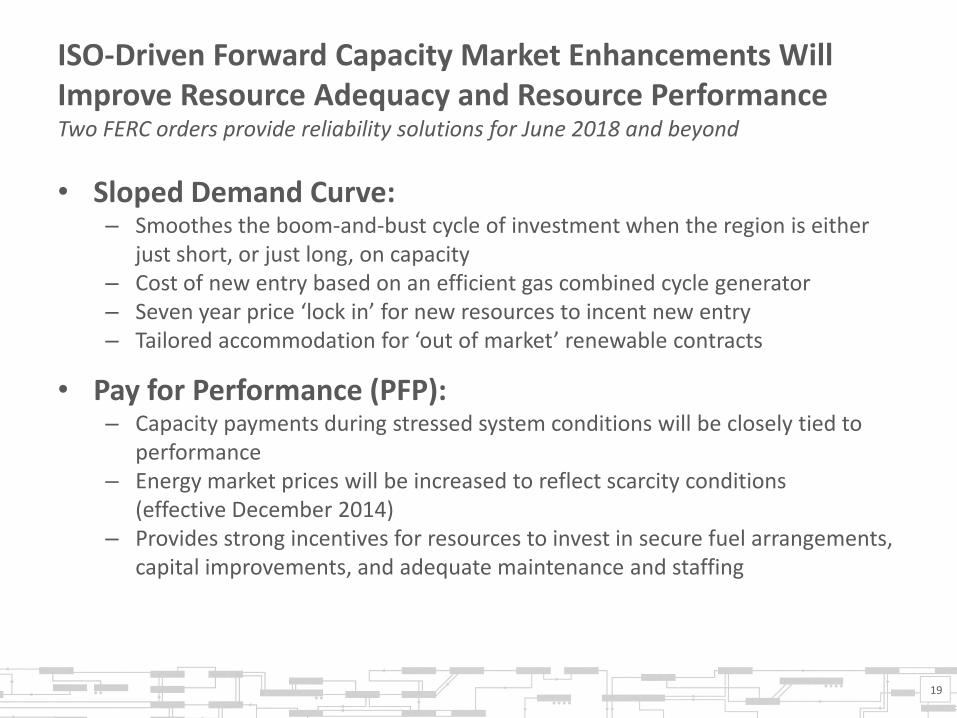
ISO-Driven Forward Capacity Market Enhancements Will Improve Resource Adequacy and Resource Performance Two FERC orders provide reliability solutions for June 2018 and beyond
• Sloped Demand Curve: – Smoothes the boom-and-bust cycle of investment when the region is either
just short, or just long, on capacity – Cost of new entry based on an efficient gas combined cycle generator – Seven year price ‘lock in’ for new resources to incent new entry – Tailored accommodation for ‘out of market’ renewable contracts
• Pay for Performance (PFP): – Capacity payments during stressed system conditions will be closely tied to
performance – Energy market prices will be increased to reflect scarcity conditions
(effective December 2014) – Provides strong incentives for resources to invest in secure fuel arrangements,
capital improvements, and adequate maintenance and staffing
19

Why Was This Winter Less Volatile Than Last Winter?
• High forward prices for winter 2014/15 attracted LNG and oil supplies into the region
• The ISO winter program provided incentives to fill fuel tanks before the winter, so the region was well positioned with regard to fuel inventory
• The coldest winter weather happened in the month of February, when the days were longer and the loads were therefore lower
• Oil prices dropped (and therefore oil generation was frequently economic), dampening gas and electricity price volatility. That said, we still saw many days in February with spot gas prices in the $20 – $30 MMBTU range, which is very high by historical standards
• The ISO is working with FERC and stakeholders to assess interim winter solutions until Pay for Performance becomes effective in June 2018
20

New England’s Conundrum: Who Will Be the Customer For New Gas Pipelines?
• Merchant gas generators typically will not sign long-term contracts for firm gas transportation, since it is more economic for them to buy transportation in the secondary market (when it is available), or switch to oil when the pipelines are constrained
• Pay for Performance will cause them to firm up their ability to produce electricity, but dual fuel is likely to be a cheaper solution than a long- term commitment to pipeline capacity. This addresses the reliability concern, but does not address the concern the New England States have over price volatility or higher emissions
21
New England is Taking Action
• In 2014, the six New England states attempted to find a regional solution to making ratepayer investment in gas pipelines, recovered through the ISO wholesale electricity tariff – It is unclear whether FERC has the authority to address gas infrastructure
investments through a wholesale electric tariff and wholesale market participants are opposed to this construct
• As a result, regional partnerships between natural gas pipeline companies and electric utilities are emerging to develop gas infrastructure – The concept is for the electric distribution utilities to sign the long-term
contracts to build the gas infrastructure, and then sell the firm transportation to gas generators (so called “Electric Reliability Service”)
– This concept will have to be approved state-by-state and recovered in the retail electricity tariff
• In addition, several states have issued an RFP for clean energy resources
22

Conclusions • Competitive wholesale electricity markets have resulted in
significant efficiencies, and has driven billions of dollars of investment in generation and transmission in New England
• New England’s generation fleet is changing rapidly – older, fossil-fired units are retiring and we are dramatically increasing our reliance on natural gas for power generation
• Power system reliability will be threatened until the effects of the gas pipeline constraints are alleviated through additional investments in fuel infrastructure (including gas pipelines, LNG, and oil storage)
• ISO New England has taken major steps to address these challenges through the financial incentives provided in the wholesale market
• Long-term infrastructure investments will have to be made by industry and supported by state and federal policymakers
23

24