Embed Size (px)
Citation preview
July 2013
Electric Vehicle Grid Integration in the U.S., Europe, and China
Challenges and Choices for Electricity and Transportation Policy
Electric Vehicle Grid Integration in the U.S., Europe, and China Page | i
The Regulatory Assistance Project (RAP) and the International Council on Clean Transportation (ICCT)
commissioned this paper, which was prepared by M.J. Bradley & Associates LLC. Conclusions and
recommendations do not necessarily reflect the positions of ICCT and RAP.
The Regulatory Assistance Project (RAP) is a global, non-profit team of experts focused on the long-term
economic and environmental sustainability of the power and natural gas sectors. We provide technical and
policy assistance on regulatory and market policies that promote economic efficiency, environmental protection,
system reliability, and the fair allocation of system benefits among consumers. We work extensively in the US,
China, the European Union, and India. Visit our website at www.raponline.org to learn more about our work.
The International Council on Clean Transportation (ICCT) is an independent nonprofit organization founded to
provide unbiased research and technical analysis to environmental regulators. Our mission is to improve the
environmental performance and energy efficiency of road, marine, and air transportation, in order to benefit
public health and mitigate climate change. We promote best practices and comprehensive solutions to increase
vehicle efficiency, increase the sustainability of alternative fuels, reduce pollution from the in-use fleet, and
curtail emissions of local air pollutants and greenhouse gases (GHG) from freight transportation.
The Regulatory Assistance Project
50 State Street, Suite 3
Montpelier, VT 05602
www.raponline.org
The International Council on Clean Transportation
1225 I Street NW
Suite 900
Washington DC 20005
www.theicct.org
M.J. Bradley & Associates LLC
47 Junction Square Drive
Concord, MA 01742
www.mjbradley.com
Electric Vehicle Grid Integration in the U.S., Europe, and China Page | ii
Contents
Executive Summary ................................................................................................................................................ 1
Regional Observations..................................................................................................................................... 1
Recommendations ........................................................................................................................................... 2
Introduction............................................................................................................................................................. 4
Overview of EVs and Charging Infrastructure ....................................................................................................... 4
Current Models ................................................................................................................................................ 4
Electric Vehicle Supply Equipment (EVSE) ................................................................................................... 5
EVs: Potential Benefits to Society .......................................................................................................................... 5
Emission Reductions ........................................................................................................................................... 5
Energy Security ................................................................................................................................................... 7
Electric Grid Management .................................................................................................................................. 7
Regional Transportation and Electric Sector Market Dynamics .......................................................................... 11
Vehicle Ownership and Usage .......................................................................................................................... 12
Existing Electrical Generation, Transmission, and Distribution Infrastructure ................................................ 18
Regional Electricity Market Regulation ............................................................................................................ 20
United States .................................................................................................................................................. 21
European Union ............................................................................................................................................. 22
China ............................................................................................................................................................. 24
Incentives for EVs: Direct and Indirect Drivers ................................................................................................ 25
How Could EVs Affect the Grid? ......................................................................................................................... 31
Bulk Power Supply: Fuel Mix, Prices, and Load Curves .................................................................................. 32
Local Capacity Areas and Load Pockets ........................................................................................................... 34
EV Charging Strategies: Integration and Adoption .............................................................................................. 35
Controlled Charging of EVs .......................................................................................................................... 36
Charging Infrastructure ................................................................................................................................. 40
Battery Swapping .......................................................................................................................................... 41
Peak Load Impacts from EV Charging.......................................................................................................... 41
Implications for Capacity Planning ............................................................................................................... 42
Market Adoption: EV Charging and Purchase Barriers ................................................................................ 43
Conclusions and Recommendations ..................................................................................................................... 48
Policy Recommendations .............................................................................................................................. 48
Glossary of Terms ................................................................................................................................................. 55
Endnotes ............................................................................................................................................................... 58
Electric Vehicle Grid Integration in the U.S., Europe, and China Page | 1
Executive Summary
Widespread electrification of the transportation sector holds the promise of greater vehicle efficiency and lower
emissions of greenhouse gases (GHGs) and other air pollutants. Many governments around the world have
identified electric vehicles (EVs) as a cornerstone of transportation sector emission control strategies, alongside
other efforts to reduce per-mile emissions from conventional vehicles, by improving technology and creating
new standards for liquid fuels. National EV targets in major economies call for nearly 20 million vehicles in
service by 2020 – a steep increase above the roughly one million EVs in operation in 2013.
From the vehicle buyer’s perspective, none of the EVs currently on the market are capable of perfectly
replacing the service provided by a conventional gasoline- or diesel-powered vehicle. The EVs with the highest
range potential of about 200 miles can still only cover about one half of the distance that a typical conventional
vehicle can cover before recharging or refueling. With less than 100 miles of range, the average EV is even less
capable as a substitute for conventional vehicles. Moreover, EV recharging takes longer than conventional
refueling, and EVs cost far more than comparable conventional vehicles. Affordability and range remain
significant detractors for prospective EV buyers.
On the other hand, electric motors are inherently more efficient than internal combustion engines (ICEs) at
converting potential energy into mechanical energy for the drivetrain. EVs have no tailpipe emissions, can be
refueled at home, and given current fuel and electricity prices it costs most consumers less to drive a mile on
electricity than on gasoline or diesel fuel.
How and when EVs are charged can dramatically affect their “usability” and attractiveness to consumers by
affecting charge time and convenience, as well as electricity costs. Different charging scenarios can also affect
the electric grid in different ways, with over-all effects that are both positive and negative. Negative effects
from significant EV penetration could include increased peak loads, over-stressed local distribution networks,
and increased air emissions from electricity generation. On the other hand, the potential benefits to the grid
from greater EV use include load smoothing and greater utilization of base load capacity during non-peak
periods, lower cost provision of ancillary grid services, and easier integration of variable renewable electricity
sources, in particular wind generated power.
This report examines key drivers of EV adoption in three regions - the United States, the European Union, and
China – with an emphasis on vehicle charging scenarios and infrastructure. The intent of this project is to
identify insights about the choice of charging infrastructure in each region that will both maximize benefits to
consumers (thus helping to drive EV adoption) and maximize benefits to the grid from greater EV use. The
report examines how these optimal scenarios differ by region, and makes recommendations for policies and
electricity regulations that will make realization of grid benefits from EVs more likely.
Regional Observations
With current technology, the costs and operating limitations of EVs inhibit market growth in all but a small
segment of the potential buyer base. Adoption has fallen short of initial goals in all regions covered in this
report, forcing governments to abandon or revise their EV ownership targets.
Key differences exist among electric sector regulatory regimes within the three regions. Furthest along with
electricity market deregulation, the U.S. can serve as a model for how to design market rules to reduce the
cost of integrating EVs on the grid. Because the basic principles of electricity dispatch hold true across the
regions, research conducted in the U.S. on the impacts of EV integration holds lessons for ways to
understand and minimize the impacts in all regions. Another observation gleaned from the U.S. market is
that the diverse fuel mixes of regional generating fleets, and intraday variations in system load, cause
frequent fluctuations in the emissions from electricity used to charge an EV. Across the board, better
alignment of electricity and transportation planning processes will be essential to optimize grid integration
of EVs, not only mitigating the downside risks but also capturing as much value as possible for system
operators.
Electric Vehicle Grid Integration in the U.S., Europe, and China Page | 2
European regulators have taken significant steps in recent years to deregulate the electric sector by
unbundling generation and transmission, and creating trans-national electricity markets. Trends toward
deregulation of the electric sector in all regions will facilitate greater market-based procurement of
decentralized generating capacity and load management resources. This could mean greater opportunities
for EVs to provide valuable services to the electric grid.
Vehicle ownership rates are increasing in densely populated urban areas of China, even as transportation
and environmental officials grapple with unprecedented air pollution. EVs offer the potential to limit mobile
source air emissions by pushing them upstream into the electric grid, where successful control can be
achieved through limits on far fewer sources.
Electric sector environmental regulations in the United States, coupled with low natural gas prices, have
helped reduce emissions from power generation, improving the operating footprint of EVs and increasing
their comparative advantage over gasoline-powered vehicles. Electric sector regulations in the U.S., along
with decarbonization goals being implemented in the EU, will continue to reduce GHG intensity and
conventional air emissions from electricity generation.
Fleet-wide average fuel economy standards in all regions are driving demand for more efficient vehicle
technologies. These standards could help or hurt EVs, depending on the degree to which they stimulate a
market for other advanced vehicle technologies and drive efficiency gains in ICE vehicles. Whether
automakers increase production of EVs to help meet average fuel economy standards will depend on the
commercial prospects of EVs. Policies will play a key role here.
Larger shares of grid-connected intermittent renewable energy resources, such as wind and solar power,
have been driven by electric sector renewable energy policies and the falling costs of generating
technology. The integration of these resources requires greater attention to electric system load
management, which could drive demand for the types of grid services EVs are capable of providing.
The economic and policy landscape is ever-changing, and convergent factors have the potential to drive a
better business case for EV, for vehicle owners as well as state and national governments.
Recommendations
The report makes the case for four broad policy objectives:
1. Limit negative grid impacts, to avoid creating new barriers and costs due to integrating larger
numbers of EVs into the grid.
2. Realize full potential of grid benefits, to help lower ownership costs for drivers, and ensure that
electricity customers benefit from grid-connected EVs as much as is technically possible.
3. Expand economic incentives for drivers, through sound, cost-effective policies that assign value to
the benefits from EV use, and enable drivers to capture those benefits.
4. Avoid creating stranded assets through subsidies, by limiting public investment in high capital cost
electric vehicle supply equipment (EVSE) that is at risk of being underutilized.
Electric Vehicle Grid Integration in the U.S., Europe, and China Page | 3
The following policy recommendations support these objectives:
Primary Policy Recommendations
Create or amend electricity sector rules to foster participation by non-generators in electricity markets. This
includes unbundling of electricity services, creating open and transparent electricity markets, enabling aggregators to participate in ancillary services markets, and reducing regulatory barriers.
Encourage TOU and/or real-time electricity pricing tariffs. To minimize emissions impacts from charging, price signals –
whether through tariffs, or sent directly to customers – should reflect the environmental costs of generation, thereby creating an incentive for charging behavior that minimizes the emissions due to vehicle charging. This is especially important in regions where marginal generation has a high emissions profile.
Allow prudent cost recovery of capital and operating costs by electricity distribution companies to foster EV ownership. For regulated utilities and distribution companies, cost recovery can be used as a tool to encourage investment
and modify incentives so they are better aligned with public policy goals. This can lead to infrastructure and operations that are better suited to supporting EV ownership.
Adopt policies to control GHG emissions. Decarbonization policies place an economic value on GHG reductions,
increasing the size of the potential incentive pool for EV owners. Charging an EV produces varying amounts of GHG emissions, ranging down to zero GHGs from renewable electricity, giving them an inherent advantage over ICE vehicles. Stricter policies to control GHGs can increase the value of environmental benefits from EVs, and increase operating cost savings, but careful policy design is needed to avoid creating new barriers to EV adoption.
Adopt inclusive approach to energy resource planning. It is important to ensure that energy resource planning,
procurement, and investment are compatible with public policies that address system reliability, affordability, air quality, and GHG reduction, and do not provide unfair advantage to incumbent sources of generation.
Promote lower energy use, and rates, through decoupling. Regulated entities that earn profits on energy sales have an
incentive to sell more electricity, which can drive up energy costs for EV owners and reduce the cost savings vs. ICE vehicles. Policies to separate utility earnings from energy sales, and reward energy and cost efficiencies, can reverse this incentive. Many markets within the U.S. and EU have already taken this step.
Establish a long-term strategy to integrate EVs into road user fees. In the short run, preserve the implicit road tax
exemption for EV owners by minimizing road use EV surcharges. Meanwhile, launch an effort to identify the best approach to integrating EV use into tax policy in a way that recognizes the societal benefits of EVs as well as the costs of road use, to level the playing field with ICE vehicles.
Secondary Policy Recommendations
Stimulate prudent research and development activity. The greatest key to EV penetration is vehicle cost reduction and
range extension. Longer-range, cheaper vehicles would meet the daily driving needs of more drivers. Avoid preferential/protectionist funding, which can lead to less efficient use of subsidy funds.
Harmonize EVSE and EV standards; include advanced communication capability. Government entities overseeing
standard-setting for vehicle charging should incorporate communication standards to enable controlled charging and meter electricity flows between the vehicle and the grid. Greater harmonization of charging standards will also simplify the task of writing new market rules that allow EVs to provide grid services. Finally, uniform standards for battery design could improve the economics of battery swap stations, although the complexities of compatible vehicle design will remain a high hurdle.
Consider EV charging incentives “elsewhere” on the bill. Beyond time-of-use (TOU) pricing, specific reductions to
transmission costs, capacity charges, environmental surcharges, and/or electricity taxes could be used to promote off-peak charging and recognize the specific locational benefits of individual off-peak electricity use, compared to on-peak.
Establish customer relationship guidelines, or amend existing ones, to address issues raised by EV ownership.
New data privacy issues may arise when utilities have access to customer driving behavior. In addition, a range of outside service providers, such as car dealers, EVSE contractors and grid services aggregators, will play a central role in establishing new EV customer accounts, by deploying the necessary equipment and contractual arrangements. Taking a proactive approach to working out these issues will minimize the risk that confusion, mistrust, or fraud could lead to slow EV uptake.
Promote alternatives to high capacity public DC charging. As a matter of policy, promoting a dominant charging
strategy of high capacity EVSE conflicts with the objective to limit negative grid impacts and realize the potential grid benefits. Lower capacity, off-peak charging offers lower charging costs to consumers and reduces peak load, and because of the longer charge times, provides greater opportunity for vehicles to provide grid services.
Electric Vehicle Grid Integration in the U.S., Europe, and China Page | 4
Introduction
Policy makers around the world continue to seek ways to reduce gasoline and diesel fuel consumption, and
associated emissions within the transportation sector as a way to mitigate climate change and air pollution, and
reduce national security risks from oil and gasoline imports. According to the United Nations (UN), on-road
vehicles account for 13 percent of global GHG emissions, and contribute significantly to problems from ozone
and particulate matter, which can cause or exacerbate a range of health conditions. Governments have employed
a broad set of tools to improve vehicle fuel efficiency and encourage switching to alternative fuels, such as
electricity and natural gas.
Given the relatively long useful life of a passenger vehicle, the investment choices made by vehicle buyers
today will have environmental and security implications for a decade or more. In addition to vehicles bought to
replace the existing fleet, millions of others are expected to be added to the world’s roads in the coming years.
The UN projects the global vehicle fleet to grow from less than one billion to 2.5 billion or more by 2050;
ninety percent of this growth will take place in less-developed countries.
Powering vehicles with electricity offers the chance to reduce or eliminate emissions coming from a vehicle’s
tailpipe. As a result, governments in the U.S., Europe, and China have taken steps to encourage growth in the
market for plug-in hybrid electric vehicles (PHEVs) and battery electric vehicles (BEVs), along with other
unconventional vehicles. But the uptake of electric vehicles (EVs) has been slow, because high initial costs of
the vehicles make them less attractive than conventional vehicles with internal combustion engines (ICEs).
Moreover, current battery technology does not store enough energy to give EVs the same range as ICE vehicles
without the help of an additional source of energy, such as an on-board gasoline-powered generator.
A chief focus of EV policies, therefore, has been to offset high costs and usability limitations. Many
governments’ existing policies reduce purchase costs directly (e.g., through rebates), increase the useful range
(e.g., through subsidized networks of high capacity charging stations), or give EV drivers preferential access to
roadways (e.g., through exemptions to registration caps). And yet, sales of EVs have fallen short of both
governments’ and manufacturers’ goals, suggesting that current incentives are insufficient to break down the
barriers to market growth.
This report looks comprehensively at electric sector and transportation policies in the United States, Europe,
and China, and offers guidance on how to align these policies with the goal to increase EV ownership. It looks
at vehicle technologies and driver behavior, as well as electricity markets and grid operations, to provide a
foundation for evaluating different methods of EV charging, based on their negative impacts and their potential
to provide valuable services back to the grid. The report finds electricity markets better poised than ever to
accommodate EVs, but more work remains to ensure that transportation and electric sector policies complement
each other, and foster EV growth while maximizing the benefits to society.
Overview of EVs and Charging Infrastructure
A grid-connected electric vehicle (EV), for the purposes of this report, is defined as a vehicle powered fully or
partially by an electric motor, which is in turn powered by an onboard battery that can be charged through a
connection to the electric grid. EVs include battery-electric vehicles (BEVs), which rely exclusively on energy
stored in on-board batteries, and plug-in hybrid electric vehicles (PHEVs), which use energy from batteries
along with supplemental energy, commonly from liquid fuels. This report focuses on light-duty passenger
vehicles, which constitute a majority of EVs currently in use, but there are also electric versions of commercial
vehicles, motorcycles, and heavy-duty utility trucks, buses, military vehicles, and trains.
Current Models
The market for EVs and PHEVs has expanded in recent years, as manufacturers introduce new vehicles and
electric versions of existing models. The commercially available vehicles range in size from the smart electric
drive two-seater to Toyota’s five-seater RAV 4 electric sport utility vehicle (SUV). Different vehicles are
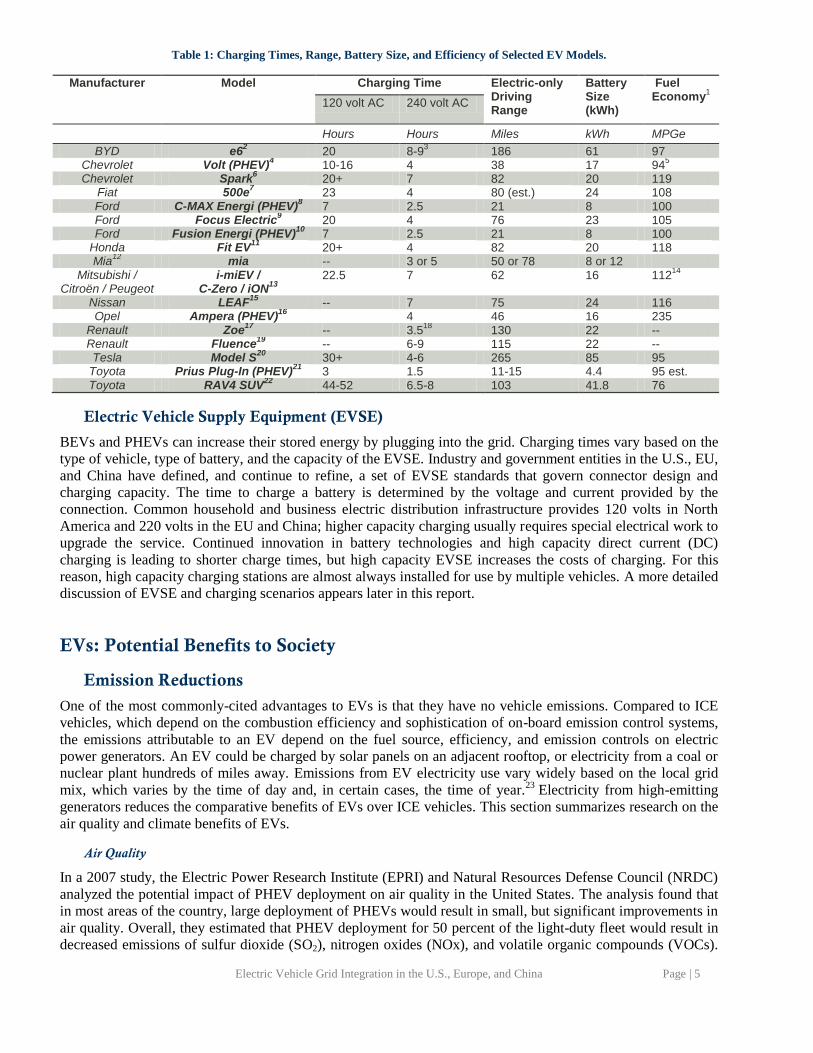
available in different markets. Table 1 summarizes information on a select set of models, their charging times,
ranges, and efficiency ratings.
Electric Vehicle Grid Integration in the U.S., Europe, and China Page | 5
Table 1: Charging Times, Range, Battery Size, and Efficiency of Selected EV Models.
Manufacturer Model Charging Time Electric-only Driving Range
Battery Size (kWh)
Fuel Economy
1
120 volt AC 240 volt AC
Hours Hours Miles kWh MPGe
BYD e62 20 8-9
3 186 61 97
Chevrolet Volt (PHEV)4 10-16 4 38 17 94
5
Chevrolet Spark6 20+ 7 82 20 119
Fiat 500e7 23 4 80 (est.) 24 108
Ford C-MAX Energi (PHEV)8 7 2.5 21 8 100
Ford Focus Electric9 20 4 76 23 105
Ford Fusion Energi (PHEV)10
7 2.5 21 8 100 Honda Fit EV
11 20+ 4 82 20 118
Mia12
mia -- 3 or 5 50 or 78 8 or 12 Mitsubishi /
Citroën / Peugeot i-miEV /
C-Zero / iON13
22.5 7 62 16 112
14
Nissan LEAF15
-- 7 75 24 116
Opel Ampera (PHEV)16
4 46 16 235 Renault Zoe
17 -- 3.5
18 130 22 --
Renault Fluence19
-- 6-9 115 22 -- Tesla Model S
20 30+ 4-6 265 85 95
Toyota Prius Plug-In (PHEV)21
3 1.5 11-15 4.4 95 est. Toyota RAV4 SUV
22 44-52 6.5-8 103 41.8 76
Electric Vehicle Supply Equipment (EVSE)
BEVs and PHEVs can increase their stored energy by plugging into the grid. Charging times vary based on the
type of vehicle, type of battery, and the capacity of the EVSE. Industry and government entities in the U.S., EU,
and China have defined, and continue to refine, a set of EVSE standards that govern connector design and
charging capacity. The time to charge a battery is determined by the voltage and current provided by the
connection. Common household and business electric distribution infrastructure provides 120 volts in North
America and 220 volts in the EU and China; higher capacity charging usually requires special electrical work to
upgrade the service. Continued innovation in battery technologies and high capacity direct current (DC)
charging is leading to shorter charge times, but high capacity EVSE increases the costs of charging. For this
reason, high capacity charging stations are almost always installed for use by multiple vehicles. A more detailed
discussion of EVSE and charging scenarios appears later in this report.
EVs: Potential Benefits to Society
Emission Reductions
One of the most commonly-cited advantages to EVs is that they have no vehicle emissions. Compared to ICE
vehicles, which depend on the combustion efficiency and sophistication of on-board emission control systems,
the emissions attributable to an EV depend on the fuel source, efficiency, and emission controls on electric
power generators. An EV could be charged by solar panels on an adjacent rooftop, or electricity from a coal or
nuclear plant hundreds of miles away. Emissions from EV electricity use vary widely based on the local grid
mix, which varies by the time of day and, in certain cases, the time of year.23
Electricity from high-emitting
generators reduces the comparative benefits of EVs over ICE vehicles. This section summarizes research on the
air quality and climate benefits of EVs.
Air Quality
In a 2007 study, the Electric Power Research Institute (EPRI) and Natural Resources Defense Council (NRDC)
analyzed the potential impact of PHEV deployment on air quality in the United States. The analysis found that
in most areas of the country, large deployment of PHEVs would result in small, but significant improvements in
air quality. Overall, they estimated that PHEV deployment for 50 percent of the light-duty fleet would result in
decreased emissions of sulfur dioxide (SO2), nitrogen oxides (NOx), and volatile organic compounds (VOCs).
Electric Vehicle Grid Integration in the U.S., Europe, and China Page | 6
Ozone concentrations would decrease in most regions, but increase in some local areas, with 61 percent of the
population experiencing decreased concentrations of ozone and 1 percent experiencing increases. Ambient PM
concentrations would also decrease in most regions. However, the study was conducted based on EIA’s 2008
Annual Energy Outlook assumptions, which forecast a coal-heavy energy mix, with only the environmental
controls that were required at the time of the analysis. Predictions of the future energy mix have since been
revised to include less coal and more natural gas. Thus, the emissions benefits of large-scale PHEV deployment
are likely to be even higher than estimated in this study.24
EVs also have the potential to reduce emissions further through their effects on the electric grid, either through
balancing load and shifting generator impact, or by providing ancillary services to the grid. A study on PHEVs
in Texas found that if vehicle charging is optimized through smart charging, a PHEV fleet of up to 15 percent of
light duty vehicles could actually decrease electric generator NOx emissions, even while increasing load.25
This
is because selectively increasing system load allows generating units to run more efficiently, and allows system
operators to deploy more efficient units. The same study found that using the batteries in the vehicles to provide
vehicle-to-grid (V2G) services could also reduce the SO2 and carbon dioxide (CO2) emissions impacts of
increased load from PHEVs. V2G services include using batteries for spinning reserves, frequency regulation,
and energy storage to address peak load.26
The study did not compare PHEVs to conventional vehicles,
however.27
In parts of the world with a more emissions-intensive electricity mix, the air quality benefits of electric vehicles
compared to gasoline vehicles may be negligible or nonexistent. A 2010 study by researchers from the Argonne
National Laboratory and China's Tsinghua University highlights the large increase in SO2 emissions that would
result from wide deployment of EVs in China, due to the country’s high reliance on coal-fired electricity.28
EVs
could lead to SO2 emissions from vehicles increasing by a factor of three to ten, and NOx emissions doubling, if
charged on the current grid. The report finds that even if the coal fleet were entirely equipped with flue gas
desulfurization (FGD) equipment (“scrubbers”), SO2 emissions from an EV would still be 1.3 to 5 times the
emissions of an ICE vehicle, particularly as China’s gasoline and diesel fuel sulfur standards drive vehicle SO2
emissions down further.
Climate Change
Transportation contributes a significant share of total man-made GHG emissions world-wide. In the United
States, 27 percent of 2011 GHG emissions resulted from transportation.29
Worldwide, 13 percent of
anthropogenic GHG emissions in 2004 were from transportation energy use.30
To the extent that EVs reduce
GHG emissions compared to conventional vehicles, they have the potential to impact total GHG emissions
significantly, but as with conventional air pollutants, CO2 emissions from electricity generation vary
significantly based on the local grid mix.
In addition, the lifecycle CO2 emissions from an EV vary greatly based on the design of the engine (for
PHEVs), motor, and battery size, as well as when and where the vehicle is charged, and how far it is driven
each year. Research has shown that grid de-carbonization is necessary in order to achieve substantial GHG
emissions reductions compared to conventional internal combustion engine (ICE) vehicles. In certain cases, ICE
vehicles may even be preferable to BEVs on a lifecycle GHG basis.31
Depending on the region, and the time of
day that charging is done, marginal demand could be met by a variety of fuel types and could result in
emissions either higher or lower than the average grid emissions rate.32
The research conducted in 2007 by EPRI and NRDC estimated that, in 2050, PHEVs would emit fewer GHGs
than conventional vehicles or hybrid vehicles, even in a scenario in which electric sector CO2 emissions
increase over 2010 levels. Lower emissions scenarios show higher GHG reductions, as do scenarios where
PHEVs have longer all-electric driving ranges.33
A 2009 Argonne National Laboratories study also found that a
gasoline-fueled PHEV would offer a 30 to 60 percent well-to-wheel reduction in GHG emissions over a
gasoline-fueled ICE vehicle; fueling with cellulosic ethanol or transitioning to hydrogen fuel cell vehicles could
potentially result in even greater emission reductions.34
The 2010 study on China found that deploying EVs would increase CO2 emissions given the current grid mix.
Compared to a conventional gasoline vehicle, CO2 emissions from an EV powered by coal-fired electricity
Electric Vehicle Grid Integration in the U.S., Europe, and China Page | 7
could increase by 7.2 percent. However, the report notes that a shift to more efficient, less carbon-intensive
electricity generation could change this.35
In the UK, which has one of the more carbon intensive grid mixes in Europe, a study by the Royal Academy of
Engineering noted that emissions from electric vehicles are similar to those from efficient gasoline and diesel
vehicles when fueled by the current grid mix. However, the study also notes that with de-carbonization of the
energy supply, widespread deployment of EVs could result in a significant reduction in GHG emissions in the
UK.36
EV impacts on electricity emissions in other regions are discussed later in the report.
EV Policy Implications
Detailed consideration of emissions impacts is needed across all of the study areas. EVs move emissions from
the tailpipe to the power plant, reducing localized mobile source emissions where vehicles are driven, but
increasing the need to generate electricity elsewhere. A robust understanding of the emissions implications of
charging strategies is the only way to ensure net emission reductions from EVs. Policies should seek to limit the
extent to which pollution is simply moved from one place to another.
Existing policies may or may not be effective in managing the emissions impacts from charging EVs. In the EU,
the National Emissions Ceilings Directive sets caps for key pollutants, and the Industrial Emissions Directive
sets emission standards for coal plants. In the U.S., national air policies for NOx are designed to ensure air
quality meets certain standards to protect human health, but they generally do not impose emission performance
standards on power plants. Some states, such as California, have adopted their own emission standards for
power generation. Otherwise, state environmental agencies and courts have the power to impose emission
limits, but this process would not lend itself to long-range planning. A thorough EV policy should consider
whether charging and operating an EV is exacerbating a problem upstream.
Energy Security
EVs, which rely on domestically produced electricity, have significant potential to reduce dependence on
foreign oil for oil-importing nations. In the United States, 47 percent of oil consumed in 2011 was imported
(11.4 million barrels per day).37
In 2011, 70 percent of total U.S. oil consumption was used for transportation,
with less than one percent consumed for electric power generation; thus, shifting transportation energy from oil-
based fuel to electricity has the potential to significantly reduce U.S. dependence on foreign oil.38
U.S. domestic
oil production has risen in recent years, but as of March 2013, the country continued to import more than seven
million barrels of crude oil per day.
Dependence on foreign oil imposes significant costs on the U.S. economy, as well as those of other nations that
import oil. The Lawrence Berkeley National Laboratory estimates that dependence on foreign oil cost the U.S.
economy $5.7 trillion from 1970-2009.39
In addition, a report from the RAND Corporation reviewed estimates
of the defense and security costs to protect the U.S. supply and transit of foreign oil, and found estimates
ranging from $29 to $143 billion per year.40
The $85 billion midpoint of these estimates equates to roughly $30
per barrel at an import level of eight million barrels per day.
All of the countries under study in this report are net importers of crude oil. To the extent that electricity
generation can be fueled through domestically produced fuels or renewable energy, the deployment of EVs has
the potential to reduce the direct and indirect costs of importing oil.
Electric Grid Management
In addition to the environmental and security benefits from switching away from oil-based fuels, EVs are
uniquely positioned to help maintain electric system stability. The promise of EVs providing energy and
capacity to the grid has been discussed widely, but is yet unrealized in a large scale. This section will explain
the potential benefits to the grid, and a later section will explore how regulators can design incentives and
policies that maximize these benefits.
Since personal vehicles are typically utilized only a small fraction of the day, they can be made available the
rest of the time for a secondary function. Grid-connected EVs can help balance the electric system by serving as
a capacity and energy resource, storing energy generated during off-peak periods, and returning it to the grid
Electric Vehicle Grid Integration in the U.S., Europe, and China Page | 8
during peak electricity demand periods. Their connection to the grid can also be used to increase total electric
system efficiency by reducing the ratio of peak to off-peak load, a key metric of efficiency for system monitors.
Background on Electric System Resource Planning
Regulators and operators of electric grids around the world have the responsibility to make sure that electricity
flows reliably to customers by matching the supply (generation) of electricity with the demand for it (also
known as “load”). Maintaining stability on an electric system requires a strategy to ensure that ample generating
capacity resources are available over the long term, that those resources are able to deliver energy when it is
needed, and that the system can respond quickly to adjust for fluctuations in demand, as well as unplanned
generator failures.
How this is undertaken depends on the electricity market structure. In the U.S., an array of grid operators,
utilities, utility commissions, local distribution companies (LDCs), regional reliability coalitions, and other
entities have joint responsibility for resource planning and system operations.41
In vertically integrated markets,
investor-owned utilities own power plants and deliver electricity to customers, and resource planning is
centrally managed by utilities, regulators, and regional reliability authorities. Utilities manage real-time
operation of the electric grid, matching supply to demand. In deregulated markets, regional transmission
organizations (RTOs) procure energy and capacity through organized markets. RTOs have indirect control over
the market by writing market rules to ensure that the correct price signals are sent to both generators (supply)
and consumers (demand).
Resource planning in the European Union (EU) has, until recently, been a nationally coordinated function,
although the EU has completed deregulation and unbundling of energy and transmission services, and is in the
midst of deploying more robust, multi-country wholesale power markets. Real-time operations rely on a mix of
centrally managed national systems, together with multi-country “power pools.” Competitively-procured
electricity is delivered to customers by distribution system operators (DSOs), which are equivalent to LDCs in
the U.S. In China, two state-owned grid companies supply electricity to the whole country, manage resource
planning, and set electricity rates. A more detailed discussion of electricity market regulation follows later in
this report.
Capacity, Energy, and Other Resources
The technical challenge of balancing the electric grid in real time is the same across all market structures. In the
U.S., this means keeping power frequency within a narrow range around 60 cycles per second (hertz, or Hz); in
the EU and China, the system operates at a frequency of 50 Hz. If system load exceeds supply, the frequency
will drop, and vice versa. Grid operators can avoid prolonged frequency imbalances by ensuring the ability to
increase or decrease supply or load, working with generators and other market participants who supply a variety
of “grid services”. Although each grid operator defines its own categories of grid services, and terminology
varies widely, the resources can be generally defined as capacity, energy, and ancillary services:
Capacity resources are procured months or years before delivery to ensure that the system will have
enough generating capacity to meet consumption needs. Procuring capacity means securing a
commitment from a generator that it will be able to deliver energy, as needed, at a future time.
Energy resources are procured days or hours before delivery, based on short-term forecasts of system
load. Energy resources that are selected to run are expected to provide energy as and when needed.
Ancillary services are procured within minutes or seconds of delivery, based on the very short-term
needs of the system. These resources allow system operators to manage short-term frequency and
voltage fluctuations based on changes in supply and demand.42
Table 2 provides some common
resource definitions used in the U.S. and Europe, although the definition of ancillary services varies
from market to market.43
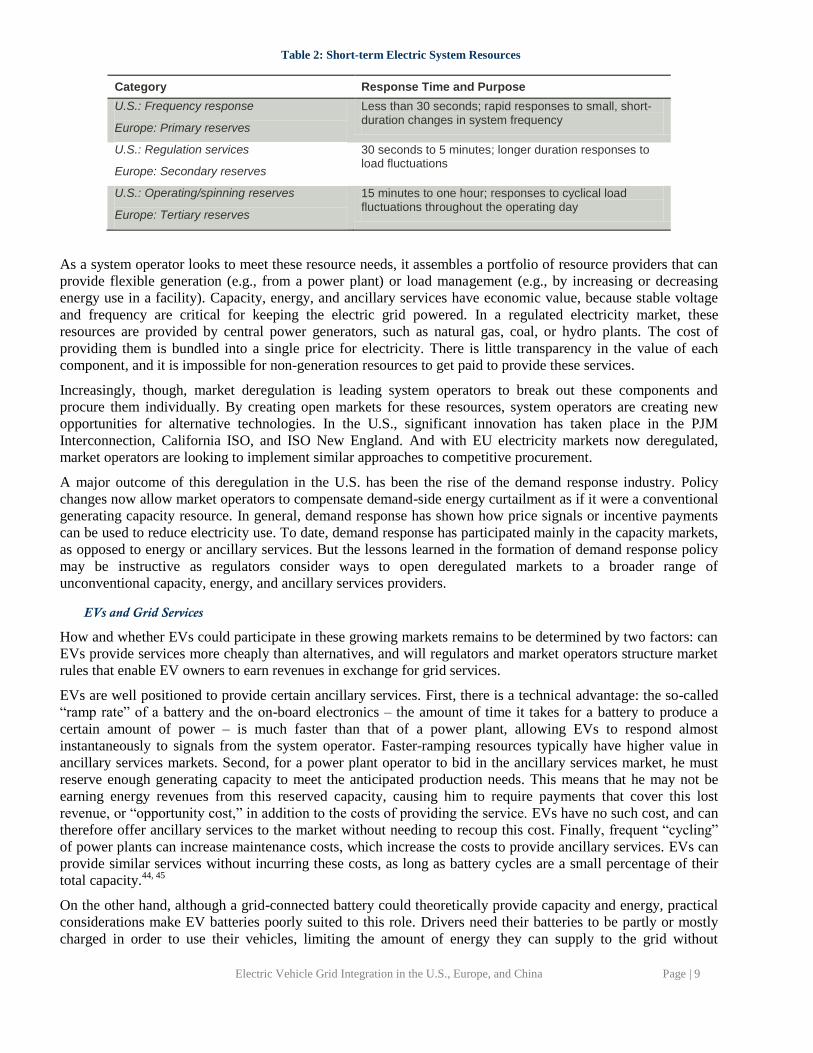
Electric Vehicle Grid Integration in the U.S., Europe, and China Page | 9
Table 2: Short-term Electric System Resources
Category Response Time and Purpose
U.S.: Frequency response
Europe: Primary reserves
Less than 30 seconds; rapid responses to small, short-duration changes in system frequency
U.S.: Regulation services
Europe: Secondary reserves
30 seconds to 5 minutes; longer duration responses to load fluctuations
U.S.: Operating/spinning reserves
Europe: Tertiary reserves
15 minutes to one hour; responses to cyclical load fluctuations throughout the operating day
As a system operator looks to meet these resource needs, it assembles a portfolio of resource providers that can
provide flexible generation (e.g., from a power plant) or load management (e.g., by increasing or decreasing
energy use in a facility). Capacity, energy, and ancillary services have economic value, because stable voltage
and frequency are critical for keeping the electric grid powered. In a regulated electricity market, these
resources are provided by central power generators, such as natural gas, coal, or hydro plants. The cost of
providing them is bundled into a single price for electricity. There is little transparency in the value of each
component, and it is impossible for non-generation resources to get paid to provide these services.
Increasingly, though, market deregulation is leading system operators to break out these components and
procure them individually. By creating open markets for these resources, system operators are creating new
opportunities for alternative technologies. In the U.S., significant innovation has taken place in the PJM
Interconnection, California ISO, and ISO New England. And with EU electricity markets now deregulated,
market operators are looking to implement similar approaches to competitive procurement.
A major outcome of this deregulation in the U.S. has been the rise of the demand response industry. Policy
changes now allow market operators to compensate demand-side energy curtailment as if it were a conventional
generating capacity resource. In general, demand response has shown how price signals or incentive payments
can be used to reduce electricity use. To date, demand response has participated mainly in the capacity markets,
as opposed to energy or ancillary services. But the lessons learned in the formation of demand response policy
may be instructive as regulators consider ways to open deregulated markets to a broader range of
unconventional capacity, energy, and ancillary services providers.
EVs and Grid Services
How and whether EVs could participate in these growing markets remains to be determined by two factors: can
EVs provide services more cheaply than alternatives, and will regulators and market operators structure market
rules that enable EV owners to earn revenues in exchange for grid services.
EVs are well positioned to provide certain ancillary services. First, there is a technical advantage: the so-called
“ramp rate” of a battery and the on-board electronics – the amount of time it takes for a battery to produce a
certain amount of power – is much faster than that of a power plant, allowing EVs to respond almost
instantaneously to signals from the system operator. Faster-ramping resources typically have higher value in
ancillary services markets. Second, for a power plant operator to bid in the ancillary services market, he must
reserve enough generating capacity to meet the anticipated production needs. This means that he may not be
earning energy revenues from this reserved capacity, causing him to require payments that cover this lost
revenue, or “opportunity cost,” in addition to the costs of providing the service. EVs have no such cost, and can
therefore offer ancillary services to the market without needing to recoup this cost. Finally, frequent “cycling”
of power plants can increase maintenance costs, which increase the costs to provide ancillary services. EVs can
provide similar services without incurring these costs, as long as battery cycles are a small percentage of their
total capacity.44, 45
On the other hand, although a grid-connected battery could theoretically provide capacity and energy, practical
considerations make EV batteries poorly suited to this role. Drivers need their batteries to be partly or mostly
charged in order to use their vehicles, limiting the amount of energy they can supply to the grid without
Electric Vehicle Grid Integration in the U.S., Europe, and China Page | 10
recharging. Vehicle owners may reject the notion of supplying power to the grid when they are in the midst of
the day’s driving.46
Current battery technology suffers about 25 percent efficiency loss in round-trip (charge to
discharge) cycles, making power from batteries fairly expensive. And finally, increased cycling of batteries
causes faster battery degradation, adding further to the cost of electricity. As a result, battery-stored electricity is
often less cost-competitive than other forms of capacity and energy.47 EVs are likely to be most cost-effective
for regulation services/secondary reserves, where the technology has an inherent advantage.
Another consideration is whether EVs are configured as “dispatchable” – meaning that they are obligated to
provide grid services at the request of the grid operator, or “non-dispatchable,” meaning that the grid operator
has limited control. Unlike other advanced technologies that have been deployed for ancillary services, such as
industrial water heaters or space heaters, EVs are mobile, which may add complexity to knowing where and
when vehicles will be connected to the grid, and available for dispatch. EVs may be excluded from markets
unless rules allow non-dispatchable resources.
In addition, compensating vehicle owners for certain types of ancillary services would require separate metering
equipment, which increases the cost and complexity of EVSE. Little work has been done to show how these
costs add up. Additional analysis is needed to identify a model cost curve for a range of vehicles and electric
grids.
Regional market and electric system demands will ultimately determine which grid resources from EVs are
economically justified. Even if EVs are technically capable of providing high quality capacity, energy, or
ancillary services, each decision to implement the right market mechanisms and provide compensation for EVs
needs to be taken in the context of the best available technology and the broader grid operating requirements.
Aggregation
Historically, many electricity markets have had high minimum capacity thresholds for market participants,
ranging from one megawatt (MW) in certain U.S. markets, to as much as 50 MW in France. Even at a one MW
cutoff, a minimum fleet size of roughly 100 EVs charging simultaneously on Level 2 EVSE would be needed to
participate in a market. To ensure that at least 100 EVs are available at any given time, the total vehicle pool
may need to be significantly larger.
An industry of capacity service providers (CSPs) has emerged in the U.S. to address a similar issue for demand
response providers. These companies pool energy end users that are too small to participate in electricity
markets, and bid blocks of capacity into the markets. A similar function will be needed to manage fleets of grid-
connected EVs. These entities would need to ensure that the services are available when needed, and enforce
charging standards that are compatible with the requirements of the grid.
From a policy perspective, changing market rules by reducing the minimum block size would encourage greater
participation from advanced technologies. The PJM Interconnection has done this, reducing the minimum
power capacity requirement to 100 kilowatts (kW). Such a move can enable a more immediate role for EVs in
the grid, by reducing the minimum number of vehicles needed to bid into the market.
Demonstrating Ancillary Services in the PJM Interconnection
The use of EVs to provide ancillary services is similar in concept to the use of other large household electric loads. The PJM Interconnection, which manages parts of the mid-Atlantic electric grid from New Jersey south to Maryland and west to Chicago, has recently expanded its “Advanced Technology” program to show how consumer products can play a role in grid operations. They have deployed controllable refrigerators, battery banks, water heaters, and space heaters that are capable of responding to a regulation signal to reduce or increase load. PJM is able to tap this distributed network to maintain system conditions. The organization has also begun collaborating with BMW North America to show how EV charging can be controlled using a price signal from the wholesale electricity markets. PJM has also recent started a collaboration to explore the potential for fleets of vehicles to provide frequency regulation services to the grid.
Electric Vehicle Grid Integration in the U.S., Europe, and China Page | 11
Load Smoothing
In some electricity markets, utilization of baseload power plants during off-peak leads to lower generating
efficiencies and higher air emissions, as well as a need to “cycle” power plants down to match a drop in load.48
This daily fluctuation in load is known as a “load curve,” and varies seasonally as well as daily. Ever-changing
capacity needs require system operators to adjust the level of output from power plants. Large fleets of EVs
could bridge the off-peak “valley” by timing charging to coincide with cyclical off-peak load patterns.
To illustrate how this would work, consider an electric system with an off-peak load of 15 gigawatts (GW), an
on-peak load of 25 GW, and 16 million vehicles on the road – roughly the scale of the vehicle fleet registered in
the electricity market that serves the six northeastern U.S. states. Assume that EV market penetration reaches
five percent (800,000 vehicles), and that 80 percent of those charge overnight on home chargers with an average
capacity of 4 kW. The overnight generating gap would close by 2.6 GW, allowing system operators to avoid
cycling 26 percent of their load-following generating capacity. In areas with significant installed wind energy
capacity, this could enable system operators to absorb excess wind output without forcing down-cycling of
conventional power plants.
A 2007 study by the Pacific Northwest National Laboratories assessed the impacts of PHEVs on utilities and
regional power grids in the U.S. The study found that, for two studied utilities, PHEVs charged solely during
off-peak would reduce the average cost of power for the utility, because due to use of untapped off-peak
capacity fixed costs would remain largely the same, while energy sales increased.
From a policy perspective, the key enabler of load smoothing is the ability to control the time of day when
vehicles are charging. Time-of-day charging strategies should be developed using comprehensive information
about the efficiency, utilization, and emissions profile of the electric power generating fleet.
Regional Transportation and Electric Sector Market Dynamics
This report examines three broad regions – the U.S., the EU, and China. It is impractical, however, to draw
generalized conclusions at the regional levels since so much economic and demographic variation exists within
the countries in focus. The report therefore highlights a series of sub-regions, with particular attention to near-
term EV market growth potential. Within the U.S., we cite examples from California, Massachusetts, and
Michigan. These states cover a range of differences in electric power generation and power market structures.
Within the EU, we cite examples from France, Germany, Spain, the United Kingdom, and Denmark. In addition
Grid-to-Vehicle vs. Vehicle-to-Grid
The simplest way to employ an EV for grid services is through a one-way grid-to-vehicle (G2V) connection, which requires minimal investment in EVSE. EVs can affect the grid by reducing or increasing the amount of power they draw from the grid.
Some studies have looked at the potential for enhanced vehicle-to-grid (V2G) services, in which EVs can send power back to the grid. With V2G, grid operators could store and draw power as needed from on-board batteries. This capability makes sense if battery costs are sufficiently low; otherwise, the added costs of battery degradation may make electricity from EVs uneconomic.
In January 2013, the U.S. Department of Defense announced plans to invest $20 million in a fleet of V2G-enabled EVs. The EVs are expected to replace existing fleets of passenger sedans, shuttle buses, and other vehicles, and provide on-demand peak power to the grid. The Department’s analysis has shown that the vehicles will be profitable as a result of fuel savings and revenues from grid services. The fleet of 500 vehicles would be deployed at six locations in late 2013, with the first vehicles going into use at the Los Angeles Air Force Base.
Source: U.S. Department of Defense, DOD Electric Vehicles Will Supply Power to Local Grids, http://www.defense.gov/News/NewsArticle.aspx?ID=118971, accessed June 18, 2013.
Electric Vehicle Grid Integration in the U.S., Europe, and China Page | 12
to providing a snapshot of Western Europe, these countries have each implemented EV policies and have
collected and published relevant data that are useful for the analysis. Within China, we cite information from
Beijing, Hong Kong, Guangzhou, and Shenzhen, which are significant economic centers with demonstrated
long-term EV policy planning. Given the diversity of cities, states, and countries in the study area, these
examples are not assumed to provide a comprehensive picture of the regions, but they do offer an opportunity to
explore key policy issues.
Vehicle Ownership and Usage
In the pursuit of mitigating transportation sector emissions of key air pollutants such as nitrogen oxides, sulfur
dioxide, and carbon dioxide, country leaders around the world have established ambitious targets for EV
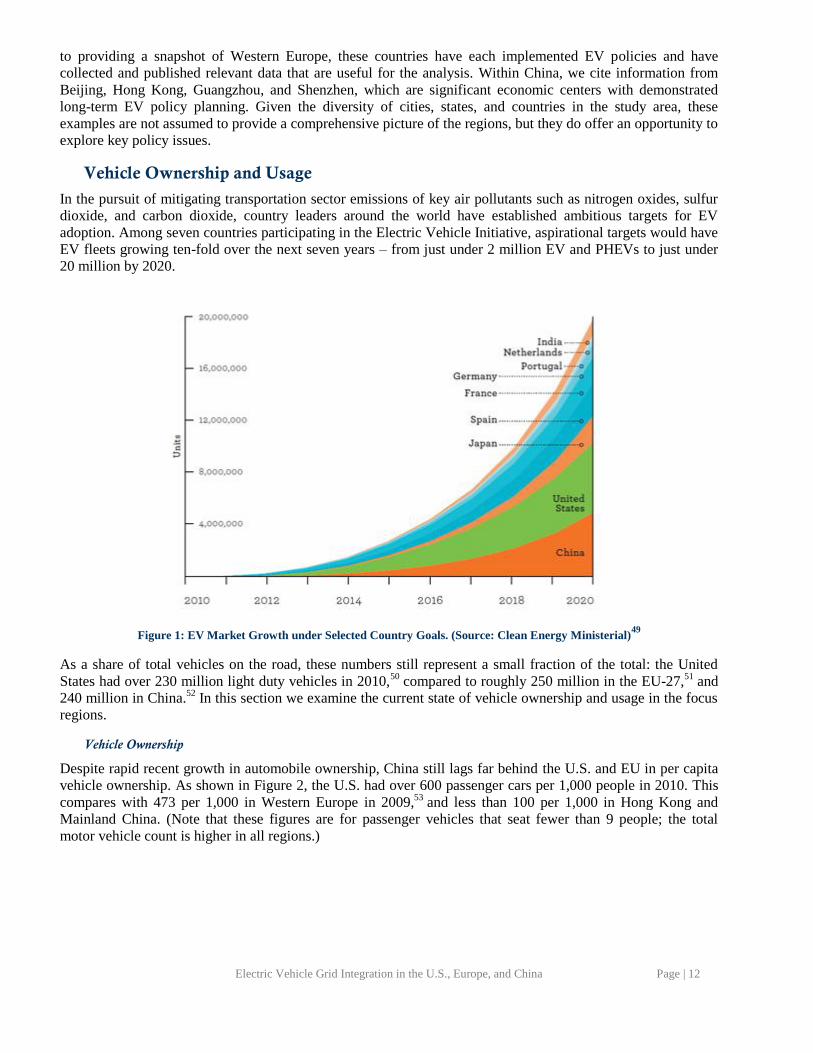
adoption. Among seven countries participating in the Electric Vehicle Initiative, aspirational targets would have
EV fleets growing ten-fold over the next seven years – from just under 2 million EV and PHEVs to just under
20 million by 2020.
Figure 1: EV Market Growth under Selected Country Goals. (Source: Clean Energy Ministerial)49
As a share of total vehicles on the road, these numbers still represent a small fraction of the total: the United
States had over 230 million light duty vehicles in 2010,50
compared to roughly 250 million in the EU-27,51
and
240 million in China.52
In this section we examine the current state of vehicle ownership and usage in the focus
regions.
Vehicle Ownership
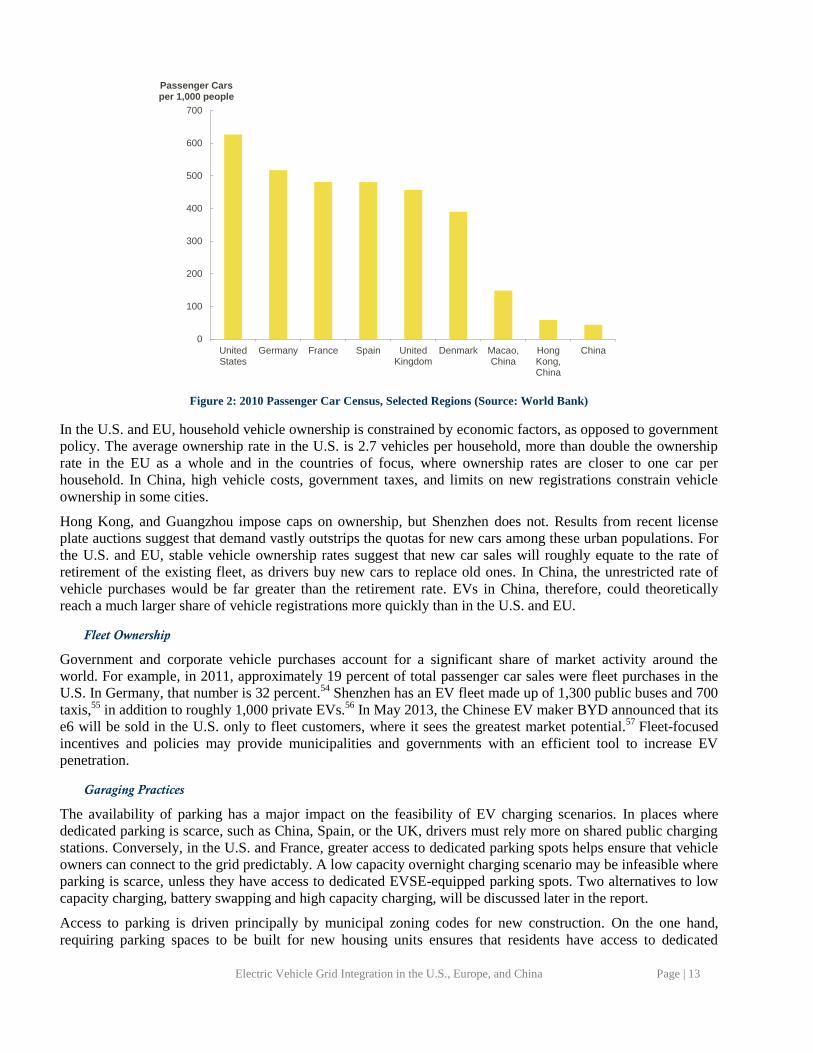
Despite rapid recent growth in automobile ownership, China still lags far behind the U.S. and EU in per capita
vehicle ownership. As shown in Figure 2, the U.S. had over 600 passenger cars per 1,000 people in 2010. This
compares with 473 per 1,000 in Western Europe in 2009,53
and less than 100 per 1,000 in Hong Kong and
Mainland China. (Note that these figures are for passenger vehicles that seat fewer than 9 people; the total
motor vehicle count is higher in all regions.)
Electric Vehicle Grid Integration in the U.S., Europe, and China Page | 13
Figure 2: 2010 Passenger Car Census, Selected Regions (Source: World Bank)
In the U.S. and EU, household vehicle ownership is constrained by economic factors, as opposed to government
policy. The average ownership rate in the U.S. is 2.7 vehicles per household, more than double the ownership
rate in the EU as a whole and in the countries of focus, where ownership rates are closer to one car per
household. In China, high vehicle costs, government taxes, and limits on new registrations constrain vehicle
ownership in some cities.
Hong Kong, and Guangzhou impose caps on ownership, but Shenzhen does not. Results from recent license
plate auctions suggest that demand vastly outstrips the quotas for new cars among these urban populations. For
the U.S. and EU, stable vehicle ownership rates suggest that new car sales will roughly equate to the rate of
retirement of the existing fleet, as drivers buy new cars to replace old ones. In China, the unrestricted rate of
vehicle purchases would be far greater than the retirement rate. EVs in China, therefore, could theoretically
reach a much larger share of vehicle registrations more quickly than in the U.S. and EU.
Fleet Ownership
Government and corporate vehicle purchases account for a significant share of market activity around the
world. For example, in 2011, approximately 19 percent of total passenger car sales were fleet purchases in the
U.S. In Germany, that number is 32 percent.54
Shenzhen has an EV fleet made up of 1,300 public buses and 700
taxis,55
in addition to roughly 1,000 private EVs.56
In May 2013, the Chinese EV maker BYD announced that its
e6 will be sold in the U.S. only to fleet customers, where it sees the greatest market potential.57
Fleet-focused
incentives and policies may provide municipalities and governments with an efficient tool to increase EV
penetration.
Garaging Practices
The availability of parking has a major impact on the feasibility of EV charging scenarios. In places where
dedicated parking is scarce, such as China, Spain, or the UK, drivers must rely more on shared public charging
stations. Conversely, in the U.S. and France, greater access to dedicated parking spots helps ensure that vehicle
owners can connect to the grid predictably. A low capacity overnight charging scenario may be infeasible where
parking is scarce, unless they have access to dedicated EVSE-equipped parking spots. Two alternatives to low
capacity charging, battery swapping and high capacity charging, will be discussed later in the report.
Access to parking is driven principally by municipal zoning codes for new construction. On the one hand,
requiring parking spaces to be built for new housing units ensures that residents have access to dedicated
0
100
200
300
400
500
600
700
UnitedStates
Germany France Spain UnitedKingdom
Denmark Macao,China
HongKong,China
China
Passenger Cars per 1,000 people
Electric Vehicle Grid Integration in the U.S., Europe, and China Page | 14
parking. On the other hand, making parking readily available for all residents reduces the value of the incentive
offered by dedicated EV charging spots.
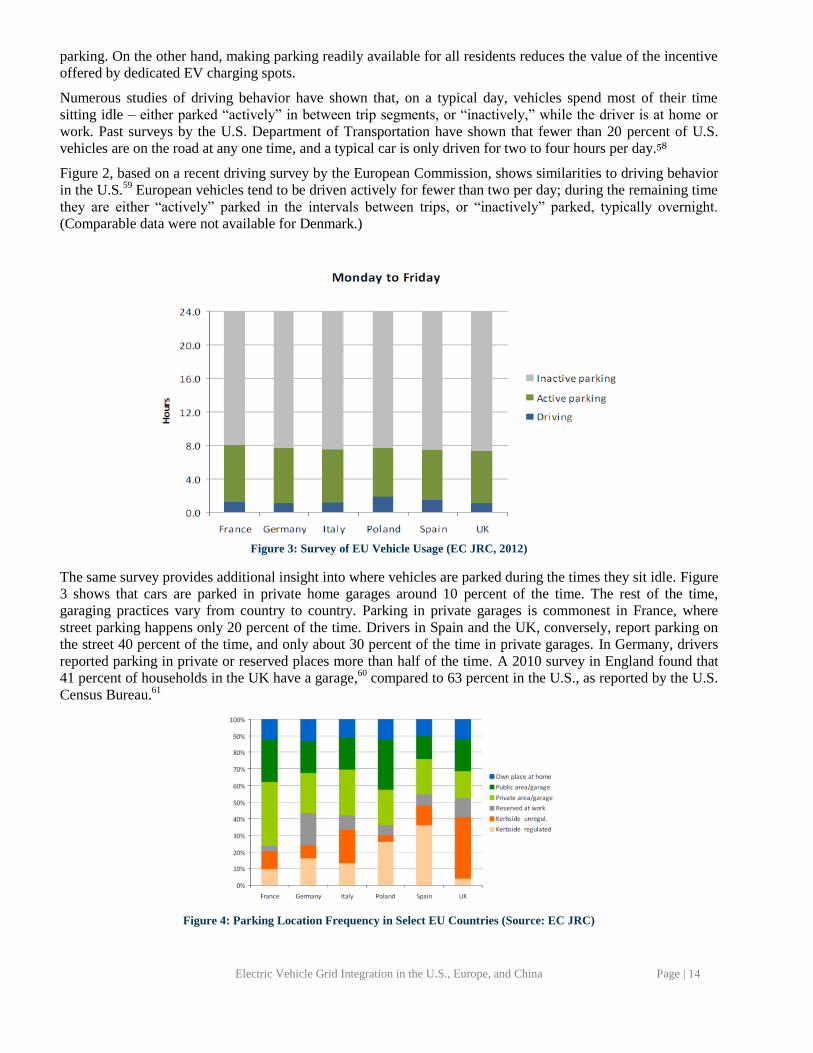
Numerous studies of driving behavior have shown that, on a typical day, vehicles spend most of their time
sitting idle – either parked “actively” in between trip segments, or “inactively,” while the driver is at home or
work. Past surveys by the U.S. Department of Transportation have shown that fewer than 20 percent of U.S.
vehicles are on the road at any one time, and a typical car is only driven for two to four hours per day.58
Figure 2, based on a recent driving survey by the European Commission, shows similarities to driving behavior
in the U.S.59
European vehicles tend to be driven actively for fewer than two per day; during the remaining time
they are either “actively” parked in the intervals between trips, or “inactively” parked, typically overnight.
(Comparable data were not available for Denmark.)
Figure 3: Survey of EU Vehicle Usage (EC JRC, 2012)
The same survey provides additional insight into where vehicles are parked during the times they sit idle. Figure
3 shows that cars are parked in private home garages around 10 percent of the time. The rest of the time,
garaging practices vary from country to country. Parking in private garages is commonest in France, where
street parking happens only 20 percent of the time. Drivers in Spain and the UK, conversely, report parking on
the street 40 percent of the time, and only about 30 percent of the time in private garages. In Germany, drivers
reported parking in private or reserved places more than half of the time. A 2010 survey in England found that
41 percent of households in the UK have a garage,60
compared to 63 percent in the U.S., as reported by the U.S.
Census Bureau.61
Figure 4: Parking Location Frequency in Select EU Countries (Source: EC JRC)
Electric Vehicle Grid Integration in the U.S., Europe, and China Page | 15
Parking in Chinese cities, where high rises dominate, depends on “parking centers.” Hong Kong carefully
controls the balance of vehicles and parking spaces. Beijing, which has 5 million registered vehicles but only
1.3 million public parking spaces, has plans to build vertical and underground parking areas.62
As EV ownership
increases, urban planning authorities in cities like Beijing and Shenzhen are looking for ways to build parking
centers close to residential buildings where owners can charge vehicles overnight.63
But few Chinese
households in major cities have access to dedicated parking where EV chargers could be installed. City center
parking spaces are at a premium, and the supply represents only a fraction of the number of registered vehicles.
This imbalance is only likely to be exacerbated by growing vehicle ownership.64
Model building codes for
urban communities require 0.2 to 0.8 parking spaces per residence, so as per-household vehicle ownership rates
increase, demand for parking will follow.65
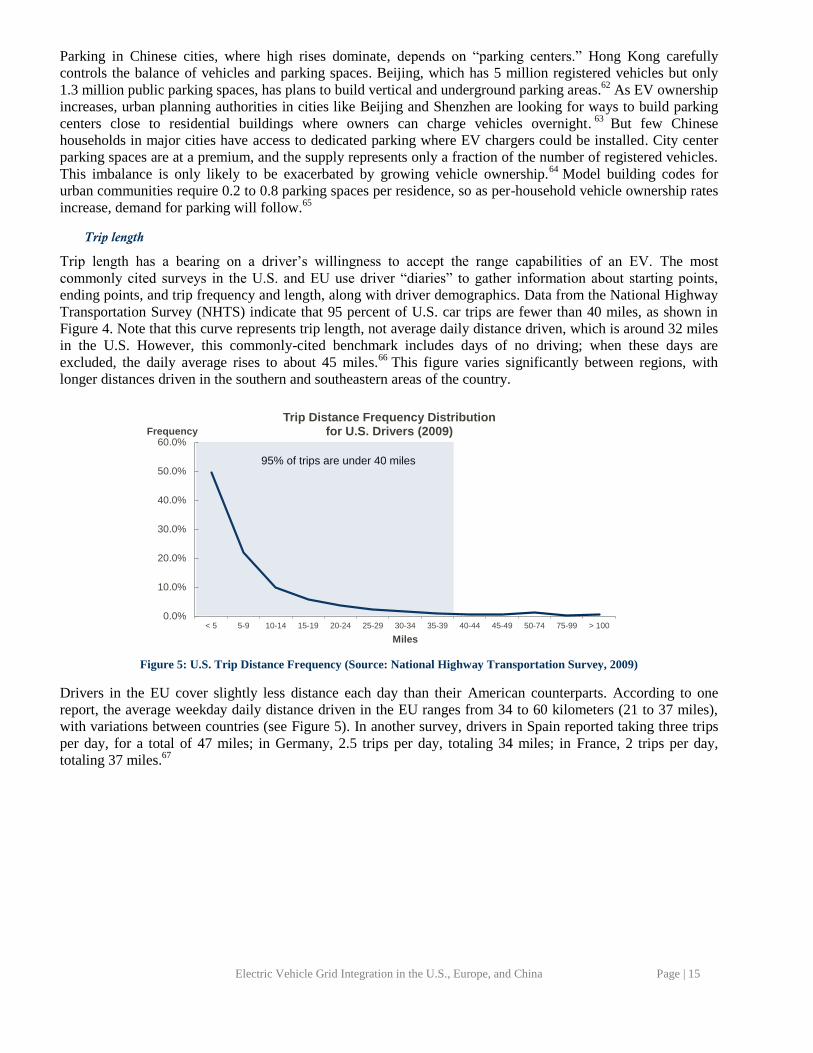
Trip length
Trip length has a bearing on a driver’s willingness to accept the range capabilities of an EV. The most
commonly cited surveys in the U.S. and EU use driver “diaries” to gather information about starting points,
ending points, and trip frequency and length, along with driver demographics. Data from the National Highway
Transportation Survey (NHTS) indicate that 95 percent of U.S. car trips are fewer than 40 miles, as shown in
Figure 4. Note that this curve represents trip length, not average daily distance driven, which is around 32 miles
in the U.S. However, this commonly-cited benchmark includes days of no driving; when these days are
excluded, the daily average rises to about 45 miles.66
This figure varies significantly between regions, with
longer distances driven in the southern and southeastern areas of the country.
Figure 5: U.S. Trip Distance Frequency (Source: National Highway Transportation Survey, 2009)
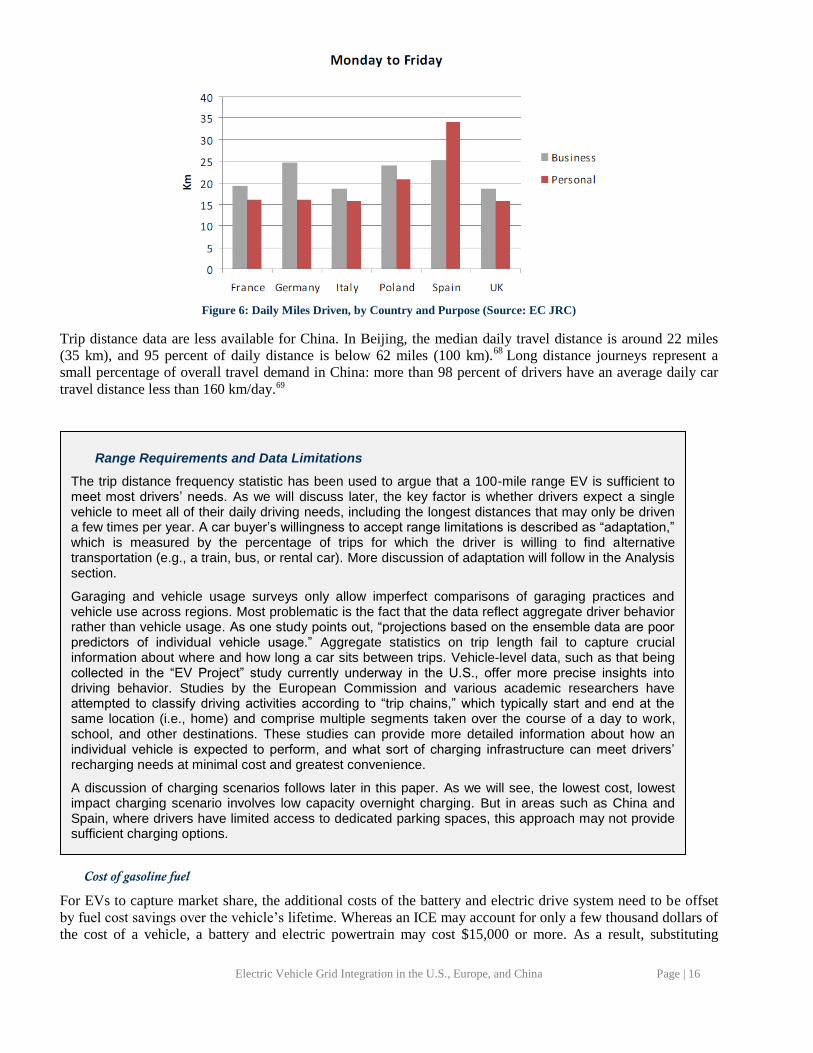
Drivers in the EU cover slightly less distance each day than their American counterparts. According to one
report, the average weekday daily distance driven in the EU ranges from 34 to 60 kilometers (21 to 37 miles),
with variations between countries (see Figure 5). In another survey, drivers in Spain reported taking three trips
per day, for a total of 47 miles; in Germany, 2.5 trips per day, totaling 34 miles; in France, 2 trips per day,
totaling 37 miles.67
0.0%
10.0%
20.0%
30.0%
40.0%
50.0%
60.0%
< 5 5-9 10-14 15-19 20-24 25-29 30-34 35-39 40-44 45-49 50-74 75-99 > 100
Frequency
Miles
Trip Distance Frequency Distribution for U.S. Drivers (2009)
95% of trips are under 40 miles
Electric Vehicle Grid Integration in the U.S., Europe, and China Page | 16
Figure 6: Daily Miles Driven, by Country and Purpose (Source: EC JRC)
Trip distance data are less available for China. In Beijing, the median daily travel distance is around 22 miles
(35 km), and 95 percent of daily distance is below 62 miles (100 km).68
Long distance journeys represent a
small percentage of overall travel demand in China: more than 98 percent of drivers have an average daily car
travel distance less than 160 km/day.69
Cost of gasoline fuel
For EVs to capture market share, the additional costs of the battery and electric drive system need to be offset
by fuel cost savings over the vehicle’s lifetime. Whereas an ICE may account for only a few thousand dollars of
the cost of a vehicle, a battery and electric powertrain may cost $15,000 or more. As a result, substituting
Range Requirements and Data Limitations
The trip distance frequency statistic has been used to argue that a 100-mile range EV is sufficient to meet most drivers’ needs. As we will discuss later, the key factor is whether drivers expect a single vehicle to meet all of their daily driving needs, including the longest distances that may only be driven a few times per year. A car buyer’s willingness to accept range limitations is described as “adaptation,” which is measured by the percentage of trips for which the driver is willing to find alternative transportation (e.g., a train, bus, or rental car). More discussion of adaptation will follow in the Analysis section.
Garaging and vehicle usage surveys only allow imperfect comparisons of garaging practices and vehicle use across regions. Most problematic is the fact that the data reflect aggregate driver behavior rather than vehicle usage. As one study points out, “projections based on the ensemble data are poor predictors of individual vehicle usage.” Aggregate statistics on trip length fail to capture crucial information about where and how long a car sits between trips. Vehicle-level data, such as that being collected in the “EV Project” study currently underway in the U.S., offer more precise insights into driving behavior. Studies by the European Commission and various academic researchers have attempted to classify driving activities according to “trip chains,” which typically start and end at the same location (i.e., home) and comprise multiple segments taken over the course of a day to work, school, and other destinations. These studies can provide more detailed information about how an individual vehicle is expected to perform, and what sort of charging infrastructure can meet drivers’ recharging needs at minimal cost and greatest convenience.
A discussion of charging scenarios follows later in this paper. As we will see, the lowest cost, lowest impact charging scenario involves low capacity overnight charging. But in areas such as China and Spain, where drivers have limited access to dedicated parking spaces, this approach may not provide sufficient charging options.
Electric Vehicle Grid Integration in the U.S., Europe, and China Page | 17
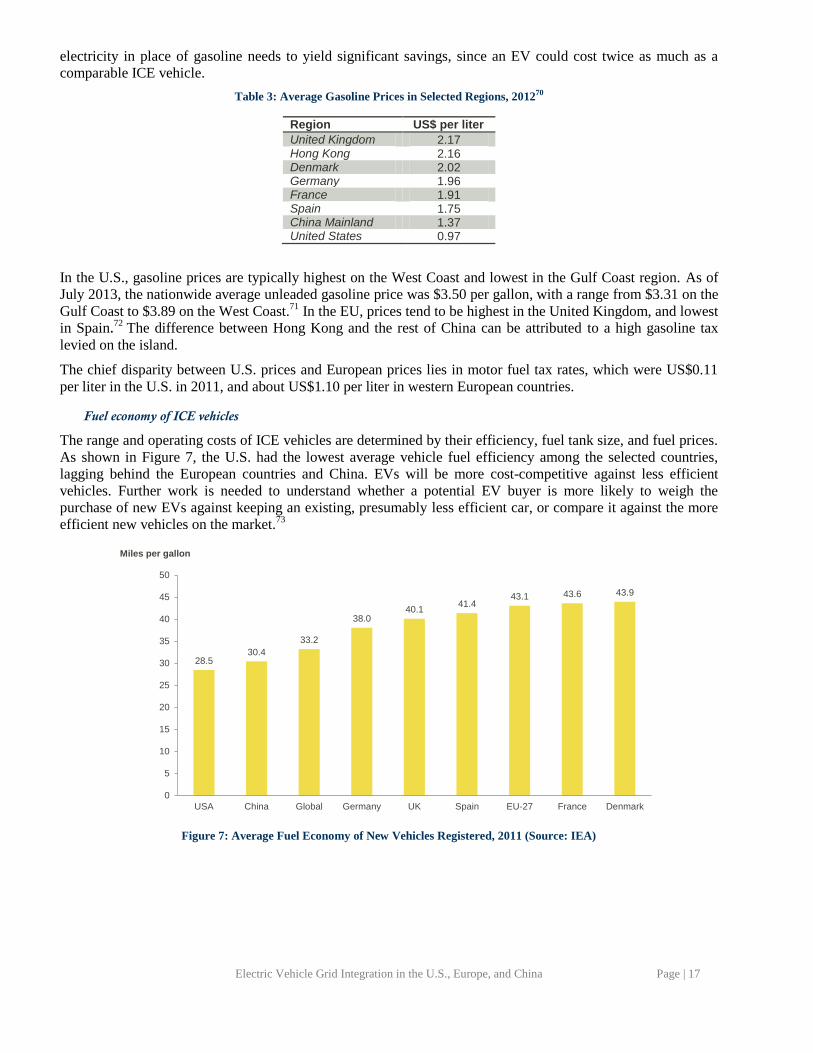
electricity in place of gasoline needs to yield significant savings, since an EV could cost twice as much as a
comparable ICE vehicle.
Table 3: Average Gasoline Prices in Selected Regions, 201270
Region US$ per liter
United Kingdom 2.17 Hong Kong 2.16 Denmark 2.02 Germany 1.96 France 1.91 Spain 1.75 China Mainland 1.37 United States 0.97
In the U.S., gasoline prices are typically highest on the West Coast and lowest in the Gulf Coast region. As of
July 2013, the nationwide average unleaded gasoline price was $3.50 per gallon, with a range from $3.31 on the
Gulf Coast to $3.89 on the West Coast.71
In the EU, prices tend to be highest in the United Kingdom, and lowest
in Spain.72 The difference between Hong Kong and the rest of China can be attributed to a high gasoline tax
levied on the island.
The chief disparity between U.S. prices and European prices lies in motor fuel tax rates, which were US$0.11
per liter in the U.S. in 2011, and about US$1.10 per liter in western European countries.
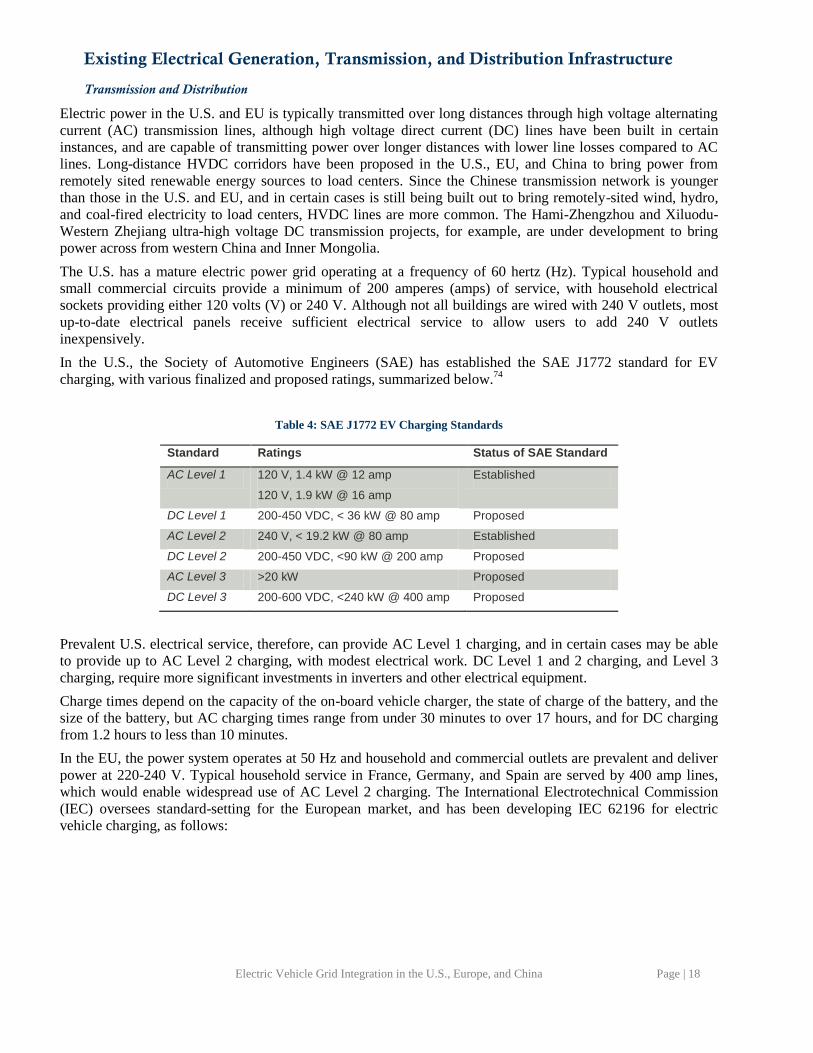
Fuel economy of ICE vehicles
The range and operating costs of ICE vehicles are determined by their efficiency, fuel tank size, and fuel prices.
As shown in Figure 7, the U.S. had the lowest average vehicle fuel efficiency among the selected countries,
lagging behind the European countries and China. EVs will be more cost-competitive against less efficient
vehicles. Further work is needed to understand whether a potential EV buyer is more likely to weigh the
purchase of new EVs against keeping an existing, presumably less efficient car, or compare it against the more
efficient new vehicles on the market.73
Figure 7: Average Fuel Economy of New Vehicles Registered, 2011 (Source: IEA)
28.530.4
33.2
38.040.1
41.443.1 43.6 43.9
0
5
10
15
20
25
30
35
40
45
50
USA China Global Germany UK Spain EU-27 France Denmark
Miles per gallon
Electric Vehicle Grid Integration in the U.S., Europe, and China Page | 18
Existing Electrical Generation, Transmission, and Distribution Infrastructure
Transmission and Distribution
Electric power in the U.S. and EU is typically transmitted over long distances through high voltage alternating
current (AC) transmission lines, although high voltage direct current (DC) lines have been built in certain
instances, and are capable of transmitting power over longer distances with lower line losses compared to AC
lines. Long-distance HVDC corridors have been proposed in the U.S., EU, and China to bring power from
remotely sited renewable energy sources to load centers. Since the Chinese transmission network is younger
than those in the U.S. and EU, and in certain cases is still being built out to bring remotely-sited wind, hydro,
and coal-fired electricity to load centers, HVDC lines are more common. The Hami-Zhengzhou and Xiluodu-
Western Zhejiang ultra-high voltage DC transmission projects, for example, are under development to bring
power across from western China and Inner Mongolia.
The U.S. has a mature electric power grid operating at a frequency of 60 hertz (Hz). Typical household and
small commercial circuits provide a minimum of 200 amperes (amps) of service, with household electrical
sockets providing either 120 volts (V) or 240 V. Although not all buildings are wired with 240 V outlets, most
up-to-date electrical panels receive sufficient electrical service to allow users to add 240 V outlets
inexpensively.
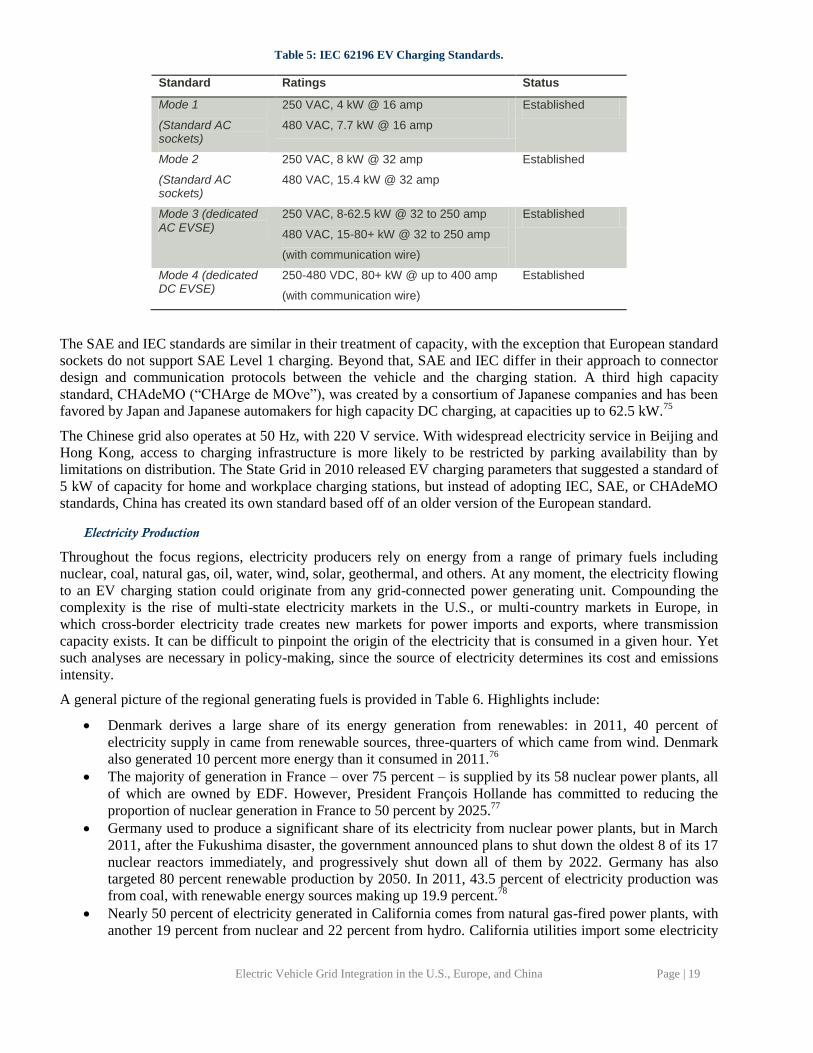
In the U.S., the Society of Automotive Engineers (SAE) has established the SAE J1772 standard for EV
charging, with various finalized and proposed ratings, summarized below.74
Table 4: SAE J1772 EV Charging Standards
Standard Ratings Status of SAE Standard
AC Level 1 120 V, 1.4 kW @ 12 amp
120 V, 1.9 kW @ 16 amp
Established
DC Level 1 200-450 VDC, < 36 kW @ 80 amp Proposed
AC Level 2 240 V, < 19.2 kW @ 80 amp Established
DC Level 2 200-450 VDC, <90 kW @ 200 amp Proposed
AC Level 3 >20 kW Proposed
DC Level 3 200-600 VDC, <240 kW @ 400 amp Proposed
Prevalent U.S. electrical service, therefore, can provide AC Level 1 charging, and in certain cases may be able
to provide up to AC Level 2 charging, with modest electrical work. DC Level 1 and 2 charging, and Level 3
charging, require more significant investments in inverters and other electrical equipment.
Charge times depend on the capacity of the on-board vehicle charger, the state of charge of the battery, and the
size of the battery, but AC charging times range from under 30 minutes to over 17 hours, and for DC charging
from 1.2 hours to less than 10 minutes.
In the EU, the power system operates at 50 Hz and household and commercial outlets are prevalent and deliver
power at 220-240 V. Typical household service in France, Germany, and Spain are served by 400 amp lines,
which would enable widespread use of AC Level 2 charging. The International Electrotechnical Commission
(IEC) oversees standard-setting for the European market, and has been developing IEC 62196 for electric
vehicle charging, as follows:
Electric Vehicle Grid Integration in the U.S., Europe, and China Page | 19
Table 5: IEC 62196 EV Charging Standards.
Standard Ratings Status
Mode 1
(Standard AC sockets)
250 VAC, 4 kW @ 16 amp
480 VAC, 7.7 kW @ 16 amp
Established
Mode 2
(Standard AC sockets)
250 VAC, 8 kW @ 32 amp
480 VAC, 15.4 kW @ 32 amp
Established
Mode 3 (dedicated AC EVSE)
250 VAC, 8-62.5 kW @ 32 to 250 amp
480 VAC, 15-80+ kW @ 32 to 250 amp
(with communication wire)
Established
Mode 4 (dedicated DC EVSE)
250-480 VDC, 80+ kW @ up to 400 amp
(with communication wire)
Established
The SAE and IEC standards are similar in their treatment of capacity, with the exception that European standard
sockets do not support SAE Level 1 charging. Beyond that, SAE and IEC differ in their approach to connector
design and communication protocols between the vehicle and the charging station. A third high capacity
standard, CHAdeMO (“CHArge de MOve”), was created by a consortium of Japanese companies and has been
favored by Japan and Japanese automakers for high capacity DC charging, at capacities up to 62.5 kW.75
The Chinese grid also operates at 50 Hz, with 220 V service. With widespread electricity service in Beijing and
Hong Kong, access to charging infrastructure is more likely to be restricted by parking availability than by
limitations on distribution. The State Grid in 2010 released EV charging parameters that suggested a standard of
5 kW of capacity for home and workplace charging stations, but instead of adopting IEC, SAE, or CHAdeMO
standards, China has created its own standard based off of an older version of the European standard.
Electricity Production
Throughout the focus regions, electricity producers rely on energy from a range of primary fuels including
nuclear, coal, natural gas, oil, water, wind, solar, geothermal, and others. At any moment, the electricity flowing
to an EV charging station could originate from any grid-connected power generating unit. Compounding the
complexity is the rise of multi-state electricity markets in the U.S., or multi-country markets in Europe, in
which cross-border electricity trade creates new markets for power imports and exports, where transmission
capacity exists. It can be difficult to pinpoint the origin of the electricity that is consumed in a given hour. Yet
such analyses are necessary in policy-making, since the source of electricity determines its cost and emissions
intensity.
A general picture of the regional generating fuels is provided in Table 6. Highlights include:
Denmark derives a large share of its energy generation from renewables: in 2011, 40 percent of
electricity supply in came from renewable sources, three-quarters of which came from wind. Denmark
also generated 10 percent more energy than it consumed in 2011.76
The majority of generation in France – over 75 percent – is supplied by its 58 nuclear power plants, all
of which are owned by EDF. However, President François Hollande has committed to reducing the
proportion of nuclear generation in France to 50 percent by 2025.77
Germany used to produce a significant share of its electricity from nuclear power plants, but in March
2011, after the Fukushima disaster, the government announced plans to shut down the oldest 8 of its 17
nuclear reactors immediately, and progressively shut down all of them by 2022. Germany has also
targeted 80 percent renewable production by 2050. In 2011, 43.5 percent of electricity production was
from coal, with renewable energy sources making up 19.9 percent.78
Nearly 50 percent of electricity generated in California comes from natural gas-fired power plants, with
another 19 percent from nuclear and 22 percent from hydro. California utilities import some electricity
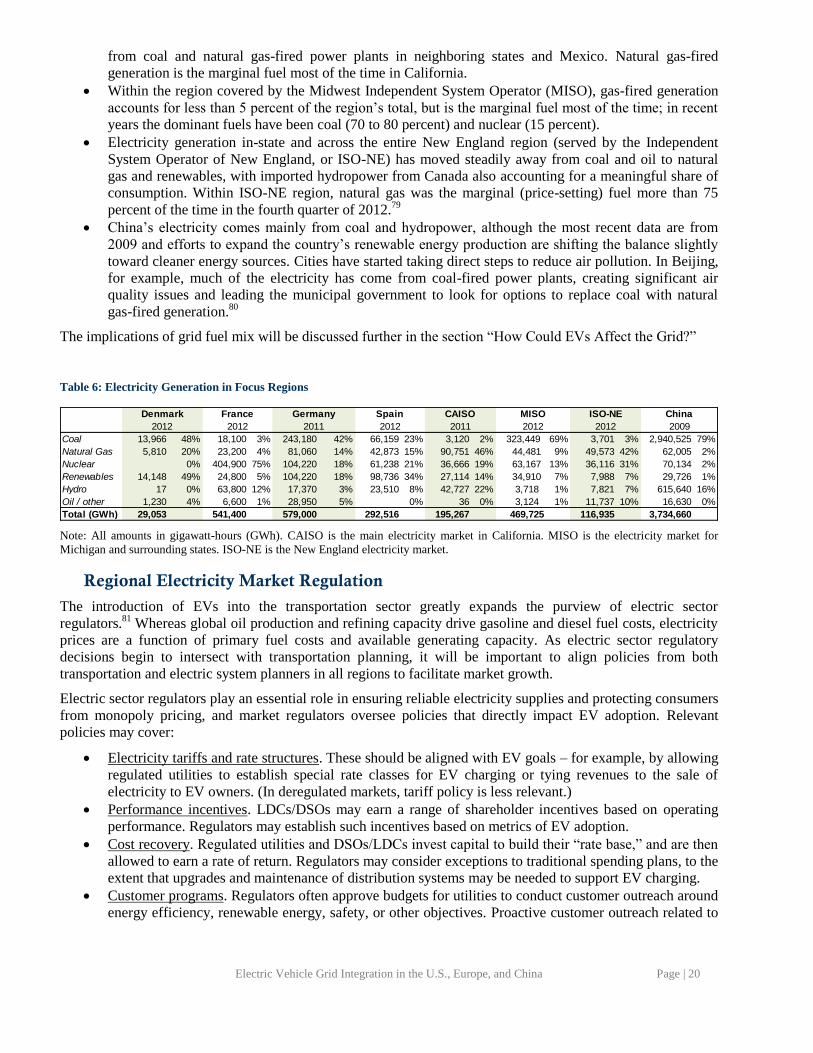
Electric Vehicle Grid Integration in the U.S., Europe, and China Page | 20
from coal and natural gas-fired power plants in neighboring states and Mexico. Natural gas-fired
generation is the marginal fuel most of the time in California.
Within the region covered by the Midwest Independent System Operator (MISO), gas-fired generation
accounts for less than 5 percent of the region’s total, but is the marginal fuel most of the time; in recent
years the dominant fuels have been coal (70 to 80 percent) and nuclear (15 percent).
Electricity generation in-state and across the entire New England region (served by the Independent
System Operator of New England, or ISO-NE) has moved steadily away from coal and oil to natural
gas and renewables, with imported hydropower from Canada also accounting for a meaningful share of
consumption. Within ISO-NE region, natural gas was the marginal (price-setting) fuel more than 75
percent of the time in the fourth quarter of 2012.79
China’s electricity comes mainly from coal and hydropower, although the most recent data are from
2009 and efforts to expand the country’s renewable energy production are shifting the balance slightly
toward cleaner energy sources. Cities have started taking direct steps to reduce air pollution. In Beijing,
for example, much of the electricity has come from coal-fired power plants, creating significant air
quality issues and leading the municipal government to look for options to replace coal with natural
gas-fired generation.80
The implications of grid fuel mix will be discussed further in the section “How Could EVs Affect the Grid?”
Table 6: Electricity Generation in Focus Regions
Note: All amounts in gigawatt-hours (GWh). CAISO is the main electricity market in California. MISO is the electricity market for
Michigan and surrounding states. ISO-NE is the New England electricity market.
Regional Electricity Market Regulation
The introduction of EVs into the transportation sector greatly expands the purview of electric sector
regulators.81
Whereas global oil production and refining capacity drive gasoline and diesel fuel costs, electricity
prices are a function of primary fuel costs and available generating capacity. As electric sector regulatory
decisions begin to intersect with transportation planning, it will be important to align policies from both
transportation and electric system planners in all regions to facilitate market growth.
Electric sector regulators play an essential role in ensuring reliable electricity supplies and protecting consumers
from monopoly pricing, and market regulators oversee policies that directly impact EV adoption. Relevant
policies may cover:
Electricity tariffs and rate structures. These should be aligned with EV goals – for example, by allowing
regulated utilities to establish special rate classes for EV charging or tying revenues to the sale of
electricity to EV owners. (In deregulated markets, tariff policy is less relevant.)
Performance incentives. LDCs/DSOs may earn a range of shareholder incentives based on operating
performance. Regulators may establish such incentives based on metrics of EV adoption.
Cost recovery. Regulated utilities and DSOs/LDCs invest capital to build their “rate base,” and are then
allowed to earn a rate of return. Regulators may consider exceptions to traditional spending plans, to the
extent that upgrades and maintenance of distribution systems may be needed to support EV charging.
Customer programs. Regulators often approve budgets for utilities to conduct customer outreach around
energy efficiency, renewable energy, safety, or other objectives. Proactive customer outreach related to
Coal 13,966 48% 18,100 3% 243,180 42% 66,159 23% 3,120 2% 323,449 69% 3,701 3% 2,940,525 79%
Natural Gas 5,810 20% 23,200 4% 81,060 14% 42,873 15% 90,751 46% 44,481 9% 49,573 42% 62,005 2%
Nuclear 0% 404,900 75% 104,220 18% 61,238 21% 36,666 19% 63,167 13% 36,116 31% 70,134 2%
Renewables 14,148 49% 24,800 5% 104,220 18% 98,736 34% 27,114 14% 34,910 7% 7,988 7% 29,726 1%
Hydro 17 0% 63,800 12% 17,370 3% 23,510 8% 42,727 22% 3,718 1% 7,821 7% 615,640 16%
Oil / other 1,230 4% 6,600 1% 28,950 5% 0% 36 0% 3,124 1% 11,737 10% 16,630 0%
Total (GWh) 29,053 541,400 579,000 292,516 195,267 469,725 116,935 3,734,660
Denmark France Germany Spain China
2012 2012 2011 2012 2011 2009
CAISO MISO ISO-NE
2012 2012
Electric Vehicle Grid Integration in the U.S., Europe, and China Page | 21
EVs may be expected by customers, who expect guidance from their electricity retailer on how to set up
charging infrastructure and sign up for the appropriate rate class82
Each region operates in a unique electricity market, with different rules for pricing and trading energy and
generating capacity. Moreover, the electric sector itself is in a state of flux. Grid operators are increasingly
asked to integrate distributed generation, demand response, and other non-traditional resources into their
planning and operations. This has forced changes to corporate structures, strategies, and business models.
Efforts to develop new EV-centric policies will need to be undertaken against this dynamic landscape.
It is incumbent on electric sector regulators to launch efforts to understand their new role in shaping
transportation strategy. The authorities of regional electricity market regulators have a bearing on how much
regulators, LDCs/DSOs, and retailers can influence EV buyers and charging behavior. To that end, this section
provides an overview of regulatory regimes and market structures in the focus regions.
United States
Given the interstate nature of electricity markets and transmission, regulation of the electric sector is carried out
through a collection of local, state, regional, and federal entities. Transmission and generation providers that
transmit or sell wholesale electricity in interstate markets are subject to oversight by the Federal Energy
Regulatory Commission (FERC). The main objectives of the FERC are to “(1) Ensure that rates, terms and
conditions are just, reasonable and not unduly discriminatory or preferential, and (2) Promote the development
of safe, reliable and efficient energy infrastructure that serves the public interest.”83
Regional grid operations in
regulated markets are managed by vertically integrated utilities, who run power plants, own power lines, and
manage retail sales and distribution to customers. In deregulated markets, Regional Transmission Organizations
(RTOs) oversee power markets in which “bulk,” or wholesale, power is centrally procured from generators and
distributed to customers by local distribution companies (LDCs). In some cases, competitive energy suppliers
sell energy directly to customers. Wholesale power prices are a function of demand on the system and the
marginal costs of available supply. Retail prices are overseen by public utility commissions (PUCs), but in
deregulated markets, energy prices are set by competitive suppliers.
Beyond the FERC and PUCs, numerous entities are responsible for the complex process of ensuring reliability
standards are met. As an example, in New York State, the institutions that are responsible for assuring resource
adequacy include the New York State Reliability Council (NYSRC), the Northeast Power Coordinating Council
(NPCC), the North American Electric Reliability Corporation (NERC), the New York Independent System
Operator (ISO), the NYPSC, and the FERC. Although this regulatory and oversight framework is complex, in
most cases these entities would be responsible for anticipating greater system load as a result of greater EV
penetration, and determining appropriate ways to address potential reliability issues, as opposed to setting EV
policies directly. Most of the policy work is in the hands of state public utility commissions (PUC).
Fourteen states in the U.S. have established some form of “decoupled” rate structure. This means that PUCs
have established, or at least agreed to consider, compensation mechanisms that separate revenues from
electricity sales volumes. This key distinction holds true in all three of the focus states (CA, MI, and MA).
Likewise, some PUCs have issued rulings that specify whether utilities are allowed to own EV charging
infrastructure. At one end of the spectrum, utilities may be allowed to install and own charging stations, earn
kWh-based revenues, set electricity rates, charge customers to install smart meters, and potentially provide
other services. On the other end, a PUC may decide that an LDC should be prevented from doing anything other
than managing the distribution network.
California
Nearly California’s entire electric grid is managed by the California Independent System Operator (CAISO),
which oversees grid operations and reliability, in addition to running the electricity markets where LSEs procure
electric power. As in all U.S. states, CAISO is just one of numerous groups responsible for maintaining reliable
access to power. The California Public Utilities Commission (CPUC) manages the state’s largest regulated
electric utilities: Pacific Gas & Electric serves most of the northern two-thirds of the state, while Southern
California Edison and San Diego Gas & Electric serve the other third. About 40 publicly-owned utilities serve
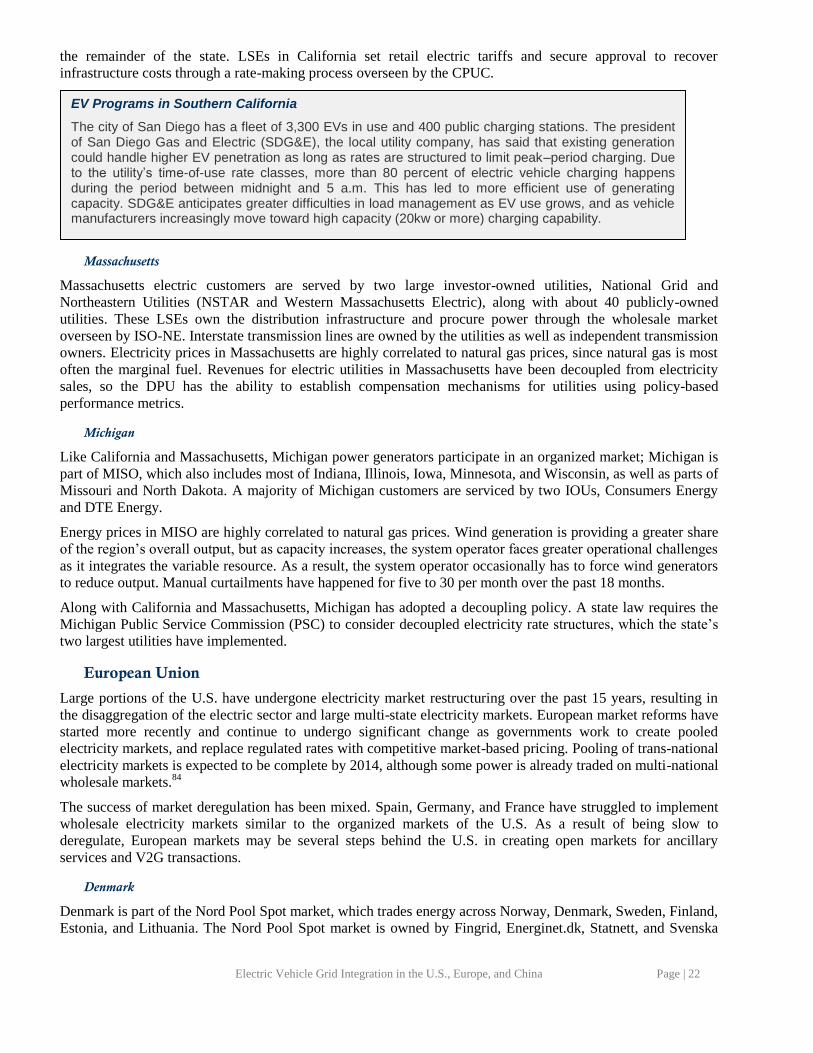
Electric Vehicle Grid Integration in the U.S., Europe, and China Page | 22
the remainder of the state. LSEs in California set retail electric tariffs and secure approval to recover
infrastructure costs through a rate-making process overseen by the CPUC.
Massachusetts
Massachusetts electric customers are served by two large investor-owned utilities, National Grid and
Northeastern Utilities (NSTAR and Western Massachusetts Electric), along with about 40 publicly-owned
utilities. These LSEs own the distribution infrastructure and procure power through the wholesale market
overseen by ISO-NE. Interstate transmission lines are owned by the utilities as well as independent transmission
owners. Electricity prices in Massachusetts are highly correlated to natural gas prices, since natural gas is most
often the marginal fuel. Revenues for electric utilities in Massachusetts have been decoupled from electricity
sales, so the DPU has the ability to establish compensation mechanisms for utilities using policy-based
performance metrics.
Michigan
Like California and Massachusetts, Michigan power generators participate in an organized market; Michigan is
part of MISO, which also includes most of Indiana, Illinois, Iowa, Minnesota, and Wisconsin, as well as parts of
Missouri and North Dakota. A majority of Michigan customers are serviced by two IOUs, Consumers Energy
and DTE Energy.
Energy prices in MISO are highly correlated to natural gas prices. Wind generation is providing a greater share
of the region’s overall output, but as capacity increases, the system operator faces greater operational challenges
as it integrates the variable resource. As a result, the system operator occasionally has to force wind generators
to reduce output. Manual curtailments have happened for five to 30 per month over the past 18 months.
Along with California and Massachusetts, Michigan has adopted a decoupling policy. A state law requires the
Michigan Public Service Commission (PSC) to consider decoupled electricity rate structures, which the state’s
two largest utilities have implemented.
European Union
Large portions of the U.S. have undergone electricity market restructuring over the past 15 years, resulting in
the disaggregation of the electric sector and large multi-state electricity markets. European market reforms have
started more recently and continue to undergo significant change as governments work to create pooled
electricity markets, and replace regulated rates with competitive market-based pricing. Pooling of trans-national
electricity markets is expected to be complete by 2014, although some power is already traded on multi-national
wholesale markets.84
The success of market deregulation has been mixed. Spain, Germany, and France have struggled to implement
wholesale electricity markets similar to the organized markets of the U.S. As a result of being slow to
deregulate, European markets may be several steps behind the U.S. in creating open markets for ancillary
services and V2G transactions.
Denmark
Denmark is part of the Nord Pool Spot market, which trades energy across Norway, Denmark, Sweden, Finland,
Estonia, and Lithuania. The Nord Pool Spot market is owned by Fingrid, Energinet.dk, Statnett, and Svenska
EV Programs in Southern California
The city of San Diego has a fleet of 3,300 EVs in use and 400 public charging stations. The president of San Diego Gas and Electric (SDG&E), the local utility company, has said that existing generation could handle higher EV penetration as long as rates are structured to limit peak–period charging. Due to the utility’s time-of-use rate classes, more than 80 percent of electric vehicle charging happens during the period between midnight and 5 a.m. This has led to more efficient use of generating capacity. SDG&E anticipates greater difficulties in load management as EV use grows, and as vehicle manufacturers increasingly move toward high capacity (20kw or more) charging capability.
Electric Vehicle Grid Integration in the U.S., Europe, and China Page | 23
Kraftnät, the state-owned transmission organizations in Finland, Denmark, Norway, and Sweden, respectively.
Energinet.dk, the Transmission Service Operator within Denmark, is run under the Danish Ministry of Climate,
Energy and Building, and operates the 400 kV transmission grid, as well as (beginning in 2012) the 132-150 kV
grid.85
Electric distribution is controlled by over 90 DSOs,86
whose tariffs are set annually, based on a revenue
cap determined by the Danish Energy Regulatory Authority. These DSOs are fully unbundled, meaning that
they provide transmission services but do not earn profits on energy sales. This is similar to deregulated market
structures in the U.S.
Full retail customer choice was introduced in 2003, allowing customers to choose their energy suppliers as they
can in deregulated regions of the U.S. As of 2009, however, only 6 percent of residential and small business
customers had switched from their default supplier.87 Electricity prices in Denmark are the highest in the EU;
they also have the highest proportion of electricity prices made up of taxes, with 55.8 percent of the electric bill
consisting of VAT, taxes and levies.88
France
The French electricity market was run by state-owned monopoly Electricité de France (EDF) until 2000, when
the nation adopted European Union directives on deregulation. EDF is now a private corporation, although the
state remains a majority shareholder. Deregulation of the electricity market began in 2000, with legislative
action to remove obstacles to electricity competition. The effect of deregulation has been muted, however, and
competitive markets have been slow to take hold. EDF remains the dominant electric sector market player:
retail customers can choose their electricity suppliers, but the vast majority of residential customers have
remained with EDF. The transmission network is controlled by RTE, and the distribution network is operated
by ERDF, both of which are subsidiaries of EDF.89
France participates in the Central Western Europe wholesale power market, along with Austria, Belgium,
Germany, and the Netherlands. These countries, on average, meet about 25 percent of their total electricity
consumption with power traded on the CWE market.90
Transmission and electricity retail rates are set by the Regulatory Commission of Energy (CRE), an independent
administrative body entrusted with regulation of the country’s electricity and gas markets. The CRE has kept
regulated electricity tariffs artificially low, which protects consumers but discourages new market entrants. Due
to increasing pressure from the European Commission to end government interference in electricity markets,
regulated tariffs are expected to increase over the next several years. A report by the CRE indicates that
consumers should expect a 30 percent increase in the cost of electricity by 2017.91
As a result of current policy, electricity prices in France are below the EU average.
Germany
Germany’s electricity market was deregulated in 1998, with utilities required to unbundle their supply and
distribution operations.92 The country is part of the CWE wholesale market, along with France. The 220 and 380
kV grids are operated in four regions by four different Transmission System Operators: TenneT, Amprion
GmbH, 50Hertz Transmision GmbH, and TransnetBW.93
Customers can choose their electricity supplier, but in
2010, only 15 percent of residential customers had a contract with a supplier other than their default supplier.94
Electric system regulation at the federal level is carried out by the Bundesnetzagentur (Federal Network
Agency), while many other regulatory responsibilities are also held by regulators at the state level. The
Bundesnetzagentur has no jurisdiction over retail electricity rates; end prices for consumers are regulated by the
Land authorities (state regulators).95
Generation is dominated by four vertically integrated utilities: E.ON, RWE, EnBW, and Vattenfall. Although
several of these companies have spun out transmission assets, they continue to own generation and manage
distribution to 65 percent of the country’s retail customers. Municipal utilities also have a strong distribution
presence.96
German electricity prices were the third highest in the EU in 2012.97
The government has tried to address this
by introducing more competition, but deregulation has thus far led only to mergers between power providers,
who then gain greater market power. Installation of renewable energy has depressed wholesale market prices,
Electric Vehicle Grid Integration in the U.S., Europe, and China Page | 24
but does not appear to have helped reduce retail prices, since utilities still need to cover the fixed costs of
underused natural gas and coal plants. In addition, government taxes on electricity are approximately 8.5 cents
(USD) per kWh.
In the early 2000s the German government outlined a series of policy steps for the country’s Energiewende, or
“energy change,” strategy. The goal of this initiative is to transform the country’s economy so that it runs
primarily on renewable energy, by retiring coal and nuclear power plants, deploying widespread energy
efficiency, and building new renewable energy capacity. The goal is for the country’s use of renewable energy
to grow from roughly 20 percent today to 80 percent by 2050, but the plan has been beset by challenges since
the beginning, including resistance to new transmission lines, concern for Germany’s economy, and pressure to
accelerate the retirement of nuclear power plants.98
Spain
The National Energy Commission (CNE) is the regulatory body for the electric sector in Spain. There is one
transmission operator for all of Spain, Red Eléctrica de España (REE), which is partially owned by the
government. Although customer choice was implemented in 2009, the majority of customers still receive their
electricity from default suppliers, whose tariffs are regulated by the government. Spain’s electricity suppliers
have struggled with a so-called “tariff deficit,” in which DSOs have not been able to meet their costs because of
prices being kept artificially low.99
Wholesale prices in Spain are set on the OMEL market, where suppliers
trade electricity in real-time as well as forward transactions.
Electricity distribution is dominated by three companies: Iberdrola, Endesa, and Gas Natural Fenosa, controlling
over 90 percent of electricity distribution as of 2010. These three companies also own the largest shares of
electricity production (46 percent as of 2010).100
In 2012, Spanish electricity prices were close to the EU
average.101
Retail prices have two components – a regulated transmission and distribution charge, and an energy
charge that is determined through auction. The CNE has proposed to freeze the regulated component, in order to
move closer to market-based pricing.102,103
China
Two state-owned grid companies supply all of China’s electricity and control electricity pricing. State Grid
Corporation of China covers the electricity network in 26 provinces in North, West and East China, while the
smaller China Southern Power Grid Company covers the other five southern provinces (Guangdong, Guangxi,
Yunnan, Guizhou, and Hainan). These companies manage high-voltage transmission in addition to local
distribution. Market reforms in 2002 led to the creation of five separate state-owned generation companies.
The Chinese power sector is currently regulated by the State Electricity Regulatory Commission (SERC),
although regulatory reforms underway will dissolve SERC and merge it with the existing National Energy
Administration (NEA), which has provided energy sector strategy, analysis, and oversight since 2008.
Following the merger, the NEA will assume responsibility for market reforms, broad national energy policy,
power projects, and pricing. The NEA is overseen by the National Development and Reform Commission
(NDRC), which acts as a broad overseer of the Chinese economy, and has ultimate control over electricity
prices. In conjunction with SERC/NEA, the NDRC reviews retail rates annually based on changes to the costs
of power generation and the status of generation capacity. Retail prices, adjusted infrequently, are reviewed by
stakeholders, and pricing changes are put through a public hearing process. Prices reflect transmission and
energy costs, as well as a TOU adjustment and adjustments at the local level for congestion costs.104
Regulators
also incorporate interconnection and ancillary services costs, but since prices are regulated, there is no market
for these components. The national government has shown an interest in moving toward market-based
wholesale and retail pricing, and six regional markets (Shanghai, Shandong, Zhejiang, Liaoning, Jilin, and
Heilongjiang) are said to be in the process of implementing market-based retail pricing.105

Electric Vehicle Grid Integration in the U.S., Europe, and China Page | 25
Incentives for EVs: Direct and Indirect Drivers
An array of multi-national, national, state, and city incentives across the regions have stimulated the EV market
by reducing purchase costs, streamlining electricity pricing, lowering charging costs, subsidizing EV
infrastructure, and creating mandates and markets for emission reductions from transportation and electric
power generation. Even amidst the economic slowdown in recent years, governments have demonstrated a
commitment to EVs, by providing financial support for EV purchases, implementing EV electricity pricing
schemes, and encouraging LDCs/DSOs to take an active role in deploying charging station networks.
Some incentives have been designed specifically to promote EVs by providing a catalyst for a potential buyer.
Direct incentives accrue only to EVs, although they may touch many different points along the lifecycle of an
EV, from design and manufacturing to refueling and parking. Indirect incentives have broad objectives, such as
reducing national GHG emissions or addressing urban congestion. Players in the EV value chain must compete
with other potential beneficiaries to take advantage of the economic value created by these indirect incentives.
This section summarizes current incentives and discusses their potential to drive demand for EVs.
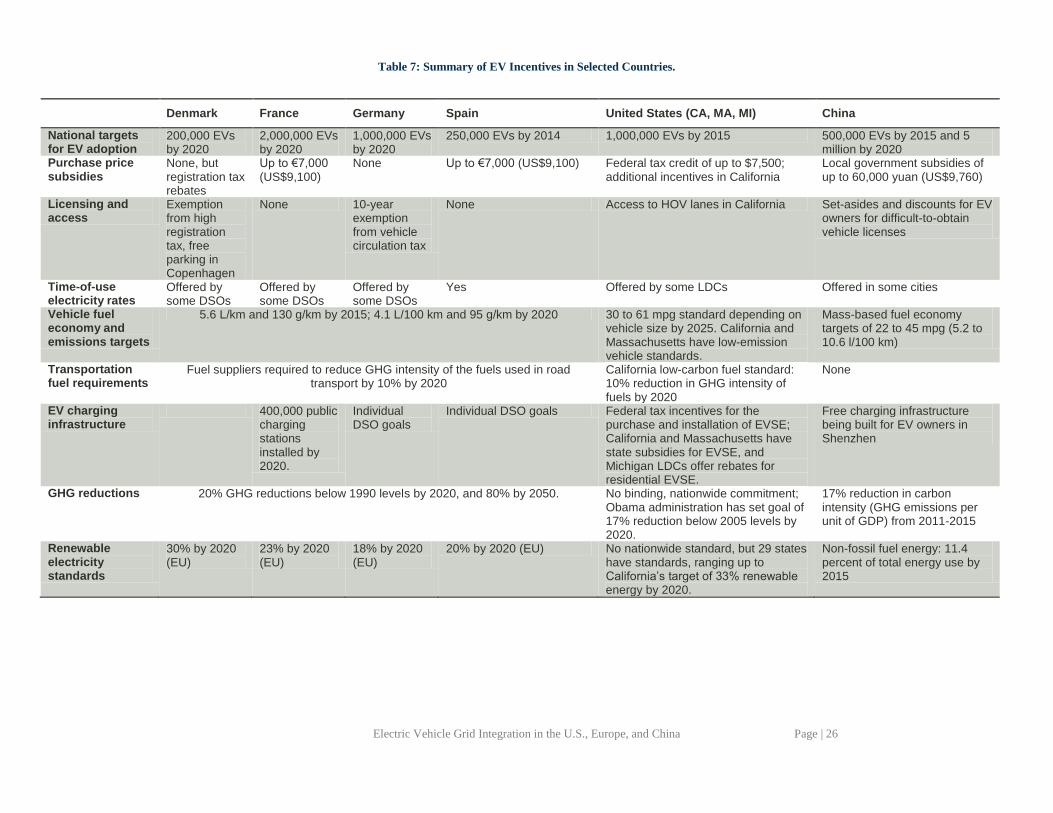
Electric Vehicle Grid Integration in the U.S., Europe, and China Page | 26
Table 7: Summary of EV Incentives in Selected Countries.
Denmark France Germany Spain United States (CA, MA, MI) China
National targets for EV adoption
200,000 EVs by 2020
2,000,000 EVs by 2020
1,000,000 EVs by 2020
250,000 EVs by 2014 1,000,000 EVs by 2015 500,000 EVs by 2015 and 5 million by 2020
Purchase price subsidies
None, but registration tax rebates
Up to €7,000 (US$9,100)
None Up to €7,000 (US$9,100) Federal tax credit of up to $7,500; additional incentives in California
Local government subsidies of up to 60,000 yuan (US$9,760)
Licensing and access
Exemption from high registration tax, free parking in Copenhagen
None 10-year exemption from vehicle circulation tax
None Access to HOV lanes in California Set-asides and discounts for EV owners for difficult-to-obtain vehicle licenses
Time-of-use electricity rates
Offered by some DSOs
Offered by some DSOs
Offered by some DSOs
Yes Offered by some LDCs Offered in some cities
Vehicle fuel economy and emissions targets
5.6 L/km and 130 g/km by 2015; 4.1 L/100 km and 95 g/km by 2020 30 to 61 mpg standard depending on vehicle size by 2025. California and Massachusetts have low-emission vehicle standards.
Mass-based fuel economy targets of 22 to 45 mpg (5.2 to 10.6 l/100 km)
Transportation fuel requirements
Fuel suppliers required to reduce GHG intensity of the fuels used in road transport by 10% by 2020
California low-carbon fuel standard: 10% reduction in GHG intensity of fuels by 2020
None
EV charging infrastructure
400,000 public charging stations installed by 2020.
Individual DSO goals
Individual DSO goals Federal tax incentives for the purchase and installation of EVSE; California and Massachusetts have state subsidies for EVSE, and Michigan LDCs offer rebates for residential EVSE.
Free charging infrastructure being built for EV owners in Shenzhen
GHG reductions 20% GHG reductions below 1990 levels by 2020, and 80% by 2050. No binding, nationwide commitment; Obama administration has set goal of 17% reduction below 2005 levels by 2020.
17% reduction in carbon intensity (GHG emissions per unit of GDP) from 2011-2015
Renewable electricity standards
30% by 2020 (EU)
23% by 2020 (EU)
18% by 2020 (EU)
20% by 2020 (EU) No nationwide standard, but 29 states have standards, ranging up to California’s target of 33% renewable energy by 2020.
Non-fossil fuel energy: 11.4 percent of total energy use by 2015
Electric Vehicle Grid Integration in the U.S., Europe, and China Page | 27
National Targets for EV Adoption
All three regions have established targets for EV registrations. In 2012 the German government declared a goal
of having one million EVs registered by 2020. Spain has set a goal of 250,000 electric vehicles on the road by
2014.106
The French government has set a goal of two million EVs by 2020, and has dedicated €50 million in
funding to promoting adoption of electric vehicles.107
Denmark has a goal of 200,000 EVs by 2020, recently
reduced from 400,000.
In the U.S., President Obama declared an American goal of putting one million EVs on the road by 2015. The
number of registered EVs surpassed 100,000 in May 2013, leaving much ground to be covered before the target
is met. Massachusetts and California state governments have taken meaningful steps to promote EV ownership,
since they believe that the transportation sector will play a crucial role in helping achieve their respective GHG
reduction targets.108
China has taken numerous steps to drive EV adoption amidst the ongoing growth of the passenger vehicle
market. In 2011, the Ministry of Science and Technology announced a goal of one million EVs by 2015 and 10
million by 2020, but these targets were later cut in half. Between 2009 and 2011, Chinese buyers purchased
13,000 EVs and PHEVs – more than U.S. sales but well below the run-rate needed to reach the 2015 target.109
National targets are aspirational and provide a rallying cry for subsequent policy initiatives, but alone they are
unenforceable. Enthusiasm in some areas has been tempered by slow EV uptake. In Germany, for example,
consumers bought 2,100 EVs in 2012 – less than 0.1 percent of total car sales. The automobile industry has said
that without additional government subsidies they can only sell 600,000 electric cars by 2020 at best.110
In
China, 20,000 EVs and HEVs were sold in 2011 and 2012, amounting to only four percent of the 2015 target.111
Purchase Price Subsidies
Through tax credits or cash rebates, many governments have decided to subsidize the initial cost of buying an
EV. China has been the most aggressive with this tool, subsidizing both automakers and car buyers. National
subsidies expired in December 2012; as of July 2013 their renewal appears imminent, although the government
has announced its plans to wind down such subsidies by 2020.112
The renewed national subsidies are expected
to be equal in magnitude and to cover purchases in 25 cities.113
Meanwhile, EV buyers can still take advantage
of those provided by local city governments:
Beijing introduced new EV incentives in 2013, including a maximum purchase subsidy of 60,000 yuan
(US$9,750).
Shanghai’s municipal government provides subsidies of up to 30,000 yuan (US$4,900) for PHEVs and
40,000 yuan (US$6,500) for EVs.
The Shenzhen government offers subsidies of up to 30,000 yuan (US$4,900) for PHEVs and 60,000
yuan (US$9,750) for EVs.114
Shenzhen has also invested in a large municipal vehicle EV fleet, which
contains approximately 1,300 electric buses and 700 electric taxis, making it one of the largest
municipal EV fleets in the world.
Buyers can receive up to 10,000 yuan (US$1,600) in subsidies from the Guangzhou city government for
buying an alternative energy vehicle.
While China’s national subsidies are applied equally to qualifying car models regardless of the city the vehicle
is purchased in, local incentives are often designed to favor locally manufactured vehicles. As such, an EV
produced in Shenzhen may fully qualify for Shenzhen’s subsidy, but may not qualify for Shanghai’s local
subsidy. This local protectionism has slowed the development of the PHEV and EV market in various cities and
may contribute to fragmentation of the market.115
The Spanish and French governments both offer incentives of up to €7,000 (US$9,100) for purchases of PHEVs
and EVs.116
The Danish government offers no rebates, but provides generous registration tax rebates. Germany
has opted to forego direct subsidies in favor of government-backed research and development programs.
In the U.S., a federal tax credit for EV purchases offers buyers up to $7,500 toward the cost of a new vehicle.
California also provides vouchers up to $45,000 for EV fleet purchases, and rebates up to $2,500 for individual
EV purchases, subject to program funding limits.
Electric Vehicle Grid Integration in the U.S., Europe, and China Page | 28
Licensing and Access
By creating exemptions to registration fees and permitting quotas, governments can encourage buyers to choose
EVs over ICE vehicles. These incentives are most effective where the alternative involves high fees or taxes, or
high barriers to owning or operating a vehicle.
In China, the Guangzhou government sets aside ten percent of new license plates issued annually (12,000 out of
120,000) for alternative energy vehicles, including EVs. Shanghai buyers are also eligible for a free license
plate, which average 70,000 yuan (US$11,400) at monthly auctions.117
The city has set aside 20,000 license
plates for alternative energy vehicles in 2013.118
Beijing has a strict license plate lottery to limit the number of
vehicles authorized to drive in the city center. The 2013 cap is 240,000 cars, and demand vastly outstrips
supply: in January 2013, over 1.4 million people registered for the lottery, but only around 20,000 license plates
were issued. The city provides a special exemption to EV buyers, making it much easier to obtain a license
plate, but all vehicles driven in the city, including EVs, are subject to use restrictions.119
The Shenzhen
government has considered various licensing and access incentives, including allowing EVs to drivers to use
public bus lanes during rush hour, pay reduced car insurance premiums, or receive free annual maintenance
checks.
In Europe, Denmark offers a substantial incentive for purchasing of EVs through an exemption from the
registration tax on new automobiles, which can be up to 180 percent of the vehicle’s purchase price. Electric
vehicles are exempt from this tax until at least 2015.120
Electric vehicles also are entitled to free parking in
downtown Copenhagen.121
German EV buyers receive a 10-year exemption from vehicle circulation taxes for
EVs registered by 2015.122
In California, EV drivers can use high occupancy vehicle lanes.123
Customized Electricity Pricing
Many electricity regulators have implemented or considered customized pricing of electricity for EV owners.
Some pricing schemes provide discounts to EV owners, while others merely create tiered pricing to reflect,
more accurately, the varied costs of generation over the course of a day (this is known as “time-of-use,” or
TOU, pricing). Discounted pricing provides a direct incentive by lowering charging costs; TOU pricing
provides an incentive to charge at off-peak times of the day, and may lower charging costs, depending on
charging behavior.
Since May 2011, the Spanish government has followed Royal Decree 647/2011, which outlines regulations for
electric vehicle charging services. The rule created a time-of-use (TOU) regulated tariff for residential
customers, with lower rates offered between 1 am and 7 am. The Spanish supplier Iberdrola now offers TOU
rates, as well the ability to subscribe to a green energy electric contract for 100 percent renewable energy.124
Another Spanish supplier, Endesa, also offers TOU rates and charging installation.125,126
In France, EDF offers
all customers an electricity pricing option that has lower rates during off-peak.127
In Germany, RWE offers a
special electricity contract aimed at electric vehicle owners, which offers a 12-month fixed electricity price
guarantee, energy from 100 percent renewable sources, and use of RWE and partners’ public charging
infrastructure.128
Vattenfall offers a similar contract.129
In China, all Beijing electricity customers pay TOU rates with seasonal adjustments.130
Shenzhen EV drivers
can sign up for reduced electricity rates, including off-peak prices of 0.3 yuan (US$0.05) per KWh.
In California, Pacific Gas & Electric provides EV owners the option of taking a tiered residential rate or a
special time of use rate, based on whether or not they have a separately metered charging station. Southern
California Edison offers flat-rate, time-of-use (TOU) pricing for separately-metered charging stations. While
they are encouraged to offer preferential EV pricing, per a 2011 CPUC ruling, LDCs cannot include recharging
infrastructure in their rate base. In Michigan, Consumers Energy and DTE Energy offer reduced off-peak
electricity rates for EV owners.131
Vehicle Fuel Economy and Emission Targets
Policies to increase vehicle fuel economy may help or hurt the prospects of EVs, depending on how they are
written. If vehicle manufacturers can earn credit toward fleet-wide efficiency targets by selling EVs, higher
Electric Vehicle Grid Integration in the U.S., Europe, and China Page | 29
targets may promote innovation in EV technology and subsequent vehicle sales. On the other hand, these
policies will also drive innovation in competing technologies, such as ICEs and other alternatively-fueled
vehicles, such as natural gas and fuel cells.
The U.S. adopted new Corporate Average Fuel Economy (CAFE) standards in 2012, which set fuel economy
standards of 30 to 61 mpg (7.8 to 3.9 l/100 km) in 2025 depending on the size of the vehicle.132
A similar
regulation adopted by the European Parliament in April 2009 stipulates an average fuel economy of 5.6 liters
per 100 km (42 miles per gallon) by 2015. This target drops to 4.1 l/100 km (57.6 mpg) by 2020.133 In GHG
terms, the current EU targets call for average vehicle emissions of 130 g CO2/km, decreasing to 95 g/km by
2020. Both the U.S. and EU consider BEVs to have zero CO2 emissions, and assign extra weight to EVs in the
averaging schemes.
China is in the midst of implementing its Phase III fuel economy targets, which set vehicle mass-based targets
from 22 to 45 mpg (5.2 to 10.6 l/100 km). Current rules target average fuel economy of 6.9 l/100km (34.1 mpg)
by 2015 and 5 l/100km (47 mpg) by 2020.134
California and Massachusetts (in addition to 11 other states) have adopted low-emission vehicle (LEV) rules,
which set emission limits and compliance requirements for new passenger cars, light-duty trucks, and medium-
and heavy-duty vehicles. Both states also have a zero-emission vehicle (ZEV) requirement, which states that
roughly 1 percent of each automaker’s new model year 2012 through 2014 vehicles delivered for sale in the
state produce zero exhaust emissions. That target increases to about 1.3 percent for the 2015 through 2017
model years.135
A total of nine U.S. states have adopted versions of California’s goal to have EVs, PHEVs, and
hydrogen-powered vehicles reach 15 percent of new-car purchases by 2025.
Finally, the Global Fuel Economy Initiative (GFEI), a multi-stakeholder effort to promote gains in fuel
economy, has set a target of improving fuel economy 50 percent by 2050, although global fuel economy gains
are falling short of the levels needed in order to reach the long-term targets.136
Transportation Fuel Requirements
A low carbon fuel standard (LCFS) is a market-based approach to reducing the lifecycle carbon intensity of
transportation fuels, defined as the emissions associated with producing, transporting, distributing, and using the
fuel. A LCFS places the compliance burden on gasoline and diesel fuel providers, who must report the total
volume of fuel they sell and the carbon intensity of the fuels. Fuels with carbon intensity below the standard
generate credits that can be used to offset use of fuels above the standard. At the end of the year, the fuel
provider must show that the fuel intensity of all fuels they provided, averaged together, does not exceed the
standard. An LCFS allows fuel providers to sell and purchase credits. Providers of exclusively low carbon fuels,
such as electricity, can opt in to the program, generate credits, and sell them to fuel providers with high carbon
fuels.
California adopted an LCFS in 2007 as part of its climate change law, AB32. The CA LCFS has been in effect
since 2011 and is designed to reduce the carbon intensity of transportation fuels used in California by an
average of 10 percent by the year 2020. Electric vehicles, as well as other low carbon fuels, can create credits
under the LCFS based on the differential between the standard and the carbon intensity value of electricity.
Carbon intensity of a given fuel is calculated by dividing the delivered carbon intensity by an Energy Economy
Ratio (EER). The EER adjusts the carbon intensity of fuels to reflect differences in energy efficiency among
different types of fuels and vehicles. Without the EER, the carbon intensity of electricity in the California LCFS
is above the standard. With the EER, the carbon intensity of electricity is below the standard.
In Europe, Directive 2009/30/EC was adopted in April 2009 to revise the Fuel Quality Directive. Article 7a
introduced a requirement on fuel suppliers to reduce the GHG intensity of the fuels used in road transport by up
to 10 percent by 2020. This target is made up of: 1) a mandatory 6 percent reduction in the GHG intensity of
fuels by 2020, with optional intermediate indicative targets of two percent by 2014 and four percent by 2017; 2)
an optional additional two percent reduction subject to developments in new technologies such as carbon
capture and storage (CCS); and 3) a further optional two percent reduction to come from the purchase of Clean
Development Mechanism (CDM) credits.
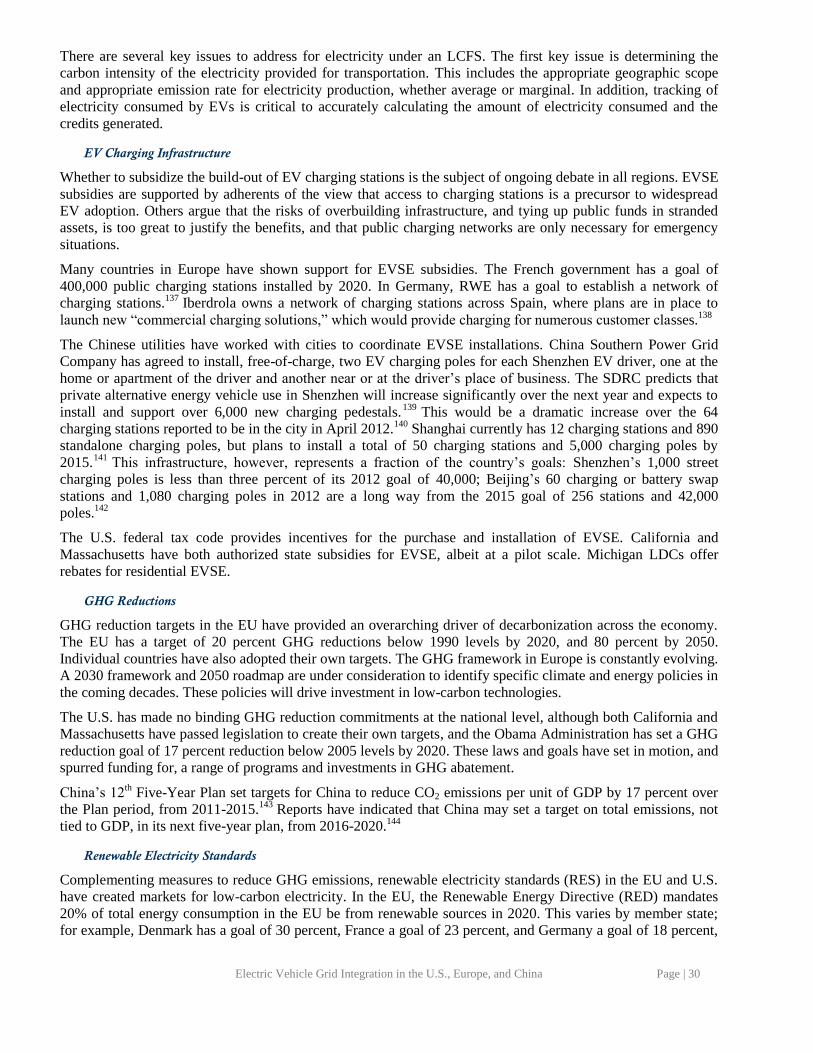
Electric Vehicle Grid Integration in the U.S., Europe, and China Page | 30
There are several key issues to address for electricity under an LCFS. The first key issue is determining the
carbon intensity of the electricity provided for transportation. This includes the appropriate geographic scope
and appropriate emission rate for electricity production, whether average or marginal. In addition, tracking of
electricity consumed by EVs is critical to accurately calculating the amount of electricity consumed and the
credits generated.
EV Charging Infrastructure
Whether to subsidize the build-out of EV charging stations is the subject of ongoing debate in all regions. EVSE
subsidies are supported by adherents of the view that access to charging stations is a precursor to widespread
EV adoption. Others argue that the risks of overbuilding infrastructure, and tying up public funds in stranded
assets, is too great to justify the benefits, and that public charging networks are only necessary for emergency
situations.
Many countries in Europe have shown support for EVSE subsidies. The French government has a goal of
400,000 public charging stations installed by 2020. In Germany, RWE has a goal to establish a network of
charging stations.137
Iberdrola owns a network of charging stations across Spain, where plans are in place to
launch new “commercial charging solutions,” which would provide charging for numerous customer classes.138
The Chinese utilities have worked with cities to coordinate EVSE installations. China Southern Power Grid
Company has agreed to install, free-of-charge, two EV charging poles for each Shenzhen EV driver, one at the
home or apartment of the driver and another near or at the driver’s place of business. The SDRC predicts that
private alternative energy vehicle use in Shenzhen will increase significantly over the next year and expects to
install and support over 6,000 new charging pedestals.139
This would be a dramatic increase over the 64
charging stations reported to be in the city in April 2012.140
Shanghai currently has 12 charging stations and 890
standalone charging poles, but plans to install a total of 50 charging stations and 5,000 charging poles by
2015.141
This infrastructure, however, represents a fraction of the country’s goals: Shenzhen’s 1,000 street
charging poles is less than three percent of its 2012 goal of 40,000; Beijing’s 60 charging or battery swap
stations and 1,080 charging poles in 2012 are a long way from the 2015 goal of 256 stations and 42,000
poles.142
The U.S. federal tax code provides incentives for the purchase and installation of EVSE. California and
Massachusetts have both authorized state subsidies for EVSE, albeit at a pilot scale. Michigan LDCs offer
rebates for residential EVSE.
GHG Reductions
GHG reduction targets in the EU have provided an overarching driver of decarbonization across the economy.
The EU has a target of 20 percent GHG reductions below 1990 levels by 2020, and 80 percent by 2050.
Individual countries have also adopted their own targets. The GHG framework in Europe is constantly evolving.
A 2030 framework and 2050 roadmap are under consideration to identify specific climate and energy policies in
the coming decades. These policies will drive investment in low-carbon technologies.
The U.S. has made no binding GHG reduction commitments at the national level, although both California and
Massachusetts have passed legislation to create their own targets, and the Obama Administration has set a GHG
reduction goal of 17 percent reduction below 2005 levels by 2020. These laws and goals have set in motion, and
spurred funding for, a range of programs and investments in GHG abatement.
China’s 12th Five-Year Plan set targets for China to reduce CO2 emissions per unit of GDP by 17 percent over
the Plan period, from 2011-2015.143
Reports have indicated that China may set a target on total emissions, not
tied to GDP, in its next five-year plan, from 2016-2020.144
Renewable Electricity Standards
Complementing measures to reduce GHG emissions, renewable electricity standards (RES) in the EU and U.S.
have created markets for low-carbon electricity. In the EU, the Renewable Energy Directive (RED) mandates
20% of total energy consumption in the EU be from renewable sources in 2020. This varies by member state;
for example, Denmark has a goal of 30 percent, France a goal of 23 percent, and Germany a goal of 18 percent,
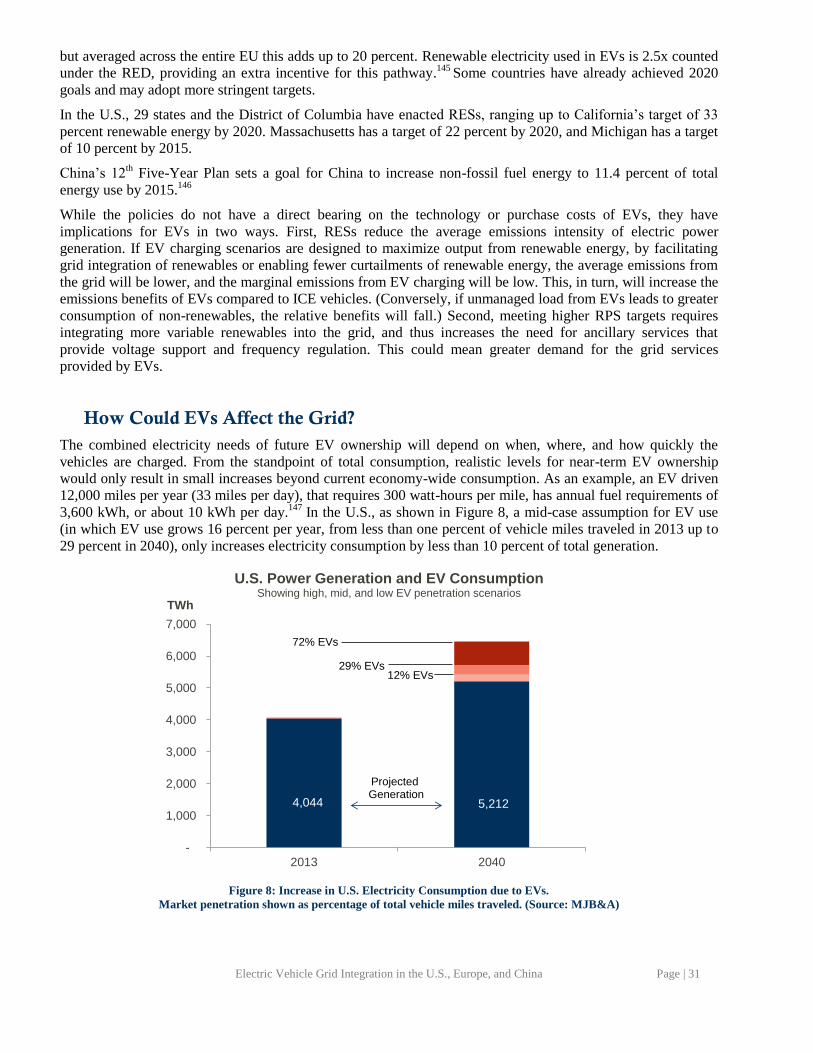
Electric Vehicle Grid Integration in the U.S., Europe, and China Page | 31
but averaged across the entire EU this adds up to 20 percent. Renewable electricity used in EVs is 2.5x counted
under the RED, providing an extra incentive for this pathway.145
Some countries have already achieved 2020
goals and may adopt more stringent targets.
In the U.S., 29 states and the District of Columbia have enacted RESs, ranging up to California’s target of 33
percent renewable energy by 2020. Massachusetts has a target of 22 percent by 2020, and Michigan has a target
of 10 percent by 2015.
China’s 12th Five-Year Plan sets a goal for China to increase non-fossil fuel energy to 11.4 percent of total
energy use by 2015.146
While the policies do not have a direct bearing on the technology or purchase costs of EVs, they have
implications for EVs in two ways. First, RESs reduce the average emissions intensity of electric power
generation. If EV charging scenarios are designed to maximize output from renewable energy, by facilitating
grid integration of renewables or enabling fewer curtailments of renewable energy, the average emissions from
the grid will be lower, and the marginal emissions from EV charging will be low. This, in turn, will increase the
emissions benefits of EVs compared to ICE vehicles. (Conversely, if unmanaged load from EVs leads to greater
consumption of non-renewables, the relative benefits will fall.) Second, meeting higher RPS targets requires
integrating more variable renewables into the grid, and thus increases the need for ancillary services that
provide voltage support and frequency regulation. This could mean greater demand for the grid services
provided by EVs.
How Could EVs Affect the Grid?
The combined electricity needs of future EV ownership will depend on when, where, and how quickly the
vehicles are charged. From the standpoint of total consumption, realistic levels for near-term EV ownership
would only result in small increases beyond current economy-wide consumption. As an example, an EV driven
12,000 miles per year (33 miles per day), that requires 300 watt-hours per mile, has annual fuel requirements of
3,600 kWh, or about 10 kWh per day.147
In the U.S., as shown in Figure 8, a mid-case assumption for EV use
(in which EV use grows 16 percent per year, from less than one percent of vehicle miles traveled in 2013 up to
29 percent in 2040), only increases electricity consumption by less than 10 percent of total generation.
Figure 8: Increase in U.S. Electricity Consumption due to EVs.
Market penetration shown as percentage of total vehicle miles traveled. (Source: MJB&A)
4,044 5,212
-
1,000
2,000
3,000
4,000
5,000
6,000
7,000
2013 2040
TWh
U.S. Power Generation and EV ConsumptionShowing high, mid, and low EV penetration scenarios
12% EVs29% EVs
72% EVs
Projected Generation
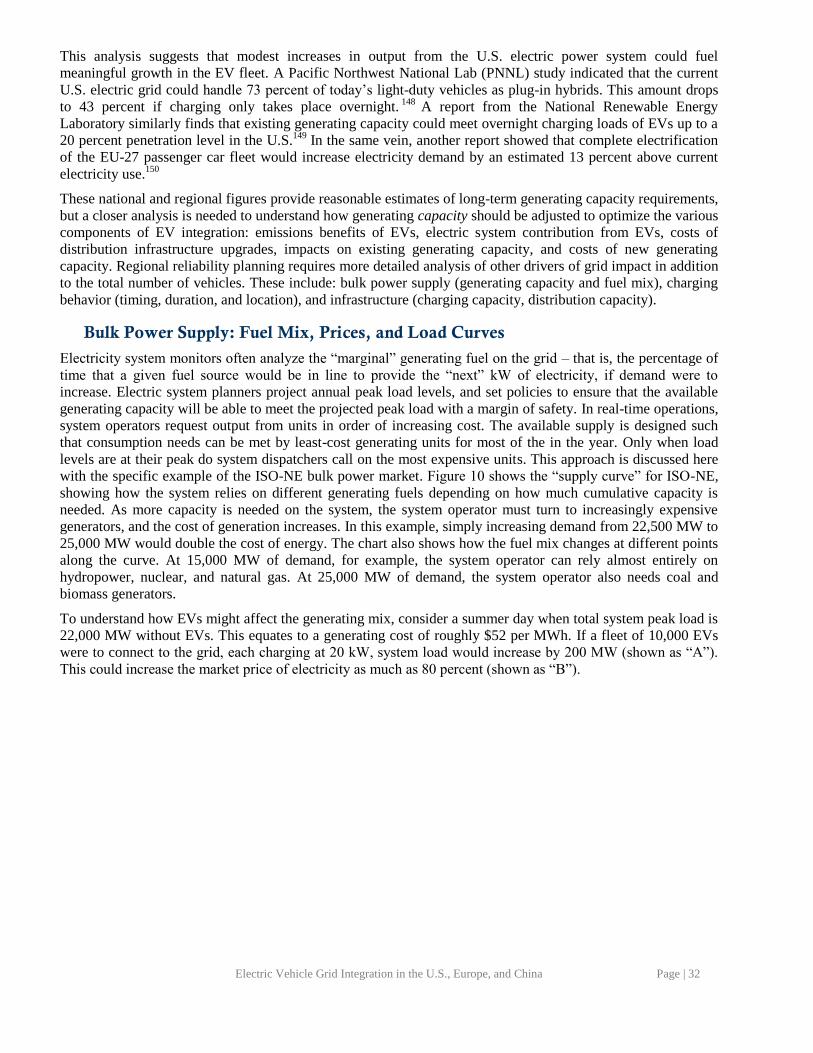
Electric Vehicle Grid Integration in the U.S., Europe, and China Page | 32
This analysis suggests that modest increases in output from the U.S. electric power system could fuel
meaningful growth in the EV fleet. A Pacific Northwest National Lab (PNNL) study indicated that the current
U.S. electric grid could handle 73 percent of today’s light-duty vehicles as plug-in hybrids. This amount drops
to 43 percent if charging only takes place overnight.148
A report from the National Renewable Energy
Laboratory similarly finds that existing generating capacity could meet overnight charging loads of EVs up to a
20 percent penetration level in the U.S.149
In the same vein, another report showed that complete electrification
of the EU-27 passenger car fleet would increase electricity demand by an estimated 13 percent above current
electricity use.150
These national and regional figures provide reasonable estimates of long-term generating capacity requirements,
but a closer analysis is needed to understand how generating capacity should be adjusted to optimize the various
components of EV integration: emissions benefits of EVs, electric system contribution from EVs, costs of
distribution infrastructure upgrades, impacts on existing generating capacity, and costs of new generating
capacity. Regional reliability planning requires more detailed analysis of other drivers of grid impact in addition
to the total number of vehicles. These include: bulk power supply (generating capacity and fuel mix), charging
behavior (timing, duration, and location), and infrastructure (charging capacity, distribution capacity).
Bulk Power Supply: Fuel Mix, Prices, and Load Curves
Electricity system monitors often analyze the “marginal” generating fuel on the grid – that is, the percentage of
time that a given fuel source would be in line to provide the “next” kW of electricity, if demand were to
increase. Electric system planners project annual peak load levels, and set policies to ensure that the available
generating capacity will be able to meet the projected peak load with a margin of safety. In real-time operations,
system operators request output from units in order of increasing cost. The available supply is designed such
that consumption needs can be met by least-cost generating units for most of the in the year. Only when load
levels are at their peak do system dispatchers call on the most expensive units. This approach is discussed here
with the specific example of the ISO-NE bulk power market. Figure 10 shows the “supply curve” for ISO-NE,
showing how the system relies on different generating fuels depending on how much cumulative capacity is
needed. As more capacity is needed on the system, the system operator must turn to increasingly expensive
generators, and the cost of generation increases. In this example, simply increasing demand from 22,500 MW to
25,000 MW would double the cost of energy. The chart also shows how the fuel mix changes at different points
along the curve. At 15,000 MW of demand, for example, the system operator can rely almost entirely on
hydropower, nuclear, and natural gas. At 25,000 MW of demand, the system operator also needs coal and
biomass generators.
To understand how EVs might affect the generating mix, consider a summer day when total system peak load is
22,000 MW without EVs. This equates to a generating cost of roughly $52 per MWh. If a fleet of 10,000 EVs
were to connect to the grid, each charging at 20 kW, system load would increase by 200 MW (shown as “A”).
This could increase the market price of electricity as much as 80 percent (shown as “B”).
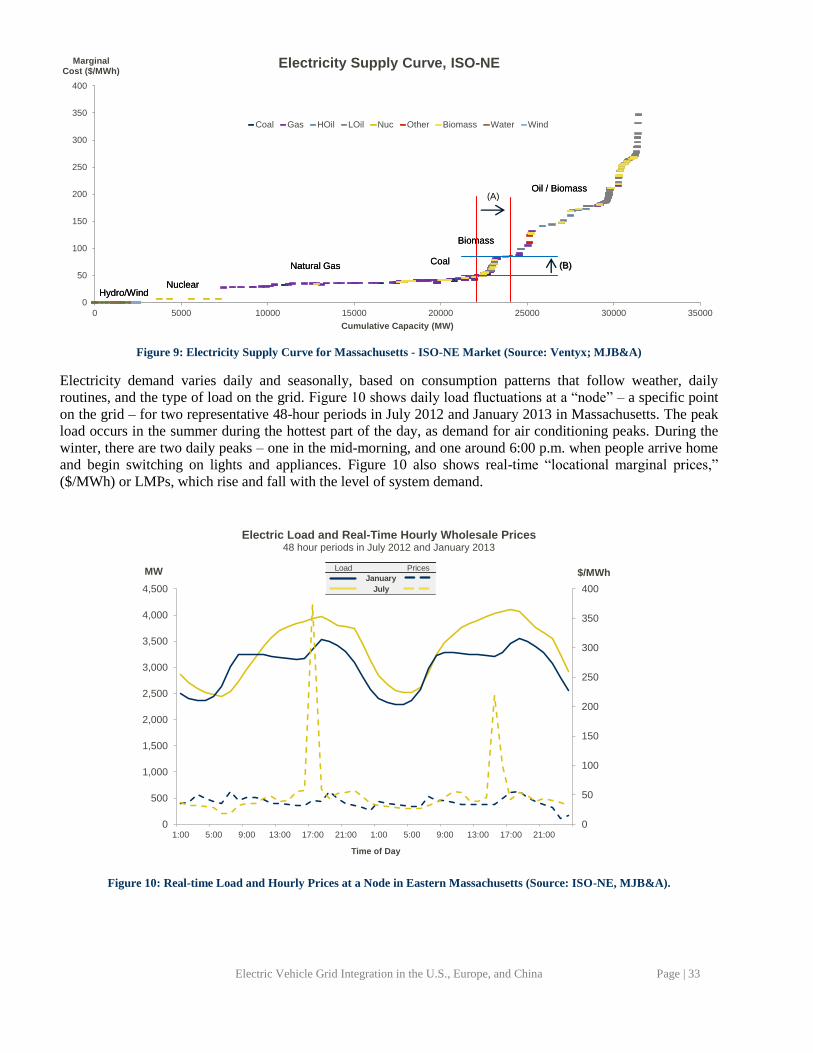
Electric Vehicle Grid Integration in the U.S., Europe, and China Page | 33
Figure 9: Electricity Supply Curve for Massachusetts - ISO-NE Market (Source: Ventyx; MJB&A)
Electricity demand varies daily and seasonally, based on consumption patterns that follow weather, daily
routines, and the type of load on the grid. Figure 10 shows daily load fluctuations at a “node” – a specific point
on the grid – for two representative 48-hour periods in July 2012 and January 2013 in Massachusetts. The peak
load occurs in the summer during the hottest part of the day, as demand for air conditioning peaks. During the
winter, there are two daily peaks – one in the mid-morning, and one around 6:00 p.m. when people arrive home
and begin switching on lights and appliances. Figure 10 also shows real-time “locational marginal prices,”
($/MWh) or LMPs, which rise and fall with the level of system demand.
Figure 10: Real-time Load and Hourly Prices at a Node in Eastern Massachusetts (Source: ISO-NE, MJB&A).
0
50
100
150
200
250
300
350
400
0 5000 10000 15000 20000 25000 30000 35000
MarginalCost ($/MWh)
Cumulative Capacity (MW)
Electricity Supply Curve, ISO-NE
Coal Gas HOil LOil Nuc Other Biomass Water Wind
Hydro/WindNuclear
Natural Gas
Biomass
Coal
Oil / Biomass
Hydro/WindNuclear
Natural Gas
Biomass
Coal
Oil / Biomass
0
50
100
150
200
250
300
350
400
0
500
1,000
1,500
2,000
2,500
3,000
3,500
4,000
4,500
1:00 5:00 9:00 13:00 17:00 21:00 1:00 5:00 9:00 13:00 17:00 21:00
$/MWhMW
Time of Day
Electric Load and Real-Time Hourly Wholesale Prices48 hour periods in July 2012 and January 2013
Load Prices
January
July
(A)
(B) (B)
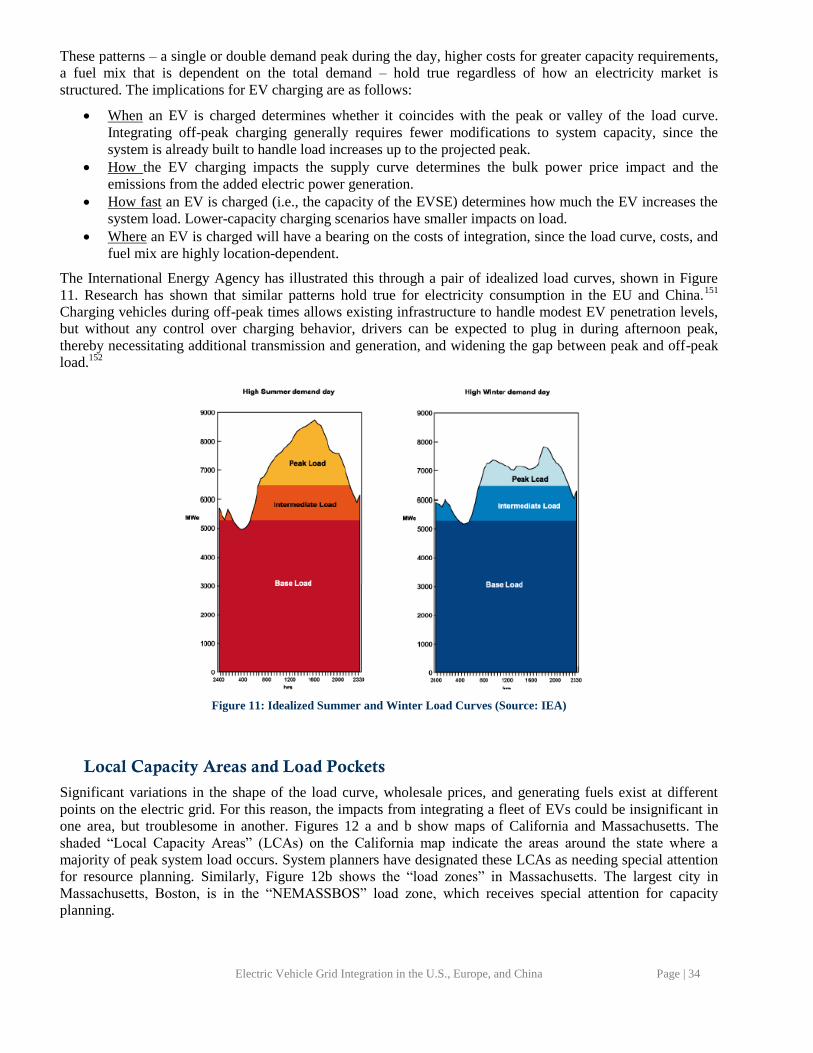
Electric Vehicle Grid Integration in the U.S., Europe, and China Page | 34
These patterns – a single or double demand peak during the day, higher costs for greater capacity requirements,
a fuel mix that is dependent on the total demand – hold true regardless of how an electricity market is
structured. The implications for EV charging are as follows:
When an EV is charged determines whether it coincides with the peak or valley of the load curve.
Integrating off-peak charging generally requires fewer modifications to system capacity, since the
system is already built to handle load increases up to the projected peak.
How the EV charging impacts the supply curve determines the bulk power price impact and the
emissions from the added electric power generation.
How fast an EV is charged (i.e., the capacity of the EVSE) determines how much the EV increases the
system load. Lower-capacity charging scenarios have smaller impacts on load.
Where an EV is charged will have a bearing on the costs of integration, since the load curve, costs, and
fuel mix are highly location-dependent.
The International Energy Agency has illustrated this through a pair of idealized load curves, shown in Figure
11. Research has shown that similar patterns hold true for electricity consumption in the EU and China.151
Charging vehicles during off-peak times allows existing infrastructure to handle modest EV penetration levels,
but without any control over charging behavior, drivers can be expected to plug in during afternoon peak,
thereby necessitating additional transmission and generation, and widening the gap between peak and off-peak
load.152
Figure 11: Idealized Summer and Winter Load Curves (Source: IEA)
Local Capacity Areas and Load Pockets
Significant variations in the shape of the load curve, wholesale prices, and generating fuels exist at different
points on the electric grid. For this reason, the impacts from integrating a fleet of EVs could be insignificant in
one area, but troublesome in another. Figures 12 a and b show maps of California and Massachusetts. The
shaded “Local Capacity Areas” (LCAs) on the California map indicate the areas around the state where a
majority of peak system load occurs. System planners have designated these LCAs as needing special attention
for resource planning. Similarly, Figure 12b shows the “load zones” in Massachusetts. The largest city in
Massachusetts, Boston, is in the “NEMASSBOS” load zone, which receives special attention for capacity
planning.
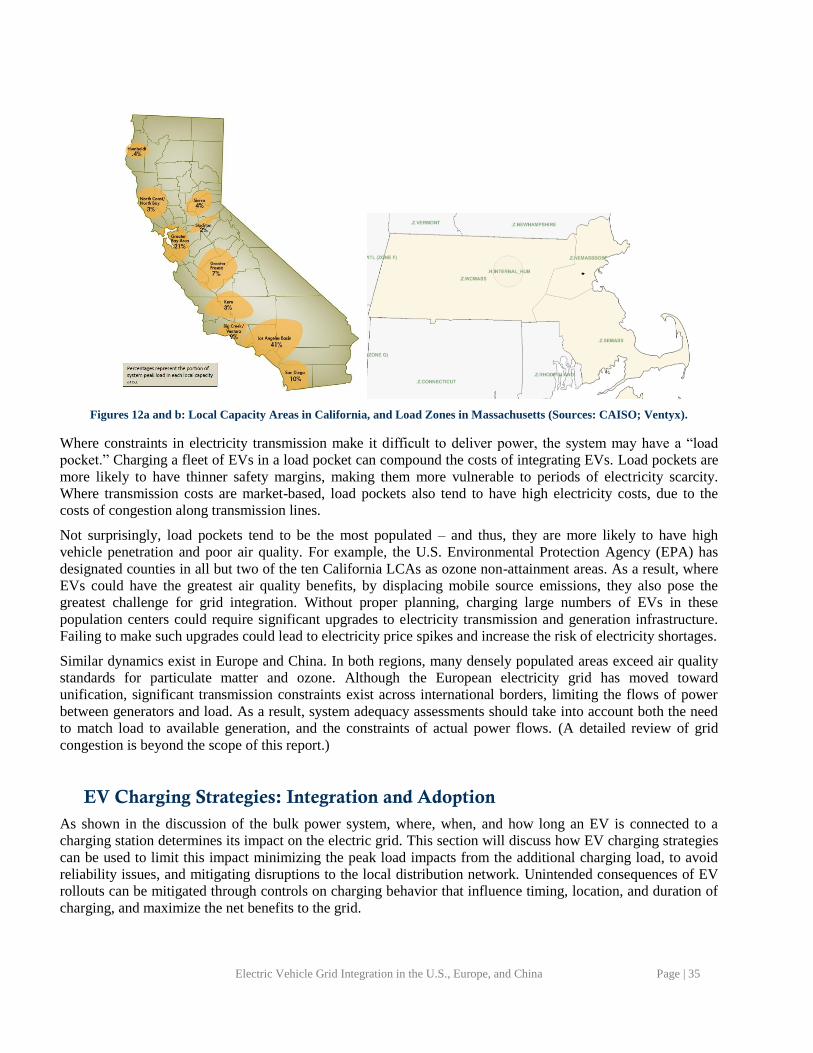
Electric Vehicle Grid Integration in the U.S., Europe, and China Page | 35
Figures 12a and b: Local Capacity Areas in California, and Load Zones in Massachusetts (Sources: CAISO; Ventyx).
Where constraints in electricity transmission make it difficult to deliver power, the system may have a “load
pocket.” Charging a fleet of EVs in a load pocket can compound the costs of integrating EVs. Load pockets are
more likely to have thinner safety margins, making them more vulnerable to periods of electricity scarcity.
Where transmission costs are market-based, load pockets also tend to have high electricity costs, due to the
costs of congestion along transmission lines.
Not surprisingly, load pockets tend to be the most populated – and thus, they are more likely to have high
vehicle penetration and poor air quality. For example, the U.S. Environmental Protection Agency (EPA) has
designated counties in all but two of the ten California LCAs as ozone non-attainment areas. As a result, where
EVs could have the greatest air quality benefits, by displacing mobile source emissions, they also pose the
greatest challenge for grid integration. Without proper planning, charging large numbers of EVs in these
population centers could require significant upgrades to electricity transmission and generation infrastructure.
Failing to make such upgrades could lead to electricity price spikes and increase the risk of electricity shortages.
Similar dynamics exist in Europe and China. In both regions, many densely populated areas exceed air quality
standards for particulate matter and ozone. Although the European electricity grid has moved toward
unification, significant transmission constraints exist across international borders, limiting the flows of power
between generators and load. As a result, system adequacy assessments should take into account both the need
to match load to available generation, and the constraints of actual power flows. (A detailed review of grid
congestion is beyond the scope of this report.)
EV Charging Strategies: Integration and Adoption
As shown in the discussion of the bulk power system, where, when, and how long an EV is connected to a
charging station determines its impact on the electric grid. This section will discuss how EV charging strategies
can be used to limit this impact minimizing the peak load impacts from the additional charging load, to avoid
reliability issues, and mitigating disruptions to the local distribution network. Unintended consequences of EV
rollouts can be mitigated through controls on charging behavior that influence timing, location, and duration of
charging, and maximize the net benefits to the grid.
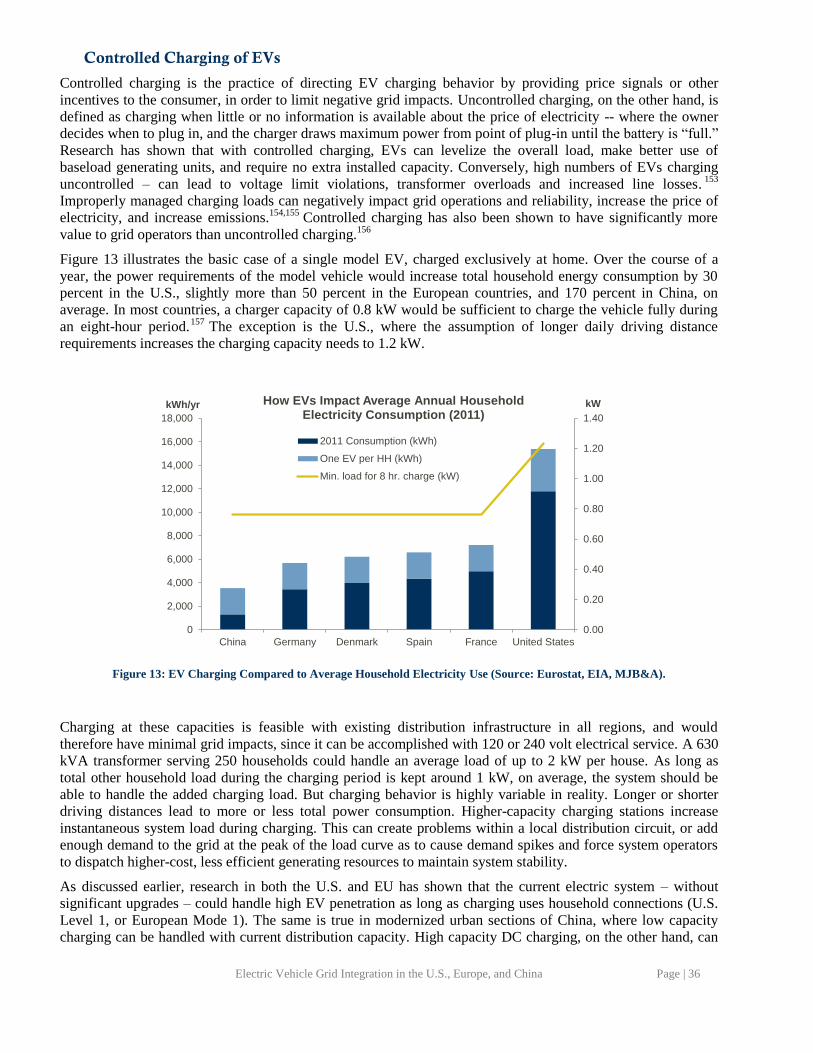
Electric Vehicle Grid Integration in the U.S., Europe, and China Page | 36
Controlled Charging of EVs
Controlled charging is the practice of directing EV charging behavior by providing price signals or other
incentives to the consumer, in order to limit negative grid impacts. Uncontrolled charging, on the other hand, is
defined as charging when little or no information is available about the price of electricity -- where the owner
decides when to plug in, and the charger draws maximum power from point of plug-in until the battery is “full.”
Research has shown that with controlled charging, EVs can levelize the overall load, make better use of
baseload generating units, and require no extra installed capacity. Conversely, high numbers of EVs charging
uncontrolled – can lead to voltage limit violations, transformer overloads and increased line losses.153
Improperly managed charging loads can negatively impact grid operations and reliability, increase the price of
electricity, and increase emissions.154,155
Controlled charging has also been shown to have significantly more
value to grid operators than uncontrolled charging.156
Figure 13 illustrates the basic case of a single model EV, charged exclusively at home. Over the course of a
year, the power requirements of the model vehicle would increase total household energy consumption by 30
percent in the U.S., slightly more than 50 percent in the European countries, and 170 percent in China, on
average. In most countries, a charger capacity of 0.8 kW would be sufficient to charge the vehicle fully during
an eight-hour period.157
The exception is the U.S., where the assumption of longer daily driving distance
requirements increases the charging capacity needs to 1.2 kW.
Figure 13: EV Charging Compared to Average Household Electricity Use (Source: Eurostat, EIA, MJB&A).
Charging at these capacities is feasible with existing distribution infrastructure in all regions, and would
therefore have minimal grid impacts, since it can be accomplished with 120 or 240 volt electrical service. A 630
kVA transformer serving 250 households could handle an average load of up to 2 kW per house. As long as
total other household load during the charging period is kept around 1 kW, on average, the system should be
able to handle the added charging load. But charging behavior is highly variable in reality. Longer or shorter
driving distances lead to more or less total power consumption. Higher-capacity charging stations increase
instantaneous system load during charging. This can create problems within a local distribution circuit, or add
enough demand to the grid at the peak of the load curve as to cause demand spikes and force system operators
to dispatch higher-cost, less efficient generating resources to maintain system stability.
As discussed earlier, research in both the U.S. and EU has shown that the current electric system – without
significant upgrades – could handle high EV penetration as long as charging uses household connections (U.S.
Level 1, or European Mode 1). The same is true in modernized urban sections of China, where low capacity
charging can be handled with current distribution capacity. High capacity DC charging, on the other hand, can
0
2,000
4,000
6,000
8,000
10,000
12,000
14,000
16,000
18,000
China Germany Denmark Spain France United States
0.00
0.20
0.40
0.60
0.80
1.00
1.20
1.40
kWkWh/yr How EVs Impact Average Annual Household Electricity Consumption (2011)
2011 Consumption (kWh)
One EV per HH (kWh)
Min. load for 8 hr. charge (kW)

Electric Vehicle Grid Integration in the U.S., Europe, and China Page | 37
lead to congestion and cause reliability issues.158
The EU electricity industry, for one, has taken the view that
“normal power charging” using existing infrastructure, combined with “controlled charging,” is the preferred
approach for ensuring system stability and minimizing costs.159
As discussed earlier, individual retailers in all
regions have begun to take on the problem by offering pricing incentives to reward off-peak charging.
The implications of charging behavior – both timing and capacity – are illustrated nicely in the series of charts
in Figure 14.160
The baseline charging scenario (CH1) shows vehicle charging spread throughout afternoon,
evening, and nighttime. This follows the assumption that vehicle owners tend to favor nighttime charging:
charging load increases in the late afternoon and early evening, with an average start time of 6:00 p.m.161,162
As
shown in Figure 15, this charging start time falls into the window of typical peak system power demand in both
summer and winter.
Variations on baseline charging behavior can be brought on by tariff-based incentives and other policies. These
are illustrated with the following alternate scenarios:
“Last-minute” – some drivers forget to plug in overnight, instead topping off during the morning.
“Home & Work” – drivers have access to chargers at work, and charging is spread more evenly across
the day
“No-Charge Window” – EVs are prevented from charging during the evening peak, causing a spike in
demand when the no-charge time ends
“Slow charge” – similar to the baseline scenario, but with no vehicles using high-capacity chargers
“Fast charge” – most vehicles use high capacity charging, which shortens the charging times but creates
a larger demand spike
“Fast charge, Home & Work” – most vehicles use high capacity charging, but have access to chargers
during the day, rather than solely at night
“Smaller battery” – total charging needs are lower than the baseline.
EV Demand Challenges in France
In a recent interview with Reuters, a representative from France’s electric grid operator said that a scenario of two million EVs by 2020 would increase total French electricity consumption by only 1 to 3 percent, but that the grid impacts could be significant. The greatest challenge, he said, could result from the addition of three to six GW of charging load during peak periods.
Meeting additional demand in France is especially difficult because the country relies on inflexible nuclear generation for 75 percent of its electricity. An unusually high reliance on electricity for heating means that the seasonal peak is in winter, rather than summer. The grid operator has recommended that slow chargers be used instead of fast chargers, to limit the combined load.
In addition to meeting the total load, grid operators have expressed concern about clustering of high capacity charging stations, which would lead to local distribution failures.
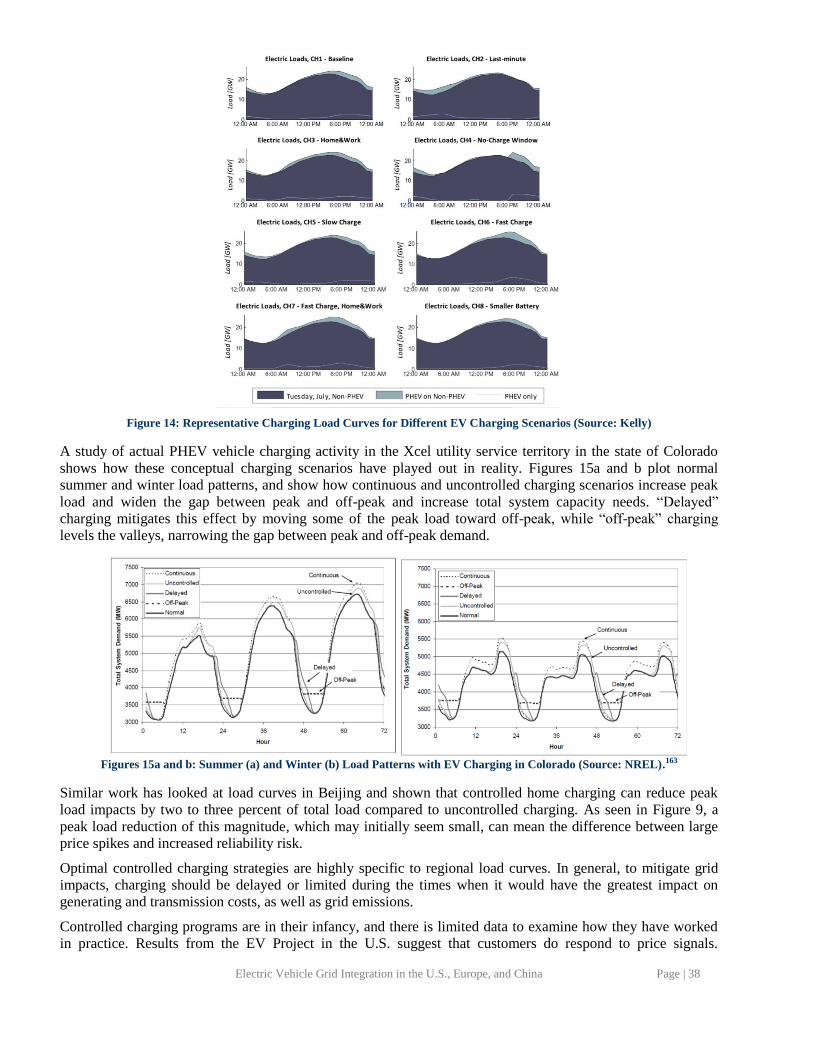
Electric Vehicle Grid Integration in the U.S., Europe, and China Page | 38
Figure 14: Representative Charging Load Curves for Different EV Charging Scenarios (Source: Kelly)
A study of actual PHEV vehicle charging activity in the Xcel utility service territory in the state of Colorado
shows how these conceptual charging scenarios have played out in reality. Figures 15a and b plot normal
summer and winter load patterns, and show how continuous and uncontrolled charging scenarios increase peak
load and widen the gap between peak and off-peak and increase total system capacity needs. “Delayed”
charging mitigates this effect by moving some of the peak load toward off-peak, while “off-peak” charging
levels the valleys, narrowing the gap between peak and off-peak demand.
Figures 15a and b: Summer (a) and Winter (b) Load Patterns with EV Charging in Colorado (Source: NREL).163
Similar work has looked at load curves in Beijing and shown that controlled home charging can reduce peak
load impacts by two to three percent of total load compared to uncontrolled charging. As seen in Figure 9, a
peak load reduction of this magnitude, which may initially seem small, can mean the difference between large
price spikes and increased reliability risk.
Optimal controlled charging strategies are highly specific to regional load curves. In general, to mitigate grid
impacts, charging should be delayed or limited during the times when it would have the greatest impact on
generating and transmission costs, as well as grid emissions.
Controlled charging programs are in their infancy, and there is limited data to examine how they have worked
in practice. Results from the EV Project in the U.S. suggest that customers do respond to price signals.
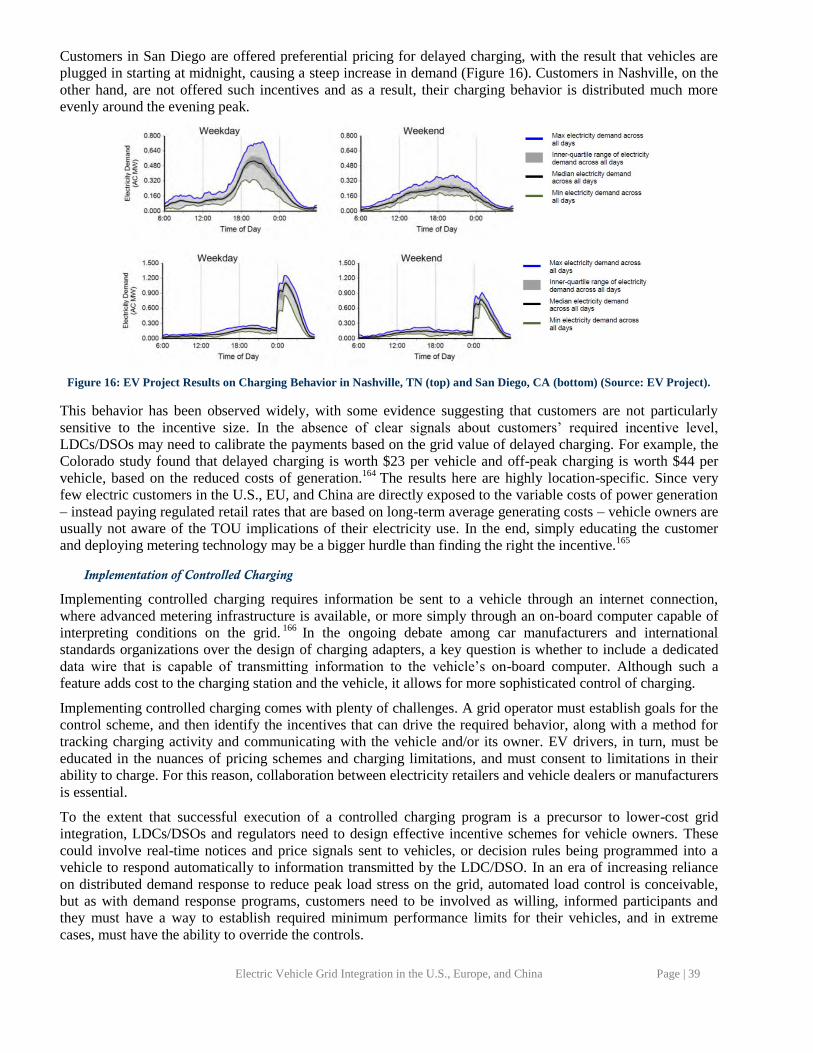
Electric Vehicle Grid Integration in the U.S., Europe, and China Page | 39
Customers in San Diego are offered preferential pricing for delayed charging, with the result that vehicles are
plugged in starting at midnight, causing a steep increase in demand (Figure 16). Customers in Nashville, on the
other hand, are not offered such incentives and as a result, their charging behavior is distributed much more
evenly around the evening peak.
Figure 16: EV Project Results on Charging Behavior in Nashville, TN (top) and San Diego, CA (bottom) (Source: EV Project).
This behavior has been observed widely, with some evidence suggesting that customers are not particularly
sensitive to the incentive size. In the absence of clear signals about customers’ required incentive level,
LDCs/DSOs may need to calibrate the payments based on the grid value of delayed charging. For example, the
Colorado study found that delayed charging is worth $23 per vehicle and off-peak charging is worth $44 per
vehicle, based on the reduced costs of generation.164
The results here are highly location-specific. Since very
few electric customers in the U.S., EU, and China are directly exposed to the variable costs of power generation
– instead paying regulated retail rates that are based on long-term average generating costs – vehicle owners are
usually not aware of the TOU implications of their electricity use. In the end, simply educating the customer
and deploying metering technology may be a bigger hurdle than finding the right the incentive.165
Implementation of Controlled Charging
Implementing controlled charging requires information be sent to a vehicle through an internet connection,
where advanced metering infrastructure is available, or more simply through an on-board computer capable of
interpreting conditions on the grid.166
In the ongoing debate among car manufacturers and international
standards organizations over the design of charging adapters, a key question is whether to include a dedicated
data wire that is capable of transmitting information to the vehicle’s on-board computer. Although such a
feature adds cost to the charging station and the vehicle, it allows for more sophisticated control of charging.
Implementing controlled charging comes with plenty of challenges. A grid operator must establish goals for the
control scheme, and then identify the incentives that can drive the required behavior, along with a method for
tracking charging activity and communicating with the vehicle and/or its owner. EV drivers, in turn, must be
educated in the nuances of pricing schemes and charging limitations, and must consent to limitations in their
ability to charge. For this reason, collaboration between electricity retailers and vehicle dealers or manufacturers
is essential.
To the extent that successful execution of a controlled charging program is a precursor to lower-cost grid
integration, LDCs/DSOs and regulators need to design effective incentive schemes for vehicle owners. These
could involve real-time notices and price signals sent to vehicles, or decision rules being programmed into a
vehicle to respond automatically to information transmitted by the LDC/DSO. In an era of increasing reliance
on distributed demand response to reduce peak load stress on the grid, automated load control is conceivable,
but as with demand response programs, customers need to be involved as willing, informed participants and
they must have a way to establish required minimum performance limits for their vehicles, and in extreme
cases, must have the ability to override the controls.
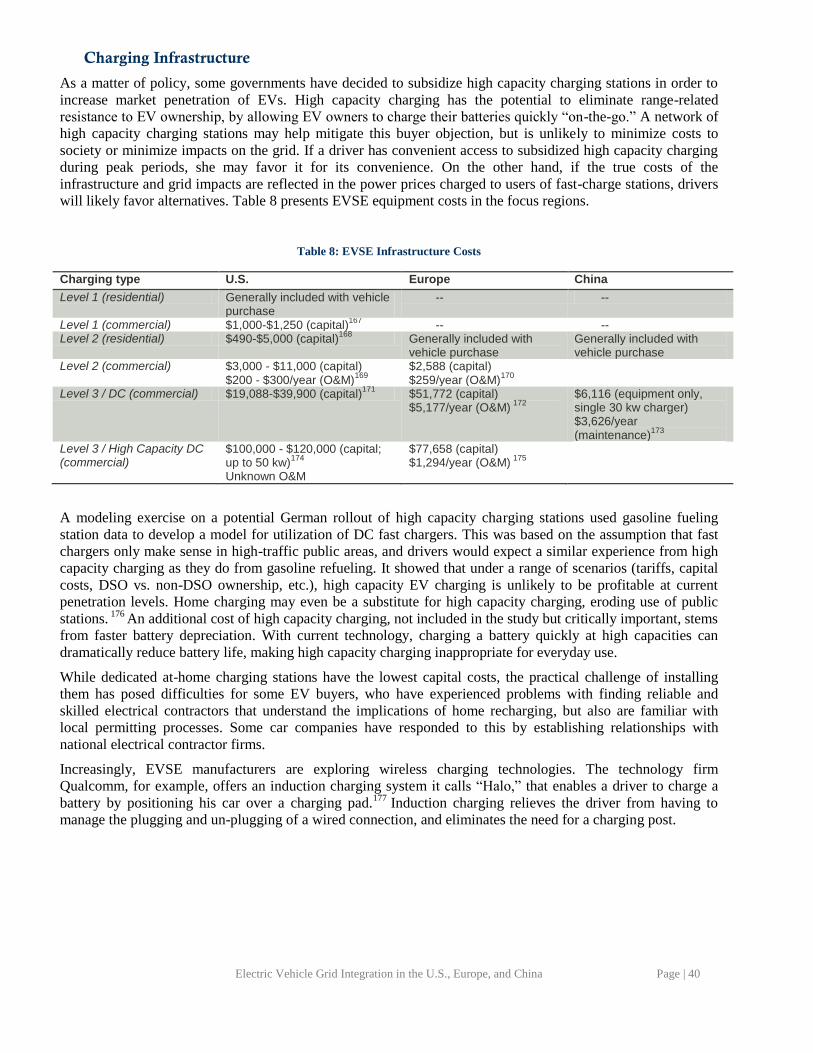
Electric Vehicle Grid Integration in the U.S., Europe, and China Page | 40
Charging Infrastructure
As a matter of policy, some governments have decided to subsidize high capacity charging stations in order to
increase market penetration of EVs. High capacity charging has the potential to eliminate range-related
resistance to EV ownership, by allowing EV owners to charge their batteries quickly “on-the-go.” A network of
high capacity charging stations may help mitigate this buyer objection, but is unlikely to minimize costs to
society or minimize impacts on the grid. If a driver has convenient access to subsidized high capacity charging
during peak periods, she may favor it for its convenience. On the other hand, if the true costs of the
infrastructure and grid impacts are reflected in the power prices charged to users of fast-charge stations, drivers
will likely favor alternatives. Table 8 presents EVSE equipment costs in the focus regions.
Table 8: EVSE Infrastructure Costs
Charging type U.S. Europe China
Level 1 (residential) Generally included with vehicle purchase
-- --
Level 1 (commercial) $1,000-$1,250 (capital)167
-- -- Level 2 (residential) $490-$5,000 (capital)
168 Generally included with
vehicle purchase Generally included with vehicle purchase
Level 2 (commercial) $3,000 - $11,000 (capital) $200 - $300/year (O&M)
169
$2,588 (capital) $259/year (O&M)
170
Level 3 / DC (commercial) $19,088-$39,900 (capital)171
$51,772 (capital) $5,177/year (O&M)
172
$6,116 (equipment only, single 30 kw charger) $3,626/year (maintenance)
173
Level 3 / High Capacity DC (commercial)
$100,000 - $120,000 (capital; up to 50 kw)
174
Unknown O&M
$77,658 (capital) $1,294/year (O&M)
175
A modeling exercise on a potential German rollout of high capacity charging stations used gasoline fueling
station data to develop a model for utilization of DC fast chargers. This was based on the assumption that fast
chargers only make sense in high-traffic public areas, and drivers would expect a similar experience from high
capacity charging as they do from gasoline refueling. It showed that under a range of scenarios (tariffs, capital
costs, DSO vs. non-DSO ownership, etc.), high capacity EV charging is unlikely to be profitable at current
penetration levels. Home charging may even be a substitute for high capacity charging, eroding use of public
stations. 176
An additional cost of high capacity charging, not included in the study but critically important, stems
from faster battery depreciation. With current technology, charging a battery quickly at high capacities can
dramatically reduce battery life, making high capacity charging inappropriate for everyday use.
While dedicated at-home charging stations have the lowest capital costs, the practical challenge of installing
them has posed difficulties for some EV buyers, who have experienced problems with finding reliable and
skilled electrical contractors that understand the implications of home recharging, but also are familiar with
local permitting processes. Some car companies have responded to this by establishing relationships with
national electrical contractor firms.
Increasingly, EVSE manufacturers are exploring wireless charging technologies. The technology firm
Qualcomm, for example, offers an induction charging system it calls “Halo,” that enables a driver to charge a
battery by positioning his car over a charging pad.177
Induction charging relieves the driver from having to
manage the plugging and un-plugging of a wired connection, and eliminates the need for a charging post.
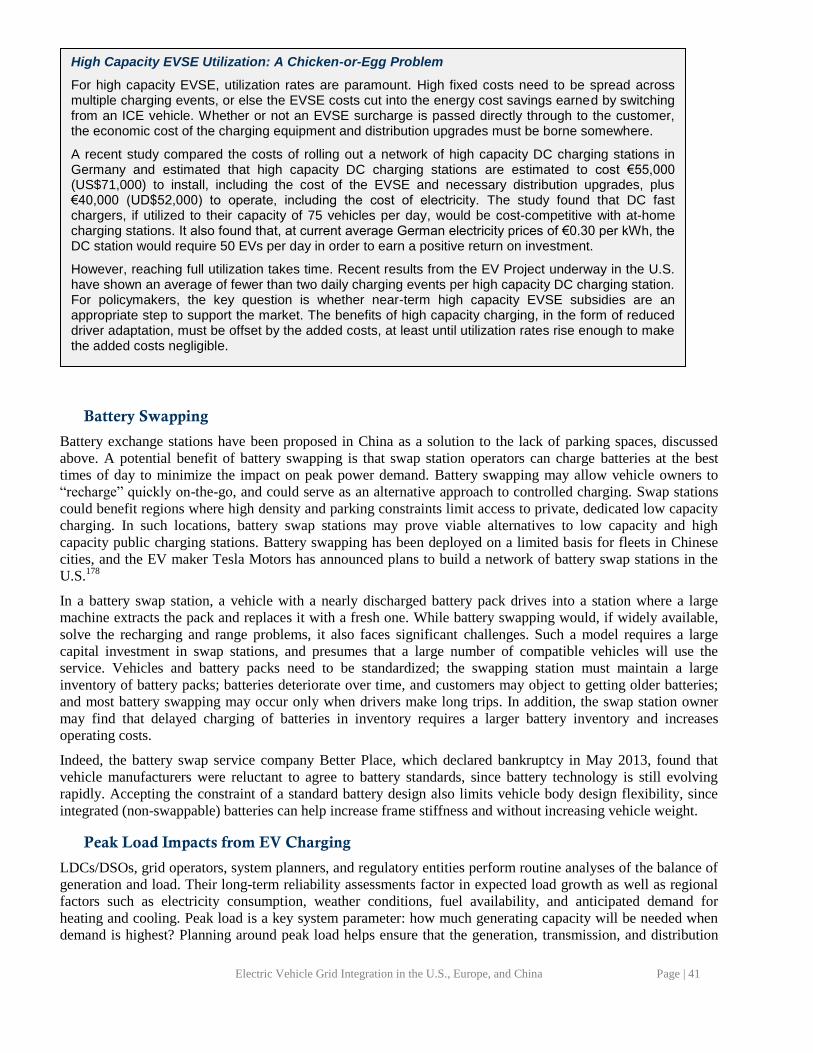
Electric Vehicle Grid Integration in the U.S., Europe, and China Page | 41
Battery Swapping
Battery exchange stations have been proposed in China as a solution to the lack of parking spaces, discussed
above. A potential benefit of battery swapping is that swap station operators can charge batteries at the best
times of day to minimize the impact on peak power demand. Battery swapping may allow vehicle owners to
“recharge” quickly on-the-go, and could serve as an alternative approach to controlled charging. Swap stations
could benefit regions where high density and parking constraints limit access to private, dedicated low capacity
charging. In such locations, battery swap stations may prove viable alternatives to low capacity and high
capacity public charging stations. Battery swapping has been deployed on a limited basis for fleets in Chinese
cities, and the EV maker Tesla Motors has announced plans to build a network of battery swap stations in the
U.S.178
In a battery swap station, a vehicle with a nearly discharged battery pack drives into a station where a large
machine extracts the pack and replaces it with a fresh one. While battery swapping would, if widely available,
solve the recharging and range problems, it also faces significant challenges. Such a model requires a large
capital investment in swap stations, and presumes that a large number of compatible vehicles will use the
service. Vehicles and battery packs need to be standardized; the swapping station must maintain a large
inventory of battery packs; batteries deteriorate over time, and customers may object to getting older batteries;
and most battery swapping may occur only when drivers make long trips. In addition, the swap station owner
may find that delayed charging of batteries in inventory requires a larger battery inventory and increases
operating costs.
Indeed, the battery swap service company Better Place, which declared bankruptcy in May 2013, found that
vehicle manufacturers were reluctant to agree to battery standards, since battery technology is still evolving
rapidly. Accepting the constraint of a standard battery design also limits vehicle body design flexibility, since
integrated (non-swappable) batteries can help increase frame stiffness and without increasing vehicle weight.
Peak Load Impacts from EV Charging
LDCs/DSOs, grid operators, system planners, and regulatory entities perform routine analyses of the balance of
generation and load. Their long-term reliability assessments factor in expected load growth as well as regional
factors such as electricity consumption, weather conditions, fuel availability, and anticipated demand for
heating and cooling. Peak load is a key system parameter: how much generating capacity will be needed when
demand is highest? Planning around peak load helps ensure that the generation, transmission, and distribution
High Capacity EVSE Utilization: A Chicken-or-Egg Problem
For high capacity EVSE, utilization rates are paramount. High fixed costs need to be spread across multiple charging events, or else the EVSE costs cut into the energy cost savings earned by switching from an ICE vehicle. Whether or not an EVSE surcharge is passed directly through to the customer, the economic cost of the charging equipment and distribution upgrades must be borne somewhere.
A recent study compared the costs of rolling out a network of high capacity DC charging stations in Germany and estimated that high capacity DC charging stations are estimated to cost €55,000 (US$71,000) to install, including the cost of the EVSE and necessary distribution upgrades, plus €40,000 (UD$52,000) to operate, including the cost of electricity. The study found that DC fast chargers, if utilized to their capacity of 75 vehicles per day, would be cost-competitive with at-home charging stations. It also found that, at current average German electricity prices of €0.30 per kWh, the DC station would require 50 EVs per day in order to earn a positive return on investment.
However, reaching full utilization takes time. Recent results from the EV Project underway in the U.S. have shown an average of fewer than two daily charging events per high capacity DC charging station. For policymakers, the key question is whether near-term high capacity EVSE subsidies are an appropriate step to support the market. The benefits of high capacity charging, in the form of reduced driver adaptation, must be offset by the added costs, at least until utilization rates rise enough to make the added costs negligible.
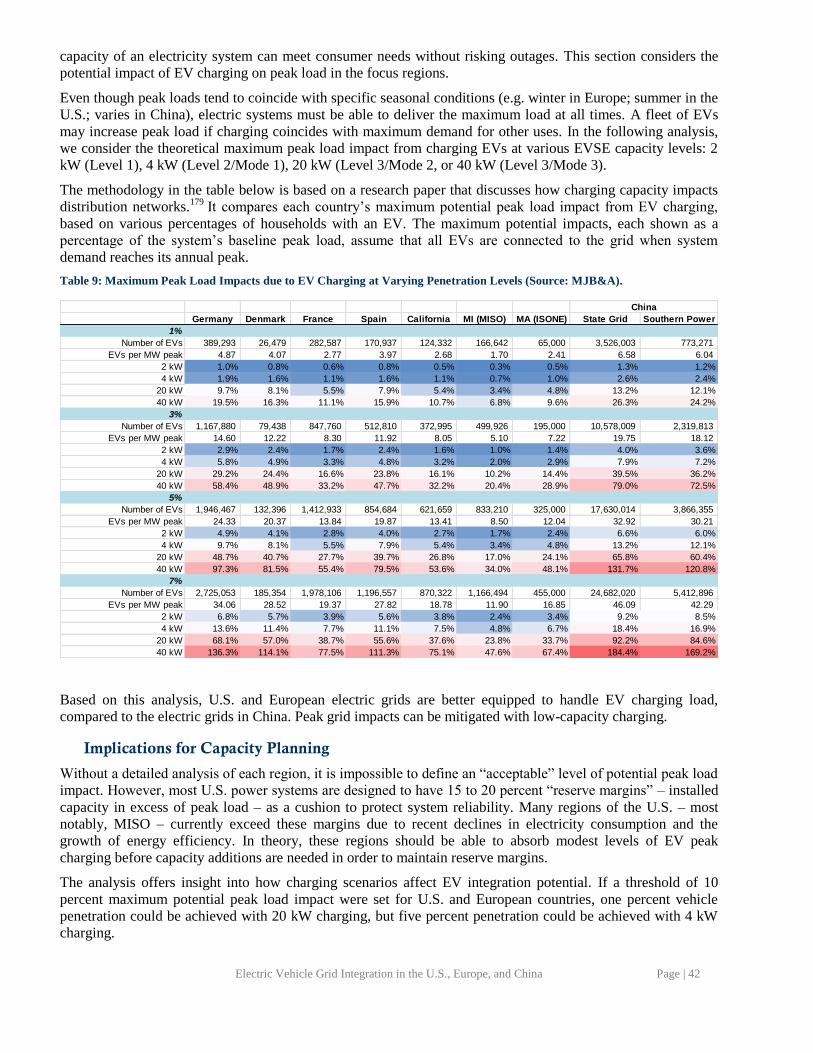
Electric Vehicle Grid Integration in the U.S., Europe, and China Page | 42
capacity of an electricity system can meet consumer needs without risking outages. This section considers the
potential impact of EV charging on peak load in the focus regions.
Even though peak loads tend to coincide with specific seasonal conditions (e.g. winter in Europe; summer in the
U.S.; varies in China), electric systems must be able to deliver the maximum load at all times. A fleet of EVs
may increase peak load if charging coincides with maximum demand for other uses. In the following analysis,
we consider the theoretical maximum peak load impact from charging EVs at various EVSE capacity levels: 2
kW (Level 1), 4 kW (Level 2/Mode 1), 20 kW (Level 3/Mode 2, or 40 kW (Level 3/Mode 3).
The methodology in the table below is based on a research paper that discusses how charging capacity impacts
distribution networks.179
It compares each country’s maximum potential peak load impact from EV charging,
based on various percentages of households with an EV. The maximum potential impacts, each shown as a
percentage of the system’s baseline peak load, assume that all EVs are connected to the grid when system
demand reaches its annual peak.
Table 9: Maximum Peak Load Impacts due to EV Charging at Varying Penetration Levels (Source: MJB&A).
Based on this analysis, U.S. and European electric grids are better equipped to handle EV charging load,
compared to the electric grids in China. Peak grid impacts can be mitigated with low-capacity charging.
Implications for Capacity Planning
Without a detailed analysis of each region, it is impossible to define an “acceptable” level of potential peak load
impact. However, most U.S. power systems are designed to have 15 to 20 percent “reserve margins” – installed
capacity in excess of peak load – as a cushion to protect system reliability. Many regions of the U.S. – most
notably, MISO – currently exceed these margins due to recent declines in electricity consumption and the
growth of energy efficiency. In theory, these regions should be able to absorb modest levels of EV peak
charging before capacity additions are needed in order to maintain reserve margins.
The analysis offers insight into how charging scenarios affect EV integration potential. If a threshold of 10
percent maximum potential peak load impact were set for U.S. and European countries, one percent vehicle
penetration could be achieved with 20 kW charging, but five percent penetration could be achieved with 4 kW
charging.
Germany Denmark France Spain California MI (MISO) MA (ISONE) State Grid Southern Power
1%
Number of EVs 389,293 26,479 282,587 170,937 124,332 166,642 65,000 3,526,003 773,271
EVs per MW peak 4.87 4.07 2.77 3.97 2.68 1.70 2.41 6.58 6.04
2 kW 1.0% 0.8% 0.6% 0.8% 0.5% 0.3% 0.5% 1.3% 1.2%
4 kW 1.9% 1.6% 1.1% 1.6% 1.1% 0.7% 1.0% 2.6% 2.4%
20 kW 9.7% 8.1% 5.5% 7.9% 5.4% 3.4% 4.8% 13.2% 12.1%
40 kW 19.5% 16.3% 11.1% 15.9% 10.7% 6.8% 9.6% 26.3% 24.2%
3%
Number of EVs 1,167,880 79,438 847,760 512,810 372,995 499,926 195,000 10,578,009 2,319,813
EVs per MW peak 14.60 12.22 8.30 11.92 8.05 5.10 7.22 19.75 18.12
2 kW 2.9% 2.4% 1.7% 2.4% 1.6% 1.0% 1.4% 4.0% 3.6%
4 kW 5.8% 4.9% 3.3% 4.8% 3.2% 2.0% 2.9% 7.9% 7.2%
20 kW 29.2% 24.4% 16.6% 23.8% 16.1% 10.2% 14.4% 39.5% 36.2%
40 kW 58.4% 48.9% 33.2% 47.7% 32.2% 20.4% 28.9% 79.0% 72.5%
5%
Number of EVs 1,946,467 132,396 1,412,933 854,684 621,659 833,210 325,000 17,630,014 3,866,355
EVs per MW peak 24.33 20.37 13.84 19.87 13.41 8.50 12.04 32.92 30.21
2 kW 4.9% 4.1% 2.8% 4.0% 2.7% 1.7% 2.4% 6.6% 6.0%
4 kW 9.7% 8.1% 5.5% 7.9% 5.4% 3.4% 4.8% 13.2% 12.1%
20 kW 48.7% 40.7% 27.7% 39.7% 26.8% 17.0% 24.1% 65.8% 60.4%
40 kW 97.3% 81.5% 55.4% 79.5% 53.6% 34.0% 48.1% 131.7% 120.8%
7%
Number of EVs 2,725,053 185,354 1,978,106 1,196,557 870,322 1,166,494 455,000 24,682,020 5,412,896
EVs per MW peak 34.06 28.52 19.37 27.82 18.78 11.90 16.85 46.09 42.29
2 kW 6.8% 5.7% 3.9% 5.6% 3.8% 2.4% 3.4% 9.2% 8.5%
4 kW 13.6% 11.4% 7.7% 11.1% 7.5% 4.8% 6.7% 18.4% 16.9%
20 kW 68.1% 57.0% 38.7% 55.6% 37.6% 23.8% 33.7% 92.2% 84.6%
40 kW 136.3% 114.1% 77.5% 111.3% 75.1% 47.6% 67.4% 184.4% 169.2%
China
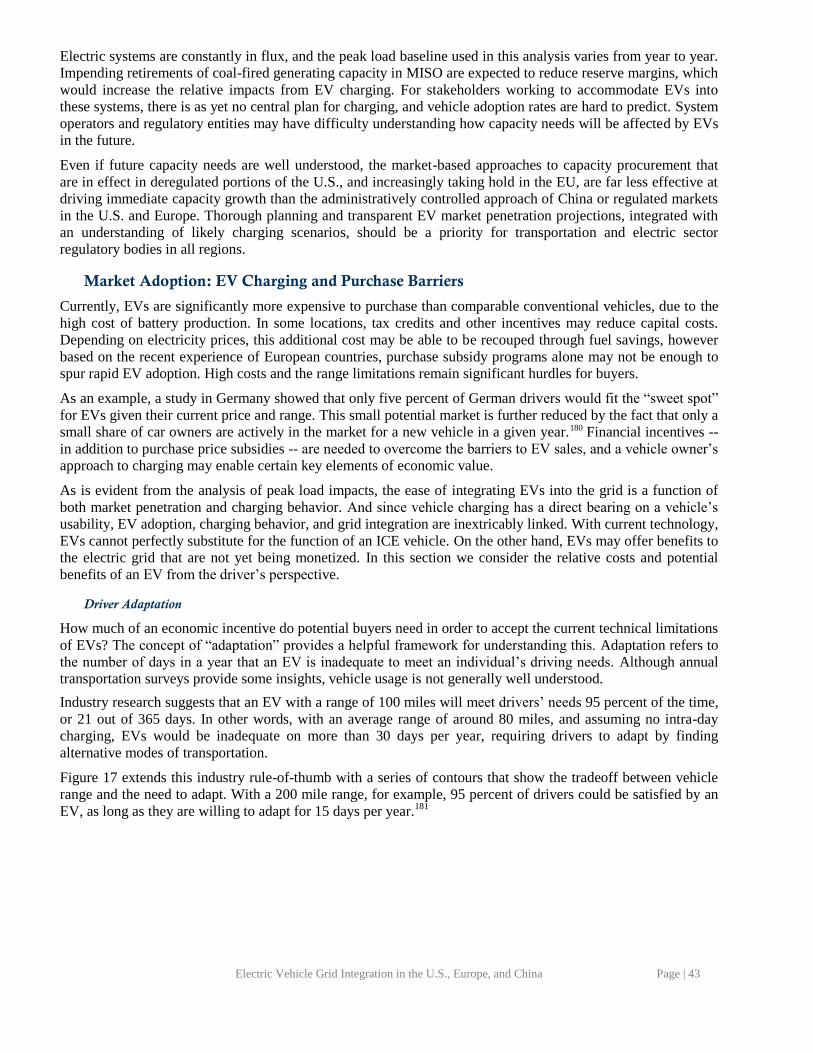
Electric Vehicle Grid Integration in the U.S., Europe, and China Page | 43
Electric systems are constantly in flux, and the peak load baseline used in this analysis varies from year to year.
Impending retirements of coal-fired generating capacity in MISO are expected to reduce reserve margins, which
would increase the relative impacts from EV charging. For stakeholders working to accommodate EVs into
these systems, there is as yet no central plan for charging, and vehicle adoption rates are hard to predict. System
operators and regulatory entities may have difficulty understanding how capacity needs will be affected by EVs
in the future.
Even if future capacity needs are well understood, the market-based approaches to capacity procurement that
are in effect in deregulated portions of the U.S., and increasingly taking hold in the EU, are far less effective at
driving immediate capacity growth than the administratively controlled approach of China or regulated markets
in the U.S. and Europe. Thorough planning and transparent EV market penetration projections, integrated with
an understanding of likely charging scenarios, should be a priority for transportation and electric sector
regulatory bodies in all regions.
Market Adoption: EV Charging and Purchase Barriers
Currently, EVs are significantly more expensive to purchase than comparable conventional vehicles, due to the
high cost of battery production. In some locations, tax credits and other incentives may reduce capital costs.
Depending on electricity prices, this additional cost may be able to be recouped through fuel savings, however
based on the recent experience of European countries, purchase subsidy programs alone may not be enough to
spur rapid EV adoption. High costs and the range limitations remain significant hurdles for buyers.
As an example, a study in Germany showed that only five percent of German drivers would fit the “sweet spot”
for EVs given their current price and range. This small potential market is further reduced by the fact that only a
small share of car owners are actively in the market for a new vehicle in a given year.180 Financial incentives --
in addition to purchase price subsidies -- are needed to overcome the barriers to EV sales, and a vehicle owner’s
approach to charging may enable certain key elements of economic value.
As is evident from the analysis of peak load impacts, the ease of integrating EVs into the grid is a function of
both market penetration and charging behavior. And since vehicle charging has a direct bearing on a vehicle’s
usability, EV adoption, charging behavior, and grid integration are inextricably linked. With current technology,
EVs cannot perfectly substitute for the function of an ICE vehicle. On the other hand, EVs may offer benefits to
the electric grid that are not yet being monetized. In this section we consider the relative costs and potential
benefits of an EV from the driver’s perspective.
Driver Adaptation
How much of an economic incentive do potential buyers need in order to accept the current technical limitations
of EVs? The concept of “adaptation” provides a helpful framework for understanding this. Adaptation refers to
the number of days in a year that an EV is inadequate to meet an individual’s driving needs. Although annual
transportation surveys provide some insights, vehicle usage is not generally well understood.
Industry research suggests that an EV with a range of 100 miles will meet drivers’ needs 95 percent of the time,
or 21 out of 365 days. In other words, with an average range of around 80 miles, and assuming no intra-day
charging, EVs would be inadequate on more than 30 days per year, requiring drivers to adapt by finding
alternative modes of transportation.
Figure 17 extends this industry rule-of-thumb with a series of contours that show the tradeoff between vehicle
range and the need to adapt. With a 200 mile range, for example, 95 percent of drivers could be satisfied by an
EV, as long as they are willing to adapt for 15 days per year.181
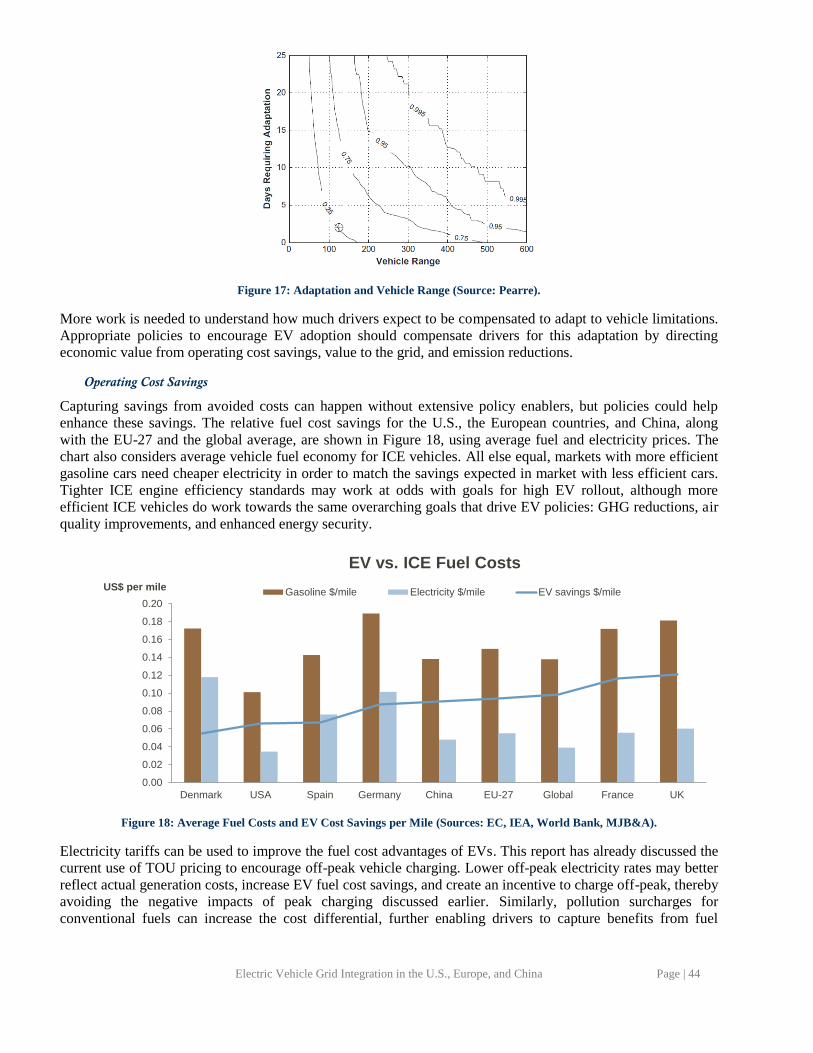
Electric Vehicle Grid Integration in the U.S., Europe, and China Page | 44
Figure 17: Adaptation and Vehicle Range (Source: Pearre).
More work is needed to understand how much drivers expect to be compensated to adapt to vehicle limitations.
Appropriate policies to encourage EV adoption should compensate drivers for this adaptation by directing
economic value from operating cost savings, value to the grid, and emission reductions.
Operating Cost Savings
Capturing savings from avoided costs can happen without extensive policy enablers, but policies could help
enhance these savings. The relative fuel cost savings for the U.S., the European countries, and China, along
with the EU-27 and the global average, are shown in Figure 18, using average fuel and electricity prices. The
chart also considers average vehicle fuel economy for ICE vehicles. All else equal, markets with more efficient
gasoline cars need cheaper electricity in order to match the savings expected in market with less efficient cars.
Tighter ICE engine efficiency standards may work at odds with goals for high EV rollout, although more
efficient ICE vehicles do work towards the same overarching goals that drive EV policies: GHG reductions, air
quality improvements, and enhanced energy security.
Figure 18: Average Fuel Costs and EV Cost Savings per Mile (Sources: EC, IEA, World Bank, MJB&A).
Electricity tariffs can be used to improve the fuel cost advantages of EVs. This report has already discussed the
current use of TOU pricing to encourage off-peak vehicle charging. Lower off-peak electricity rates may better
reflect actual generation costs, increase EV fuel cost savings, and create an incentive to charge off-peak, thereby
avoiding the negative impacts of peak charging discussed earlier. Similarly, pollution surcharges for
conventional fuels can increase the cost differential, further enabling drivers to capture benefits from fuel
0.00
0.02
0.04
0.06
0.08
0.10
0.12
0.14
0.16
0.18
0.20
Denmark USA Spain Germany China EU-27 Global France UK
US$ per mile
EV vs. ICE Fuel Costs
Gasoline $/mile Electricity $/mile EV savings $/mile
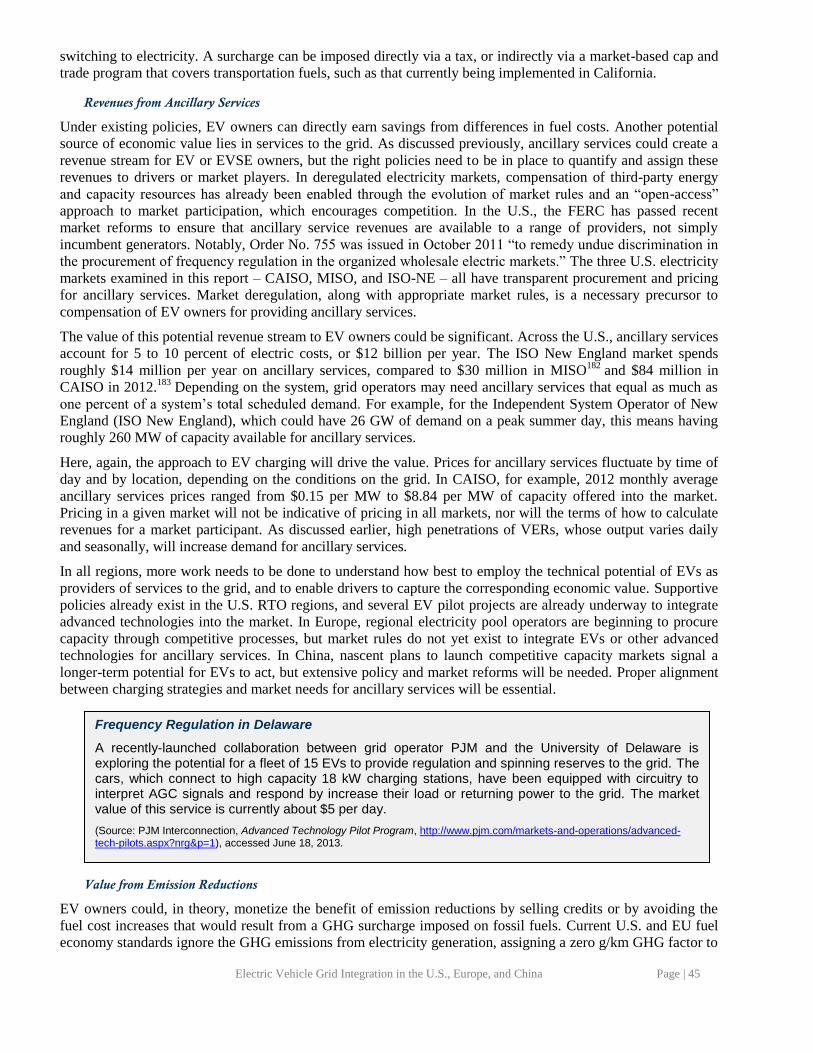
Electric Vehicle Grid Integration in the U.S., Europe, and China Page | 45
switching to electricity. A surcharge can be imposed directly via a tax, or indirectly via a market-based cap and
trade program that covers transportation fuels, such as that currently being implemented in California.
Revenues from Ancillary Services
Under existing policies, EV owners can directly earn savings from differences in fuel costs. Another potential
source of economic value lies in services to the grid. As discussed previously, ancillary services could create a
revenue stream for EV or EVSE owners, but the right policies need to be in place to quantify and assign these
revenues to drivers or market players. In deregulated electricity markets, compensation of third-party energy
and capacity resources has already been enabled through the evolution of market rules and an “open-access”
approach to market participation, which encourages competition. In the U.S., the FERC has passed recent
market reforms to ensure that ancillary service revenues are available to a range of providers, not simply
incumbent generators. Notably, Order No. 755 was issued in October 2011 “to remedy undue discrimination in
the procurement of frequency regulation in the organized wholesale electric markets.” The three U.S. electricity
markets examined in this report – CAISO, MISO, and ISO-NE – all have transparent procurement and pricing
for ancillary services. Market deregulation, along with appropriate market rules, is a necessary precursor to
compensation of EV owners for providing ancillary services.
The value of this potential revenue stream to EV owners could be significant. Across the U.S., ancillary services
account for 5 to 10 percent of electric costs, or $12 billion per year. The ISO New England market spends
roughly $14 million per year on ancillary services, compared to $30 million in MISO182
and $84 million in
CAISO in 2012.183
Depending on the system, grid operators may need ancillary services that equal as much as
one percent of a system’s total scheduled demand. For example, for the Independent System Operator of New
England (ISO New England), which could have 26 GW of demand on a peak summer day, this means having
roughly 260 MW of capacity available for ancillary services.
Here, again, the approach to EV charging will drive the value. Prices for ancillary services fluctuate by time of
day and by location, depending on the conditions on the grid. In CAISO, for example, 2012 monthly average
ancillary services prices ranged from $0.15 per MW to $8.84 per MW of capacity offered into the market.
Pricing in a given market will not be indicative of pricing in all markets, nor will the terms of how to calculate
revenues for a market participant. As discussed earlier, high penetrations of VERs, whose output varies daily
and seasonally, will increase demand for ancillary services.
In all regions, more work needs to be done to understand how best to employ the technical potential of EVs as
providers of services to the grid, and to enable drivers to capture the corresponding economic value. Supportive
policies already exist in the U.S. RTO regions, and several EV pilot projects are already underway to integrate
advanced technologies into the market. In Europe, regional electricity pool operators are beginning to procure
capacity through competitive processes, but market rules do not yet exist to integrate EVs or other advanced
technologies for ancillary services. In China, nascent plans to launch competitive capacity markets signal a
longer-term potential for EVs to act, but extensive policy and market reforms will be needed. Proper alignment
between charging strategies and market needs for ancillary services will be essential.
Value from Emission Reductions
EV owners could, in theory, monetize the benefit of emission reductions by selling credits or by avoiding the
fuel cost increases that would result from a GHG surcharge imposed on fossil fuels. Current U.S. and EU fuel
economy standards ignore the GHG emissions from electricity generation, assigning a zero g/km GHG factor to
Frequency Regulation in Delaware
A recently-launched collaboration between grid operator PJM and the University of Delaware is exploring the potential for a fleet of 15 EVs to provide regulation and spinning reserves to the grid. The cars, which connect to high capacity 18 kW charging stations, have been equipped with circuitry to interpret AGC signals and respond by increase their load or returning power to the grid. The market value of this service is currently about $5 per day.
(Source: PJM Interconnection, Advanced Technology Pilot Program, http://www.pjm.com/markets-and-operations/advanced-tech-pilots.aspx?nrg&p=1), accessed June 18, 2013.
Electric Vehicle Grid Integration in the U.S., Europe, and China Page | 46
EVs. This approach assumes that indirect emissions from the electric sector due to charging are regulated
separately through electric sector policies.
Emission reductions from EVs should be clearly understood and trackable. Recalling the simplified electricity
supply curve presented earlier, the utilization of existing generating resources is key for determining the fuel
that would be used to generate additional electricity for EV charging. Figure 19 shows the marginal fuel mix for
nighttime and mixed daytime/nighttime charging in the U.S., designated by sub-regions defined by the
NERC.184
In California (CNV), and Massachusetts (ISONE), natural gas is the marginal fuel nearly 100 percent
of the time. In Michigan (MAIN), coal provides the marginal generation for charging almost 50 percent of the
time during the nighttime scenario, and 15 percent of the time during the blended scenario.
Figure 19: Marginal Generation for EV Charging in the U.S. (Source: PNNL).185
This example reflects the type of analysis that should be done in all regions to understand the emissions impacts
of EV charging. Separately, policies need to ensure that vehicle owners can capture the value of these
reductions. As an example, low-carbon fuel standards have been discussed in many regions as a way of
rewarding low-carbon vehicle fuel choices. Such standards place a value on GHG emission reductions by
assigning a value to emission reductions. Low-carbon fuel policies can promote EV ownership by enabling EV
drivers to directly capture that emission reduction value.
Figure 20 conveys the full implications of potential savings and revenue streams, showing how different sources
of value can offset the added purchase costs of an EV. This example shows a snapshot of a Nissan Leaf (EV)
and a Nissan Versa (ICE vehicle) operated under average cost conditions in the northeastern U.S. Of note, the
potential revenues from regulation services (earning revenues from $1 to $20 per MW-hr) exceed the potential
savings from avoided CO2 emissions (at prices ranging from $2 to $35 per tonne). The most aggressive
assumptions reduce the annualized cost of an EV below that of an ICE vehicle. Under the other scenarios,
additional sources of value would be necessary in order to close the gap. This could be achieved through a
direct subsidy such as the tax credit or vehicle purchase subsidies currently in place in all regions, or discounted
electricity tariffs, or through less direct methods such as licensing and access privileges.
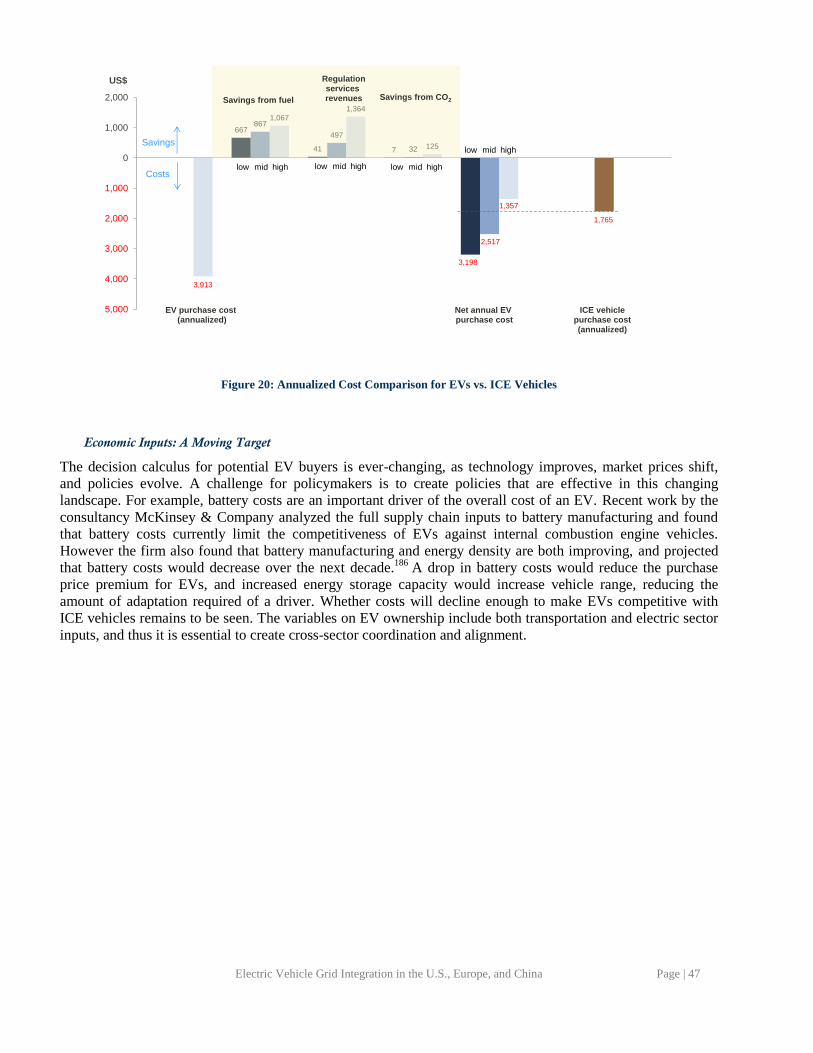
Electric Vehicle Grid Integration in the U.S., Europe, and China Page | 47
Figure 20: Annualized Cost Comparison for EVs vs. ICE Vehicles
Economic Inputs: A Moving Target
The decision calculus for potential EV buyers is ever-changing, as technology improves, market prices shift,
and policies evolve. A challenge for policymakers is to create policies that are effective in this changing
landscape. For example, battery costs are an important driver of the overall cost of an EV. Recent work by the
consultancy McKinsey & Company analyzed the full supply chain inputs to battery manufacturing and found
that battery costs currently limit the competitiveness of EVs against internal combustion engine vehicles.
However the firm also found that battery manufacturing and energy density are both improving, and projected
that battery costs would decrease over the next decade.186
A drop in battery costs would reduce the purchase
price premium for EVs, and increased energy storage capacity would increase vehicle range, reducing the
amount of adaptation required of a driver. Whether costs will decline enough to make EVs competitive with
ICE vehicles remains to be seen. The variables on EV ownership include both transportation and electric sector
inputs, and thus it is essential to create cross-sector coordination and alignment.
1,765
667
41 7
3,198
867
497
32
2,517
3,913
1,067
1,364
125
1,357
5,000
4,000
3,000
2,000
1,000
0
1,000
2,000
US$
Savings from fuel
Regulationservices revenues Savings from CO2
Costs
Savings
EV purchase cost (annualized)
low mid highlow mid high low mid high
low mid high
Net annual EV purchase cost
ICE vehiclepurchase cost(annualized)
Electric Vehicle Grid Integration in the U.S., Europe, and China Page | 48
Conclusions and Recommendations
Each of the countries profiled in this report has set objectives to expand the EV market in the coming decades,
and each has taken a different approach to the policy enablers that they hope will help stimulate the market in
the near term. Their motivations are similar: to improve air quality in vehicle-dense urban areas, to reduce
transportation sector emissions of GHGs, and to achieve greater energy independence by reducing foreign oil
imports.
Recent results from EV sales have forced many countries to reconsider their goals. Germany’s target of one
million EVs by 2020 was quickly abandoned. Denmark’s target of 400,000 EVs by 2020 was reduced by half.
China also cut its target in half, from ten to five million EVs by 2020. And with 87,000 EVs on the road in the
U.S., President Obama’s goal of one million EVs by 2015 is unachievable at the current pace of EV sales.
Shortcomings in vehicle uptake have been feared by many to be the result of driver anxiety about vehicle range.
Frequently, policy proposals to solve vehicle range issues call for networks of high capacity charging stations.
In theory, giving drivers the ability to charge vehicles on-the-go could reduce range anxiety and mimic the
refueling infrastructure to which drivers of gasoline-powered cars have become accustomed.
Yet the high grid impacts of fast-charging EVSE compared to Level 1 or Level 2 (U.S.) or Mode 1 (EU)
charging equipment, and the increased battery depreciation, make this an expensive solution. Expensive
distribution upgrades would be needed to handle peak load; emissions increases may be unavoidable. For these
added costs to be justified, high capacity DC charging must significantly reduce driver adaptation, to the point
where the benefits of greater vehicle adoption outweigh the costs of charging.
At low EVSE utilization rates, the incremental per-charge cost may be too high for drivers. Subsidies have the
potential to reduce or eliminate the share of EVSE costs directly borne by the vehicle owner, but such a use of
public funds in the near term amounts to a large handout for each driver. Over time, EVSE utilization rates
would increase enough so that the costs per EV, amortized across a high number of charging events, would be
negligible. But at low market penetration levels, EV drivers will be dispersed thinly across a region, and EVSE
utilization will be low.
There are exceptions to this. Fleets of vehicles that need a rapid charge from a central location, such as taxis,
could benefit from high capacity DC charging if the vehicle queue is managed to minimize the number of
charging stations. Other dedicated uses of high capacity DC charging could be justified, if the EVSE utilization
is closely managed. But charging in these circumstances should be done under a self-sustaining, unsubsidized
business model.
The costs of driver adaptation underlie the challenge of stimulating EV market growth. Within the technical
constraints of today’s vehicles, there is no way to meet all drivers’ vehicle range requirements for all trips.
Drivers may be willing to find alternate modes of transportation, such as public transit or car rentals, if they are
sufficiently compensated for the inconvenience. The question is: what is the required compensation, and where
in the economic equation can it be captured?
As discussed in this report, EVs could benefit the grid by providing capacity and energy to grid operators when
they need it, and by “smoothing” the load curve to increase the efficiency and utilization rates of the existing
generating fleet. Markets for these benefits already exist in all of the regions. Going forward, if EVs can
participate competitively in these markets, drivers may be able to capture additional value by providing services
to the grid. For grid operators, this could mean the advent of a new class of cost-effective grid resources being
available to help them meet the evolving needs of 21st century electric grids.
Policy Recommendations
This report has examined hurdles to EV adoption in the U.S., Europe, and China, and has identified critical
success factors that should guide policymakers in the transportation and electric sectors. Accelerating the pace
of EV market growth requires a coordinated evolution in both sectors, from the power plant to the charging
station to the vehicle. Supportive policies should work to ensure that EV owners are able to capture the full
economic value of their decision to fuel switch from electricity to gasoline, including any benefits to the grid

Electric Vehicle Grid Integration in the U.S., Europe, and China Page | 49
operator, and any emission reduction benefits, in addition to realizing the savings from replacing gasoline or
diesel fuel with electricity.
Based on the analysis in this report, four general policy objectives have been identified:
1. Limit negative grid impacts, to avoid creating new barriers and costs due to integrating larger
numbers of EVs into the grid.
2. Realize full potential of grid benefits, to help lower ownership costs for drivers, and ensure that
electricity customers benefit from grid-connected EVs as much as is technically possible.
3. Expand economic incentives for drivers, through sound, cost-effective policies that assign value to
the benefits from EV use, and enable drivers to capture those benefits.
4. Avoid creating stranded assets through subsidies, by limiting public investment in high capital cost
EVSE that is at risk of being underutilized.
Primary Policy Recommendations
Create or amend electricity sector rules to foster participation by non-generators in electricity markets. EVs can only provide grid services if electricity market rules treat energy, capacity, and ancillary services resources separately. This allows non-generation resource providers to participate in the market and compete on an equal footing with generation.
In order to foster non-generation market participation, a policy of fair and equal pricing of non-traditional resources is needed. The requirements for market participants, such as minimum capacity and performance expectations, need to be clearly written and compatible with the capabilities that EV aggregation service providers could offer. Processes for participating in the market should be clearly explained, and market prices clearly disclosed and readily available. Contracting, billing, and reconciliation should be transparent and fast. Policies need to ensure that emerging business models for EV grid services are not unduly hampered by regulatory, administrative or market barriers.
Regulators can look to U.S. markets, where FERC policy has led RTOs to adopt favorable approaches. Market rules for non-generator provisioning of capacity and ancillary services in PJM and ISO-NE have undergone several revisions, and the docket proceedings shed light on how policies can be designed to address stakeholder issues.
Objectives: Limit impacts; realize benefits; expand incentives
Regulatory Scope: Regional, State
Encourage TOU and/or real-time electricity pricing tariffs. In markets served by regulated utilities, such as China and parts of the U.S., the regulator can use its authority to stipulate retail energy and/or transmission tariffs. In deregulated markets, such as the EU and parts of the U.S., market overseers can encourage retail suppliers to link retail prices to the true costs of generation.
Over the longer term, as metering and distribution infrastructure matures, this policy objective can be met through more sophisticated use of price signals and advanced metering infrastructure that facilitate widespread price-based load management by electricity customers. For EV owners, this would mean charging decisions would be guided by better access to information about the underlying production and transmission costs of electricity. Policy should be sufficiently flexible to allow LDCs/DSOs to send these pricing signals. Such a policy can also be effective at reducing added stress on the local distribution network, by creating incentives for individual customers to avoid adding an EV charging load at the same time that residential load reaches its peak.
To minimize emissions impacts from charging, price signals – whether through tariffs, or sent directly to customers – should reflect the environmental costs of generation, thereby creating an incentive for charging behavior that minimizes the emissions due to vehicle charging. This is especially important in regions where marginal generation has a high emissions profile.
Objectives: Limit impacts; realize benefits; expand incentives
Regulatory Scope: Regional, State
Electric Vehicle Grid Integration in the U.S., Europe, and China Page | 51
Allow prudent cost recovery of capital and operating costs by electricity distribution companies to foster EV ownership. For regulated utilities, LDCs, and DSOs, cost recovery can be used as a tool to encourage investment and modify incentives so they are better aligned with public policy goals. This can lead to infrastructure and operations that are better suited to supporting EV ownership.
In some cases, better communication between the LDC/DSO and vehicle owner may improve control over charging behavior and increase the value of grid services. Regulators should consider requests to allow LDC/DSO ownership and cost recovery for communication-enabled EVSE and the use of intelligent technology to manage distribution networks, and grant them where it is in the public interest.
At the same time, cost recovery incentives should not be deployed to encourage spending on assets, such as EVSE, that are at risk of being underutilized.
Objectives: Limit impacts; realize benefits; expand incentives; avoid stranded costs
Regulatory Scope: Regional, State
Adopt policies to control GHG emissions. Decarbonization policies place an economic value on GHG reductions, increasing the size of the potential incentive pool for EV owners. Charging an EV produces varying amounts of GHG emissions, ranging down to zero GHGs from renewable electricity, giving them an inherent advantage over ICE vehicles. Stricter policies to control transportation sector GHGs, therefore, may increase the value of environmental benefits from EVs. However, GHG reduction policies applied to the electric sector may increase electricity costs, cutting into the cost savings for EV owners.
A GHG strategy needs to provide:
Incentives for low-GHG electric power generation
Incentives for car buyers to purchase low-GHG-emitting vehicles
Incentives for car owners to choose charging strategies that minimize GHG emissions
One policy approach is to cap or tax GHG emissions from electric power generation, to reduce GHG emissions from the power sector; under such a scheme, the GHG costs of power generation should be reflected in power prices, to provide EV owners an incentive to charge from the available power sources with the lowest GHG intensity. Complementary policies should simultaneously impose fees on high GHG-emitting vehicles and provide credits to EVs to offset the increase to electricity costs. (The same effect can be achieved through a cap on transportation fuel carbon intensity, but this approach is difficult to implement.)
As discussed in the report, existing GHG passenger vehicle standards tend to credit EVs for having zero vehicle emissions. In the near term, such a policy creates a valuable incentive for EV adoption, but does not reflect the true emissions impacts of vehicle charging. Over the longer term, vehicle GHG standards should be revised to reflect the true emissions from charging.
A range of other policies, such as energy efficiency requirements, renewable energy standards, and generation or emission performance standards, can create incentives for low-GHG electricity. If these policies raise the price of power, they will cut into EVs’ operating cost advantages, and vice versa.
Electric Vehicle Grid Integration in the U.S., Europe, and China Page | 52
Given the interrelated nature of upstream and downstream GHG emissions policies, regulation should be coordinated across governance levels and sectors to minimize trade-offs, emissions leakage, and other unintended consequences, and to ensure that the net effects on EV adoption are anticipated and understood.
Objectives: Realize benefits; expand incentives
Regulatory Scope: Federal, regional, state
Adopt an inclusive approach to energy resource planning. It is important to ensure that energy resource planning, procurement, and investment are compatible with public policies that address system reliability, affordability, air quality, and GHG reduction, and do not provide unfair advantage to incumbent sources of generation.
This has two implications. First, market rules are needed to avoid committing resources to inflexible carbon-intensive resources that may, in the absence of public policy considerations, be considered “least cost” resources. This can be avoided through incentives that value the electric system and societal benefits of alternative system resources, and support market participation by a range of providers, including resource aggregators. Second, long-term electricity demand projections should be calibrated to EV rollout scenarios, to ensure long-term investment in adequate distribution infrastructure for vehicle charging.
Administrative resource planning, as found in regulated markets in the U.S. and China, makes this policy easier to implement, but regulated markets do not offer the benefits of competitive procurement and non-generator market participation. In deregulated markets, rules that govern long-term planning and investment should follow principles of openness and non-discrimination.
Objectives: Limit impacts; realize benefits; expand incentives
Regulatory Scope: Regional, State
Promote lower energy use, and rates, through decoupling. Regulated entities that earn profits on energy sales have an incentive to sell more electricity, which can drive up energy costs for EV owners and reduce the cost savings vs. ICE vehicles. Policies to separate utility earnings from energy sales, and reward energy and cost efficiencies, can reverse this incentive. Many markets within the U.S. and EU have already taken this step.
Objectives: Limit impacts; expand incentives
Regulatory Scope: Regional, state
Electric Vehicle Grid Integration in the U.S., Europe, and China Page | 53
Establish a long-term strategy to integrate EVs into road user fees. In the short run, preserve the implicit road tax exemption for EV owners by minimizing road use EV surcharges. Meanwhile, launch an effort to identify the best approach to integrating EV use into tax policy in a way that recognizes the societal benefits of EVs as well as the costs of road use, to level the playing field with ICE vehicles.
Objectives: Limit impacts; realize benefits; expand incentives
Regulatory Scope: Federal, State
Secondary Policy Recommendations
Stimulate prudent research and development activity. Widespread EV adoption is contingent on vehicles being able to meet drivers’ cost and range expectations. Longer-range, cheaper vehicles and shorter charging times would meet the daily driving needs of more drivers. Avoid preferential/protectionist funding, which can lead to less efficient use of subsidy funds.
Objectives: Realize benefits; avoid stranded costs
Regulatory Scope: Federal, State
Harmonize EVSE and EV standards; include advanced communication capability. Government entities overseeing standard-setting for vehicle charging should accommodate communication to enable controlled charging and meter electricity flows between the vehicle and the grid. Greater harmonization of charging standards will also simplify the task of writing new market rules that allow EVs to provide grid services.
Objectives: Limit impacts; realize benefits; expand incentives
Regulatory Scope: Federal, State, Regional
Consider EV charging incentives “elsewhere” on the bill. Beyond TOU pricing, specific reductions to transmission costs, capacity charges, environmental surcharges, and/or electricity taxes could be used to promote off-peak charging and recognize the specific locational benefits of individual off-peak electricity use, compared to on-peak.
The potential size of this incentive varies based on the underlying costs on the electricity bill. For example, in the EU, where electricity taxes are higher than in the U.S., the incentive could be relatively large.
Objectives: Limit impacts; expand incentives
Regulatory Scope: State, Regional
Electric Vehicle Grid Integration in the U.S., Europe, and China Page | 54
Establish customer relationship guidelines, or amend existing ones, to address issues raised by EV ownership. New data privacy issues may arise when utilities have access to customer driving behavior. In addition, a range of outside service providers, such as car dealers, EVSE contractors and grid services aggregators, will play a central role in establishing new EV customer accounts, by deploying the necessary equipment and contractual arrangements. Taking a proactive approach to working out these issues will minimize the risk that confusion, mistrust, or fraud could lead to slow EV uptake.
Objectives: Limit impacts
Regulatory Scope: State, Regional
Promote alternatives to high capacity public DC charging. As a matter of policy, promoting a dominant charging strategy of high capacity EVSE conflicts with the objective to limit negative grid impacts and realize the potential grid benefits. Lower capacity, off-peak charging offers lower charging costs to consumers and reduces peak load, and because of the longer charge times, provides greater opportunity for vehicles to provide grid services.
Many public funding programs for EVSE have focused on high capacity DC charging because it most closely resembles the conventional filling station model. But low utilization of this equipment leads to stranded assets. Other approaches may offer more sensible ways to use public resources, for example:
Streamline zoning and permitting processes to facilitate siting of privately-owned EVSE
Study and analyze transportation behavior and coordinate with regional urban planning efforts to identify optimal EVSE locations
Encourage EVSE investment by the private sector, including by LDCs/DSOs where appropriate
In areas where dedicated parking is scarce, analyze the tradeoffs between high capacity charging, EV adoption rates, and costs. Where the economics are justified, battery swapping may be explored as an option, although it faces steep hurdles in implementation.
Policies should encourage or require private sector players to assume the risks of large capital investments.
Objectives: Limit impacts; realize benefits; expand incentives; avoid stranded costs.
Regulatory Scope: Federal, State, Regional
Glossary of Terms
Aggregator – A term used in this report to refer to a company that serves as a middleman between EV owners
and electric providers, managing the flow of electricity between EVs and the grid. In mature demand response
markets, aggregators are known as demand response providers, curtailment service providers, or capacity
service providers.
Ancillary Services – Services, such as frequency regulation and spinning reserves, that are needed to support
the transmission of electric power on the grid while maintaining stable voltage and frequency. Ancillary
services perform a short-term balancing function to help ensure reliable grid operations.
Automatic Generation Control (AGC) – A system for adjusting the power output of generation sources
automatically in response to changes in load; these changes are detected through changes in electric system
frequency and the AGC system triggers a proportional response within a given generating unit.
Baseload – The minimum amount of power that utilities must generate to meet customer demand. Since this
minimum demand is always present, baseload generating resources tend to run almost continuously.
Battery Electric Vehicle (BEV) – Grid-connected vehicles that use only a rechargeable battery to store electrical
energy, which powers the motor. They have no fuel tank or internal combustion engine and do not combust any
fuel directly; instead, they are charged, when stationary, through a connection to an external generator.
Battery Swapping – An automated process in which a BEV’s depleted battery is replaced with a charged
battery. The depleted battery remains at the battery swapping station for recharging while the vehicle leaves
with a fully charged battery.
Bi-directional Power Flow – The movement of electricity both from the grid to a vehicle (G2V), and from a
vehicle to the grid (V2G). Since power would never flow only from a vehicle to the grid, V2G is used in this
report to denote bi-directional flow capabilities.
Bulk Power Market – An organized market in which electricity produced by power plants is sold to utilities,
large commercial or industrial customers, power marketers, and other entities that will consume or re-sell the
power.
Congestion Costs – In electric power transmission, a market-based mechanism in which transmission costs
increase when power lines are at or near capacity. Congestion costs are used to send a price signal that indicates
scarce capacity and high demand for transmission.
Conventional Gasoline Vehicle/Internal Combustion Engine (ICE) Vehicle – A vehicle that relies on gasoline
or diesel fuel as its sole source of fuel to power an internal combustion engine.
Criteria Pollutant – One of six common air pollutants regulated by the U.S. EPA, including carbon monoxide,
lead, nitrogen oxides, particulate matter, ozone, and sulfur dioxide.
Decoupling – A policy reform that separates a utility’s revenue from the amount of electricity it sells.
Decoupled utilities collect revenue based on a set regulatory determinant, often the number of customers, rather
than on the amount of electricity sold.
Demand Response – A broad term to describe actions to adjust electricity use in response to incentives or
changes in prices. Most existing demand response programs reward customers who curtail energy use during
times when peak electricity demand approaches available supply.
Distribution System Operator (DSO) – In Europe, a company responsible for maintaining local distribution
infrastructure, and providing transmission services to energy retailers. See also Local Distribution Company.
Electric Vehicle Supply Equipment (EVSE) – The circuitry, connector, and related computer hardware that
connects to an EV and supplies it with electricity.
Frequency – A measurement of the rate of oscillations of alternating current in the grid, measured in hertz (Hz).
Electric Vehicle Grid Integration in the U.S., Europe, and China Page | 56
Frequency Regulation – A function, typically performed by a power plant, which system operators use to
maintain a target frequency on a power grid. When signaled, a frequency-regulating unit will either increase or
decrease its output or load to re-balance system frequency.
Fuel Economy – A measure of the distance a vehicle can travel on a set amount of fuel, measured in miles per
gallon (MPG) in the U.S., and liters per 100 kilometers in Europe and China.
Greenhouse Gas (GHG) – A gas that traps heat in the Earth’s atmosphere by absorbing infrared radiation. The
most common GHG produced by fossil fuel burning vehicles is carbon dioxide.
Grid to Vehicle (G2V) – A one way connection through which a vehicle draws power from the grid.
High Capacity Charging – EV charging at high voltages and currents using direct current power supply. High
capacity charging allows vehicle owners to add large amounts of energy to a battery more quickly than through
other charging methods.
Hybrid Electric Vehicles (HEVs) – Vehicles that are powered by a combination of an electric motor and an
internal combustion engine (ICE). Most HEVs are gasoline-electric hybrids, which use gasoline to fuel an ICE,
and can also run on an electric motor using power from an on-board battery, which is charged by the engine and
by converting mechanical energy from braking into electricity. This is known as “regenerative braking.”
Load Curve – A depiction of electricity demand over time. Load curves show patterns in electricity demand and
allow generators to predict the amount of supply needed at different times of the day and year.
Load-following – A load following generator adjusts its power output throughout the day based changes in
demand, following the load curve. Load following plants often stop generating at night when demand for
electricity is at its lowest.
Local Distribution Company (LDC) – In the U.S., a company responsible for maintaining local distribution
infrastructure and providing transmission services to energy retailers. An LDC may also provide retail service
to customers. See also Distribution System Operator.
Marginal Emissions – The increase in emissions that would result from the additional electric power generation
if system load were to increase by a measurable unit (e.g., a one kilowatt increase).
Peak/off-peak – the peak period of the electric day is the time before and after electricity demand reaches its
daily maximum. Periods outside of the peak hours are considered off-peak. System operators also track peaks
over longer time periods, e.g. weeks, months, or seasons.
Plug-in hybrid electric vehicle (PHEV) – A PHEV is a hybrid electric vehicle that can be plugged into the grid
to add charge to the on-board batteries.
Public Utility Commission (PUC) – A government entity that regulates the rates and services of public utilities.
Ramp Rate – The speed at which a generation source can increase its power output, measured in MW per
minute.
Regional Transmission Organization (RTO) – An organization that coordinates, monitors, and controls a large,
interstate electric transmission network.
Reserve Margin – The amount of installed generating capacity exceeding forecasted peak load.
Smart Charging/Controlled Charging – EV charging that is influenced by both electricity prices and grid
conditions. Using this approach, grid operators can influence when EVs are drawing power from the grid.
Spinning Reserves – Generation resources that are kept on standby and are able to provide capacity to the grid
when called by the system operator.
Time-of-Use (TOU) – A type of electricity tariff that varies depending on the time of day. Under time-of-use
rates, electricity prices reflect the underlying costs of generation.

Electric Vehicle Grid Integration in the U.S., Europe, and China Page | 57
Uncontrolled Charging – Charging with full EV user discretion, when little or no information is available about
the price of electricity. With uncontrolled charging, the owner decides when to plug in, and the charger draws
maximum power from point of plug-in until the charge is complete.
Utility – A company that is capable of providing some combination of electricity generation, transmission,
distribution, and retail service. The exact nature of what a utility provides is determined by the prevailing
regulatory structure in a given region.
Variable Energy Resources (VERs) – Generating resources, such as wind and solar facilities, whose output is
sensitive to uncontrollable factors such as fluctuations in wind or solar energy.
Vehicle to Grid (V2G) – A two way connection through which power can flow from the grid to a vehicle and
from a vehicle back to the grid.

Electric Vehicle Grid Integration in the U.S., Europe, and China Page | 58
Endnotes
Note: Unless otherwise stated, all links were most recently accessed during May 2013.
1 Fuel economy is provided in miles per gallon equivalent, or MPGe. Data are drawn from manufacturer websites or other sources as
noted. MPGe is calculated based on an assumption of 33.7 kWh of electric energy equivalent in one gallon of gasoline. For PHEVs,
numbers show electric-only efficiency. 2 “BYD E6 Electric taxis hit roads in south China city,” Electric Vehicle News, May 18, 2010. http://www.electric-
vehiclenews.com/2010/05/byd-e6-electric-taxis-hit-roads-in.html (Accessed July 1, 2013.) 3 BYD Company Ltd., “BYD e6 Vehicle Guide.” http://www.byd.com/na/auto/e6.html (Accessed July 1, 2013.) 4 Chevrolet, “2013 Volt Models & Specs.” http://www.chevrolet.com/volt-electric-car/features-specs/options.html (Accessed July 1,
2013.) 5 U.S. DOE. “FuelEconomy.gov: Find and Compare Cars,” updated May 31, 2013. http://www.fueleconomy.gov/feg/findacar.shtml
(Accessed July 1, 2013.) 6
Chevrolet, “2014 Spark EV: Model Overview.” http://www.chevrolet.com/spark-ev-electric-vehicle.html (Accessed July 1, 2013.) 7 Fiat USA, “2013 Fiat 500e Overview.” http://www.fiatusa.com/en/2013/500e/ (Accessed July 1, 2013.) 8 Ford, “2013 C-Max Specifications.” http://www.ford.com/cars/cmax/specifications/engine/ (Accessed July 1, 2013.) 9 Ford, “2013 Focus Electric.” http://www.ford.com/cars/focus/trim/electric/ (Accessed July 1, 2013.) 10 Ford, “2013 Fusion Specifications (Hybrid Model.)” http://www.ford.com/cars/fusion/specifications/engine/ (Accessed July 1, 2013.) 11 Honda, “Fit EV Specifications.” http://automobiles.honda.com/fit-ev/specifications.aspx (Accessed July 1, 2013.) 12 Mia Electric. “Mia Electric Brochure.” http://www.mia-electric.com/sites/www.mia-voiture-
electrique.com/files/brochure_44pages_en_light_0.pdf (Accessed July 1, 2013.) 13 Mitsubishi, “2012 Mitsubishi i-MiEV Overview.” http://i.mitsubishicars.com/miev/charging/battery (Accessed July 1, 2013.) 14 U.S. DOE. “FuelEconomy.gov: Find and Compare Cars,” updated May 31, 2013. http://www.fueleconomy.gov/feg/findacar.shtml
(Accessed July 1, 2013.) 15 Nissan, “Nissan Leaf: Features and Specifications.” http://www.nissanusa.com/ev/media/pdf/specs/FeaturesAndSpecs.pdf (Accessed
July 1, 2013.) 16 Vauxhall UK, “Vauxhall Ampera: Specifications.” http://www.vauxhall.co.uk/vehicles/vauxhall-
range/cars/ampera/specifications/overview.html (Accessed July 1, 2013.) 17 “Renault features production version of ZOE, Twizy EV at Geneva,” Green Car Congress, March 9, 2012.
http://www.greencarcongress.com/2012/03/zoe-20120309.html (Accessed July 1, 2013.) 18 Renault, “Renault ZOE.” http://www.renault.com/en/vehicules/aujourd-hui/renault-vehicules-electriques/pages/zoe.aspx (Accessed
July 1, 2013.) 19 Renault, “Renault Fluence Z.E.” http://www.renault.com/en/vehicules/aujourd-hui/renault-vehicules-electriques/pages/fluence-ze.aspx
(Accessed July 1, 2013.) 20 Tesla Motors, “Models: Facts.” http://www.teslamotors.com/models/facts (Accessed July 1, 2013.) 21 Toyota, “Prius Plug-In Hybrid 2013.” http://www.toyota.com/prius-plug-in/#!/Welcome (Accessed July 1, 2013.) 22 Toyota, “RAV4 EV 2013.” http://www.toyota.com/rav4ev (Accessed July 1, 2013.) 23 Seasonal variation exists where water is needed for use in hydropower generation or cooling of fossil generators. The operating
capacity of a given generating unit also fluctuates based on ambient temperature (for fossil generation), as well as wind and solar
radiation (for wind and solar generators). 24 Natural Resources Defense Council, “The Next Generation of Hybrid Cars,” July 2007. http://www.nrdc.org/energy/plugin.pdf 25 Sioshansi, R., and P. Denholm, “Emissions Impacts and Benefits of Plug-In Hybrid Electric Vehicles and Vehicle-to-Grid Services,”
Environ. Sci. Technol., 43(4):1199–1204, January 2009. 26 “Spinning reserves” are generation resources that are kept on standby and are able to provide capacity to the grid when called by the
system operator. “Frequency regulation” is a service, typically provided by a power plant, which system operators use to maintain a
target frequency on a power grid. Signaled, a frequency-regulating unit will either increase or decrease its output or load to re-balance
system frequency. 27 Sioshansi, R., and P. Denholm, “Emissions Impacts and Benefits of Plug-In Hybrid Electric Vehicles and Vehicle-to-Grid Services,”
Environ. Sci. Technol., 43(4):1199–1204, January 2009. 28 Huo, H., Q. Zhang, M.Q., Wang, et al., “Environmental Implication of Electric Vehicles in China,” Environmental Science &
Technology, 44(13): 4856-4861, July 2010. 29 U.S. EPA, “Inventory of U.S. Greenhouse Gas Emissions and Sinks: 1990-2011,” April 12, 2013.
http://www.epa.gov/climatechange/Downloads/ghgemissions/US-GHG-Inventory-2011.pdf 30 U.S. EPA, “Global Greenhouse Gas Emissions Data,” updated June 21, 2013.
http://www.epa.gov/climatechange/ghgemissions/global.html (Accessed July 1, 2013.) 31 Traut, E., C. Hendrickson, E. Klampfi, et al., “Optimal design and allocation of electrified vehicles and dedicated charging
infrastructure for minimum lifecycle GHG emissions and cost,” Energy Policy, 51:524–534, December 2010. 32 Union of Concerned Scientists, “State of Charge: Electric Vehicles’ Global Warming Emissions and Fuel-Cost Savings across the
United States,” June 2012. http://www.ucsusa.org/assets/documents/clean_vehicles/electric-car-global-warming-emissions-report.pdf 33 EPRI and NRDC, “Environmental Assessment of Plug-In Hybrid Electric Vehicles: Volume 1: Nationwide Greenhouse Gas
Emissions,” July 2007. http://www.electricdrive.org/index.php?ht=a/GetDocumentAction/id/27936

Electric Vehicle Grid Integration in the U.S., Europe, and China Page | 59
34 Elgowainy, A., J. Han, L. Poch, et al. (Argonne National Laboratory), “Well-to-Wheels Analysis of Energy Use and Greenhouse Gas
Emissions of Plug-In Hybrid Electric Vehicles,” June 2010. http://www.afdc.energy.gov/pdfs/argonne_phev_evaluation_report.pdf 35 Huo, H., Q. Zhang, M.Q., Wang, et al., “Environmental Implication of Electric Vehicles in China,” Environmental Science &
Technology, 44(13): 4856-4861, July 2010. 36 Royal Academy of Engineering, “Electric Vehicles: Charged with Potential,” May 2010.
http://www.raeng.org.uk/news/releases/shownews.htm?NewsID=566 37 U.S. EIA, “How dependent are we on foreign oil?” Energy in Brief, May 13, 2013.
http://www.eia.gov/energy_in_brief/article/foreign_oil_dependence.cfm (Accessed July 1, 2013.) 38 U.S. EIA, Annual Energy Review 2011, September 2012. http://www.eia.gov/totalenergy/data/annual/index.cfm#petroleum (Accessed
July 1, 2013.) 39 U.S. DOE, “The Costs of Oil Dependence,” Vehicle Technologies Office: Fact of the Week, July 19, 2010.
http://www1.eere.energy.gov/vehiclesandfuels/facts/m/2010_fotw632.html (Accessed 1 Jul 2013.) 40 Crane, K., A. Goldthau, M. Toman, et al. Imported Oil and U.S. National Security. Santa Monica: Rand Corporation, 2009.
http://www.rand.org/content/dam/rand/pubs/monographs/2009/RAND_MG838.pdf 41 For example, the institutions that are responsible for assuring resource adequacy in New York State include the New York State
Reliability Council (NYSRC), the Northeast Power Coordinating Council (NPCC), the North American Electric Reliability Corporation
(NERC), the New York Independent System Operator (NYISO), the New York Public Service Commission (NYPSC), and the Federal
Energy Regulatory Commission (FERC). 42 Hurley, D., P. Peterson, and M. Whited, “Demand Response as a Power System Resource: Program Designs, Performance, and
Lessons Learned in the United States,” Synapse Energy Economics, March 29, 2013. http://www.synapse-
energy.com/Downloads/SynapseReport.2013-03.RAP.US-Demand-Response.12-080.pdf 43 NERC provides a useful resource for comparing ancillary services definitions among the U.S. grid operators, available at:
http://www.nerc.com/docs/pc/ivgtf/NERC_ancillary_services%20ERCOT%20IESO%20NYISO%20MISO%20PJM%20SPP%20WECC
%2012%2014.pdf (accessed June 24, 2013). Elia, the Belgian grid operator, provides clear definitions of primary, secondary, and tertiary
reserves on their website: http://www.elia.be/en/products-and-services/ancillary-services (accessed June 24, 2013). 44 Tomić, J., and W. Kempton, “Using fleets of electric-drive vehicles for grid support,” Journal of Power Sources, 168:459-468, March
2007. 45 When used to provide ancillary services, the grid operator would reduce the amount of energy flowing to the EV charger to some level
lower than maximum capacity, as needed for a short time during peak demand periods. When total demand fell below some threshold,
energy to the charger would be increased. 46 Morgan, T., “Smart grids and electric vehicles: Made for each other?”, International Transport Forum, April 11, 2012.
http://www.internationaltransportforum.org/jtrc/DiscussionPapers/DP201202.pdf 47 Tomić, J., and W. Kempton, “Vehicle-to-grid power fundamentals: Calculating capacity and net revenue,” Journal of Power Sources,
144:268-279, June 2005. 48 Denholm, P. and W. Short, “An Evaluation of Utility System Impacts and Benefits of Optimally Dispatched Plug-In Hybrid Electric
Vehicles,” NREL Technical Report, October 2006.
http://www.lifepo4.info/Battery_study/Reports/An_Evaluation_of_Utility_System_Impacts_and_Benefits_of_Optimally_Dispatched_Pl
ug-In_Hybrid_Electric_Vehicles.pdf 49 Clean Energy Ministerial, “Electric Vehicles Initiative.”
http://www.cleanenergyministerial.org/OurWork/Initiatives/ElectricVehicles.aspx (Accessed May 29, 2013.) 50 Bureau of Transportation Statistics, “Table 1-11: Number of U.S. Aircraft, Vehicles, Vessels, and Other Conveyances,” U.S.
Department of Transportation.
http://www.rita.dot.gov/bts/sites/rita.dot.gov.bts/files/publications/national_transportation_statistics/html/table_01_11.html (Accessed
July 1, 2013.) 51 European Automobile Manufacturers’ Association, The Automobile Industry Pocket Guide 2012, September 19, 2012.
http://www.acea.be/index.php/files/acea_pocket_guide_2012 52 “Car drivers in China exceeds 200 mln,” Xinhua News Agency, January 30, 2013. http://news.xinhuanet.com/english/china/2013-
01/30/c_132139570.htm (Accessed July 1, 2013.) 53 Eurostat, “Transport statistics at regional level,” updated June 24, 2013. Available at:
http://epp.eurostat.ec.europa.eu/statistics_explained/index.php/Transport_statistics_at_regional_level (Accessed July 1, 2013.) 54 “German Automotive Sales in 2012 Buoyed by Corporate Fleets,” Automotive Fleet, January 9, 2013. http://www.automotive-
fleet.com/news/story/2013/01/german-automotive-market-buoyed-by-corporate-fleets.aspx (Accessed July 1, 2013.) 55 “Shenzen, China Launches the World’s Largest Electric Vehicle Fleet,” China Bus, June 13, 2012.
http://www.chinabuses.org/news/2012/0613/article_5484.html (Accessed July 1, 2013.) 56 Sasin, J., “China Still Gaining Speed on its e-Vehicle Programs,” Shenzhen Standard, April 27, 2012. http://www.shenzhen-
standard.com/2012/04/27/china-still-gaining-speed-on-its-e-vehicle-programs/ (Accessed July 1, 2013.) 57 Ingram, A., “BYD e6 Chinese Electric Car Won't Be Sold To Consumers In U.S.” Green Car Reports, April 8, 2012.
http://www.greencarreports.com/news/1084033_byd-e6-chinese-electric-car-wont-be-sold-to-consumers-in-u-s (Accessed May 11,
2013.) 58 U.S. Department of Transportation, “Summary of Travel Trends: 2009 National Household Travel Survey,” June 2011.
http://nhts.ornl.gov/2009/pub/stt.pdf

Electric Vehicle Grid Integration in the U.S., Europe, and China Page | 60
59 Pasaoglu, G., D. Fiorello, A. Martino, et al., “Driving and parking patterns of European car drivers - a mobility survey,” Luxembourg:
European Commission Joint Research Centre, 2012.
http://publications.jrc.ec.europa.eu/repository/bitstream/111111111/26994/1/driving%20and%20parking%20patterns%20-
%20final_online.pdf 60 UK Department for Communities and Local Government, “Statistical data set: Housing stock summary,” December 19, 2012.
https://www.gov.uk/government/statistical-data-sets/housing-stock-summary (Accessed July 1, 2013.) 61 U.S. Census Bureau, “2011 American Housing Survey: Table C-02-AH: Rooms, Size, and Amenities - All Housing Units,” revised
May 16, 2013. http://factfinder2.census.gov/faces/tableservices/jsf/pages/productview.xhtml?pid=AHS_2011_C02AH&prodType=table
(Accessed July 1, 2013.) 62 “Beijing’s Parking Problem,” editorial, China Daily Europe, April 2, 2011. http://europe.chinadaily.com.cn/opinion/2011-
04/02/content_12270087.htm (Accessed July 2, 2013.) 63 World Bank and PRTM Management Consultants, “The China New Energy Vehicles Program: Challenges and Opportunities.” April
2011. http://www-
wds.worldbank.org/external/default/WDSContentServer/WDSP/IB/2011/04/20/000356161_20110420054039/Rendered/PDF/612590W
P0PRTM01BOX358342B01PUBLIC11.pdf 64 “No Parking,” The Economist, March 24, 2012. http://www.economist.com/node/21551084 (Accessed 2 Jul 2013.) 65 Liu, J., “Electric Vehicle Charging Infrastructure Assignment and Power Grid Impacts Assessment in Beijing,” Energy Policy 51:544-
557, December 2012. 66 Pearre, N.S., W. Kempton, R.L. Guensler, et al., “Electric vehicles: How much range is required for a day’s driving?”, Transportation
Research Part C 19:1171–1184, December 2011. 67 K. Bodek and J. Heywood, “Europe’s Evolving Passenger Vehicle Fleet: Fuel Use and GHG Emissions Scenarios through 2035,”
Massachusetts Institute of Technology, March 2008. http://web.mit.edu/sloan-auto-
lab/research/beforeh2/files/Europe's%20Evolving%20Passenger%20Vehicle%20Fleet.pdf 68 Li, Z. and M. Ouyang, “The pricing of charging for electric vehicles in China—Dilemma and solution,” Energy 36(9): 5765–5778,
September 2011. 69 Liu, J., “Electric Vehicle Charging Infrastructure Assignment and Power Grid Impacts Assessment in Beijing,” Energy Policy 51:544-
557, December 2012. 70 World Bank, “Pump price for gasoline (US$ per liter),” http://data.worldbank.org/indicator/EP.PMP.SGAS.CD (Accessed July 2,
2013). 71 U.S. EIA, “Gasoline and Diesel Fuel Update,” July 1, 2013. http://www.eia.gov/petroleum/gasdiesel/ (Accessed July 2, 2013.) 72 Europe’s Energy Portal, “Fuel Prices,” http://www.energy.eu/ (Accessed July 2, 2013.) 73 See, for example, recent work by David Greene at the Oak Ridge National Laboratory (ORNL),
http://cta.ornl.gov/cta/staff_GreeneDL.shtml, and background work by EPA and NHTSA on new GHG/CAFÉ standards,
http://www.epa.gov/otaq/climate/regulations.htm . 74 SAE International, “SAE Charging Configurations and Ratings Terminology,” 2011. http://www.sae.org/smartgrid/chargingspeeds.pdf 75 CHAdeMO, “Brochure,” March 27, 2013, http://www.chademo.com/wp/wp-content/uploads/2013/04/Brochureshort20130327.pdf 76 “Renewables share of Denmark's power tops 40 pct,” Reuters, September 25, 2012.
http://www.reuters.com/article/2012/09/24/denmark-renewables-idUSL5E8KO8CV20120924 77 Digges, C., “France vows to lower nuclear dependence to 50 percent by 2025, and commits to new emissions cuts,” Bellona,
September 17, 2012, http://www.bellona.org/articles/articles_2012/france_nuke_cuts (Accessed July 2, 2013.) 78 Groebel, A., “The regulation of German energy markets and its European dimension,” Presentation to Bundesnetzagentur (German
Federal Network Agency), June 28, 2012. http://www.bruegel.org/fileadmin/bruegel_files/Events/Event_materials/120629_2012-06-
28_Bruegel_Brussels_Groebel_BNetzA.pdf 79 ISO New England, “2012 Fourth Quarter Markets Report,” February 15, 2013. http://www.iso-
ne.com/markets/mkt_anlys_rpts/qtrly_mktops_rpts/2012/q4_2012_qmr_final.pdf 80 An, G. and N. Xu. “Beijing seeks to kill coal with gas,” China Dialogue, July 9, 2012.
http://www.chinadialogue.net/article/show/single/en/5031-Beijing-seeks-to-kill-coal-with-gas (Accessed July 2, 2013.) 81 The discussion in this section pertains mainly to regulated investor-owned utilities (IOUs), which are the largest electricity providers
in the U.S. and EU. Different considerations apply to government- and municipally-owned utilities, which are managed by governments
and/or independent management boards and are generally not subject to the same regulatory oversight. However, many of the same
policy ideas that apply to regulated IOUs could also be applied by government or municipal utilities. 82 Electric Power Research Institute, “Texas Plugs In: Houston and San Antonio Residents’ Expectations of and Purchase Intentions for
Plug-In Electric Vehicles,” September 2012. http://assets.fiercemarkets.com/public/sites/energy/reports/texasplugins.pdf 83 Federal Energy Regulatory Commission, “FY 2014 Congressional Performance Budget Request,” April 2013.
http://www.ferc.gov/about/strat-docs/fy14-budg.pdf 84 European Commission, “Energy Markets in the European Union in 2011,” Luxembourg: Publications Office of the European Union,
2012. http://ec.europa.eu/energy/gas_electricity/doc/20121217_energy_market_2011_lr_en.pdf 85 Nordic Energy Regulators, “Economic regulation of TSOs in the Nordic countries,” December 2012.
https://www.nordicenergyregulators.org/upload/Reports/TSO_report.pdf 86 Poblocka, A., R. Brückmann, R. Piria, et al. “Integration of electricity from renewables to the electricity grid and to the electricity
market: National report: Denmark,” December 20, 2011. http://www.eclareon.eu/sites/default/files/denmark_-
_res_integration_national_study_nreap.pdf

Electric Vehicle Grid Integration in the U.S., Europe, and China Page | 61
87 Danish Energy Association, “Statistical Survey 2009,” August 24, 2010.
http://www.danishenergyassociation.com/~/media/Energi_i_tal/Statistik_09_UK.ppt.ashx 88 European Commission Eurostat, “Energy price statistics: Electricity prices for household consumers,” August 2012.
http://epp.eurostat.ec.europa.eu/statistics_explained/index.php/Energy_price_statistics#Electricity_prices_for_household_consumers 89 Fages, F. and M. Saarinen, “France,” in Energy Regulation and Markets Review (D.L. Schwartz, ed.), London: Law Business
Research Ltd, 2012. http://www.lw.com/thoughtLeadership/energy-regulation-markets-review-france-2012 90 Market Observatory for Energy of the EU, “January 2012-March 2012,” Quarterly Report on European Electricity Markets, 5(1).
http://ec.europa.eu/energy/observatory/electricity/doc/qreem_2012_quarter1.pdf 91 MacGuill, D., “Electricity bills in France set to rocket,” The Local: France, February 19, 2013. Available at
http://www.thelocal.fr/20130219/french-electricity-bills-set-to-rocket#.UVSQf1_D8dU (Accessed July 2, 2013.) 92 Germany Trade and Invest, “The German Electricity Market - A Brief Overview,” 2013.
http://www.gtai.de/GTAI/Navigation/EN/Invest/Industries/Smarter-business/Smart-energy/germanys-energy-concept,did=622868.html
(Accessed July 2, 2013.) 93 TenneT, “About Electricity: Transmission System Operators,” 2013. http://www.tennet.eu/de/en/about-tennet/about-
electricity/transmission-system-operators.html (Accessed July 2, 2013.) 94 Bundesnetzagentur, Annual Report 2011, May 4, 2012.
http://www.bundesnetzagentur.de/SharedDocs/Downloads/EN/BNetzA/PressSection/ReportsPublications/2012/AnnualReport2011pdf.p
df;jsessionid=561558F7C583678B7BE423695465D5CB?__blob=publicationFile 95 Bundesnetzagentur, “Responsibility and Task Delimitation,” October 4, 2005.
http://www.bundesnetzagentur.de/EN/Areas/Energy/Companies/GeneralInformationOnEnergyRegulation/ResponsibilityAndTaskDelimi
tation/responsibilityandtaskdelimitation_node.html (Accessed July 2, 2013.) 96 Ernst & Young, “The European Generation Mix,” 2006.
http://www2.eycom.ch/publications/items/utilities/european_generation_mix/2006_ey_generation_mix.pdf 97 European Commission Eurostat, “Electricity and natural gas price statistics,” May 2013.
http://epp.eurostat.ec.europa.eu/statistics_explained/index.php/Electricity_and_natural_gas_price_statistics (Accessed July 2, 2013.) 98 “Tilting at windmills,” The Economist, June 15, 2013. http://www.economist.com/news/special-report/21579149-germanys-
energiewende-bodes-ill-countrys-european-leadership-tilting-windmills (Accessed July 2, 2013.) 99 González, A. and T. Rucinski, “Spain unveils fresh energy reforms that hit renewables,” Reuters, February 1, 2013.
http://www.reuters.com/article/2013/02/01/spain-energy-idUSL5N0B1B5J20130201 (Accessed July 2, 2013.) 100 Sonvilla, P.M., R. Piria, E.B. Zane, et al., “Integration of electricity from renewables to the electricity grid and to the electricity
market: National report: Spain,” March 14, 2012. http://www.eclareon.eu/sites/default/files/spain_-
_res_integration_national_study_nreap.pdf 101 European Commission Eurostat, “Electricity prices for household consumers,” February 18, 2013.
http://epp.eurostat.ec.europa.eu/statistics_explained/index.php/File:Electricity_prices_for_households_consumers.png (Accessed July 2,
2013.) 102 Laya, P., “Spain Sets Higher Electricity Prices After Government Auction,” Bloomberg, December 21, 2012.
http://www.bloomberg.com/news/2012-12-21/spain-sets-higher-electricity-prices-after-government-auction.html (Accessed July 2,
2013.) 103 Energy Realities, “Spain electricity: Power currents,” January 9, 2012.
http://www.energyrealities.org/detail/spain-electricity-power-currents/erpFA8A685015A17FC44 (Accessed July 2, 2013.) 104 Cao, Y., S. Tang, C. Ling, et al., “An Optimized EV Charging Model Considering TOU Price and SOC Curve,” IEEE Transactions
on Smart Grid 3(1):388-393, March 2012. 105 Lehman, E.E. and A.S.B. de Nobili, “China,” in Getting the Deal Through - Electricity Regulation 2009 (E.H. O’Donnell, ed.),
London: Law Business Research Ltd, 2009.
http://www.lehmanlaw.com/fileadmin/lehmanlaw_com/Publications/getting_the_deal_through-electricity_regulation_2009-
china_chapter.pdf 106 International Energy Agency, “Spain - Policies and Legislation,” IEA Hybrid & Electric Vehicle Implementing Agreement.
http://www.ieahev.org/by-country/spain-policy-and-legislation (Accessed July 2, 2013.) 107 Diem, W. “France Applies Pressure to Build EV Infrastructure,” WardsAuto, October 12, 2012. http://wardsauto.com/politics/france-
applies-pressure-build-ev-infrastructure (Accessed July 2, 2013.) 108 The GWSA set GHG reduction goals of 25 percent below 1990 levels by 2020, and 80 percent by 2050. 109 Bloomberg New Energy Finance, “China’s electric vehicle industry needs to raise its game on technology,” press release, October 24,
2012. http://about.bnef.com/press-releases/chinas-electric-vehicle-industry-needs-to-raise-its-game-on-technology/ (Accessed July 2,
2013.) 110 “Electric cars fail to gain traction in Germany,” The Local: Germany, May 29, 2013. http://www.thelocal.de/money/20130529-
49975.html (Accessed July 2, 2013.) 111 “China’s Electric Vehicle Development Failing to Meet Ambitious Targets,” Worldwatch Institute blog post, July 3, 2013.
http://blogs.worldwatch.org/revolt/chinas-electric-vehicle-development-failing-to-meet-ambitious-targets/ 112 “China to Phase Out Electric Vehicle Subsidies,” Environment News Service, June 20, 2013. http://ens-
newswire.com/2013/06/19/china-to-phase-out-electric-vehicle-subsidies/ 113 “China to extend subsidies for new energy cars,” China Daily, March 13, 2013. http://www.chinadaily.com.cn/business/2013-
03/13/content_16304343.htm (Accessed July 2, 2013.)

Electric Vehicle Grid Integration in the U.S., Europe, and China Page | 62
114 Han, X., “Trial of green car subsidies begins,” Universiade Shenzhen 2011, July 7, 2010.
http://www.sz2011.org/Universiade/news/shenzhen/5159.shtml 115 Zeng, J., “Subsidies for green cars not bringing expected results,” China Daily, April 1, 2013.
http://www.chinadaily.com.cn/business/motoring/2013-04/01/content_16367603_2.htm (Accessed July 2, 2013.) 116 European Automobile Manufacturers’ Association, “Overview of purchase and tax incentives for electric vehicles in the EU,” April
4, 2013. http://www.acea.be/images/uploads/files/Electric_vehicles_overview_2013.pdf 117 Jing, R., “Shanghai releases NEV subsidy details,” China Automotive Review, January 28, 2013.
http://www.chinaautoreview.com/pub/CARArticle.aspx?ID=8314 (Accessed July 2, 2013.) 118 Yabin, J., “Shanghai to issue 1st free plates for electric car,” Global Times January 20, 2013.
http://www.globaltimes.cn/content/757015.shtml (Accessed July 2, 2013.) 119 “Beijing to maintain car quota for 2013,” China Daily, January 25, 2013. http://www.chinadaily.com.cn/business/2013-
01/25/content_16173077.htm (Accessed July 2, 2013.) 120 Insero E-Mobility, “EVs exempt from registration tax until 2015,” 17 Sep 2012. http://e-
mobility.insero.com/News/Details.aspx?id=319 (Accessed July 2, 2013.) 121 “In Denmark, Ambitious Plan for Electric Cars,” New York Times Dealbook, December 2, 2009.
http://dealbook.nytimes.com/2009/12/02/in-denmark-ambitious-plan-for-electric-cars/ (Accessed July 2, 2013.) 122 International Energy Agency, “Germany - Policies and Legislation,” IEA Hybrid & Electric Vehicle Implementing Agreement.
http://www.ieahev.org/by-country/germany-policy-and-legislation/ (Accessed July 2, 2013.) 123 U.S. DOE, “Federal Laws and Incentives,” Alternative Fuels Data Center, updated July 2, 2013.
http://www.afdc.energy.gov/laws/laws/ (Accessed July 2, 2013.) 124 Iberdrola, “Iberdrola helps bring electric vehicles into the mainstream,” press release, May 6, 2011.
http://www.iberdrola.com/webibd/corporativa/iberdrola?cambioIdioma=ESMODPRENJGA11&URLPAG=/gc/prod/es/comunicacion/no
tasprensa/110506_NP_01_VehiculoElectrico.html (Accessed July 2, 2013.) 125 Endesa, “Tarifa con Discriminación Horaria,” 2013.
http://www.endesaonline.com/es/negocios/teguia/informacionutil/legislacion/f6027889-23d0-4752-ae19-abf631fac80f1.asp (Accessed
July 2, 2013.) 126 Endesa, “Vehículo elétrico: Oferta commercial de Endesa,” 2013. https://www.endesavehiculoelectrico.com/vehiculo-
electrico/oferta-endesa (Accessed July 2, 2013.) 127 EDF, “Les offres d’électricité,” 2013. http://particuliers.edf.com/offres-d-energie/electricite-47378.html (Accessed July 2, 2013.) 128 RWE, “RWE ePower Basic.” https://www.rwe-mobility.com/web/cms/en/1232368/products-services/rwe-epower/rwe-epower-basic/
(Accessed July 2, 2013.) 129 Vattenfall, “Vattenfall E-Mobility: Bestellformular.” http://www.vattenfall.de/de/emobility/bestellen.htm (Accessed July 2, 2013.) 130 Beijing Municipal Commission of Development and Reform, “Tariff,” 2011.
http://www.bjpc.gov.cn/ywpd/wjgl/cx/jz/201208/t3884351.htm (Accessed July 2, 2013.) 131 U.S. DOE, “Michigan Laws and Incentives,” Alternative Fuels Data Center, updated July 2, 2013.
http://www.afdc.energy.gov/laws/laws/MI (Accessed July 2, 2013.) 132 Historically, the U.S. only had fleet average mile-per-gallon targets promulgated by the Department of Transportation. However, the
most recent modification to the targets was a rulemaking that included both fleet average MPG targets and fleet average GHG targets
(g/mi). These targets are roughly equivalent, though not exactly comparable, because the GHG targets include leakage of CFCs from the
vehicle air conditioning system. 133 Global Fuel Economy Initiative, “The European Union Automotive Fuel Economy Policy.”
http://www.unep.org/transport/gfei/autotool/case_studies/europe/cs_eu_0.asp (Accessed July 2, 2013.) 134 “China imposes strict fuel economy standards on auto industry,” Reuters, March 20, 2013.
http://www.reuters.com/article/2013/03/20/china-auto-fuel-idUSL3N0CC2EK20130320 (Accessed July 2, 2013.) 135 Both the LEV and ZEV standards were initially written in California and adopted by Massachusetts. 136 Global Fuel Economy Initiative, “International comparison of light-duty vehicle fuel economy: An update using 2010 and 2011 new
registration data,” 2013. http://www.globalfueleconomy.org/Documents/Publications/wp8_international_comparison.pdf 137 RWE, “Products and services: eMobility.” https://www.rwe-mobility.com/web/cms/en/1157924/rwe-emobility/. (Accessed July 2,
2013.) 138 Michelsen, C., “Spain Gets 100 New EV Charging Stations,” CleanTechnica, March 13, 2012.
http://cleantechnica.com/2012/03/13/spain-gets-100-new-ev-charging-stations/#fBRwHSMeDRVSVzmV.99 (Accessed July 2, 2013.) 139 “BYD signs over another 1500 vehicles to Shenzhen, making the world’s largest electric vehicle fleet,” China Car Times, February
29, 2012. http://www.chinacartimes.com/2012/02/byd-signs-1500-vehicles-shenzhen-making-worlds-largest-electric-vehicle-fleet/
(Accessed July 2, 2013.) 140 Sasin, J., “China Still Gaining Speed on its e-Vehicle Programs,” April 27, 2012 http://www.shenzhen-
standard.com/2012/04/27/china-still-gaining-speed-on-its-e-vehicle-programs/ (Accessed July 2, 2013.) 141 Yabin, J., “Shanghai to issue 1st free plates for electric car,” Global Times January 20, 2013.
http://www.globaltimes.cn/content/757015.shtml (Accessed July 2, 2013.) 142 “China’s Electric Vehicle Development Failing to Meet Ambitious Targets,” Worldwatch Institute blog post, July 3, 2013.
http://blogs.worldwatch.org/revolt/chinas-electric-vehicle-development-failing-to-meet-ambitious-targets/ 143 China National Development and Reform Commission, “China's Policies and Actions for Addressing Climate Change,” 2012.
http://www.ccchina.gov.cn/WebSite/CCChina/UpFile/File1324.pdf

Electric Vehicle Grid Integration in the U.S., Europe, and China Page | 63
144 Hook, L. and P. Clark, “China eyes cap on carbon emissions by 2016,” Financial Times, May 27, 2013.
http://www.ft.com/intl/cms/s/0/61cd4ec6-c6b1-11e2-a861-00144feab7de.html#axzz2XL1mJMvj (Accessed 26 Jun 2013.) 145 European Commission, “Directive 2009/28/EC of the European Parliament and of the Council of 23 April 2009 on the promotion of
the use of energy from renewable sources and amending and subsequently repealing Directives 2001/77/EC and 2003/30/EC,” OJ L
140:16–62, April 2013. 146 China National Development and Reform Commission, “China's Policies and Actions for Addressing Climate Change,” 2012.
http://www.ccchina.gov.cn/WebSite/CCChina/UpFile/File1324.pdf 147 U.S. Federal Highway Administration statistics estimate average daily miles driven in the U.S. between 33 and 36, or 12,000 to
13,000 miles per year. This number varies significantly by demographic group, and is a daily average; further discussion appears in the
Analysis section. 148 Kintner-Meyer, M.C.W., T.B. Nguyen, C. Jin, et al., “Impact Assessment of Plug-in Hybrid Vehicles on the U.S. Power Grid,” The
25th World Battery, Hybrid and Fuel Cell Electric Vehicle Symposium & Exhibition, Shenzhen, China, November 5-9, 2010.
http://energyenvironment.pnnl.gov/ei/pdf/Impact%20Assessment%20of%20PHEV%20on%20US%20Power%20Grid.pdf 149 Denholm, P. and W. Short, “An Evaluation of Utility System Impacts and Benefits of Optimally Dispatched Plug-In Hybrid Electric
Vehicles,” NREL Technical Report, July 2006. 150 Grünig, M., M. Witte, B. Boteler, et al. “Impacts of Electric Vehicles - Deliverable 3: Assessment of the future electricity sector,”
Delft: CE Delft, April 2011. http://ec.europa.eu/clima/policies/transport/vehicles/docs/d3_en.pdf 151 See, for example, the work being done to analyze residential energy consumption throughout the EU: http://remodece.isr.uc.pt/; also,
research on Danish energy consumption: http://www.ea-
energianalyse.dk/reports/926_edison_introducing_electric_vehicles_into_the_current_electricity_markets.pdf; German load curves
http://www.ise.fraunhofer.de/en/downloads-englisch/pdf-files-englisch/news/electricity-production-from-solar-and-wind-in-germany-in-
2012.pdf, p. 256ff.; Chinese load curves in Yan, G. and Y.R. Gang, “A Statistical Model Concerning Battery Type and Initial State of
Charge for Charging Power Demand of Electric Vehicles,” 2012 International Conference on Future Electrical Power and Energy
Systems, Lecture Notes in Information Technology, Vol.9. 152 Liu, J., “Electric Vehicle Charging Infrastructure Assignment and Power Grid Impacts Assessment in Beijing,” Energy Policy
51:544-557, December 2012. 153 Richardson, D.B., “Electric vehicles and the electric grid: A review of modeling approaches, Impacts, and renewable energy
integration,” Renewable and Sustainable Energy Reviews 19: 247–254, March 2013. 154 He, F., D. Wua, Y. Yin, et al., “Optimal deployment of public charging stations for plug-in hybrid electric vehicles,” Transportation
Research Part B 47:87–101, January 2013. 155 Parks, K., P. Denholm, and T. Markel, “Costs and Emissions Associated with Plug-In Hybrid Electric Vehicle Charging in the Xcel
Energy Colorado Service Territory,” Technical Report NREL/TP-640-41410, May 2007. 156 Dallinger, D., G. Schubert, and M. Wietschel, “Integration of intermittent renewable power supply using grid-connected vehicles - a
2030 case study for California and Germany,” Applied Energy 104:666-682, April 2013. 157 For the purposes of discussion, we assume here that eight hours of charging at 0.8 kW could deliver 6.4 kWh of power to the battery,
which would power a vehicle for 21 miles at 300 watt-hours per mile. Actual charging times will vary depending on the battery
condition, charger efficiency, and other factors. 158 Grünig, M., M. Witte, B. Boteler, et al., “Impacts of Electric Vehicles - Deliverable 3: Assessment of the future electricity sector,”
Delft: CE Delft, April 2011. http://ec.europa.eu/clima/policies/transport/vehicles/docs/d3_en.pdf 159 EURELECTRIC, “European electricity industry views on charging Electric Vehicles,” position paper, April 2011.
http://www.eurelectric.org/media/26100/2011-04-18_final_charging_statement-2011-030-0288-01-e.pdf 160 Kelly, J., J.S. MacDonald, and G.A. Keoleian, “Time-dependent plug-in hybrid electric vehicle charging based on national driving
patterns and demographics,” Applied Energy 94: 392-405, Jun 2012. Note that these particular curves use actual driving data to simulate
charging requirements for a fleet of PHEVs. The patterns would be similar, but more pronounced, for EVs. 161 Fischetti, M., “Electric Car Owners All Plug In at Once,” Scientific American, August 2012.
http://www.scientificamerican.com/article.cfm?id=electric-car-owners-charge-at-once (Accessed July 2, 2013.) 162 See, for example, Shao, S., M. Pipattanasomporn, and S. Rahman, “Grid Integration of Electric Vehicles and Demand Response with
Customer Choice,” IEEE Transactions on Smart Grid, 3(1), March 2012. 163 Parks, K., P. Denholm, and T. Markel, “Costs and Emissions Associated with Plug-In Hybrid Electric Vehicle Charging in the Xcel
Energy Colorado Service Territory,” Technical Report NREL/TP-640-41410, May 2007. 164 Ibid. 165 Collins, W., “Plug-in Electric Vehicles (PEVs),” presentation to Massachusetts Electric Vehicle Roundtable, March 7, 2013,
http://www.mass.gov/eea/docs/doer/clean-cities/ma-ev-roundtable-northeast-utilities.pdf 166 Morgan, T., “Smart Grids and Electric Vehicles: Made for Each Other?” background paper for 2012 International Transport Forum,
Leipzig, Germany, May 2-4, 2012. http://www.internationaltransportforum.org/jtrc/DiscussionPapers/DP201202.pdf 167 Project FEVER, “Colorado Electric Vehicle and Infrastructure Readiness Plan,” September 2012.
http://denvercleancities.org/Colorado%20PEV%20Readiness%20Plan.pdf 168 Plug-in America Accessory Tracker. Accessed 28 May 2013. http://www.pluginamerica.org/accessories 169 Project FEVER, “Colorado Electric Vehicle and Infrastructure Readiness Plan,” September 2012.
http://denvercleancities.org/Colorado%20PEV%20Readiness%20Plan.pdf 170 Prices converted from euros based on exchange rate of 1 Euro to 1.30 USD. Schoeder, A. and T. Traber, “The economics of fast
charging infrastructure for electric vehicles,” Energy Policy 43: 136–144, April 2012.

Electric Vehicle Grid Integration in the U.S., Europe, and China Page | 64
171 Plug-in America Accessory Tracker. Accessed 28 May 2013. http://www.pluginamerica.org/accessories. 172 Prices converted from euros based on exchange rate of 1 Euro to 1.30 USD. Schoeder, A. and T. Traber, “The economics of fast
charging infrastructure for electric vehicles,” Energy Policy 43: 136–144, April 2012. 173 Prices converted from yuan based on exchange rate of 1 Yuan to 0.16 USD. Li, Z. and M. Oouyyang, “The pricing of charging for
electric vehicles in China -- Dilemma and solution,” Energy 36:5765-5778, September 2011. 174 Project FEVER, “Colorado Electric Vehicle and Infrastructure Readiness Plan,” September 2012.
http://denvercleancities.org/Colorado%20PEV%20Readiness%20Plan.pdf 175 Prices converted from euros based on exchange rate of 1 Euro to 1.30 USD. Schoeder, A. and T. Traber, “The economics of fast
charging infrastructure for electric vehicles,” Energy Policy 43: 136–144, April 2012. 176 Ibid. 177 Qualcomm corporate website. http://www.qualcommhalo.com/. 178 Tesla Motors corporate website. http://www.teslamotors.com/batteryswap. 179 Green II, R.C., L. Wang, and M. Alam, “The impact of plug-in hybrid electric vehicles on distribution networks: A review and
outlook,” Renewable and Sustainable Energy Reviews 15:544–553, January 2011. 180 Lieven, T., S. Mühlmeier, S. Henkel, et al., “Who will buy electric cars? An empirical study in Germany,” Transportation Research
Part D 16: 236-243, May 2011. 181 Pearre, N.S., W. Kempton, R.L. Guensler, et al., “Electric vehicles: How much range is required for a day’s driving?”, Transportation
Research Part C 19:1171–1184, December 2011. 182 Patton, D.B., “IMM Quarterly Report: Winter 2013, December-February,” presentation to Markets Committee of the MISO Board of
Directors, March 27, 2013.
https://www.midwestiso.org/Library/Repository/Meeting%20Material/Stakeholder/BOD/Markets%20Committee/2013/20130327/20130
327%20Markets%20Committee%20of%20the%20BOD%20Item%2003%20IMM%20Quarterly%20Report.pdf 183 California ISO, 2012 Annual Report on Market Issues & Performance, April 2013.
http://www.caiso.com/Documents/2012AnnualReport-MarketIssue-Performance.pdf 184 Note that several of the NERC designations used in the report correspond to Regional Reliability Councils that have since been
replaced by new NERC regions. 185 Kintner-Meyer, M.C.W., T.B. Nguyen, C. Jin, et al., “Impact Assessment of Plug-in Hybrid Vehicles on the U.S. Power Grid,” The
25th World Battery, Hybrid and Fuel Cell Electric Vehicle Symposium & Exhibition, Shenzhen, China, November 5-9, 2010.
http://energyenvironment.pnnl.gov/ei/pdf/Impact%20Assessment%20of%20PHEV%20on%20US%20Power%20Grid.pdf 186 Hensley, R., J. Newman, and M. Rogers, “Battery Technology Charges Ahead,” McKinsey Quarterly, July 2012.
http://www.mckinsey.com/insights/energy_resources_materials/battery_technology_charges_ahead (Accessed June 1, 2013.)