Embed Size (px)
Citation preview
TRANSPORTATION
Making informed transportation choices
Climate Masters
Updated 2.2010
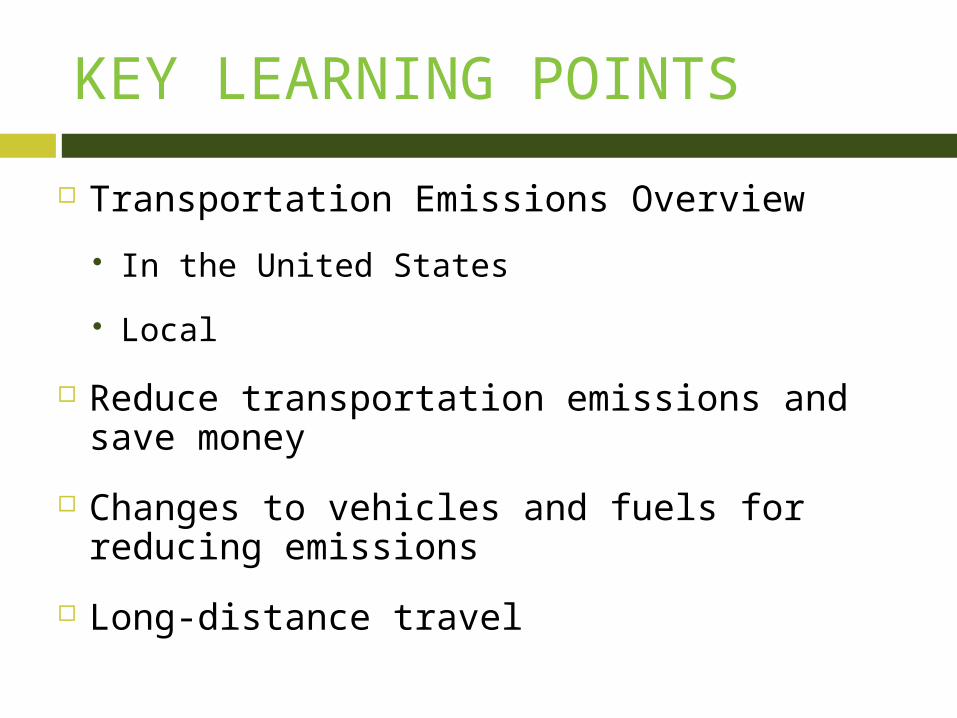
KEY LEARNING POINTS
Transportation Emissions Overview
In the United States
Local
Reduce transportation emissions and save money
Changes to vehicles and fuels for reducing emissions
Long-distance travel
Transportation Related Emissions
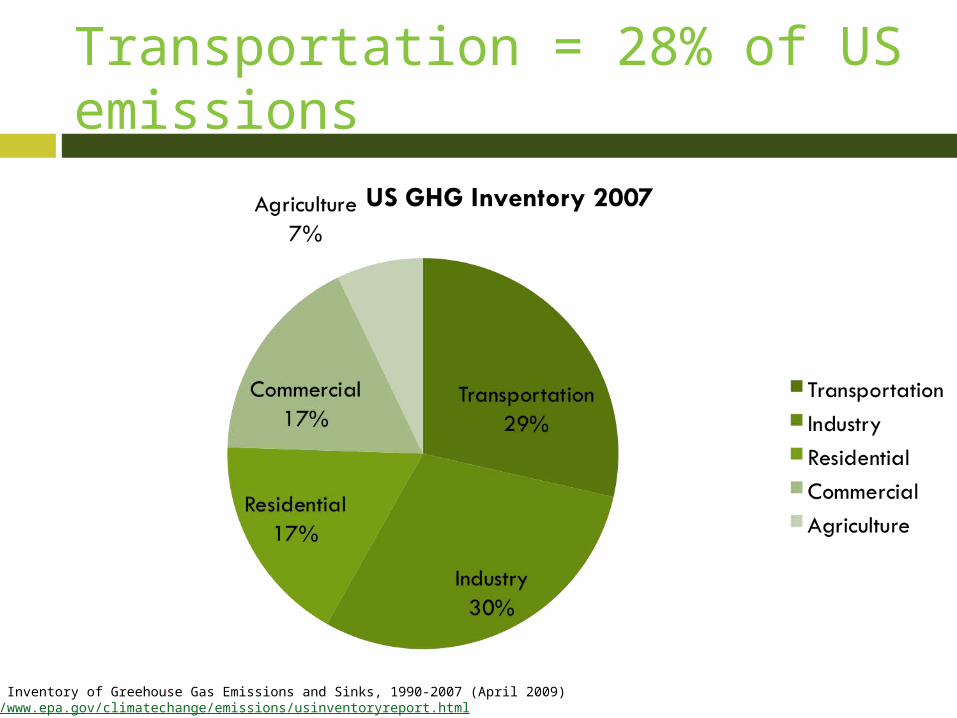
Transportation = 28% of US emissions
US EPA Inventory of Greehouse Gas Emissions and Sinks, 1990-2007 (April 2009)http://www.epa.gov/climatechange/emissions/usinventoryreport.html
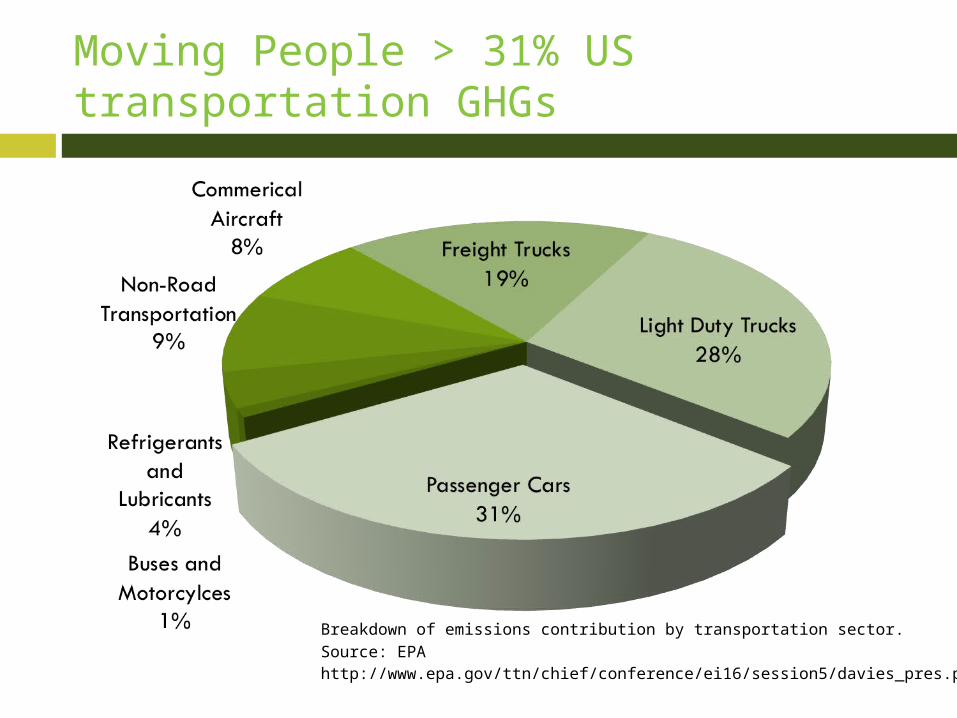
Moving People > 31% US transportation GHGs
Breakdown of emissions contribution by transportation sector.
Source: EPA http://www.epa.gov/ttn/chief/conference/ei16/session5/davies_pres.pdf
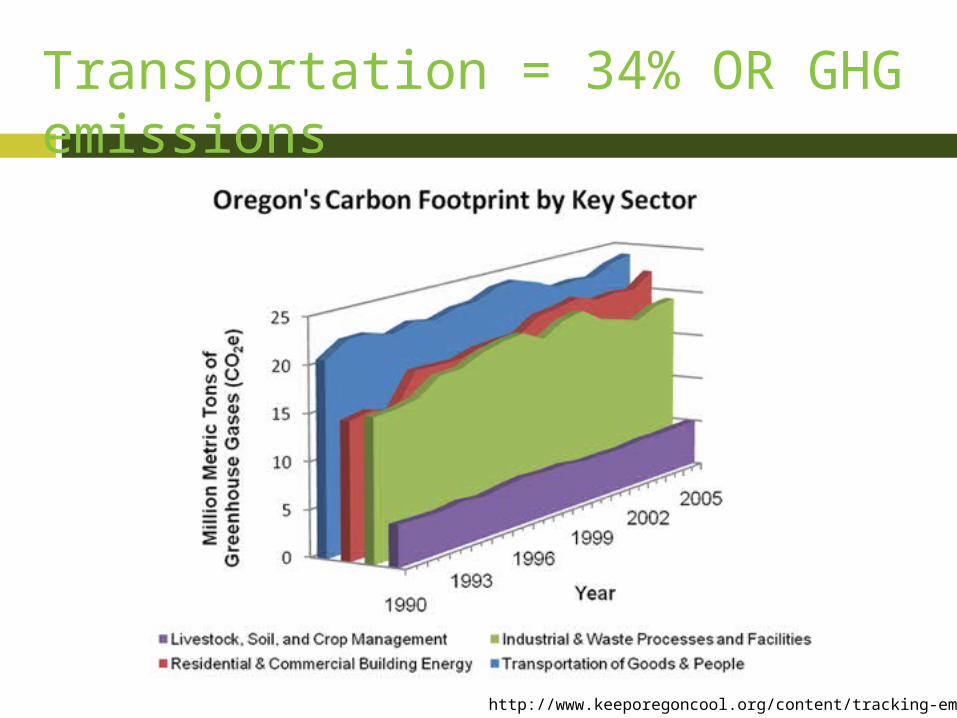
Transportation = 34% OR GHG emissions
http://www.keeporegoncool.org/content/tracking-emissions
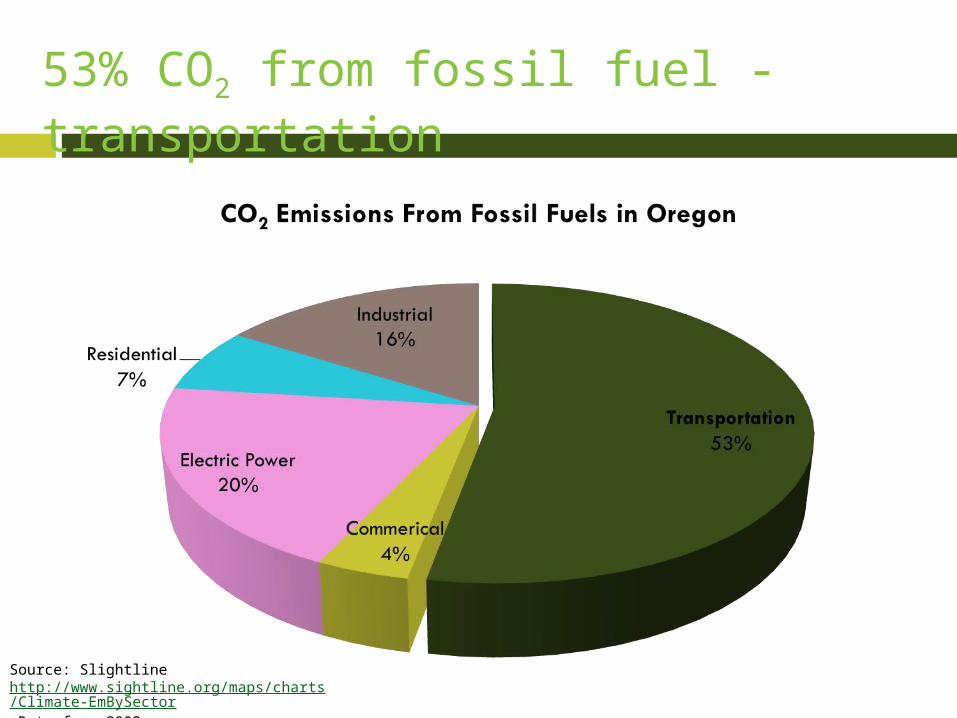
Source: Slightline http://www.sightline.org/maps/charts/Climate-EmBySector Data from 2003
53% CO2 from fossil fuel - transportation

Change how you get there
Short Trips
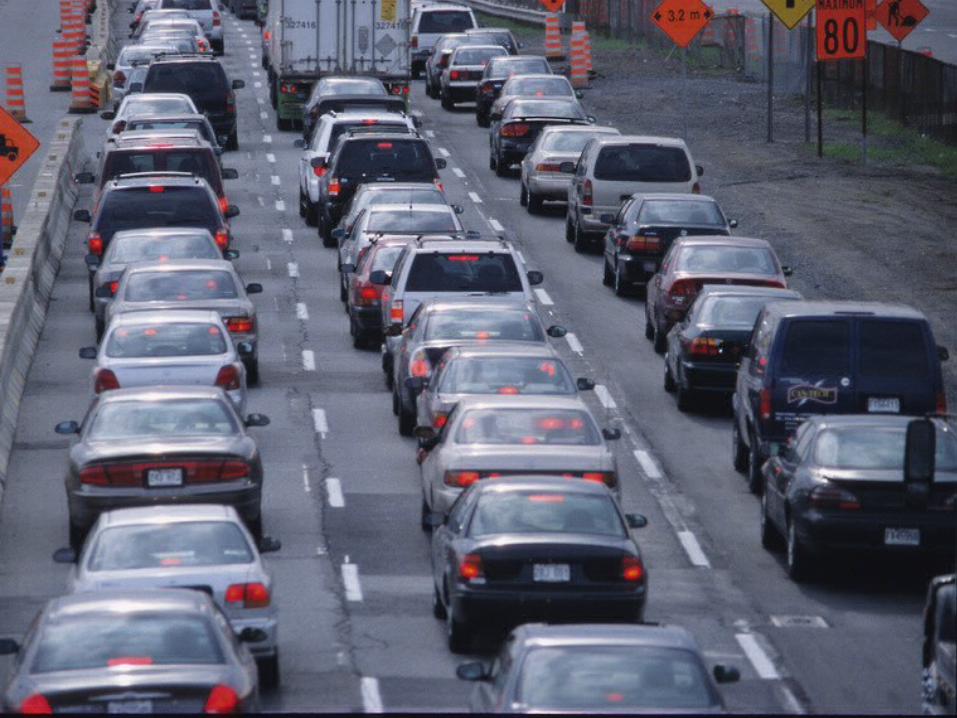
Add pic of traffic
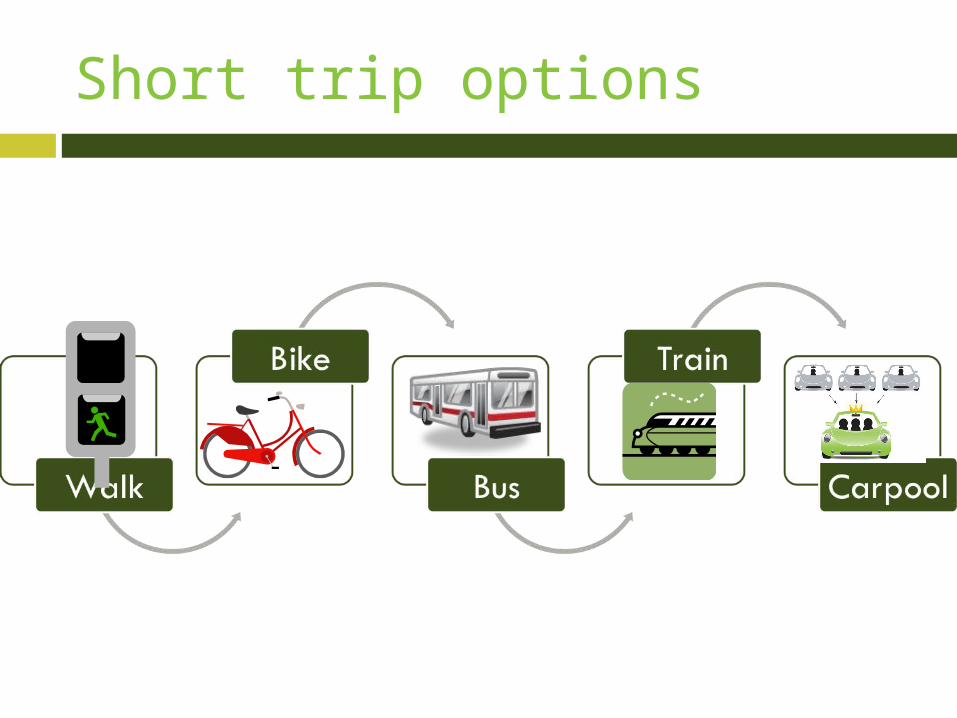
Short trip options
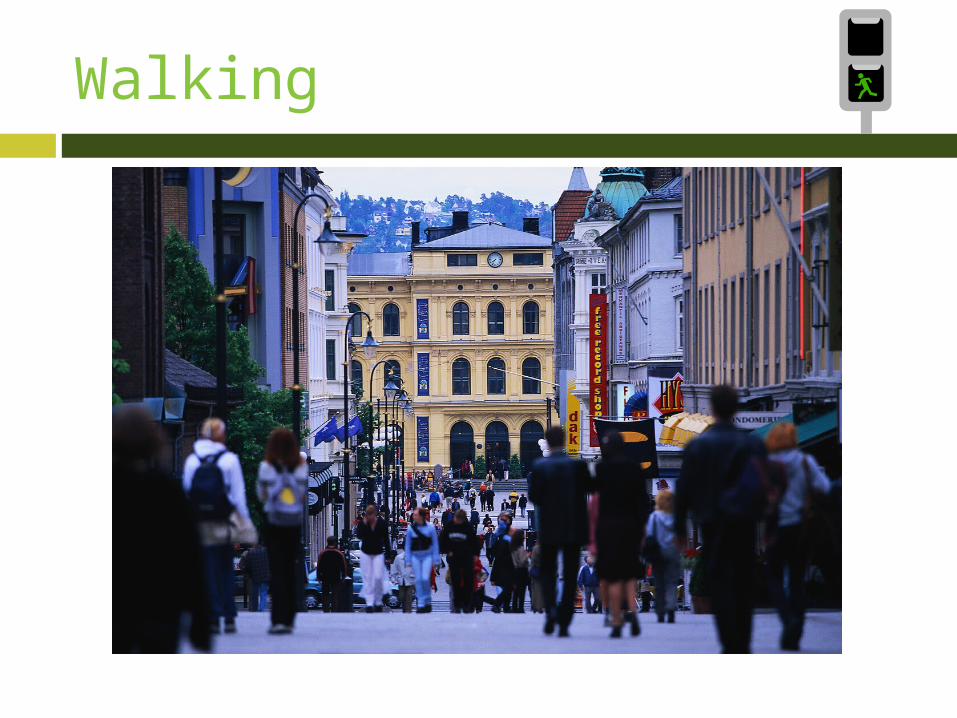
Walking
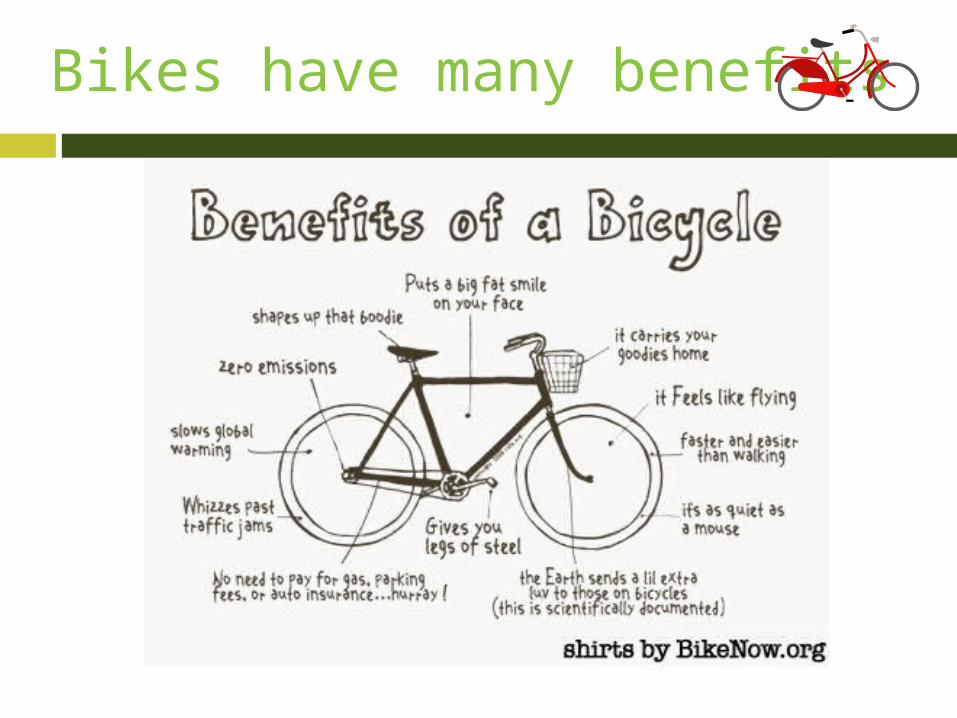
Bikes have many benefits
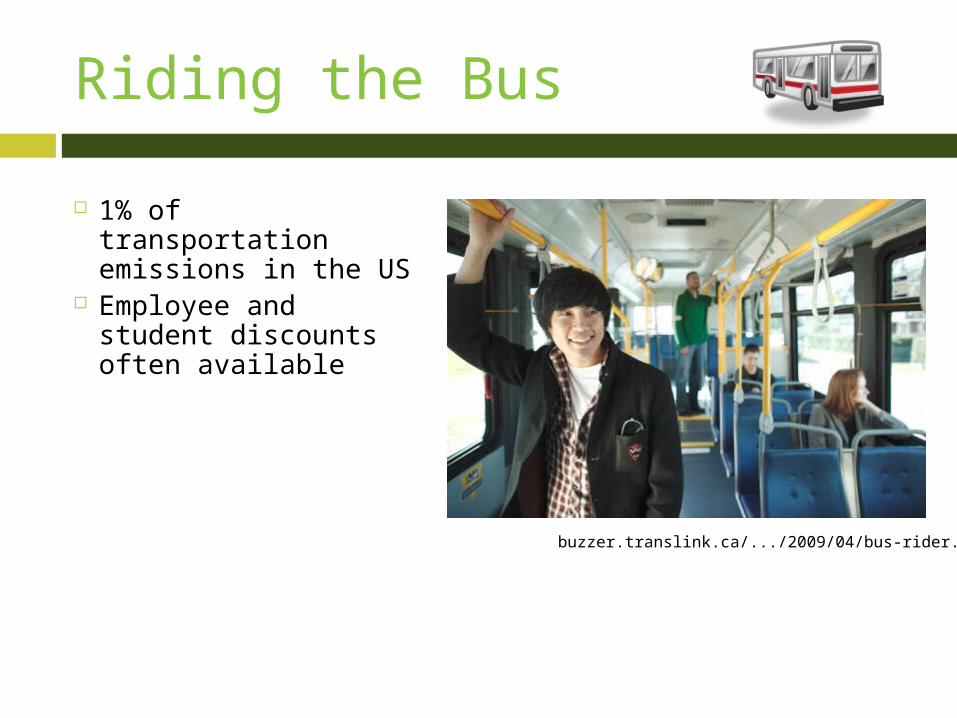
Riding the Bus
1% of transportation emissions in the US
Employee and student discounts often available
buzzer.translink.ca/.../2009/04/bus-rider.jpg
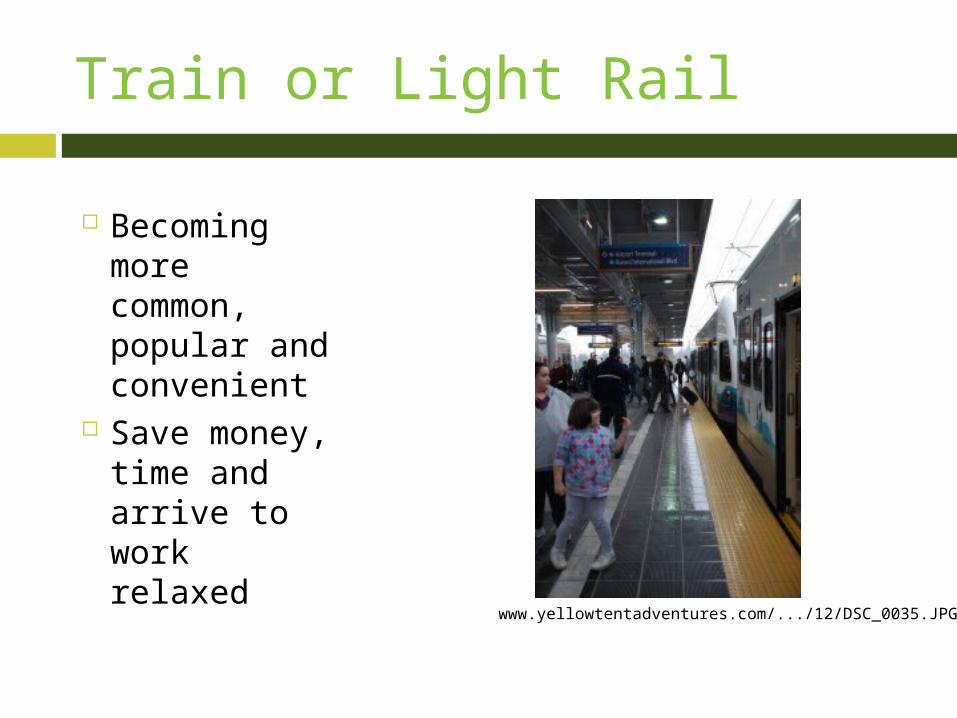
Train or Light Rail
Becoming more common, popular and convenient
Save money, time and arrive to work relaxed www.yellowtentadventures.com/.../12/DSC_0035.JPG
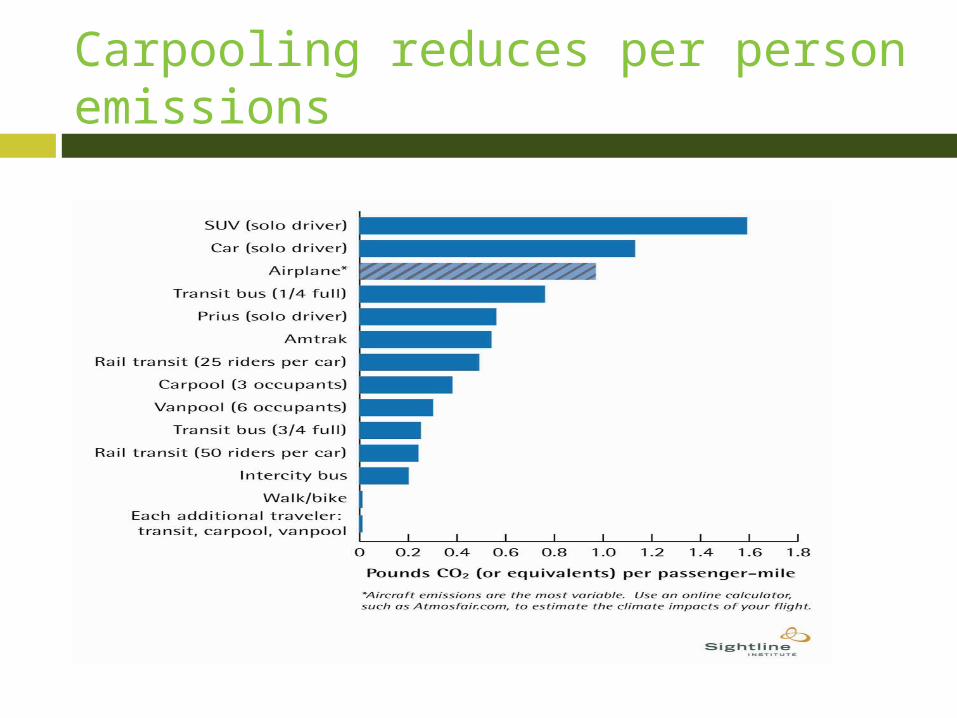
Carpooling reduces per person emissions
Updated 12/2009Climate Master Program: Transportation
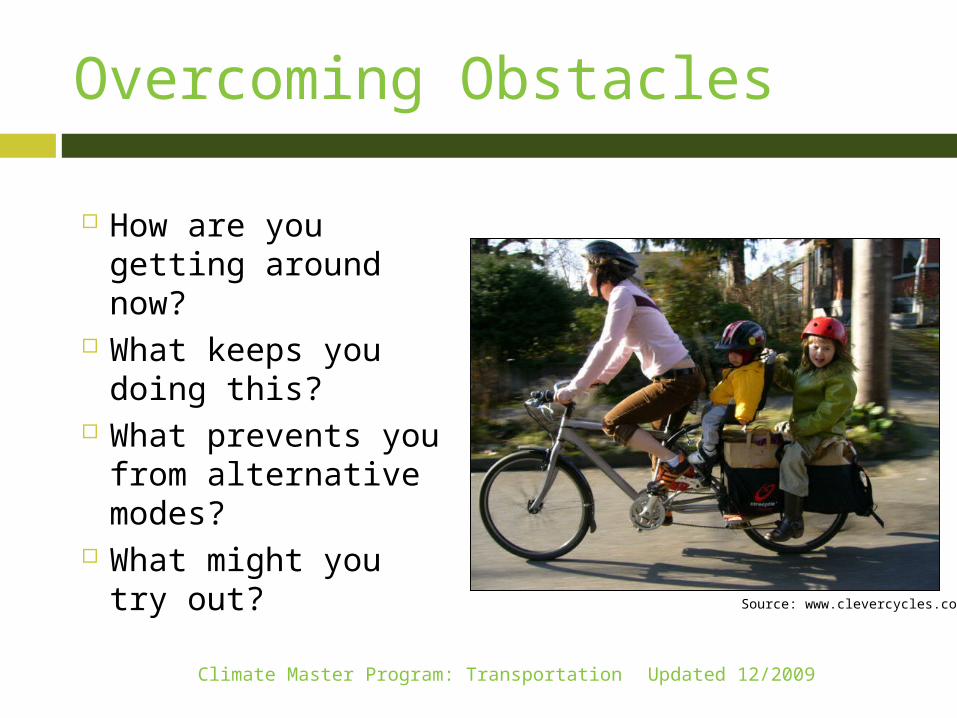
Overcoming Obstacles
How are you getting around now?
What keeps you doing this?
What prevents you from alternative modes?
What might you try out?
Source: www.clevercycles.com
Change how you get there
Long Trips
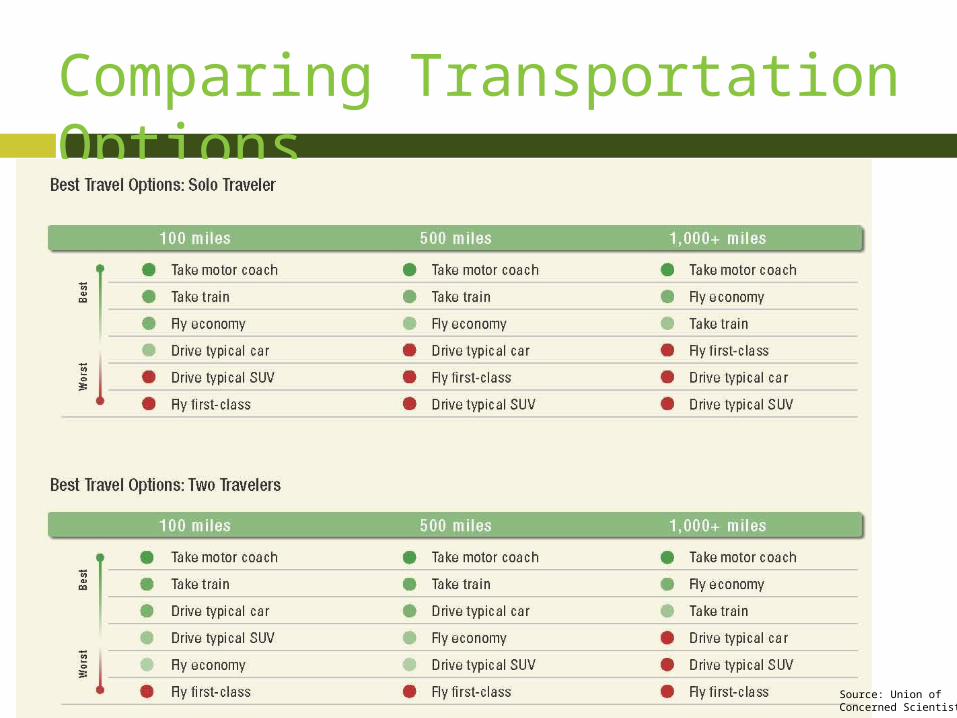
Comparing Transportation Options
Updated 2/2009Climate Master Program: TransportationSource: Union of Concerned Scientists
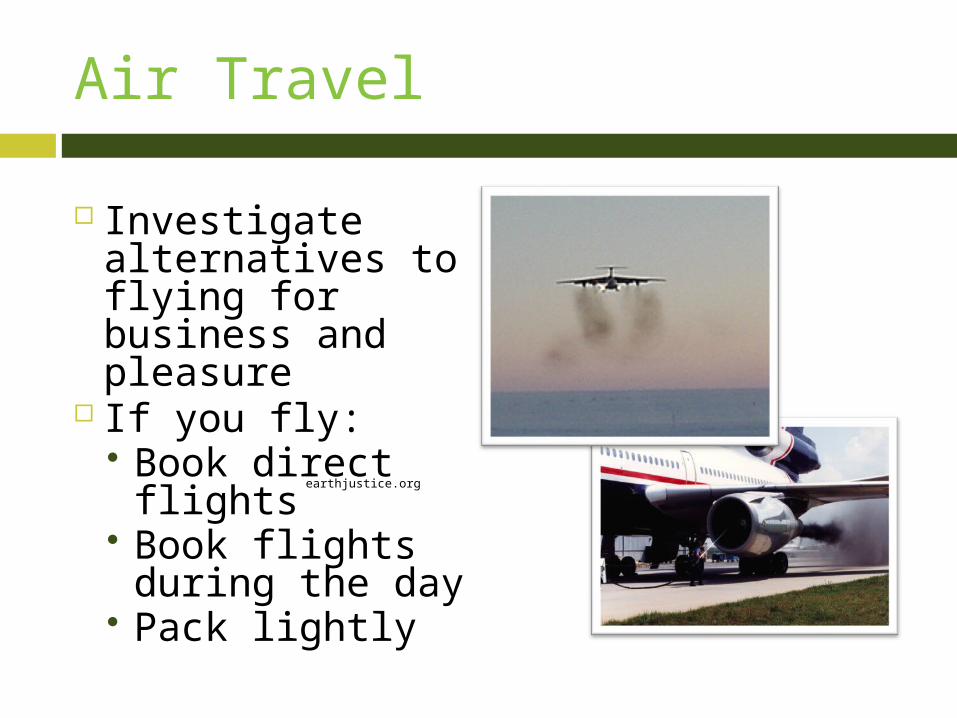
Air Travel
earthjustice.org
Investigate alternatives to flying for business and pleasure
If you fly: Book direct
flights Book flights
during the day Pack lightly
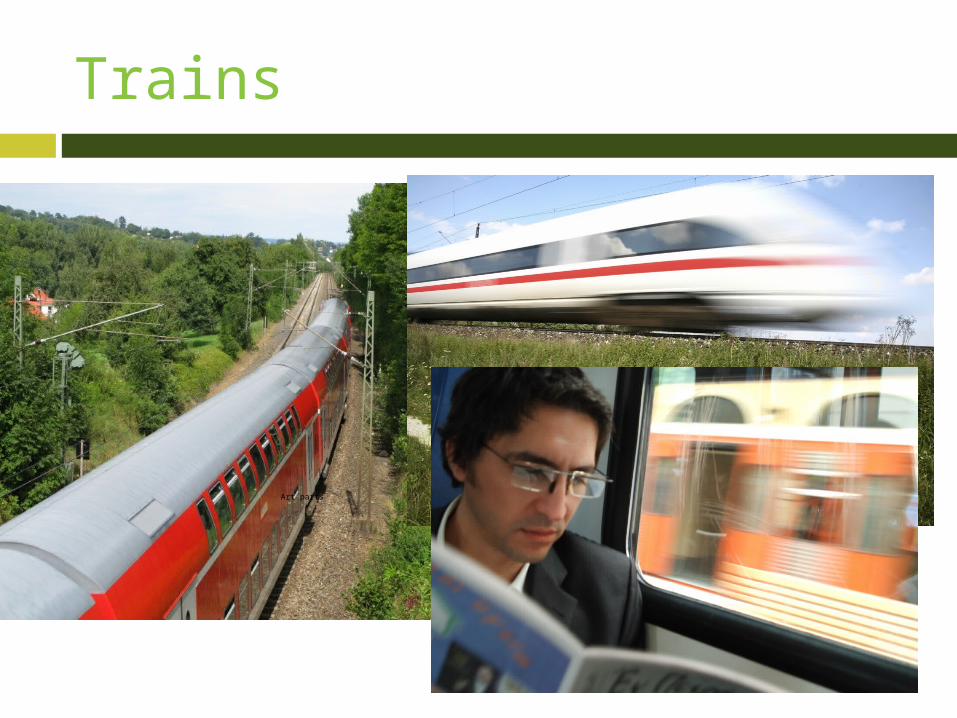
Trains
Updated 2/2009
Art parts
Alternative Fuels
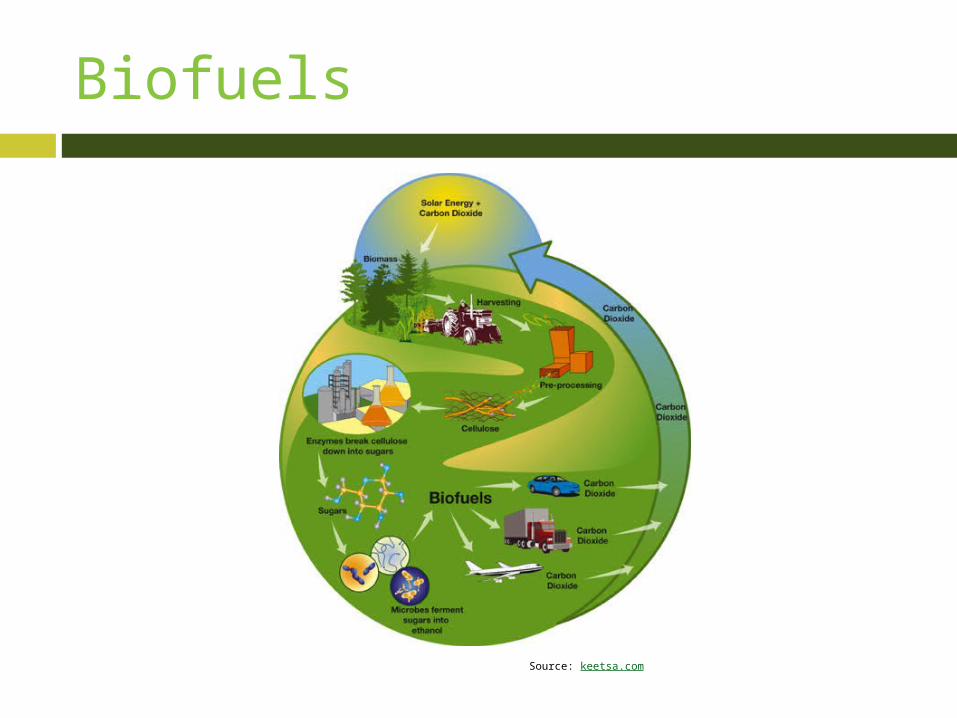
Biofuels
Source: keetsa.com
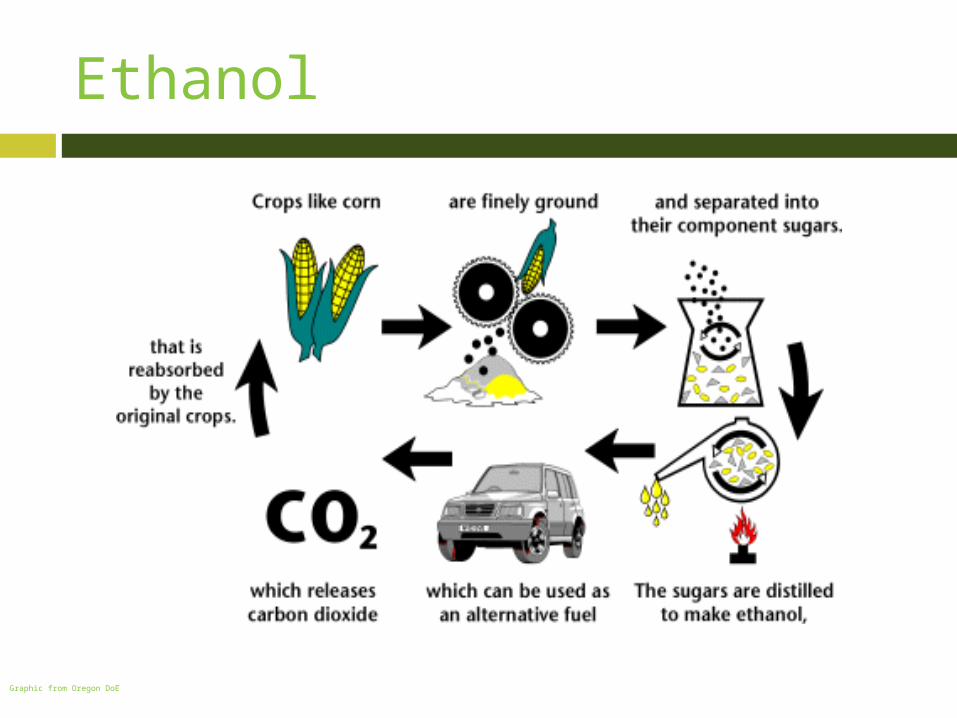
Ethanol
Graphic from Oregon DoE
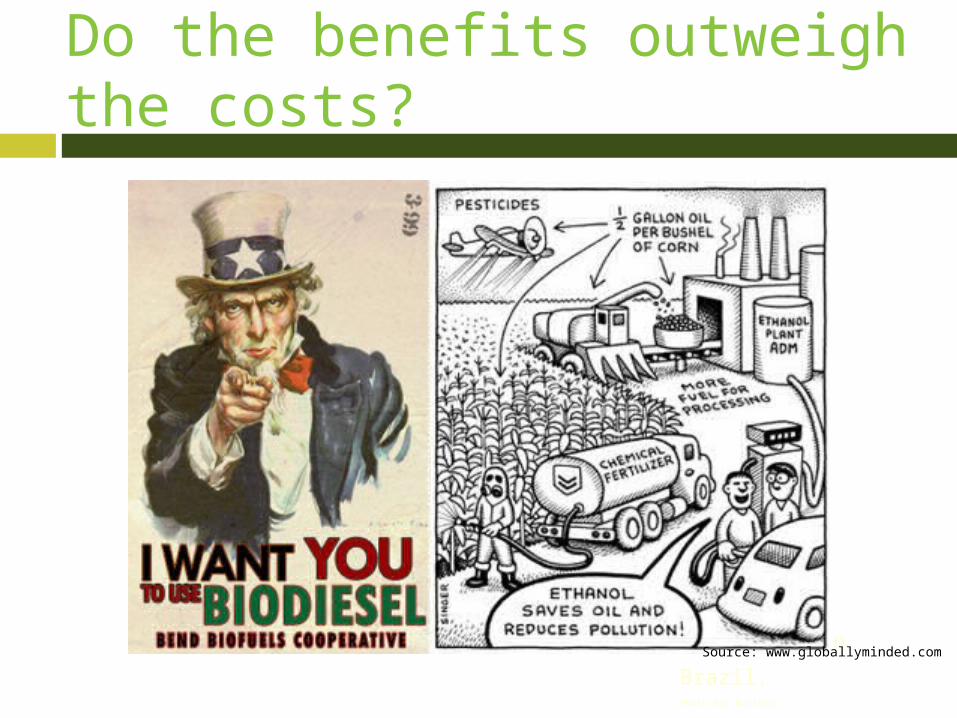
Do the benefits outweigh the costs?
Sugar Cane in Brazil. Photo by: Mariordo
Source: www.globallyminded.com
If You Have to Drive…
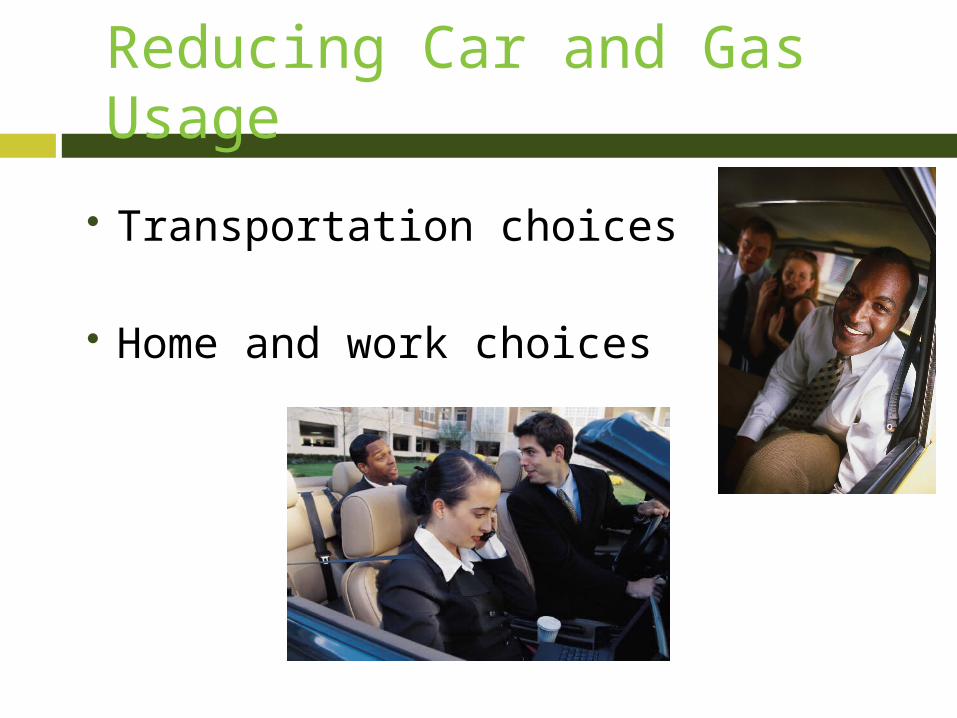
Reducing Car and Gas Usage
Transportation choices
Home and work choices
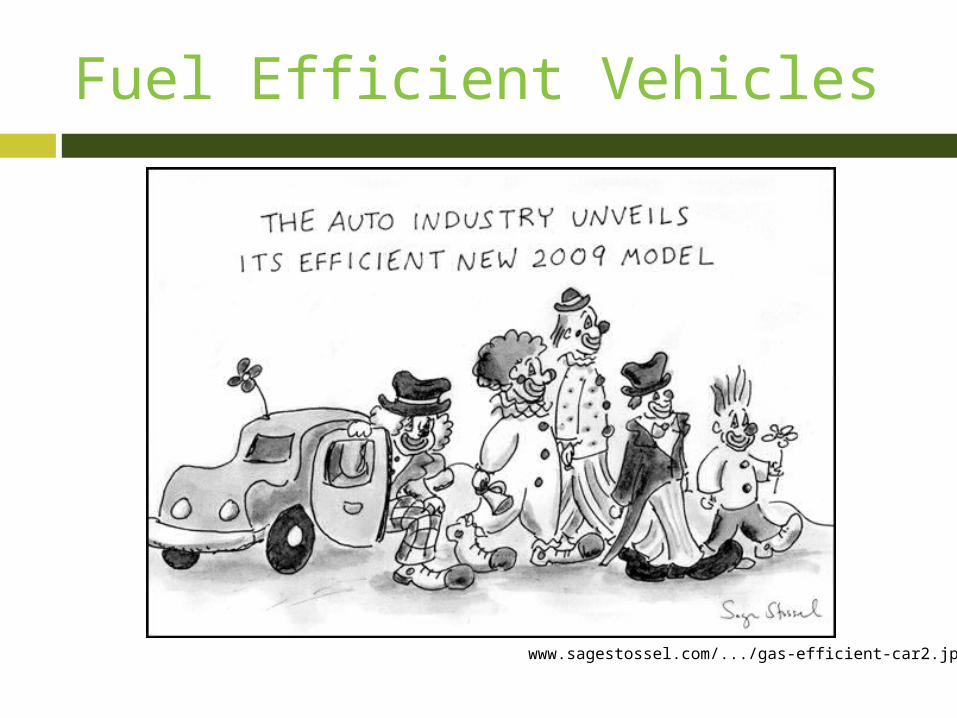
Fuel Efficient Vehicles
www.sagestossel.com/.../gas-efficient-car2.jpg
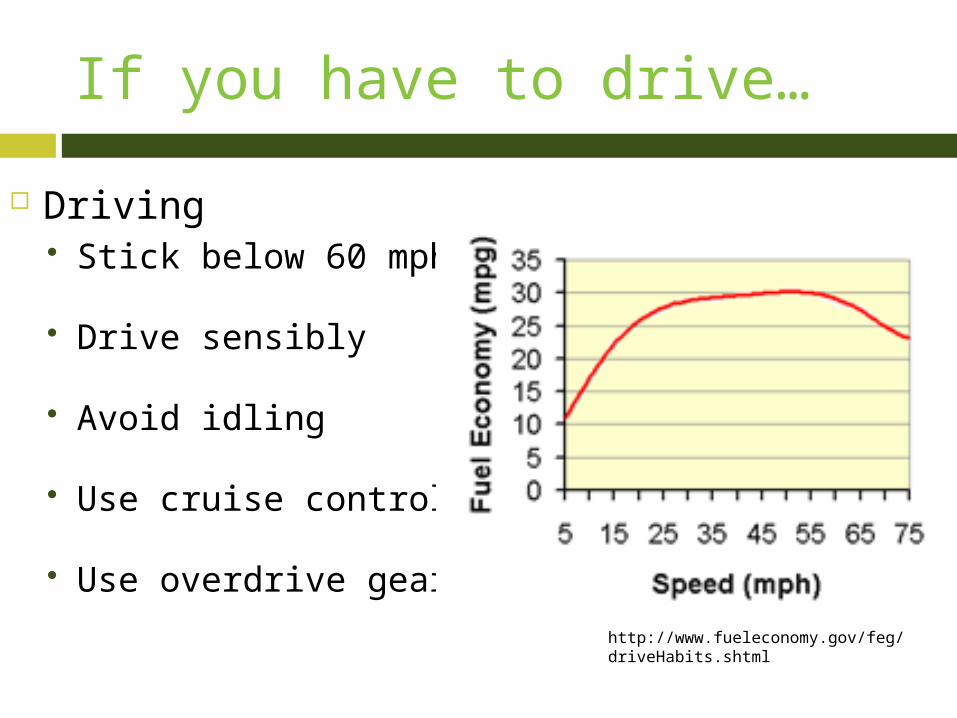
If you have to drive…
Driving Stick below 60 mph
Drive sensibly
Avoid idling
Use cruise control
Use overdrive gears
http://www.fueleconomy.gov/feg/driveHabits.shtml
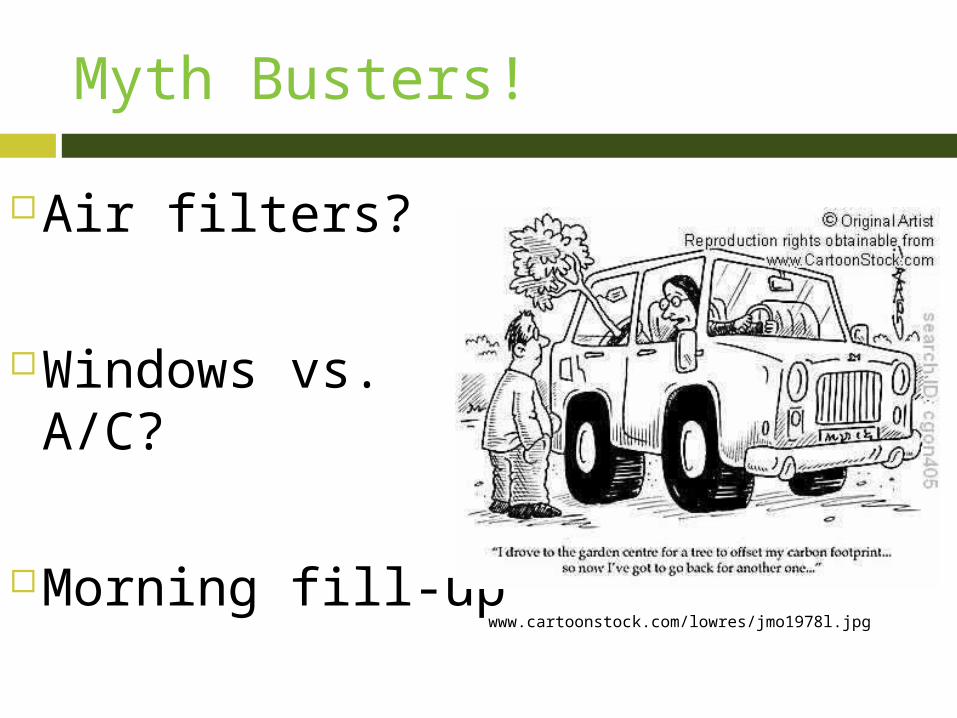
Myth Busters!
Air filters?
Windows vs. A/C?
Morning fill-up www.cartoonstock.com/lowres/jmo1978l.jpg

Beyond Individual Change
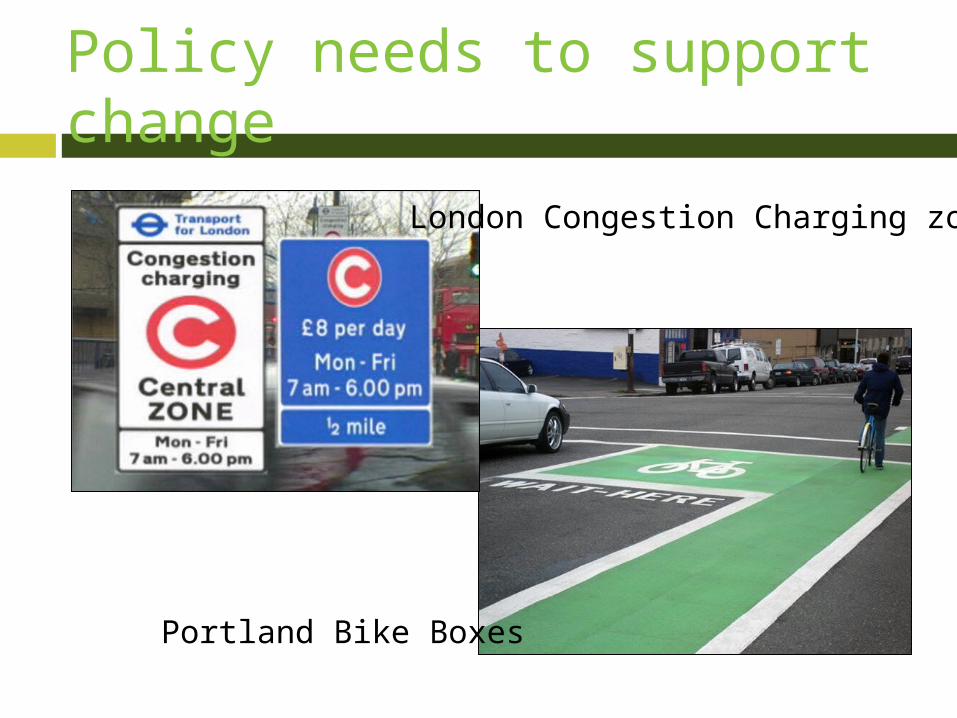
Policy needs to support change
London Congestion Charging zone
Portland Bike Boxes
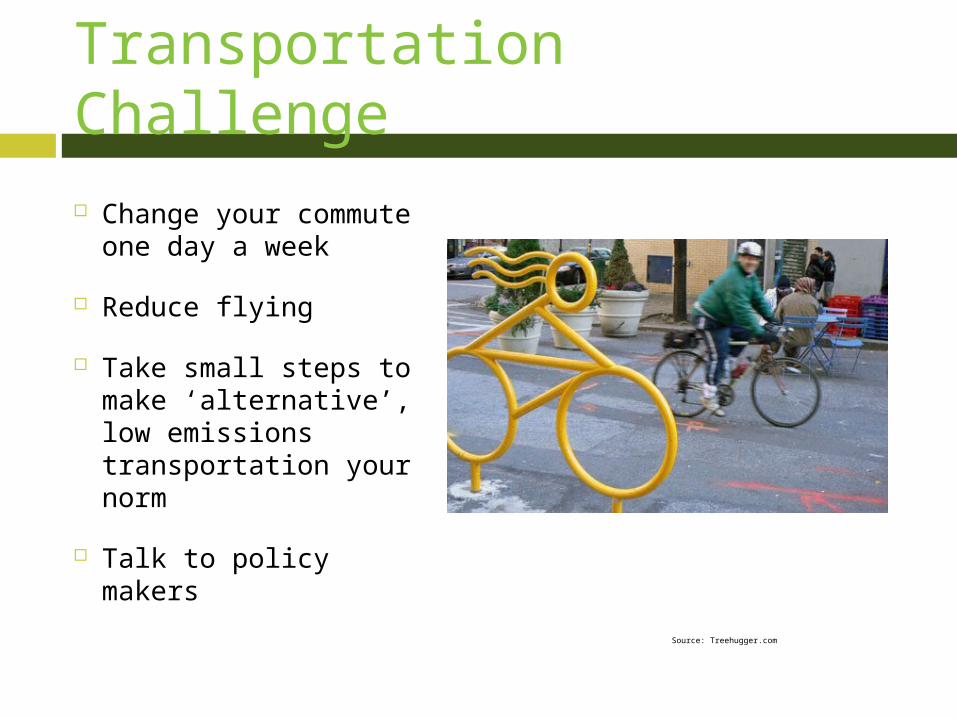
Transportation Challenge
Change your commute one day a week
Reduce flying
Take small steps to make ‘alternative’, low emissions transportation your norm
Talk to policy makers Source: Treehugger.com
Resources
Calculate your commute costs at: http://www.commuterpage.com/Userweb/CostCommuting/CostCommuting.htm
National database and registration for ride sharing: http://www.rideshare-directory.com/
Driving efficiently, mileage for different vehicles, biofuels and hybrids. www.fueleconomy.gov
Green Vehicle Guide http://www.epa.gov/greenvehicles/ Share Vehicles: WeCar® www.wecar.com and Flexcar®
www.flexcar.com
Credits
Developed by the Climate Leadership Initiative
Bike slides based on presentations by: Shane Rhodes, Eugene Safe Routes to School
Unlabeled photos from Shane Rhodes Additional information from Rick Wallace Oregon
Department of Energy
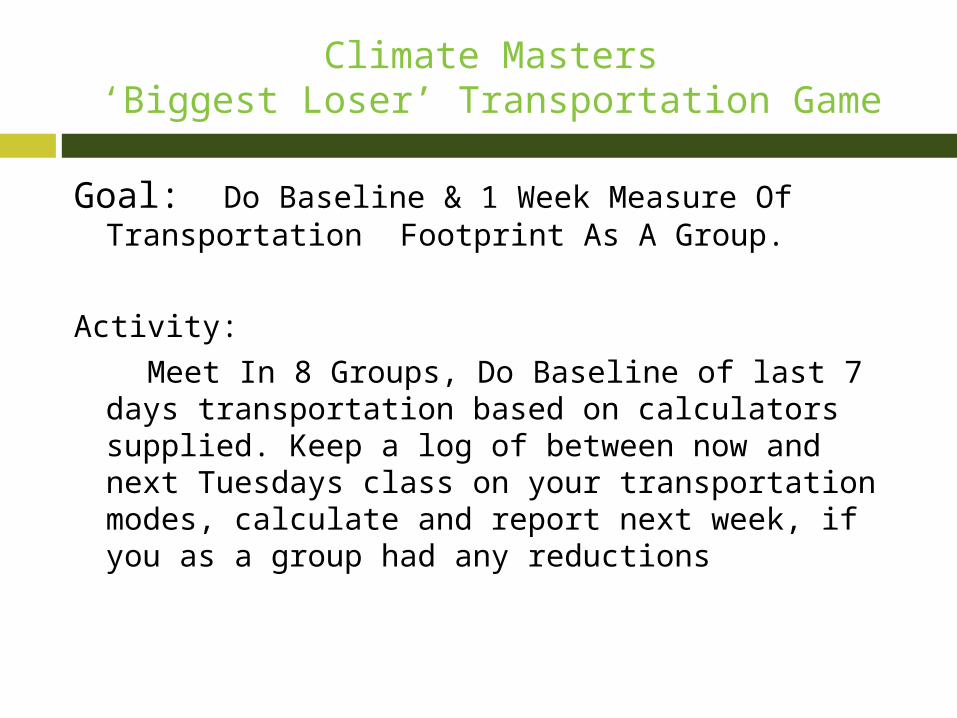
Climate Masters‘Biggest Loser’ Transportation Game
Goal: Do Baseline & 1 Week Measure Of Transportation Footprint As A Group.
Activity:
Meet In 8 Groups, Do Baseline of last 7 days transportation based on calculators supplied. Keep a log of between now and next Tuesdays class on your transportation modes, calculate and report next week, if you as a group had any reductions
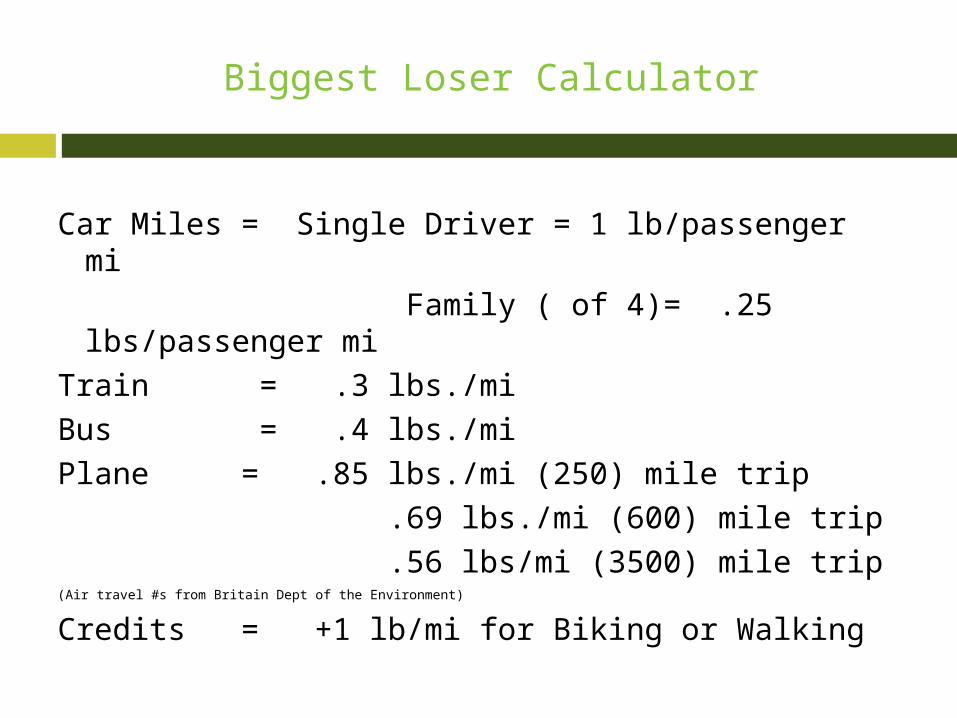
Biggest Loser Calculator
Car Miles = Single Driver = 1 lb/passenger mi Family ( of 4)= .25 lbs/passenger
miTrain = .3 lbs./miBus = .4 lbs./miPlane = .85 lbs./mi (250) mile trip .69 lbs./mi (600) mile trip .56 lbs/mi (3500) mile trip(Air travel #s from Britain Dept of the Environment)
Credits = +1 lb/mi for Biking or Walking
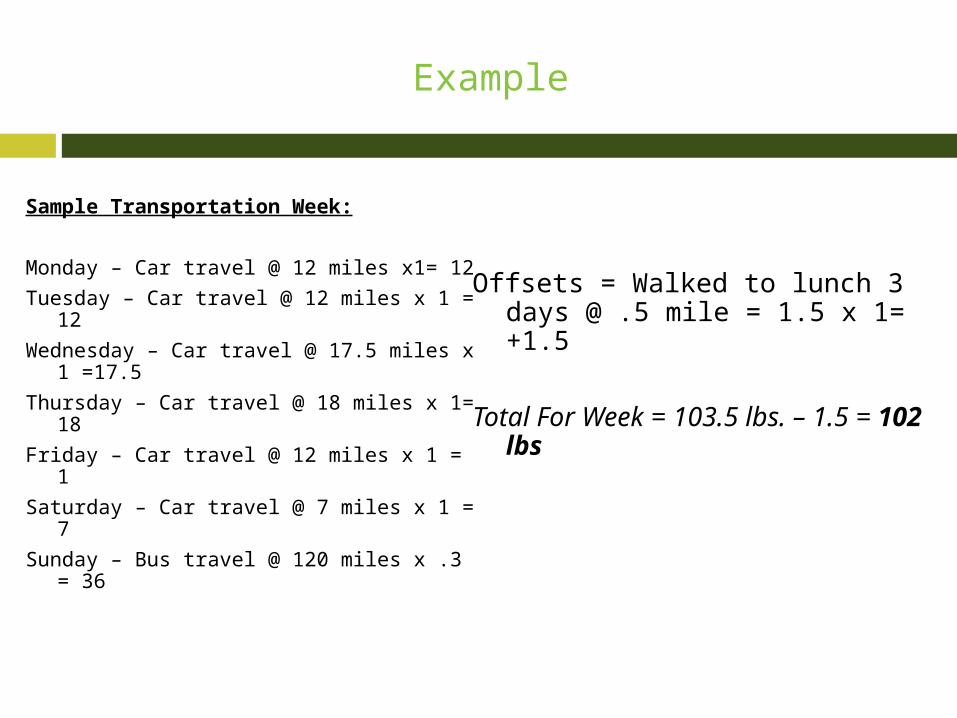
Example
Sample Transportation Week:
Monday – Car travel @ 12 miles x1= 12
Tuesday – Car travel @ 12 miles x 1 = 12
Wednesday – Car travel @ 17.5 miles x 1 =17.5
Thursday – Car travel @ 18 miles x 1= 18
Friday – Car travel @ 12 miles x 1 = 1
Saturday – Car travel @ 7 miles x 1 = 7
Sunday – Bus travel @ 120 miles x .3 = 36
Offsets = Walked to lunch 3 days @ .5 mile = 1.5 x 1= +1.5
Total For Week = 103.5 lbs. – 1.5 = 102 lbs