Embed Size (px)
Citation preview
CHALLENGES AFFECTING MARKETING OF HORTICULTURAL PRODUCE
IN KENYA: MANGO FRUITS IN MASONGALENI WARD OF KIBWEZI
CONSTITUENCY
BY
Bernadette M. Nzioki
D133/CTY/PT/22422/2012
A RESEARCH REPORT SUBMITTED IN PARTIAL FULFILLMENT OF THE
REQUIREMENTS OF EXECUTIVE MASTERS IN BUSINESS
ADMINISTRATION IN THE SCHOOL OF BUSINESS OF KENYATTA
UNIVERSITY
NOVEMBER 2013
ii
DECLARATION
This research report is my original work and has not been presented for a degree in any
other university or for any other award.
Signature……………………………... Date………………………………
Bernadette M. Nzioki
D133/CTY/PT/22422/2012
This research report has been submitted with my approval as university supervisor:
Signature …………………………….. Date ……………………………
Mr. Robert Nzulwa
Business Administration Department
Kenyatta University
This research report has been submitted with my approval as the chairman of the
Department:
Signature ………………………. Date …………………………..
Dr. Stephen Makau Muathe
Business Administration Department
Kenyatta University
iii
DEDICATION
I dedicate this research project to my grandchildren; Shani, Legend, Israel, Ezra, Azaria
and Maingi Jnr. whose innocent smiles and hugs gave me the motivation and the psyche to
undertake this project. May they grow to be wise and knowledgeable to serve God and
humanity.

iv
ACKNOWLEDGMENT
I wish to acknowledge the Public Service Commission of Kenya for sponsoring my
Executive MBA programme. I also appreciate my supervisor, Mr. Robert Nzulwa for
guiding me in writing of the research project report and all my lecturers and classmates for
their support and encouragement without which this project would not have been a
success. I thank individuals and institutions who contributed immensely to the success of
this project particularly Mr. George Kamamia from the district agricultural office, Kibwezi
and James Njeru from Jomo Kenyatta University of Agriculture and Technology. I am also
grateful to my family for their unwavering support during the entire period. Finally i thank
God for giving me good health and wisdom to carry out this project.
v
TABLE OF CONTENTS
DECLARATION ............................................................................................................... ii
DEDICATION .................................................................................................................. iii
ACKNOWLEDGMENT .................................................................................................. iv
TABLE OF CONTENTS .................................................................................................. v
LIST OF TABLES .......................................................................................................... vii
LIST OF FIGURES ....................................................................................................... viii
LIST OF PLATES ............................................................................................................ ix
LIST OF ABBREVIATIONS AND ACRONYMS ........................................................ x
DEFINITION OF TERMS .............................................................................................. xi
ABSTRACT ..................................................................................................................... xii
1.0 BACKGROUND TO THE STUDY ........................................................................... 1
1.1 Introduction ............................................................................................................ 1
1.2 Statement of the Problem ....................................................................................... 2
1.3 General Objective................................................................................................... 3
1.4 Specific Objectives................................................................................................. 3
1.5 Research Questions ................................................................................................ 3
1.6 Significance of the Study ....................................................................................... 4
1.7 Scope of the Study ................................................................................................. 4
2.0 LITERATURE REVIEW ........................................................................................... 5
2.1 Review of Past Studies ........................................................................................... 5
2.2 Critical Review of Major Issues ........................................................................... 14
2.3 Conceptual Framework ........................................................................................ 15
2.4 Summary and gaps to be filled ............................................................................. 16
3.0 METHODOLOGY .................................................................................................... 17
3.1 Introduction .......................................................................................................... 17
3.2 Research Design ................................................................................................... 17
3.3 Target Population ................................................................................................. 17
3.4 Sampling Design .................................................................................................. 17
vi
3.5 Data Collection Procedure ................................................................................... 17
3.6 Data Analysis and Presentation ............................................................................ 18
4.0 RESULTS AND DISCUSSIONS ............................................................................. 19
4.1 Introduction .......................................................................................................... 19
4.2 Marketing of horticultural produce ...................................................................... 19
4.3 Factors affecting marketing of Mango fruits in Masongaleni ward ..................... 21
5.0 SUMMARY, CONCLUSIONS AND RECOMMENDATIONS ........................... 34
5.1 Introduction .......................................................................................................... 34
5.2 Summary .............................................................................................................. 34
5.3 Conclusion ........................................................................................................... 35
5.4 Recommendations ................................................................................................ 36
5.5 Suggestion for further studies .............................................................................. 36
REFERENCES ................................................................................................................ 37
APPEDICES .................................................................................................................... 40
Appendix 1: Research authority letter........................................................................ 40
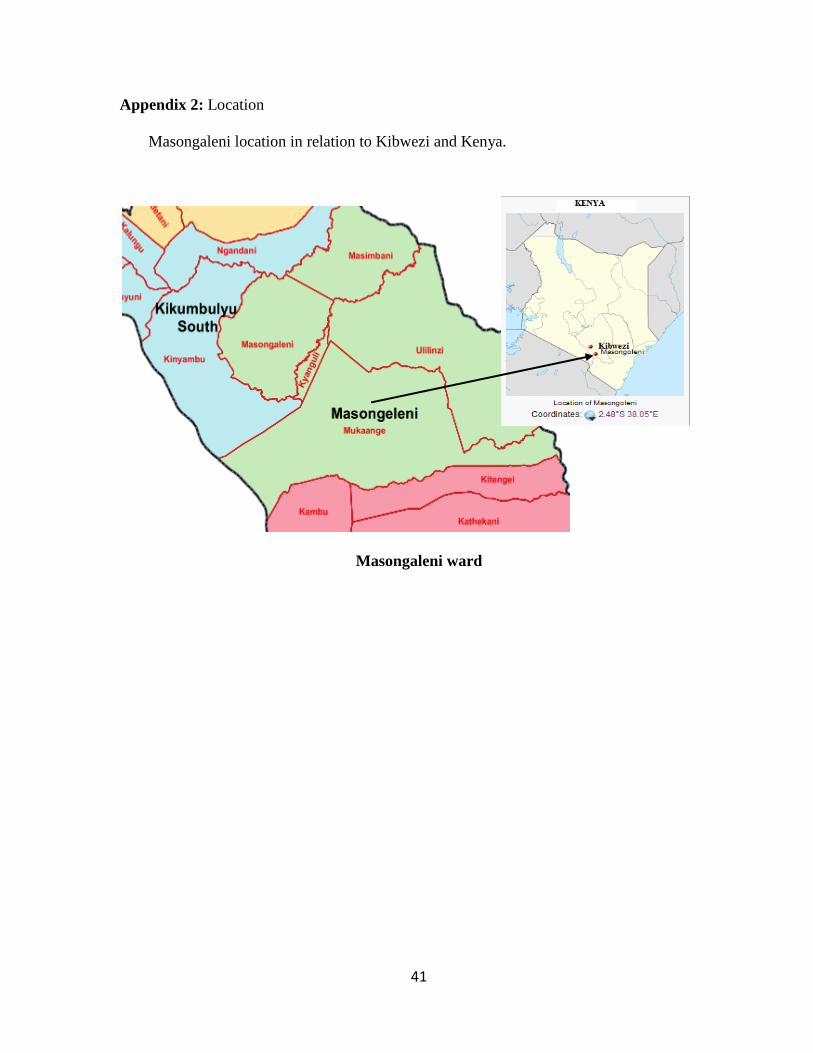
Appendix 2: Location ................................................................................................. 41
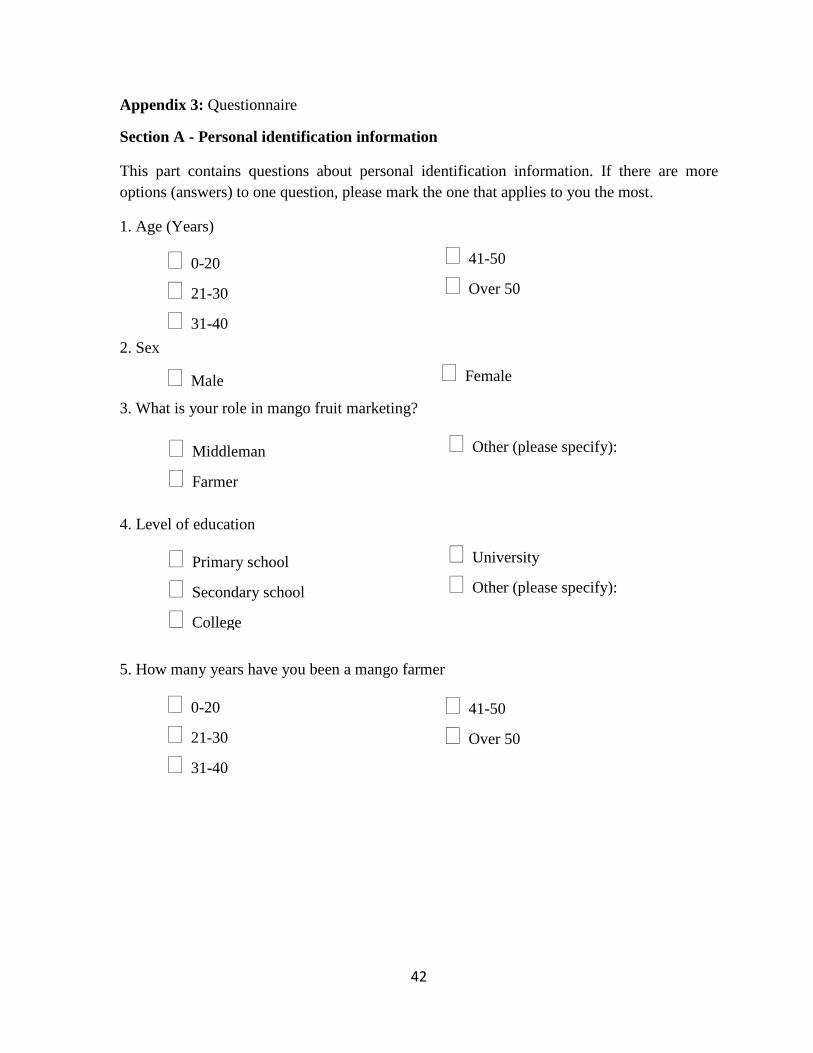
Appendix 3: Questionnaire ........................................................................................ 42
Appendix 4: Budget ................................................................................................... 47
vii
LIST OF TABLES
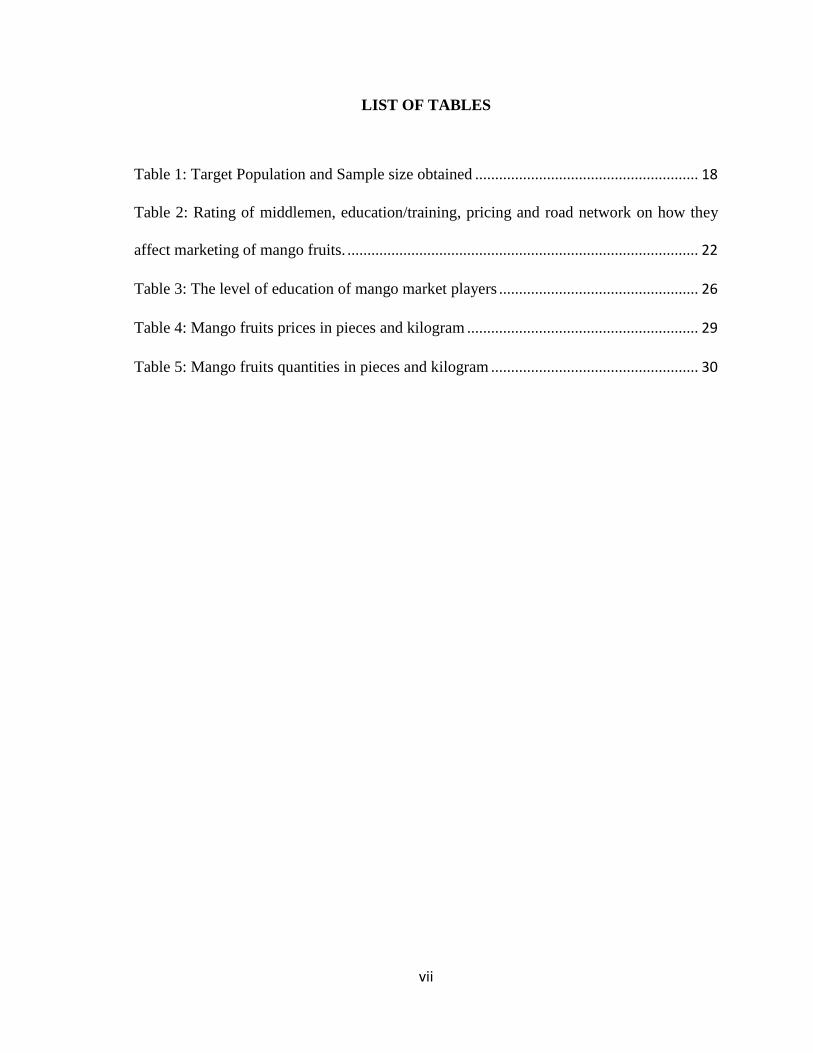
Table 1: Target Population and Sample size obtained ........................................................ 18
Table 2: Rating of middlemen, education/training, pricing and road network on how they
affect marketing of mango fruits. ........................................................................................ 22
Table 3: The level of education of mango market players .................................................. 26
Table 4: Mango fruits prices in pieces and kilogram .......................................................... 29
Table 5: Mango fruits quantities in pieces and kilogram .................................................... 30
viii
LIST OF FIGURES
Figure 1: Conceptual framework on the marketing of horticultural produce in Masongaleni
ward, Kibwezi constituency. ............................................................................................... 15
Figure 2: The percentage of the middlemen, farmers, exporters and District Agricultural
Officer (DAO) in Masongaleni ward of Kibwezi constituency .......................................... 23
Figure 3: The percentage of mango fruit price setters......................................................... 24
Figure 4: Main marketing places for mango fruits by middlemen and farmers .................. 32
Figure 5: The mode of transport and the percentage of mango produce transported to the
market .................................................................................................................................. 33
ix
LIST OF PLATES
Plate 1: A farmer holding a mature apple Mango variety. .................................................. 20
x
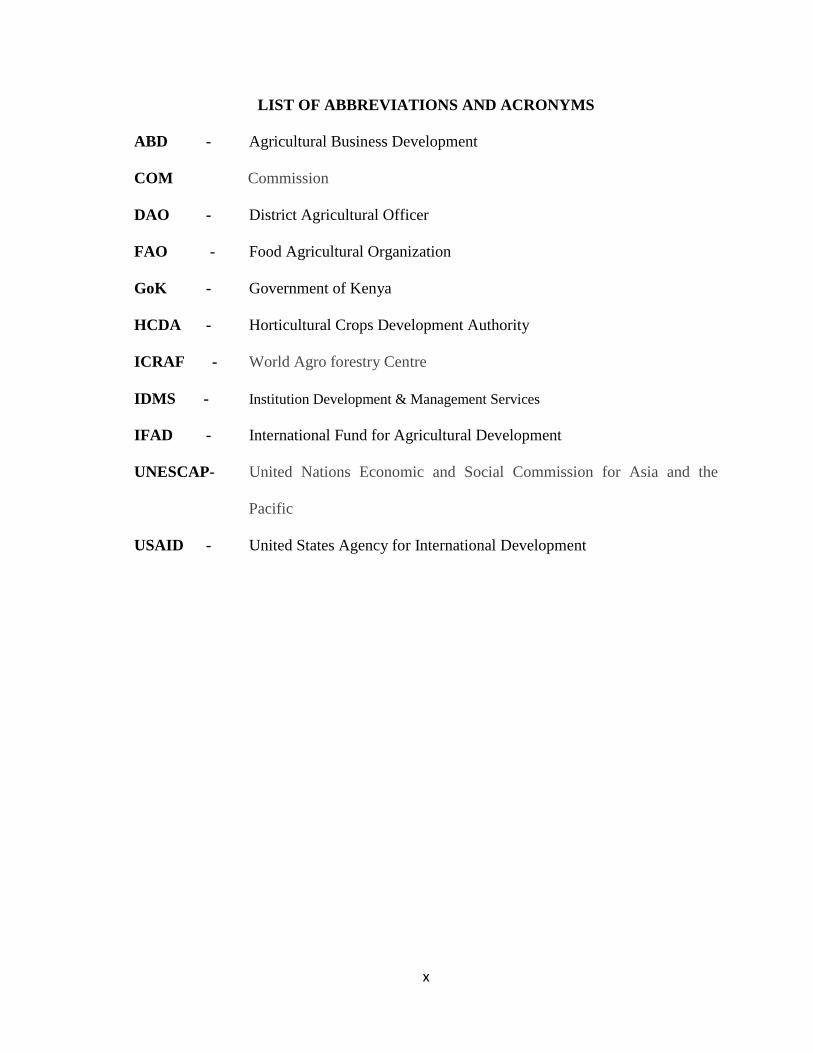
LIST OF ABBREVIATIONS AND ACRONYMS
ABD - Agricultural Business Development
COM Commission
DAO - District Agricultural Officer
FAO - Food Agricultural Organization
GoK - Government of Kenya
HCDA - Horticultural Crops Development Authority
ICRAF - World Agro forestry Centre
IDMS - Institution Development & Management Services
IFAD - International Fund for Agricultural Development
UNESCAP- United Nations Economic and Social Commission for Asia and the
Pacific
USAID - United States Agency for International Development
xi
DEFINITION OF TERMS
Horticulture Horticulture is the practice and science of cultivating gardens, for the
growth of flowers, fruits, or vegetables
Marketing Marketing is a discipline uniting activities aimed at enhancing the
potential for sales of goods and services
Middlemen Market actors who buy mango fruits from farmers at farm gates
Marketing mix A set of controllable marketing tools that an institution uses to produce
the response it wants from its various target markets.
xii
ABSTRACT
Horticultural farmers frequently consider marketing as being their major problem.
However, while they are able to identify such problems as poor prices, lack of transport
and high post-harvest losses, they are often poorly equipped to identify potential solutions.
Mango fruits marketing in Masongaleni ward, of Kibwezi Constituency, is affected by
many challenges among them middlemen who get larger profit share at the expense of the
farmers who apparently have low level of education and limited information on the
prevailing market situation. Prices of mango fruits fluctuate, limiting farmers from making
reliable plans from mango fruits income. Road network is poor where 8.1% of the road is
passable while 91.9% is impassable. The study investigated whether middlemen were
necessary in the marketing of mango fruits, the impact of education/training of mango
farmers and middlemen, determined whether the poor income from mango fruits was
related to farmer’s education level. The research also investigated the effects of road
network. The research was conducted using a case study design and the data was collected
using questionnaire method. There were fifty farmers, twelve middlemen, two exporters
and one District Agricultural Officer (DAO) to whom the questionnaires were
administered. The data was analyzed using SPSS software (Statistical Package for the
Social Sciences) and presented in form of tables and charts. The research found that mango
was the most popular horticultural produce followed by tomatoes, watermelon and
capsicum in that order. Marketing of mango fruits in Masongaleni ward of Kibwezi
constituency was dependent on middlemen, farmers marketing knowledge/training, pricing of
mango fruits and road network. Middlemen affected the marketing the most followed by
prices, road network and education/training respectively. Education/training was not viewed
to be a major factor in price determination but many farmers felt that it could help improve
their income from mango fruits. Infrastructure, particularly road network was found to be
inappropriate. It was recommended that there should be a structured and agreed price
formula beneficial to both middlemen and farmers. To realize better income from mango
fruits all stake holders should be trained on marketing and post harvesting techniques.
Also, road network requires to be improved to make it more accessible to common mode
of transport such as lorries, pickups and bicycles in Masongaleni ward.
1
CHAPTER ONE
1.0 BACKGROUND TO THE STUDY
This chapter contains sections on introduction, the statement of the problem,
general objective, specific objectives, research questions, significance, limitations and the
scope of the study.
1.1 Introduction
Horticultural marketing involve mainly planning production, grading of products,
transport, distribution and pricing, sending information from production area to market and
from market back to producing areas (FAO, 2005).
Horticultural farmers frequently consider marketing as being their major problem.
However, while they are able to identify such problems as poor prices, lack of transport
and high post-harvest losses, they are often poorly equipped to identify potential solutions
(FAO, 2005). In Kenya, changes in demand at the markets are a problem especially where
the farmers marketing education is not well developed (HCDA, 2009).
Studies by ABD (2011) and Kehlenbeck et al., (2010), have revealed that prices of mango
fruits fluctuate by more than 100%, making it very difficult for farmers to plan reliably. As
a result of perishability, lack of technical knowledge on how to handle spoilable produce is
noted to be another important constraint in the industry, (Gathee, 1991). Marketing is one
aspect through which mango fruits industry can be analyzed to help mitigate poor income
to the farmers (GoK, 2003). Mango fruits supply follow seasonal pattern (Niyibigira et al.,
2003) and attract middlemen who exploit mango farmers by paying very little for fruits
while selling at high prices (Mututo, 2010). This study covered marketing of mango fruits
2
in Masongaleni ward, located about 235 Km east of Nairobi, the administration capital of
Kenya. Masongaleni ward is situated at 2.48S and 38.05E and covers approximately 280
square kilometers with a population of 24,283 persons and population density of 75
persons per km2. It is within Kibwezi constituency, Makueni County. The study focused on
the role of middlemen, education/training of farmers and middlemen, prices and
infrastructure particularly road network.
1.2 Statement of the Problem
According to Serem (2010), mango marketing in Kenya has faced numerous
problems among them; poor infrastructure (roads), inadequate post harvest handling
facilities, price fluctuation in internal and external markets and limited knowledge on
marketing. Prices of mango fruits fluctuate from Ks 25 to Ks 5 per fruit limiting farmers
from making reliable plans from mango fruits income (ABD, 2011). In many cases,
farmers receive very low income from their mango fruits sales in spite of these fruits
selling at very high prices to the final consumers (Mututo, 2011). This may result to
farmers abandoning the mango farming sector which may lower their economic levels.
Mango fruit farmers are hardly involved in direct selling of their fruits to the final markets.
Instead, middlemen go to the farm to buy the mango fruits from famers (ABD, 2011).
Middlemen get larger share at the expense of the farmers who apparently have low level of
education and limited information on the prevailing market situation (Serem, 2010).
Infrastructure is poor where 8.1% of the road is passable while 91.9% is impassable
(Kehlenbeck et al., 2010). Since mango is the main cash crop for Masongaleni ward,
failing to address these problems will lead to increase in poverty in the area. It is against
3
this background that the study focused on addressing the challenges affecting marketing of
mango fruits in Masongaleni Ward of Kibwezi Constituency.
1.3 General Objective
To investigate the challenges of marketing of mango fruits in Masongaleni ward of
Kibwezi Constituency.
1.4 Specific Objectives
1. To determine the effects of middlemen on marketing of mango fruits in Masongaleni
ward of Kibwezi Constituency.
2. To investigate the effects of education/training of mango farmers and middlemen on
marketing of mango fruits in Masongaleni ward of Kibwezi Constituency.
3. To examine the effects of prices on marketing of mango fruits in Masongaleni ward of
Kibwezi Constituency.
4. To find out the effects of infrastructure in the marketing of mango fruits in
Masongaleni ward of Kibwezi Constituency.
1.5 Research Questions
1. What are the effects of middlemen on the marketing of mango fruits in Masongaleni
ward of Kibwezi Constituency?
2. What are the effects of education/training of mango farmers and middlemen on
marketing of mango fruits in Masongaleni ward of Kibwezi Constituency?
3. What are the effects of prices on marketing of mango fruits in Masongaleni ward of
Kibwezi Constituency?
4
4. What are the effects of infrastructure in the marketing of mango fruits in Masongaleni
ward of Kibwezi Constituency?
1.6 Significance of the Study
The study determined the impact of middlemen in mango marketing. Through
investigating the impact of education/training of mango farmers and middlemen in
Masongaleni ward, the study determined whether the poor income from mango fruits was
related to their level of education. This could inform the ministry of agriculture on
developing appropriate policies on training and creating awareness among the mango
farmers in Masongaleni ward. The information from the study could guide the
professionals/extension officers in advising farmers on appropriate pricing of mango fruits
which could mitigate the huge price fluctuations. The study could also benefit financial
organizations who may be interested in funding the mango production in the area. The
study established the effects of the infrastructure particularly the road network in the
marketing of mango fruits in Masongaleni ward which could help the government and
other agencies in determining the areas requiring urgent development attention in the ward.
1.7 Scope of the Study
This study covered the middlemen who bought mango fruits on-farm, mango
farmers, pricing of mango fruits and infrastructure particularly road network in relation to
marketing of mango fruits in Masongaleni ward of Kibwezi Constituency. The structured
questionnaire was administered to the mango farmers and the middlemen. It took about
two weeks to collect the data.
5
CHAPTER TWO
2.0 LITERATURE REVIEW
This chapter captures the review of some of the studies that have been carried out
regarding challenges affecting marketing of horticultural produce especially those
involving mango fruits. The literature will be divided into two main categories, namely,
Theoretical review and empirical evidence. The empirical review will further be divided
into six sub-categories that will focus on dependent and independent variables of the study.
They are; horticultural marketing, marketing of mango fruits, role of middlemen on
marketing, impact of education/training of mango farmers and middlemen, effect of prices
and effect of road network on marketing. The chapter will be concluded with a conceptual
framework which will give the hypothetical relationship between the independent and
dependent variables.
2.1 Review of Past Studies
2.1.1 Theoretical Review
The marketing mix is a theoretical tool used in marketing and by marketing
professionals (Umar, 2011). The marketing mix is often crucial when determining a
product or brand's offering, and is often synonymous with the seven Ps to address the
different nature of services: product, price, place, promotion, people, physical facilities and
processes.
In this study the product is mango fruit. Mango fruits can be sold when unripe, ripe
or processed into crisps or juice. In Masongaleni the mango fruits are mainly sold ripe for
local market and unripe for export market.
6
The price element of the marketing mix is dominated by what is being charged for
the mango fruits at the farm gates. The pricing element not only affects the revenues that a
farmer derives from his fruits sales, but also affects consumer’s perceptions of the quality.
Prices are based on the law of supply and demand. It implies that as supply increases the
price will tend to drop or vice versa, and as demand increases the price will tend to
increase or vice versa. Horticultural produce frequently follow this theory and mango fruits
are not exceptional. In mango fruits, this is accelerated by seasonality aspect (Niyibigira et
al., 2003). Fruits supply increases at particular months forcing the price downwards.
Place is the distribution method that the farmer adopts to provide the fruits to the
market in a manner that meets consumer expectations. The development of alternative
modes of distribution has grown significantly; no longer are the consumers confined to the
particular place to get the fruits. Access to market in Masongaleni is mainly through
middlemen.
Promotion encompasses all the tools that farmers can use to provide the market
with information on its offerings: advertising, publicity, public relations and sales
promotional efforts. When one considers the wide variety of publics with which a farmer
needs to communicate, the use of just the middlemen is likely to be ineffective.
The people element of the marketing mix includes all the players that are involved
in buying and selling of mango fruits. Rust and George (2003) explained that where the
microstructure of trade in a product is endogenously determined, buyers and sellers of a
product who wish to trade can choose between middlemen and specialist. Specialists
usually follow defined procedure of arriving at a price such as bidding, whereas the prices
7
quoted by different middlemen are private information that can hardly be obtained.
Middlemen who buy mango fruits from farmers at farm gates are very common in
Makueni County (ABD, 2011).
Physical evidence is the tangible component of the service offering. A variety of
tangible aspects are evaluated by a farmer's target markets, ranging from the infrastructure
to the packaging of the fruits. As transport cost decreases, the prices fall resulting in
increased demand for input use or more output supply according to microeconomic theory
(Varian, 1992). Horticultural sector in most parts of Kenyan’s agricultural areas are
affected negatively by transport costs since such costs are very high (GoK, 2003).
Processes are all the administrative and bureaucratic functions of the mango
marketing: from the harvesting to consumption of the fruits or mango products. While this
might seem quite straight forward, there are numerous other processes that need to be
implemented concurrently (with the payment system, transportation, preservation and
storage) to ensure the highest quality and consumer satisfaction.
2.1.2 Empirical Review
There are several empirical studies available about the challenges affecting
marketing of horticultural produce. These are horticultural marketing, marketing of mango
fruits, role of middlemen, impact of education/training of mango farmers and middlemen,
effects of prices and effect of road network. Reviews and findings of some of the studies
are presented below.
8
2.1.2.1 Horticultural Marketing
Fruit and vegetable sectors are appropriate sectors where small producers are able to
participate due to their low demand on land and their high labor requirements (Andrea, 2012).
According to HCDA (2009), the horticulture sub-sector is the fastest growing industry in
the Agricultural sector. It employs directly and indirectly about 4 million people and
smallholder farmers contribute over 60% of the production. The horticulture industry
generated ks. 73.7 billion in foreign exchange from exported commodities and over ks. 65
billion domestically in the year 2008 (HCDA, 2009).
In horticultural marketing, enhancing collection, transport, selling of the farmers
produce in the city markets and training results in providing cash income and encourage
developments in both production and processing (FAO, 1991).
2.1.2.2 Marketing of Mango Fruits
As is the case for all food stuff, the mango fruit sector needs to be organized in a
more coordinated and integrated way for it to be beneficial to farmers (European Union,
2000). Unfortunately, many challenges hinder proper organization of mango fruit sector.
Studies by GoK, (2003) and Serem, (2010), pointed that poor road infrastructure,
especially the rural and trunk roads constitute significant challenge to agriculture in Africa.
Nearly 50% of African farmers still spend five hours or more to the market. Not only are
there few roads, but transport costs in Africa are among the highest in the world, reaching
as much as 77% of the value of exports (GoK, 2003 and Serem, 2010).
According to Griesbach, (2003), mango fruits provide a significant portion of
households’ income in Kenya. However, Kenya can benefit more from mango fruit sector
9
if farmers can be educated or trained on maximizing prices especially through focusing on
mango fruits products (Steve, 2010). According to Kehlenbeck et al., (2010) the market for
fresh fruit currently constitutes the biggest market for mangoes accounting for almost 90%
(165,000MT) in 2010. Within this market, the urban market is the biggest and most
lucrative accounting for 75% of the total marketed production (14,200MT) valued at ks.5.3
billion annually. Apart from fresh fruit market, there is also processing of fresh fruits for
extraction of juice. International market for mango fruits from Kenya account for 10% total
value of marketed mangoes estimated at ks. 800 million in 2011 (HCDA, 2011).
According to Serem, (2010) major mango marketing challenges in Kenya include, poor
roads, inadequate post harvest handling facilities, price fluctuation in internal and external
markets and limited knowledge on value addition opportunities.
ABD (2011), pointed out that the mango fruits distribution and marketing channels
are generally dominated by middlemen who play an important role in getting farmers
produce to the market. The farmers selling through middlemen at farm gates get less
income from their produce compared to the value released by the processors and exporters.
Mututo (2011) found out that income from mango farming is shaping livelihoods in most
families in Makueni County as farmers in the County adopt modern mango farming in
agribusiness venture. He recommended that farmers need to form organized groups to
assist in transporting fruits to the markets rather than using middlemen to get fruits from
their farms to the markets.
A study by Musinga et al., (2012) found out that mango fruit prices vary per mango
variety. On the overall Kent, Apple, Tommy and Ngowe fetch high prices in that order.
Main challenge in Kibwezi is however on the distribution and marketing channels which
10
are generally dominated by middlemen who dictate the prices to farmers (Mututo, 2011).
According to ABD, (2011) baseline survey of trees, there are 2,288 mango farmers in
Kibwezi constituency with a total of 107,041 number of mango trees. This gives an
average of 47 trees holding per farmer. The main varieties are Van dyke, Kent, Tommy,
Ngowe, and Apple. ABD, (2011) pointed out that mango fruits for export market are sold
at an average price of Ks 25 per fruit while the ones for local market are sold at a farm gate
price of as low as Ks 5 per fruit. These challenges on poor roads, price fluctuation, limited
farmer’s knowledge on marketing and many middlemen in Masongaleni ward requires to
be investigated to determine how they impact on the marketing of mango fruits.
2.1.2.3 Role of Middlemen on Marketing
The middleman concept is frequently used in marketing literature to denote a
particular category of market actors. A major problem is that the notion of a middleman is
used to describe actors with quite different roles in the market system (Carl, 2010).
Consequently, the interpretation of the concept becomes somewhat fluid and vague.
On another study, Broadbent (1985) stated that provided middlemen operate in an
atmosphere of strong competition it is unlikely they will make excessive profits. When the
retail and producer prices are high middlemen try to control the market prices by reducing
their market margin and when the prices are low middlemen try to get more benefits by
increasing their market margin (Sandika, 2011). However, Broadbent (1985) noted that, as
in all businesses there are some middlemen who are dishonest. The challenge is to identify
reputable middlemen and to ensure that the marketing system minimizes opportunities for
dishonesty. Organizing mango production through farmers groups minimizes the need for
middlemen because farmers have better chances of deciding how their products can reach
11
the markets (Andrea, 2012).
According to USAID (2005), middlemen tend to control the mango sector from
purchasing of mango fruits in the farms, through ripening facilities and distribution
networks to the markets. Supermarkets tend to build long-term relationships with preferred
middlemen in order to guarantee a continuous mango supply (GoK, 2003). USAID (2005)
articulated that some farmers and middlemen may open new opportunities as they permit
access to particular market segments. At the same time, the process of distributing market
shares is accompanied by marginalization and exclusion, as middlemen may impose
prohibitively high barriers on farmers in terms of short-run and long-run efforts needed for
marketing (FAO, 2004). According to Mututo, (2011) linking of farmers to markets is
necessary in order to overhaul the sub sector because the mango market is mainly being
controlled by unscrupulous middlemen.
2.1.2.4 Effect of Education/training on Marketing
Feder et al., (1987) noted that training farmers is beneficial because it results in
improvement in the management of the farm. Lack of proper training on the other hand
leads to various challenges. For example Serem (2010), pointed lack of education on value
addition as one of the factors challenging the marketing of mangoes in Kenya. Lack of enough
training may result to seasonal over-production, inadequate post-harvest handling
techniques and limited access to information on technology in value addition (Serem, 2010
and Gathee, 1991). All these challenges affected the marketing of mango fruits.
Niyibigira et al., (2003) noted that the main constraints in the production and
marketing of mango fruits, included lack of technical know-how on scientific management
12
practices. Kameri, (2012) established that, training and research is one of the major
requirements for profitable enterprise and recommended that research on marketing should
be intensified and the findings made available to farmers. Farmers’ success and
sustainability are determined by extent of their equitable participation in markets
accompanied by their higher level of training on marketing (Serem, 2010).
2.1.2.5 Effect of Prices on Marketing
Pricing of mango fruits is one of the most important factors that determine the
economic status of mango farmers (USAID, 2005). According to Steve (2010), mango fruits
prices can be raised if farmers can focus on mango concentrate for juice production,
consumption on fresh fruits and dried fruit products. There should be a shift from mere
“marketing” to “supply chain management” in order to realize more prices (Sarada, 2013).
Analysis of the production segment of the mango value chain shows that mango
farmers can make significant returns from mango farming (Griesbach, 2003). Given
prevailing cost structures and mango prices, a farmer adopting good agricultural practices
can make a gross profit of ks. 161,200 per acre per year (Kehlenbeck et al., 2010). To
generate this level of income however, farmers have to invest on average ks. 1,088 per tree
annually (or ks. 108,800 per acre) (Musinga et al., 2012).
2.1.2.6 Effect of Infrastructure on Marketing
Improvement of rural roads results in elimination of frequent road closures during
rainy seasons, reduction in vehicle operating costs and increased traffic volume, ownership
of motorized vehicles, access to market and social services, and improvement in
passenger services (World Bank, 1996). Villages with good road network have a
13
significantly improved situation in terms of agricultural production and incomes compared
to the villages with poor road network (Raisuddin and Hossain, 1990).
The improvements of feeder roads, bridge construction, and rural road routine and
spot maintenance results in increased participation of vendors at local markets, increased
variety of available agricultural products and the geographic size of markets for
agricultural products (Lucas et al., 1995 and Torbjorn and Bharat, 2012). Good road
accessibility significantly reduces farm gate prices of manufactured goods and increase
farm gate prices of agricultural goods (Torbjorn and Bharat, 2012). Households with poor
access to road are confronted with wider price bands and are less likely to participate in
markets, so policies towards integrating remote areas with urban areas through
infrastructure development are needed (Torbjorn and Bharat, 2012). This raises
speculations that poor road network among other factors could be contributing to huge
price fluctuations in Masongaleni ward.
Provision or improvement of transport services results in reduction of transport
cost and/or travel time which in turn lead to increased production (Torbjorn and Bharat,
2012 and IFAD, 2001). Similarly, Bhalla, (2000) argued that the marginal cost decreases
as a result of improved transportation. In line with this, improving transport in
Masongaleni ward will likely raise profit margins of the mango farmers. World Bank
(1994) terms transport as one of the factors of production. Local farmers of Masongaleni
ward may benefit from improvement of roads because of the reductions in the cost of
transporting agricultural products to markets.
14
2.2 Critical Review of Major Issues
There are many challenges that affect horticultural marketing which have been
brought to light in various studies. HCDA (2009), has summarized these challenges as
follows; Inadequate legal and policy frameworks: Low effectiveness of extension services;
Low application of modern technology; Poor governance in agricultural institutions;
Inadequate quality control systems; Multiplicity of taxes; Low availability of capital and
limited access to affordable credit; Inadequate market and marketing infrastructure; High
cost, adulteration and low application of key inputs; Pests and diseases; Frequent droughts
and floods; Lack of storage and processing facilities; Poor infrastructure and Increasing
incidence of HIV/AIDS, malaria and waterborne diseases.
These challenges have been generalized. This makes it difficult to offer solution to
particular areas. In fact the umbrella horticultural body in Kenya, HCDA, has instituted
some interventions such as; farmers exchange tours; building capacity on technical skills
through farmers training; group formations; improved research; provision of transport and
cooling facilities; market surveys and exhibitions.
However, the major issues that require investigation in marketing of mango fruits
in Masongaleni ward have remained as the middlemen who buy mango fruits at farm gates,
the level of education of farmers and middlemen, mango prices and road infrastructure.
The middlemen have been accused of exploiting the farmers (Mututo, 2011). The level of
education/training on mango fruits marketing is suspected to be low leading to poor
management of the fruits marketing (Niyibigira et al., 2003). The variation in mango prices
has left farmers with no clear idea on what to expect from their production. The roads are
in a state that limits accessibility to many areas forcing marketing costs to be high.
15
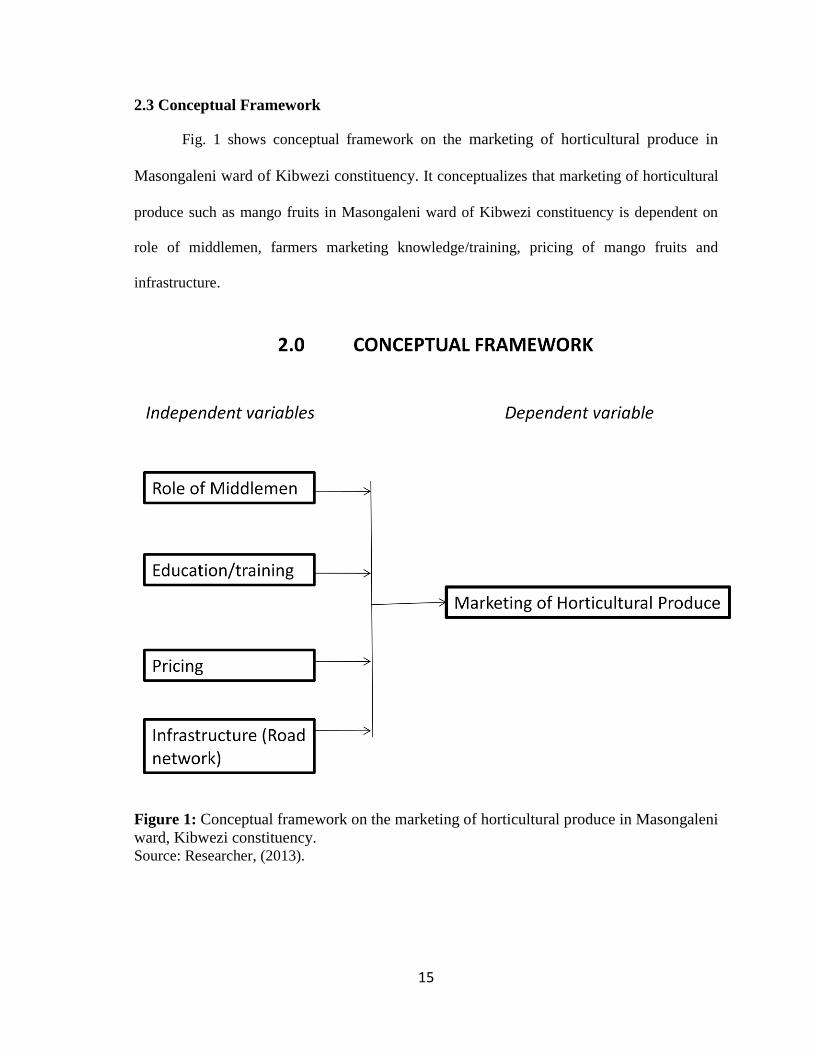
2.3 Conceptual Framework
Fig. 1 shows conceptual framework on the marketing of horticultural produce in
Masongaleni ward of Kibwezi constituency. It conceptualizes that marketing of horticultural
produce such as mango fruits in Masongaleni ward of Kibwezi constituency is dependent on
role of middlemen, farmers marketing knowledge/training, pricing of mango fruits and
infrastructure.
Figure 1: Conceptual framework on the marketing of horticultural produce in Masongaleni
ward, Kibwezi constituency. Source: Researcher, (2013).
16
2.4 Summary and gaps to be filled
Some authors have argued that middlemen are important in marketing (Sandika,
2011) while others have indicated that middlemen should be avoided (Mututo, 2011). It is
therefore important to establish whether middlemen are necessary in marketing of mango
fruits in Masongaleni ward. The level of education on mango famers in Masongaleni ward
and how it is affecting the marketing of mango fruits has not been clearly studied.
While HCDA has initiated an intervention on training (Serem, 2010), the level of
education / training of farmers and middlemen in Masongaleni still appear to be low. From
the literature, it has not been clear whether Masongaleni farmers know how to price mango
fruit properly, because no study has been done to establish this. The past studies have
generalized the aspect of infrastructure in marketing. This has made it difficult to know
clearly the effect of specific infrastructure such as roads in a particular region.
17
CHAPTER THREE
3.0 METHODOLOGY
3.1 Introduction
This chapter will focus on the research design, target population, sampling design,
data collection procedures, data analysis and presentation.
3.2 Research Design
A case study design was applied. This design is useful for testing whether or not a
specific theory applies to observable fact in the real world (Yin, 2003). In the study, the
role of middlemen, education/training, pricing and infrastructure particularly road network
was tested to see how they affected marketing of mango fruits in Masongaleni ward,
Kibwezi constituency.
3.3 Target Population
It was estimated that a population of 200 farmers (households) and 25 middlemen
were involved in mango marketing in Masongaleni ward.
3.4 Sampling Design
Stratified sampling method was used to get a sample of farmers and middlemen in
Masongaleni population. A stratified sample of 50 farmers, 12 middlemen, 2 exporters and
1 DAO (Table 1) was selected using the random number table.
3.5 Data Collection Procedure
Questionnaires were administered directly to individual farmers, middlemen,
exporters and DAO (using two-stage stratified sampling technique as outlined by Levy &
Lemeshow (1999). The first stratum included mango farmers and the second involved the
18
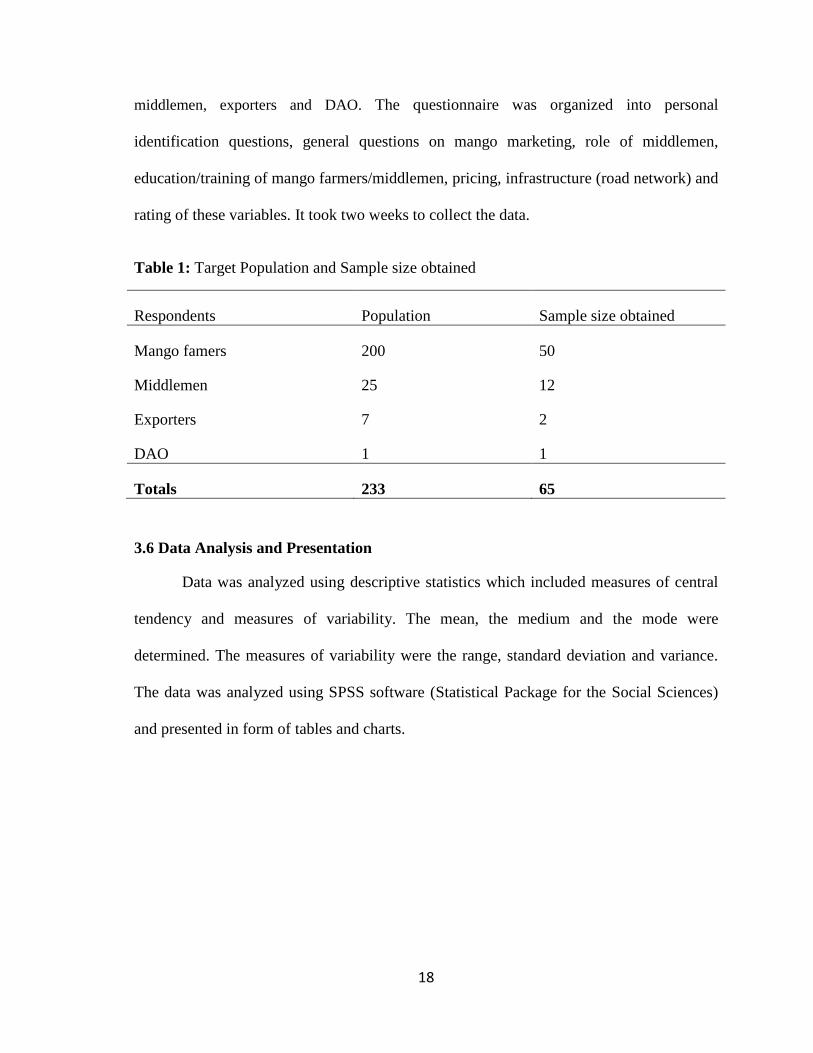
middlemen, exporters and DAO. The questionnaire was organized into personal
identification questions, general questions on mango marketing, role of middlemen,
education/training of mango farmers/middlemen, pricing, infrastructure (road network) and
rating of these variables. It took two weeks to collect the data.
Table 1: Target Population and Sample size obtained
Respondents Population Sample size obtained
Mango famers 200 50
Middlemen
Exporters
DAO
25
7
1
12
2
1
Totals 233 65
3.6 Data Analysis and Presentation
Data was analyzed using descriptive statistics which included measures of central
tendency and measures of variability. The mean, the medium and the mode were
determined. The measures of variability were the range, standard deviation and variance.
The data was analyzed using SPSS software (Statistical Package for the Social Sciences)
and presented in form of tables and charts.
19
CHAPTER FOUR
4.0 RESULTS AND DISCUSSIONS
4.1 Introduction
Sixty five questionnaires were administered in August 2013 in Masongaleni ward
of Kibwezi constituency and the response was a 100%. It was noted that 9.1% of the
mango players were over 50 years while 34.4% ranged between 41-50 years. 17.2% ranged
between 31-40 years. 4.7% were aged between 21-30 years while 4.7% were less than 20
years. 81.3% of the respondents were males while only 18.8% were females. 92.1% had 20
years experience in mango farming, 4.8% had between 21 - 30 years experience, 1.6% had
between 21-30 years experience while 1.6% had experience of over 50 years in mango
farming.
4.2 Marketing of horticultural produce
Mango was found to be the most popular horticultural produce in Masongaleni with
63.1% followed by tomato with 18.5%, watermelon with 4.6% and capsicum 1.5%. All the
other produce constituted 12.3%. Respondents gave the following reasons for preferring
mango; drought resistant, long lifespan, ready export and local market, fetches better
income and yield more than other produce, easy to plant and to manage, requires less water
and while it produces once yearly it tripled in production. Mango was termed as the only
export crop in Masongaleni. In every ten homesteads, seven had mangoes to which they
depended on for their income. Respondents said that mango was; the most viable income
generating activity in the area, long term investment and its production cost was low
compared to the other horticultural produce. Further, it did not involve a lot of supervision
while in early stages. Mango was preferred as it is friendly to the environment and the
20
climate is favorable to mango farming. Farmers along the Athi river bank are able to do
irrigation and thus increase their income. In Masongaleni, the most popular mango variety
was Apple which accounted for 93% of the sales, while Ngowe was second with 5.2%
followed by Kent with 1.7%. ABD, (2011), Musinga et al, (2012) had pointed out that
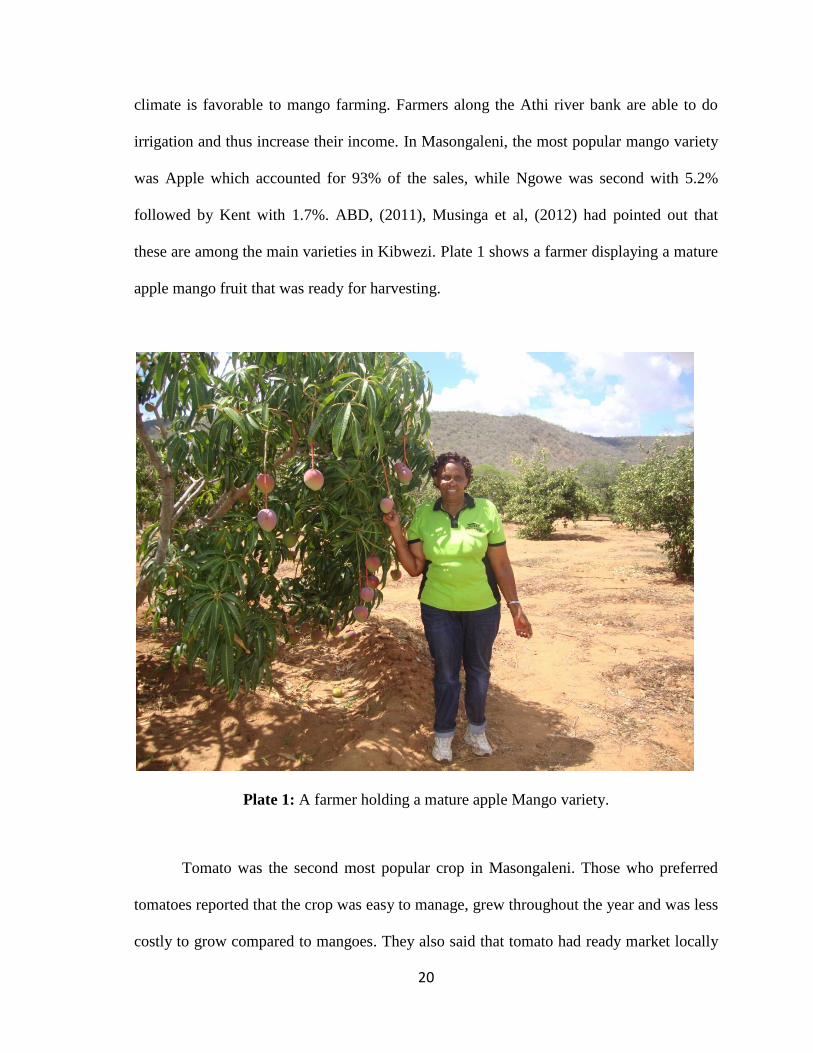
these are among the main varieties in Kibwezi. Plate 1 shows a farmer displaying a mature
apple mango fruit that was ready for harvesting.
Plate 1: A farmer holding a mature apple Mango variety.
Tomato was the second most popular crop in Masongaleni. Those who preferred
tomatoes reported that the crop was easy to manage, grew throughout the year and was less
costly to grow compared to mangoes. They also said that tomato had ready market locally
21
and was a short term crop that gave quick and better returns. The community was able to
buy most of the produce without farmer having to ferry the yield far to the market.
Respondents said the crop did not require middlemen or training of farmers.
Capsicum was the third most preferred horticultural crop. Those who preferred
capsicum pointed such reasons as ease of management, ability to sell at farm gate, long
harvesting period and ability to withstand market changes such as fluctuations in demand
and prices. Watermelon was the fourth most preferred horticultural crop. Those who
preferred watermelon noted that the area had good climate for the crop, it did not require a
lot of water and was easier to market locally.
4.3 Factors affecting marketing of Mango fruits in Masongaleni ward
The main factors affecting marketing of mango fruits in Masongaleni ward were
found to be middlemen, education/training of mango farmers/middlemen, pricing and
infrastructure (road network). These factors, which were also independent variables under
study, were rated with a view of finding out which among them influenced marketing of
mango most. It was noted that middlemen had most effects followed by pricing, then road
network and lastly education/training of farmers. Serem (2010), had already given an
insight about factors such as infrastructure and prices and their effects on mango fruits
marketing.
Table 2 shows the ratings of middlemen, education/training of mango
farmers/middlemen, pricing and road network basing on the effects on marketing of mango
fruits in Masongaleni ward. The rates were low, moderate and very high. 58.5% of the
respondents reported that the effect of middlemen on marketing of mango fruits was very
22
high. Majority of the respondent reported education/training to only have moderate effect
on marketing of mango fruits.
Table 2: Rating of middlemen, education/training, pricing and road network on how they
affect marketing of mango fruits.
Effects on Marketing of Mango fruits in Masongaleni ward
Low Moderate Very High
Middlemen 13.80% 26.20% 58.50%
Pricing 20% 33.80% 46.60%
Education/Training 27.70% 43.10% 27.70%
Road network 27.70% 29.20% 41.50%
4.3.1 Middlemen
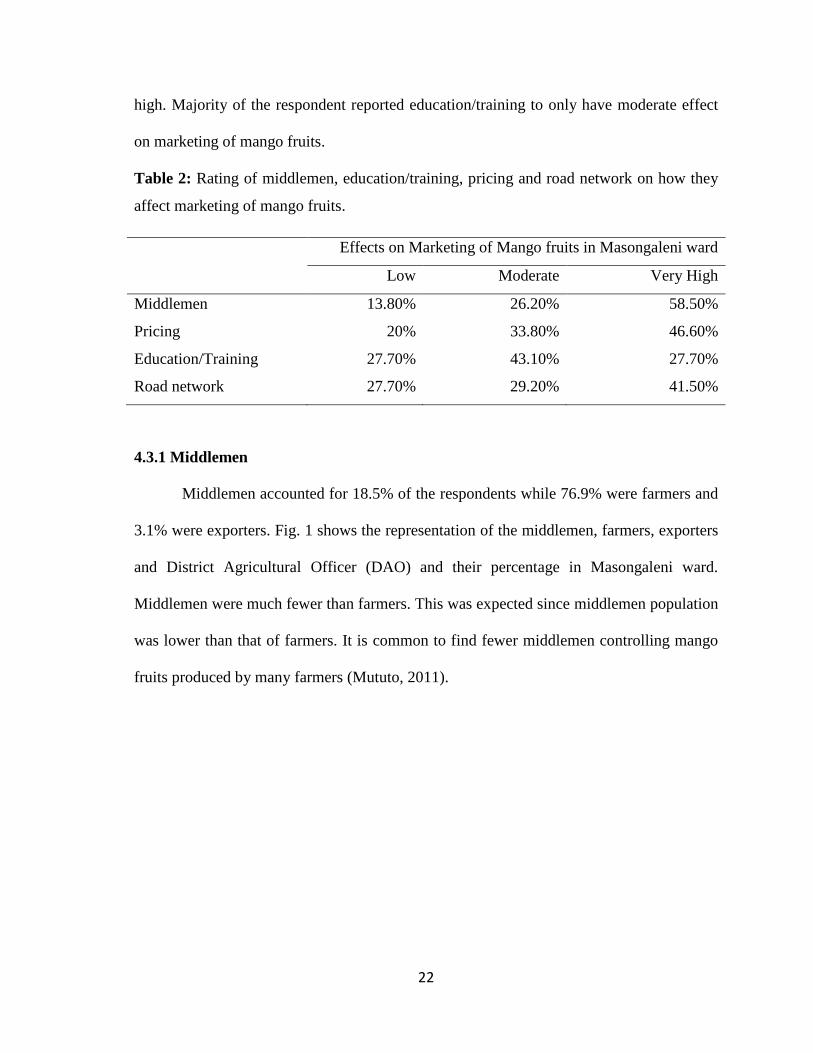
Middlemen accounted for 18.5% of the respondents while 76.9% were farmers and
3.1% were exporters. Fig. 1 shows the representation of the middlemen, farmers, exporters
and District Agricultural Officer (DAO) and their percentage in Masongaleni ward.
Middlemen were much fewer than farmers. This was expected since middlemen population
was lower than that of farmers. It is common to find fewer middlemen controlling mango
fruits produced by many farmers (Mututo, 2011).
23
Figure 2: The percentage of the middlemen, farmers, exporters and District Agricultural
Officer (DAO) in Masongaleni ward of Kibwezi constituency
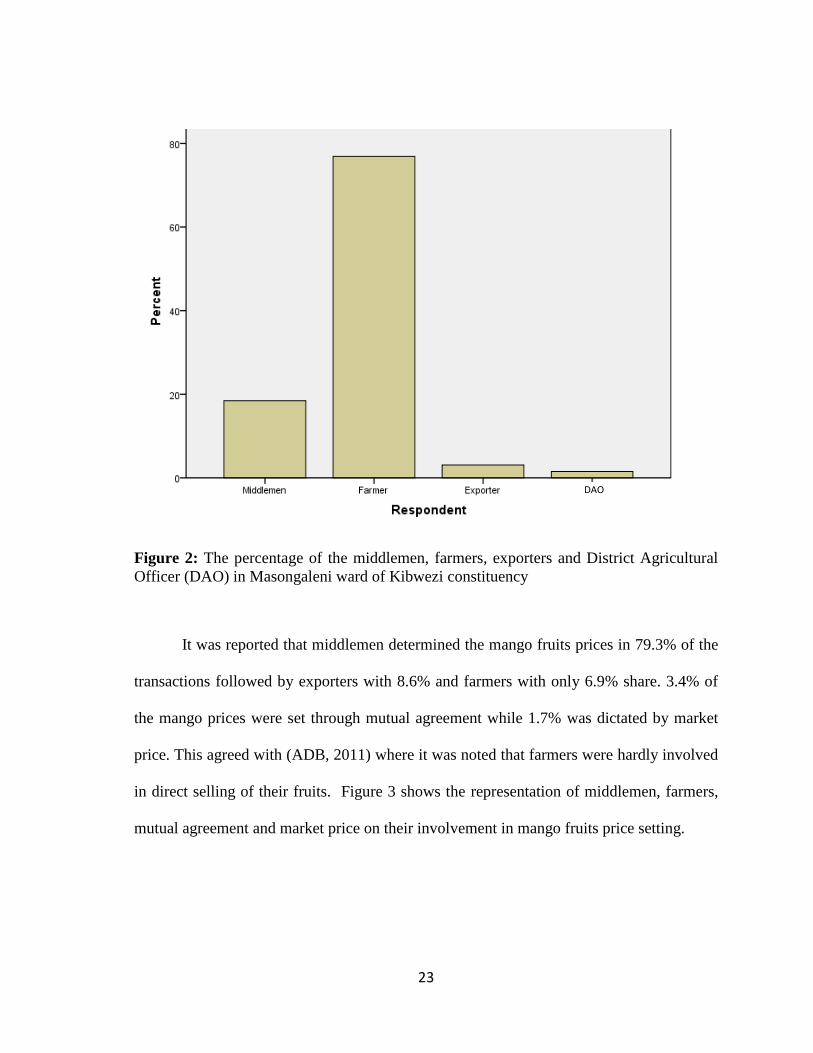
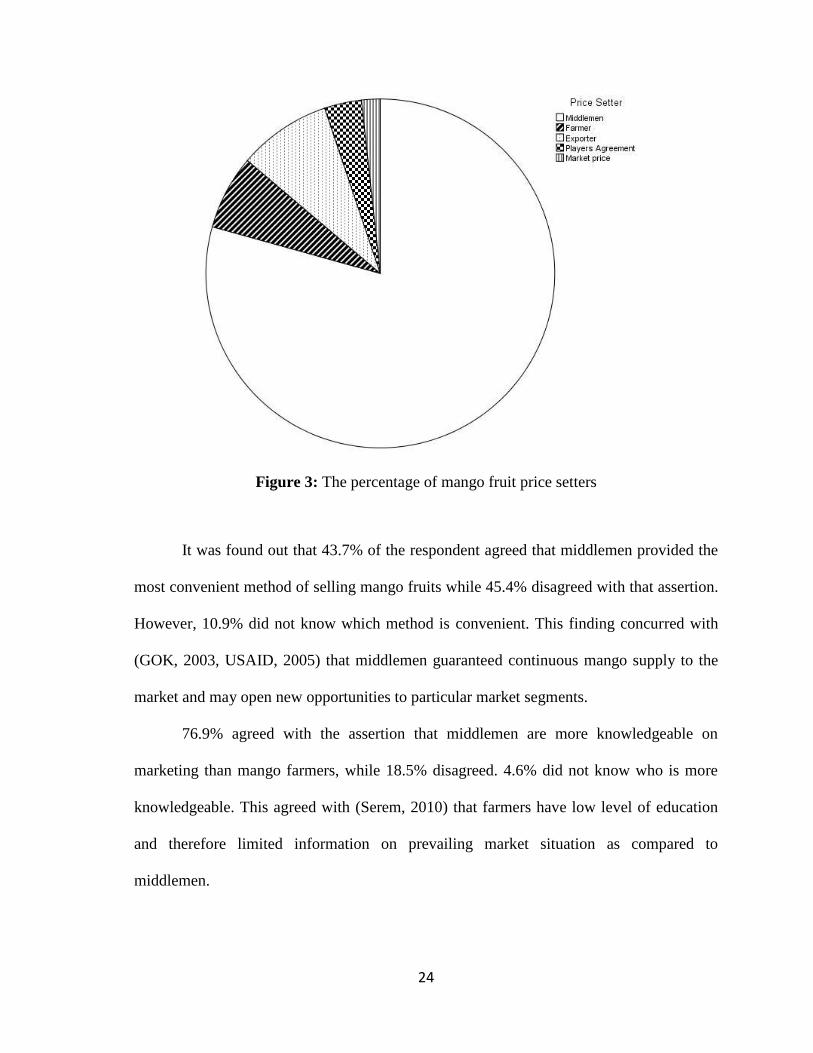
It was reported that middlemen determined the mango fruits prices in 79.3% of the
transactions followed by exporters with 8.6% and farmers with only 6.9% share. 3.4% of
the mango prices were set through mutual agreement while 1.7% was dictated by market
price. This agreed with (ADB, 2011) where it was noted that farmers were hardly involved
in direct selling of their fruits. Figure 3 shows the representation of middlemen, farmers,
mutual agreement and market price on their involvement in mango fruits price setting.
.
DAO
24
Figure 3: The percentage of mango fruit price setters
It was found out that 43.7% of the respondent agreed that middlemen provided the
most convenient method of selling mango fruits while 45.4% disagreed with that assertion.
However, 10.9% did not know which method is convenient. This finding concurred with
(GOK, 2003, USAID, 2005) that middlemen guaranteed continuous mango supply to the
market and may open new opportunities to particular market segments.
76.9% agreed with the assertion that middlemen are more knowledgeable on
marketing than mango farmers, while 18.5% disagreed. 4.6% did not know who is more
knowledgeable. This agreed with (Serem, 2010) that farmers have low level of education
and therefore limited information on prevailing market situation as compared to
middlemen.
25
When respondents were asked whether they thought middlemen exploited farmers’
unfairly, 78.5% agreed while 18.5% disagreed.3.1% did not respond to this question. This
concurred with (Mututo, 2010) that middlemen exploit mango farmers by paying very little
for fruits while selling at high prices. However, it was noted that more than 90% of farmers
relied on middlemen to whom they sold their mango fruits at farm gates. This agreed with
Sandika, (2011), that middlemen are important in marketing. Respondents suggested that
to promote good relationship between the farmers and middlemen, the following should be
done; Farmers should form groups and liaise with HCDA which should source for the
market and the best prices for the farmers. Farmers should be educated/trained on mango
production, marketing and pricing. Government should formulate policies and procedures
on pricing of mango fruits. Farmers and exporters should enter into an agreement on
pricing of mango fruits whereby middlemen earn a commission paid by the exporters. A
price formula should be developed to accommodate both farmers and the middlemen.
26
4.3.2 The effects of education/training of mango farmers and middlemen on
marketing of mango fruits.
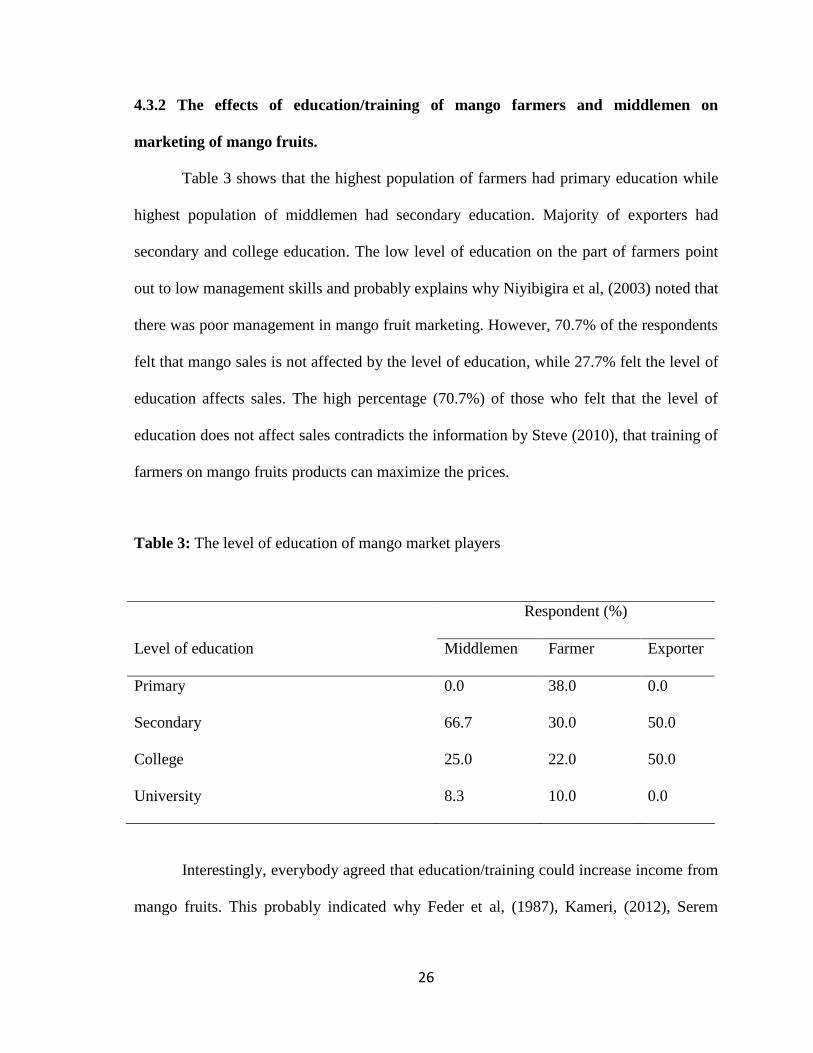
Table 3 shows that the highest population of farmers had primary education while
highest population of middlemen had secondary education. Majority of exporters had
secondary and college education. The low level of education on the part of farmers point
out to low management skills and probably explains why Niyibigira et al, (2003) noted that
there was poor management in mango fruit marketing. However, 70.7% of the respondents
felt that mango sales is not affected by the level of education, while 27.7% felt the level of
education affects sales. The high percentage (70.7%) of those who felt that the level of
education does not affect sales contradicts the information by Steve (2010), that training of
farmers on mango fruits products can maximize the prices.
Table 3: The level of education of mango market players
Respondent (%)
Level of education Middlemen Farmer Exporter
Primary 0.0 38.0 0.0
Secondary 66.7 30.0 50.0
College 25.0 22.0 50.0
University 8.3 10.0 0.0
Interestingly, everybody agreed that education/training could increase income from
mango fruits. This probably indicated why Feder et al, (1987), Kameri, (2012), Serem
27
(2010), noted that training of farmers is one of the major requirements for profitable
enterprise.
When respondents were asked whether the level of education could improve post-
harvesting techniques, all agreed. This is consistent with what many respondents felt with
regards to the importance of training in increasing the income from mango fruits. Probably
most farmers felt that they lost more income during post-harvesting and therefore
education/training on post harvesting handling techniques could avert such losses.
Respondents suggested that education could be raised through; training, seminars
and workshops by government and non-governmental organizations on good farming
skills, management and handling techniques. It was also suggested that there should be
more involvement of field officers and training of all mango players on mango production.
28
4.3.4 The effects of Prices on marketing of mango fruits in Masongaleni Ward.
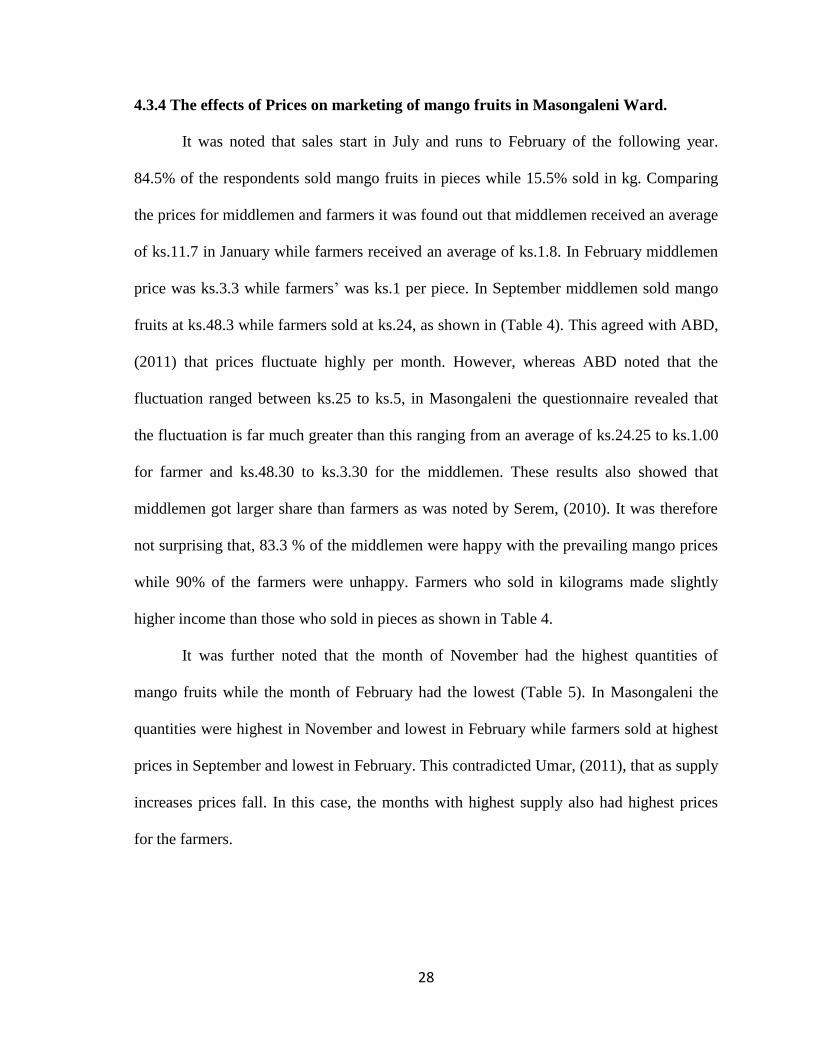
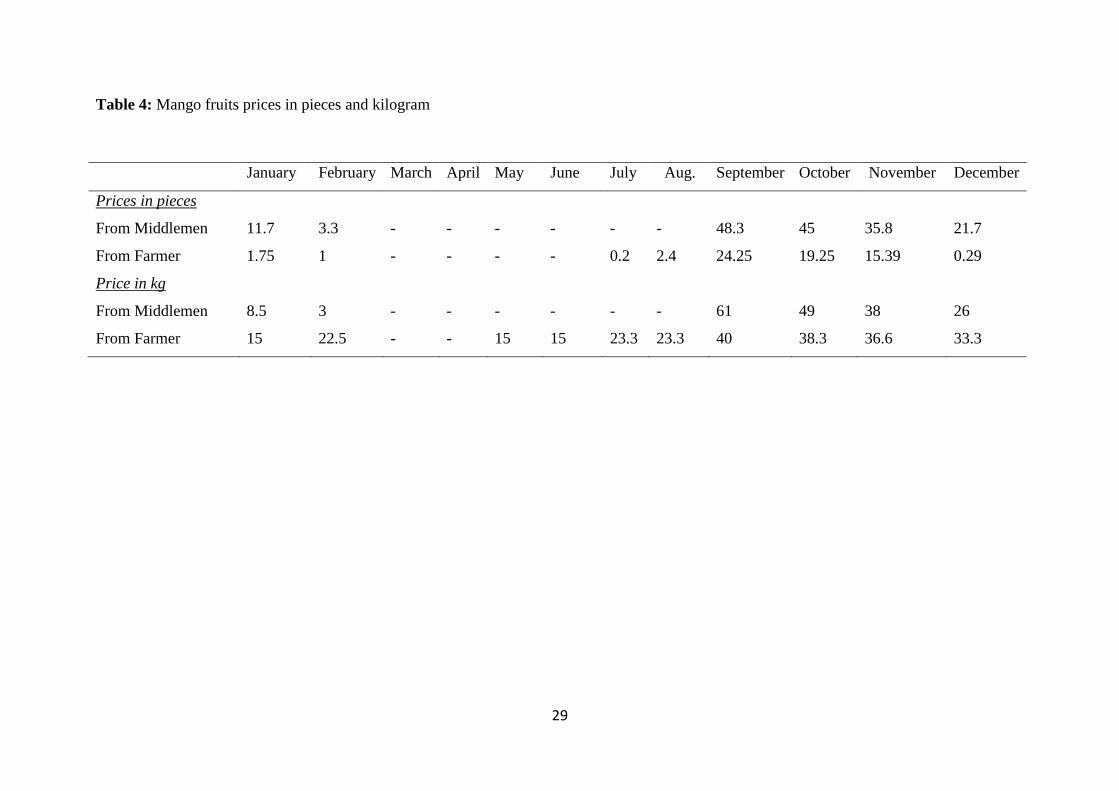
It was noted that sales start in July and runs to February of the following year.
84.5% of the respondents sold mango fruits in pieces while 15.5% sold in kg. Comparing
the prices for middlemen and farmers it was found out that middlemen received an average
of ks.11.7 in January while farmers received an average of ks.1.8. In February middlemen
price was ks.3.3 while farmers’ was ks.1 per piece. In September middlemen sold mango
fruits at ks.48.3 while farmers sold at ks.24, as shown in (Table 4). This agreed with ABD,
(2011) that prices fluctuate highly per month. However, whereas ABD noted that the
fluctuation ranged between ks.25 to ks.5, in Masongaleni the questionnaire revealed that
the fluctuation is far much greater than this ranging from an average of ks.24.25 to ks.1.00
for farmer and ks.48.30 to ks.3.30 for the middlemen. These results also showed that
middlemen got larger share than farmers as was noted by Serem, (2010). It was therefore
not surprising that, 83.3 % of the middlemen were happy with the prevailing mango prices
while 90% of the farmers were unhappy. Farmers who sold in kilograms made slightly
higher income than those who sold in pieces as shown in Table 4.
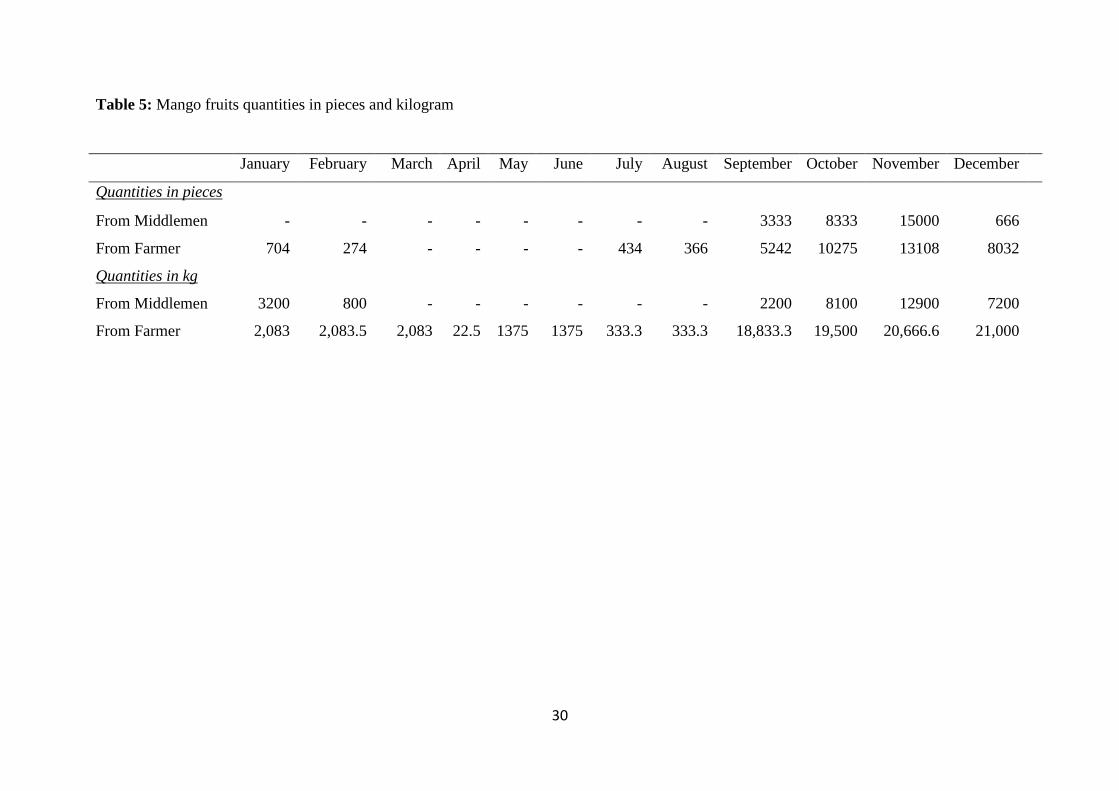
It was further noted that the month of November had the highest quantities of
mango fruits while the month of February had the lowest (Table 5). In Masongaleni the
quantities were highest in November and lowest in February while farmers sold at highest
prices in September and lowest in February. This contradicted Umar, (2011), that as supply
increases prices fall. In this case, the months with highest supply also had highest prices
for the farmers.
29
Table 4: Mango fruits prices in pieces and kilogram
January February March April May June July Aug. September October November December
Prices in pieces
From Middlemen 11.7 3.3 - - - - - - 48.3 45 35.8 21.7
From Farmer 1.75 1 - - - - 0.2 2.4 24.25 19.25 15.39 0.29
Price in kg
From Middlemen 8.5 3 - - - - - - 61 49 38 26
From Farmer 15 22.5 - - 15 15 23.3 23.3 40 38.3 36.6 33.3
30
Table 5: Mango fruits quantities in pieces and kilogram
January February March April May June July August September October November December
Quantities in pieces
From Middlemen - - - - - - - - 3333 8333 15000 666
From Farmer 704 274 - - - - 434 366 5242 10275 13108 8032
Quantities in kg
From Middlemen 3200 800 - - - - - - 2200 8100 12900 7200
From Farmer 2,083 2,083.5 2,083 22.5 1375 1375 333.3 333.3 18,833.3 19,500 20,666.6 21,000
31
When respondents were asked whether they knew their profit margin when selling
mango fruits, 82.9% said they knew while 14% said they did not know. This was consistent
with the 81.5% of the respondents who said they knew how to calculate the cost of
production.
It was found out that 69.2% of the respondents felt that group selling was more
profitable than individual selling while 23.1% disagreed. In contrast only 5.2% sold as a
group while 94.8% sold individually. When respondents were asked for their
recommendation on the pricing of mango fruits, they said the following; farmers should be
organized in groups, agree on the prices with exporters of mango produce, government
through HCDA should enforce and regulate the prices, farmers should determine the prices
of their mango produce since they are the ones who know the production costs. Prices should
be driven by supply and demand dynamics rather than adhoc pricing by middlemen. With
poor production, farmers cannot get good prices for their produce, thus farmers should be
trained on production and handling techniques. Majority of the farmers suggested that groups
of farmers should be formed to facilitate production and marketing of mango fruits. Their
suggestions were in line with Andrea, (2012) who noted that organizing mango production
through farmers groups minimizes the need for middlemen.
32
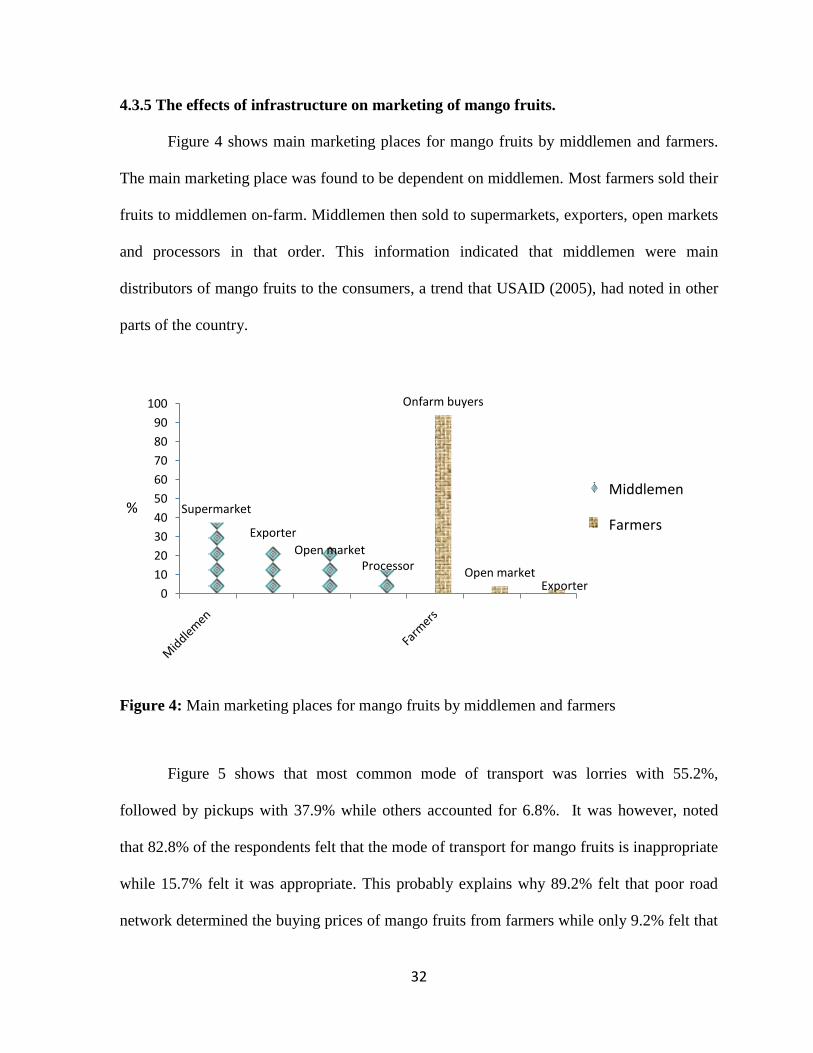
4.3.5 The effects of infrastructure on marketing of mango fruits.
Figure 4 shows main marketing places for mango fruits by middlemen and farmers.
The main marketing place was found to be dependent on middlemen. Most farmers sold their
fruits to middlemen on-farm. Middlemen then sold to supermarkets, exporters, open markets
and processors in that order. This information indicated that middlemen were main
distributors of mango fruits to the consumers, a trend that USAID (2005), had noted in other
parts of the country.
Figure 4: Main marketing places for mango fruits by middlemen and farmers
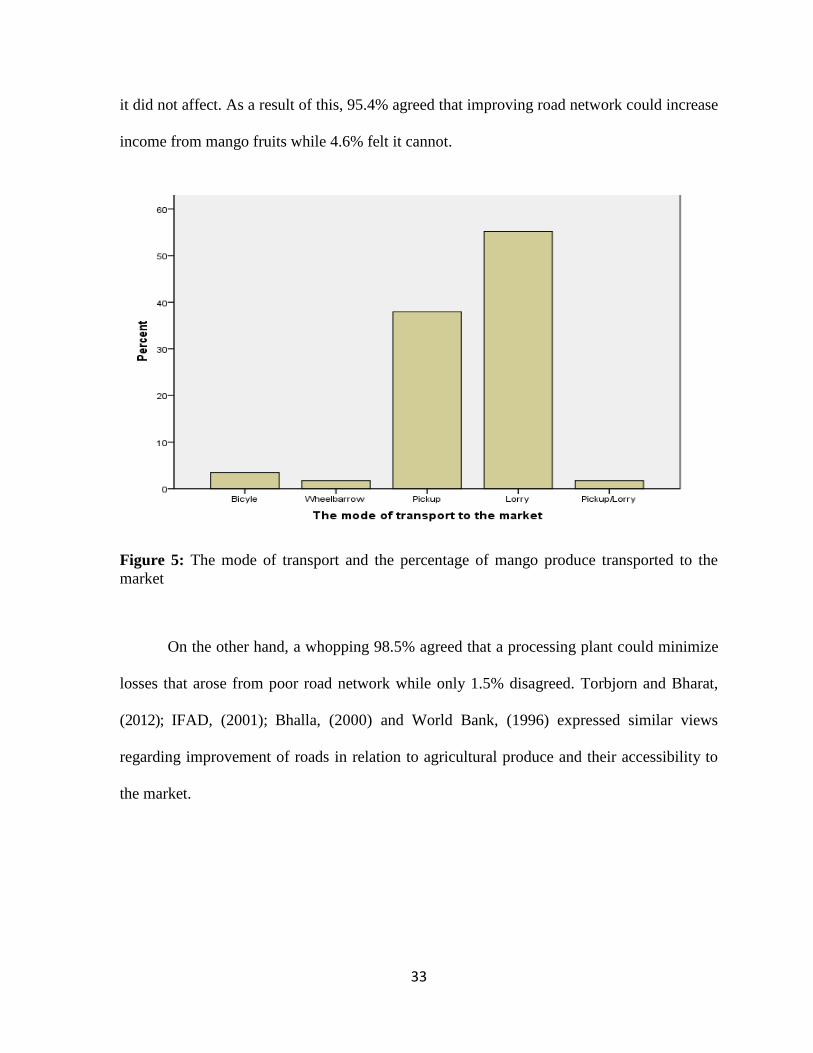
Figure 5 shows that most common mode of transport was lorries with 55.2%,
followed by pickups with 37.9% while others accounted for 6.8%. It was however, noted
that 82.8% of the respondents felt that the mode of transport for mango fruits is inappropriate
while 15.7% felt it was appropriate. This probably explains why 89.2% felt that poor road
network determined the buying prices of mango fruits from farmers while only 9.2% felt that
Supermarket
Exporter
Open marketProcessor
Onfarm buyers
Open marketExporter
0
10
20
30
40
50
60
70
80
90
100
% Middlemen
Farmers
33
it did not affect. As a result of this, 95.4% agreed that improving road network could increase
income from mango fruits while 4.6% felt it cannot.
Figure 5: The mode of transport and the percentage of mango produce transported to the
market
On the other hand, a whopping 98.5% agreed that a processing plant could minimize
losses that arose from poor road network while only 1.5% disagreed. Torbjorn and Bharat,
(2012); IFAD, (2001); Bhalla, (2000) and World Bank, (1996) expressed similar views
regarding improvement of roads in relation to agricultural produce and their accessibility to
the market.
.
34
CHAPTER FIVE
5.0 SUMMARY, CONCLUSIONS AND RECOMMENDATIONS
5.1 Introduction
This chapter contains the summary of the results, conclusion, recommendations and
available areas for further studies.
5.2 Summary
This study was conducted to investigate the challenges of marketing of mango fruits
in Masongaleni ward of Kibwezi Constituency and four specific objectives were studied to
achieve this purpose. These were; to determine the effects of middlemen; to investigate the
effects of education/training of mango farmers and middlemen; to examine the effects of
prices and to find out the effects of infrastructure in the marketing of mango fruits in
Masongaleni ward. A questionnaire was developed addressing all these objectives from
which sixty five copies were produced and administered to Masongaleni farmers and
middlemen.
Mango was found to be the most popular horticultural produce followed by tomatoes,
watermelon and capsicum in that order. The mango sector was found to be practiced by
people of all ages where majority were over fifty years. Majority of the farmers had twenty
years in the sector. The marketing phase for mangoes was found to be from September to
February while the other horticultural produce were produced all the year round. However,
mango was said to more resistant to drought than other horticultural produce which were said
35
to require more water. It was found out that middlemen affected the marketing of mango
fruits the most followed by the prices, infrastructure and education /training respectively.
Many farmers expressed their views that middlemen exploited them and got more
income from mango fruit sales than farmers. Majority of farmers sold their mango fruits at
farm gate to middlemen who in turn sold highest quantities to supermarkets, exporters, open
market and processors in that order. Education/training was not viewed to be a major factor
in price determination but many farmers felt that it could help improve their income from
mango fruits. It was interesting to find out that in the month of November when the mango
quantities were highest their prices were also at their highest. Prices were found to fluctuate
between ks.24.25 to ks.1 per piece for farmers and ks.45 to ks.3 for the middlemen. Only a
few farmers were selling directly to exporters while many others sold to middlemen at farm
gate. Those who sold directly to exporters made better income compared to those who sold
to middlemen.
Infrastructure, particularly road network was found to be inappropriate. All
respondents felt that the poor road network affected the buying prices for their fruits and as a
result they agreed that their income could be increased by improving road network.
5.3 Conclusion
The mango sector has bloomed over the past 20 years hence the reason for the
increased number of people in mango farming during this period. From the study, farmers
needed middlemen for marketing of their produce. Middlemen were more educated than
farmers hence had a better understanding of marketing of mango fruits and made more
income from mango fruits than farmers. The fact that 83.3% of the middlemen were happy
with the prevailing mango prices and 90% of the farmers are unhappy is a clear indication
36
that middlemen made more profit than farmers. Despite the majority of farmers having only
primary education they still disagreed with the assertion that education/training affected their
sales. Probably they did not wish to admit that their low education was a hindrance to the
extent of sales they were making.
5.4 Recommendations
It should be investigated why many farmers do not sell as a group yet 69.2% believe
group selling is more profitable than individual selling. There should be a structured and
agreed price formula beneficial to both middlemen and farmers. To realize better income
from mango fruits there is a need for training of all stake holders on marketing and post
harvesting techniques. Road network requires to be improved to be more accessible to
common modes of transport (lorries, pick-up and bicycles) in Masongaleni ward.
5.5 Suggestion for further studies
There should be further studies on viability of a mango fruits processing plant in
Masongaleni ward, to minimize losses due to poor roads and also cater for the fruits that are
left out while selling to on-farm buyers, supermarkets and exporters.
37
REFERENCES
ABD. (2011). The Mango Sub-Sector in Kenya. The Results of the Mango Tree Census and
Baseline Survey for Eastern Province. Final Report. Nairobi: IDMS.
Andrea, C. (2012). Understanding the marketing chain of mango and grapes in the Sao
Francisco valley. Sao Francisco: Universidade.
Bhalla., G. (2000). Evaluation of Infrastructural Interventions for Rural Poverty Alleviation.
Bangkok: UNESCAP.
Broadbent, L. (1985). Horticulturists Handbook. London: Duncan.
Carl, Linn Eric. (2010). General theory of marketing. Meta Management AB 1999 - 2010.
Stockholm.
European Union. (2000). White Paper on Food Safety of the European Union. COM (1999)
719 final. Brussels: Commission of the European Communities.
FAO. (1991). Horticultural marketing - a resource and training manual for extension officers.
Chapter 2 - Successful case studies in horticultural marketing. Rome: FAO.
FAO. (2004). Voluntary Standards and Certification for Environmentally and Socially
Responsible Agricultural Production and Trade. Rome: FAO.
Feder, G. L. (1987). Does agricultural extension pay? The training and visit system in
northwest India. American Journal of Agricultural Economics, 69(3), 677-686.
Gathee, J. (1991). Challenges Facing the Kenyan Horticultural Producer for Export. Acta
Hort (270), 271-278.
GoK. (2003). Economic Recovery Strategy for Wealth and Employment creation 2003-2007.
Nairobi: Government of Kenya.
Griesbach, J. (2003). Mango growing in Kenya. Nairobi: ICRAF.
HCDA. (2011). Horticultural crops development authority. Marketing News, 6.
HCDA. (2009). Strategic Plan 2009-2013. Nairobi: HCDA.
IFAD. (2001). Rural Poverty Report. Rome: International Fund for Agricultural
Development (IFAD).
Kameri, V. (2012). Factors that affect production and marketing of mangoes in Kenya: a case
of Maragua ridge location in district of central province. Nairobi: Kenyatta University.
Kehlenbeck et al, K. E. (2010). Mango Cultivar Diversity And Its Potential For Improving
Mango Productivity In Kenya. Nairobi: KARI.
38
Levy, P.S., Lemeshow, S. (1999). Sampling of populations: Methods and applications 3rd
edition. Wiley & Sons.
Lucas, K., V. Rutachokozibwa and E. Tagora. (1995). The Njombe-Mekete Road: An Impact
Assessment of an ATAP Funded Road Improvement Project. Mimeo.
Musinga M, Owuor A, Njuguna J, Gachanja G. (2012). The mango value chain in Kenya.
Nairobi.
Mututo, D. (2011, September Monday). Mango Farming Changing Livelihood of Farmers in
Makueni County. Department of Information and Public communications. Kenya.
Niyibigira, E.I., Lada, V.Y. and Abdullay, Z.S. (2003). Mango production and marketing in
Zanzibar: potential, issues and constraints. Acta Hort. (ISHS) , 621, 89-93.
Raisuddin A. and M. Hossain. (1990). Developmental Impact of Rural Infrastructure in
Bangladesh. Research Report. Bangladesh: International Food Policy Research Institute.
Rust, J., George, H. (2003). Middlemen versus Market Makers: A Theory of Competitive
Exchange. Political Economy, vol. 111, no. 2.
Sandika, A.L. (2011). Impact of Middlemen on Vegetable Marketing Channels In Sri Lanka.
Kamburupitiya: Sri Lanka Tropical Agricultural Research & Extension.
Sarada Gopalakrishnan. (2013). Marketing System of Mangoes in India. World Applied
Sciences Journal, 21 (7): 1000-1007.
Serem, A. (2010). Challenges in production and marketing of mangoes in Kenya. Nairobi:
HCDA.
Steve New. (2010). Market Opportunities for Mango Growers. Kenya Horticultural
Development Program 2004-2010. USAID-Kenya.
Torbjorn A., Bharat P. B. (2012). Contribution of Rural Roads to Access to- and
Participation in Markets: Theory and Results from Northern Ethiopia. Journal of
Transportation Technologies, 2, 165-174.
Umar Farook. (2011). Pricing product, internal and external factors affecting pricing
decision.
USAID. (2005). The Relationship of Third-party Certification (TPC) to Sanitary and
Phytosanitary (SPS) Measures and the International Agri-food. Final Report. Raise SPS
Global Analytical Report no. 9. USAID.
Varian, H. R. (1992). Microeconomic Theory. 3rd Edition. New York: W. W. Norton &
Company.
39
World Bank. (1996). Morocco-Socioeconomic Influence of Rural Roads: Fourth Highway
Project. Operations Evaluation Department: The World Bank.
World Bank. (1994). World Development Report: Infrastructure for Development. Oxford:
Oxford University Press.
Yin, Robert K. (2003). Case Study Research: Design and Theory. Applied Social Research
Methods Series, no. 5. 3rd ed. Thousand Oaks, CA: SAGE.
40
APPEDICES
Appendix 1: Research authority letter
41
Appendix 2: Location
Masongaleni location in relation to Kibwezi and Kenya.
Masongaleni ward
42
Appendix 3: Questionnaire
Section A - Personal identification information
This part contains questions about personal identification information. If there are more
options (answers) to one question, please mark the one that applies to you the most.
1. Age (Years)
2. Sex
3. What is your role in mango fruit marketing?
4. Level of education
5. How many years have you been a mango farmer
Primary school
Secondary school
College
University
Other (please specify):
Middleman
Farmer
Other (please specify):
0-20
21-30
31-40
41-50
Over 50
Male
Female
0-20
21-30
31-40
41-50
Over 50
43
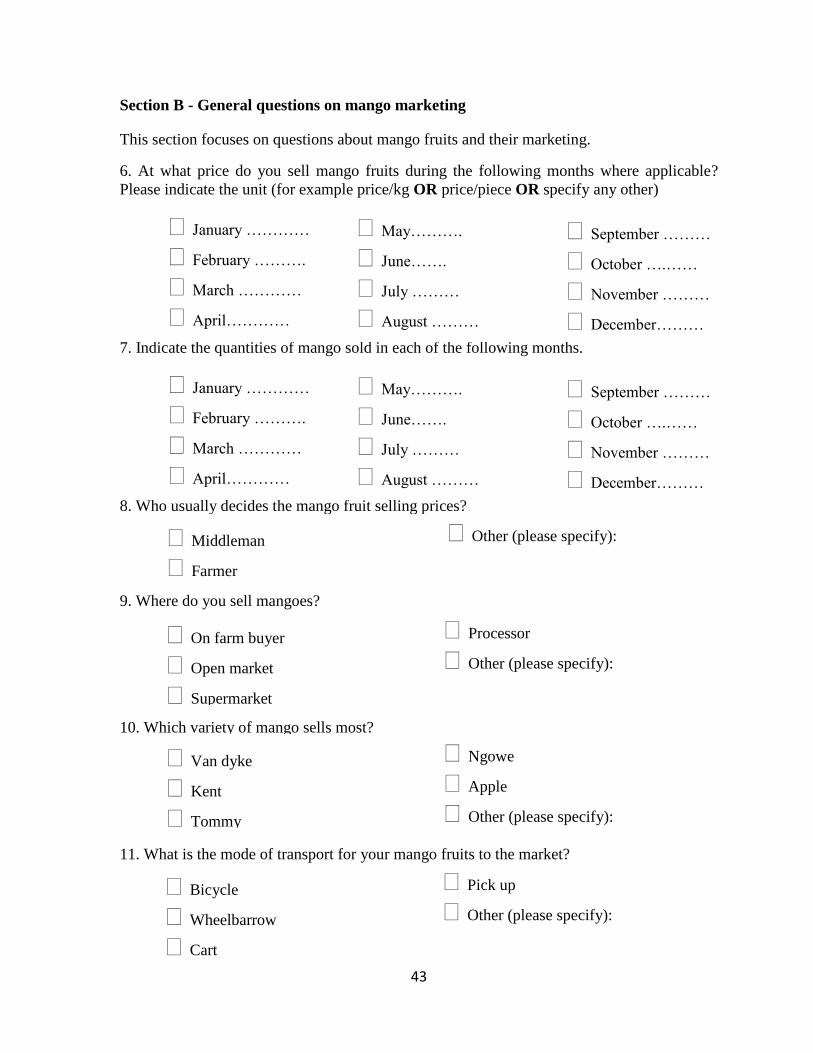
Section B - General questions on mango marketing
This section focuses on questions about mango fruits and their marketing.
6. At what price do you sell mango fruits during the following months where applicable?
Please indicate the unit (for example price/kg OR price/piece OR specify any other)
7. Indicate the quantities of mango sold in each of the following months.
8. Who usually decides the mango fruit selling prices?
9. Where do you sell mangoes?
10. Which variety of mango sells most?
11. What is the mode of transport for your mango fruits to the market?
On farm buyer
Open market
Supermarket
Processor
Other (please specify):
Van dyke
Kent
Tommy
Ngowe
Apple
Other (please specify):
Bicycle
Wheelbarrow
Cart
Pick up
Other (please specify):
Middleman
Farmer
Other (please specify):
January …………
February ……….
March …………
April…………
May……….
June…….
July ………
August ………
September ………
October ….……
November ………
December………
January …………
February ……….
March …………
April…………
May……….
June…….
July ………
August ………
September ………
October ….……
November ………
December………
44
12. Do you sell fruits individually or as a group?
Section C - Role of Middlemen
This part of the questionnaire deals the role of middlemen in marketing mango fruits. The
section deals with motives that might apply when you sell through middlemen.
13. Middlemen provide most convenience method of selling mango fruits.
Completely disagree Disagree Don’t know Agree Completely agree
14. Middlemen have better access to mango fruit market than farmers.
Completely disagree Disagree Don’t know Agree Completely agree
15. Middlemen are more knowledgeable on marketing than mango farmers.
Completely disagree Disagree Don’t know Agree Completely agree
16. D you think middlemen exploit mango farmers unfairly?
17. If yes, suggest what can be done to promote good relationship between the farmers and
the middlemen.
Section D - Education/training of mango farmers/middlemen
This part of the questionnaire deals with level of education of mango farmers and
middlemen. The level of education is important when it comes to decision making and ability
to manage the marketing process. This section deals with this aspect.
18. Calculating the cost of producing mangoes is difficult for me because of my education
level.
Completely disagree Disagree Don’t know Agree Completely agree
19. Mango fruits sales are not affected by the level of my education.
Completely disagree Disagree Don’t know Agree Completely agree
20. Education/training can increase the income from marketing of mango fruits.
Completely disagree Disagree Don’t know Agree Completely agree
21. Do think the level of education can improve mango post-harvest handling techniques?
sales?
Individually
Group
Yes
No
Yes
No
45
22. Suggest how the education level can be raised in Masongaleni ward.
Section E - Pricing
A mango price can be higher or low, but whether there is profit or not is what is most
important. The next propositions are about this experience.
23. I do not usually know my profit margin when selling my mango fruits.
Completely disagree Disagree Don’t know Agree Completely agree
24. My mango fruit sales differ with varieties.
Completely disagree Disagree Don’t know Agree Completely agree
25. Selling mango fruits individually is less profitable than selling when am in a group.
Completely disagree Disagree Don’t know Agree Completely agree
26. Are you happy with the current mango prices?
27. What is your recommendation on the pricing of mango fruits?
Section F – Infrastructure (Road network)
This section deals with road network that may directly affect mango fruits.
28. The mode of transport for mango fruits to the market is inappropriate.
Completely disagree Disagree Don’t know Agree Completely agree
29. Poor road network do not determine the buying prices of mango fruits from farmers.
Completely disagree Disagree Don’t know Agree Completely agree
30. Income from mango can be increased by improving the road network in Masongaleni.
Completely disagree Disagree Don’t know Agree Completely agree
31. Do you think mango processing plant in Masongaleni can minimize losses that may arise from
poor road network?
Section G - Rating of the variables affecting mango fruits marketing
Yes
No
Yes
No
46
Section G - Rating
This section deals with the rating of the effects of role of middlemen, education/training of
mango farmers/middlemen, pricing and road network on marketing of mango fruits in
Masongaleni ward. The section also seeks to find the most popular horticultural produce.
32. Using the scale below, rate how each of the following factors affects marketing of Mango fruits.
Low Moderate Very high
Middlemen ……………………..
Pricing ………………………
Education/training ………………………
Road network ………………………
33. Which horticultural produce is the most popular in Masongaleni ward?
34. Give reasons for your answer in 33 above.
47
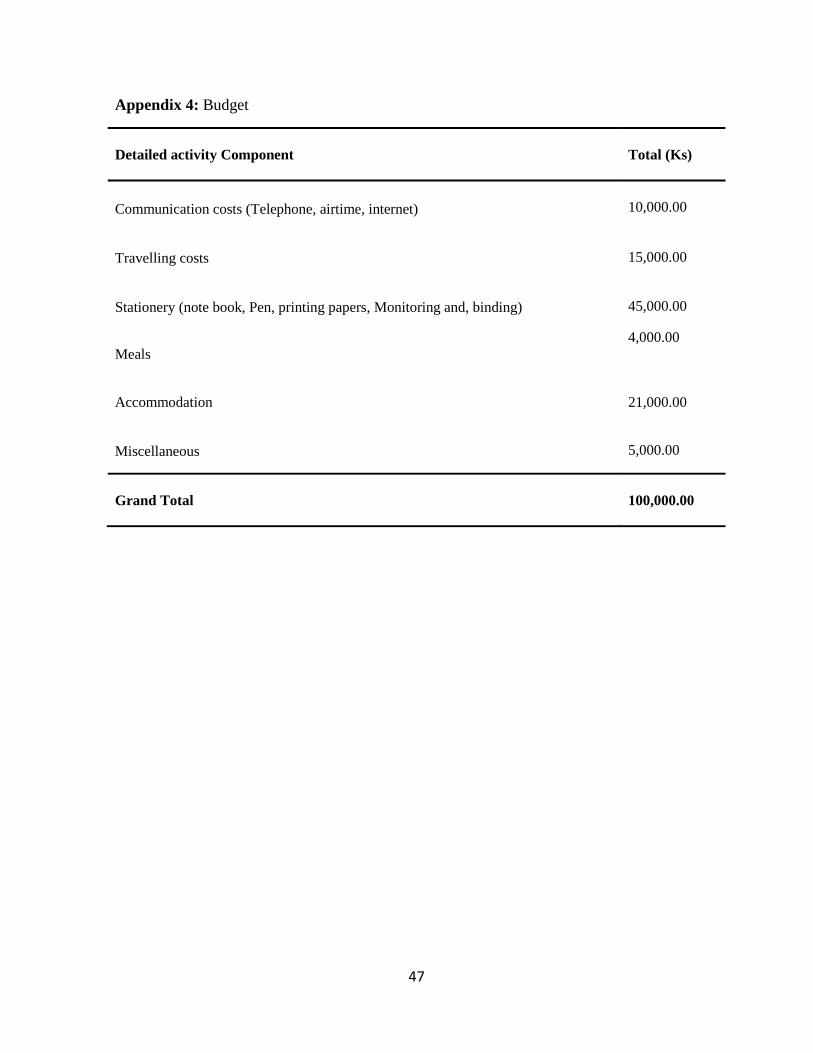
Appendix 4: Budget
Detailed activity Component
Total (Ks)
Communication costs (Telephone, airtime, internet)
10,000.00
Travelling costs
15,000.00
Stationery (note book, Pen, printing papers, Monitoring and, binding) 45,000.00
Meals
4,000.00
Accommodation
21,000.00
Miscellaneous 5,000.00
Grand Total
100,000.00