Embed Size (px)
Citation preview
Chad Wagner and David Mueller
Office of Surface Water
Summary of GPS Testing
(GGA and VTG)
Summary of GPS Testing
(GGA and VTG)

Overview
Background – why do we need GPS? Scope of GPS analysis Integration of GPS and ADCPs
GGA vs VTG Description of data Data analysis methods Results
Discharge comparisons Evaluation of differential correction sources
Summary

BackgroundADCP Measured Velocity
BackgroundADCP Measured Velocity
The faster the boat travels,the faster the velocity of the water relative to the ADCP.

Boat velocity or bottom-tracking measurements are similar to the water-velocity measurements
Bottom-tracking pulses are sent separate from the water measurement pulses
Bottom tracking also measures water depths for discharge computations
Background Bottom Tracking
Background Bottom Tracking

Background Example of a Moving Bed
Background Example of a Moving Bed

BackgroundCause of a Moving Bed
BackgroundCause of a Moving Bed
Transport of material (sediment or other organic material) along the streambed usually by rolling or saltation.

Background What Causes the Moving Bed
Bias
Background What Causes the Moving Bed
Bias
Environment Canada

BackgroundWhy do we need GPS?
BackgroundWhy do we need GPS?
Discharges measured using vessel-mounted ADCPs may be biased by bedload transport; this bias is referred to as a moving-bed error.
The moving bed bias introduces an apparent upstream boat velocity, which reduces the calculated downstream water velocity and the corresponding discharge will be biased low.
The integration of a GPS to measure the velocity of the ADCP has been shown to alleviate the systematic errors associated with a moving bed.

Overview Background – why do we need GPS? Scope of GPS analysis Integration of GPS and ADCPs
GGA vs VTG Description of data Data analysis methods Results
Discharge comparisons Evaluation of differential correction sources
Summary

Scope of AnalysisScope of Analysis The purpose of the analysis is to quantify the bias and random
noise associated with GPS-based ADCP discharge measurements relative to bottom-track based discharge measurements;
Sites that did not have a moving-bed condition at the time of measurement were used in the analysis.
The GPS equipment utilized in the analysis was limited to GPS receivers with the capability of providing sub-meter positional accuracy, and does not include Real-time Kinematic (RTK) GPS units.
The analysis is based on 63 bottom-track and GPS-referenced discharge measurements comprised of 579 individual discharge measurement transects collected at 42 different sites across the US, Canada and New Zealand between 2002 and 2007.

Overview
Background – why do we need GPS? Scope of GPS analysis Integration of GPS and ADCPs
GGA vs VTG Description of data Data analysis methods Results
Discharge comparisons Evaluation of differential correction sources
Summary
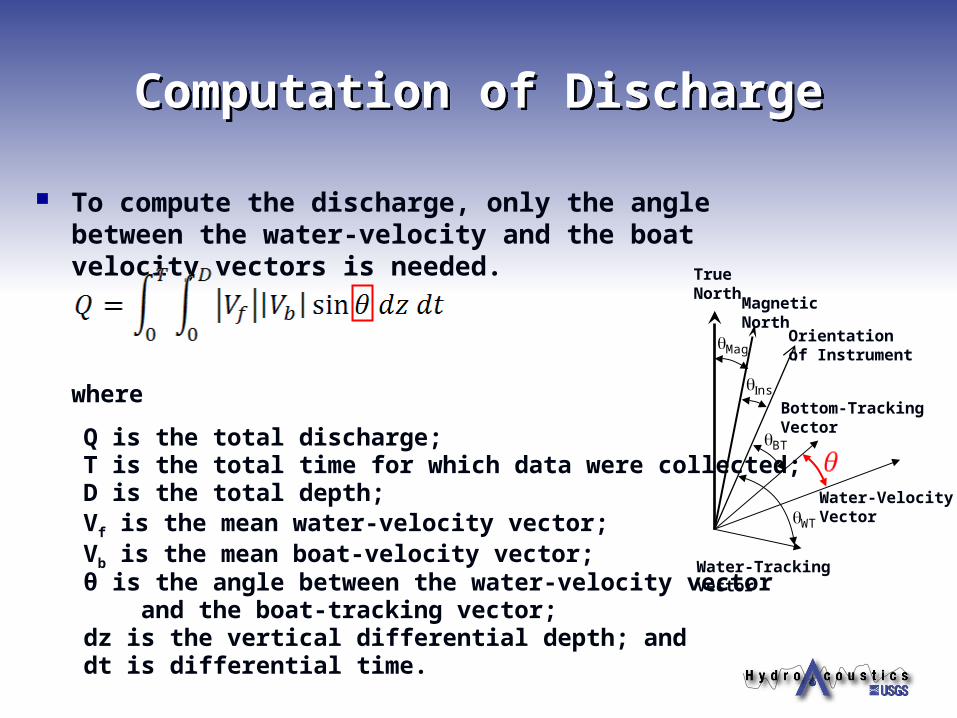
Computation of DischargeComputation of Discharge
To compute the discharge, only the angle between the water-velocity and the boat velocity vectors is needed.
where
Q is the total discharge;T is the total time for which data were collected;D is the total depth;Vf is the mean water-velocity vector;Vb is the mean boat-velocity vector;θ is the angle between the water-velocity vector and the boat-tracking vector;dz is the vertical differential depth; anddt is differential time.
TrueNorth
MagneticNorth
Orientationof Instrument
Water-TrackingVector
Bottom-TrackingVector
Water-VelocityVector
nst
WT
Mag
BT

TrueNorth
MagneticNorth
Orientationof Instrument
Boat Vectorfrom bottom track
ADCP Vector
nst
WT
Mag
BT
Bottom Tracking
Why is the compass important?Why is the compass important?
DGPS
TrueNorth
MagneticNorth
Orientationof Instrument
Boat Vector From DGPS
ADCP Vector
nstMag
BT
WT

Actual compass reading
Magnetic variation
Two Compass ConcernsTwo Compass Concerns
DGPS
TrueNorth
MagneticNorth
Orientationof Instrument
Boat Vector From DGPS
ADCP Vector
nst
Mag
BT
WT

Integration of GPS and ADCPIntegration of GPS and ADCP
Differences between bottom track and GPS referenced discharges can be attributed to either the quality of the GPS data or the accuracy of the ADCP heading measurement as referenced to true north (compass calibration and magnetic variation).
The impact of compass errors on the GPS accuracy was not specifically evaluated in this analysis.
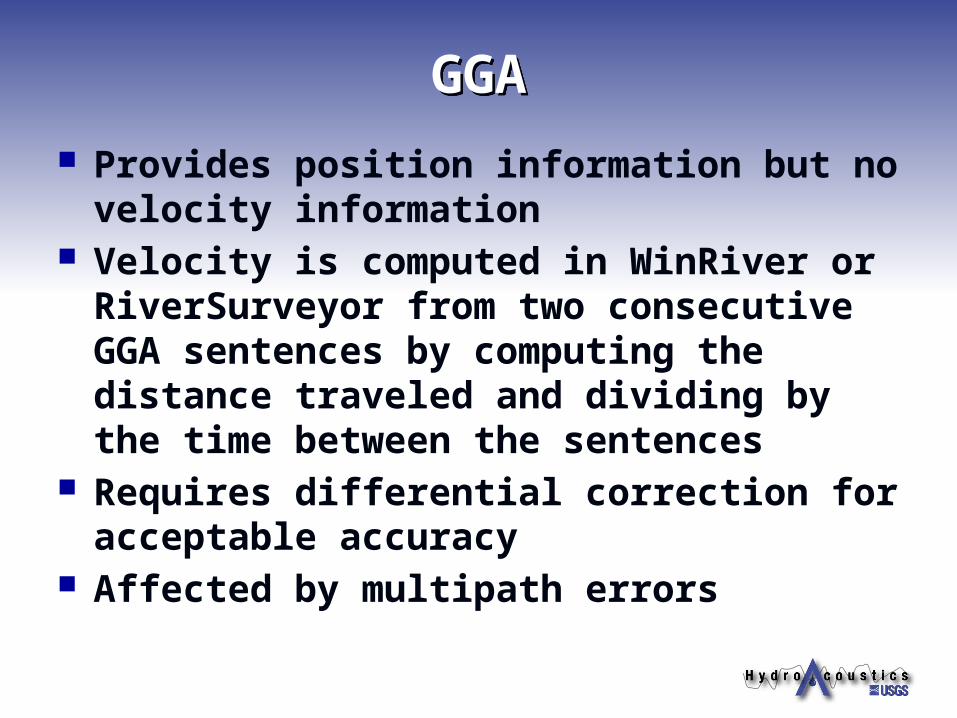
GGAGGA Provides position information but no velocity
information Velocity is computed in WinRiver or
RiverSurveyor from two consecutive GGA sentences by computing the distance traveled and dividing by the time between the sentences
Requires differential correction for acceptable accuracy
Affected by multipath errors

GGA SentenceGGA Sentence
Sentence ID
Latitude Direction
LatitudeDDMM.MMMMMM
LongitudeDDMM.MMMMMM
Longitude Direction
UTC TimeHHMMSS.SS
GPS Quality Indicator0 – invalid fix1 – nondifferential fix2 – differential fixSee receiver manual for other codes
Number of Satellites
HDOP
MSL Reference
Meters Meters
Geoidal Separation
Age of differential correction
Base Station ID
Check Sum
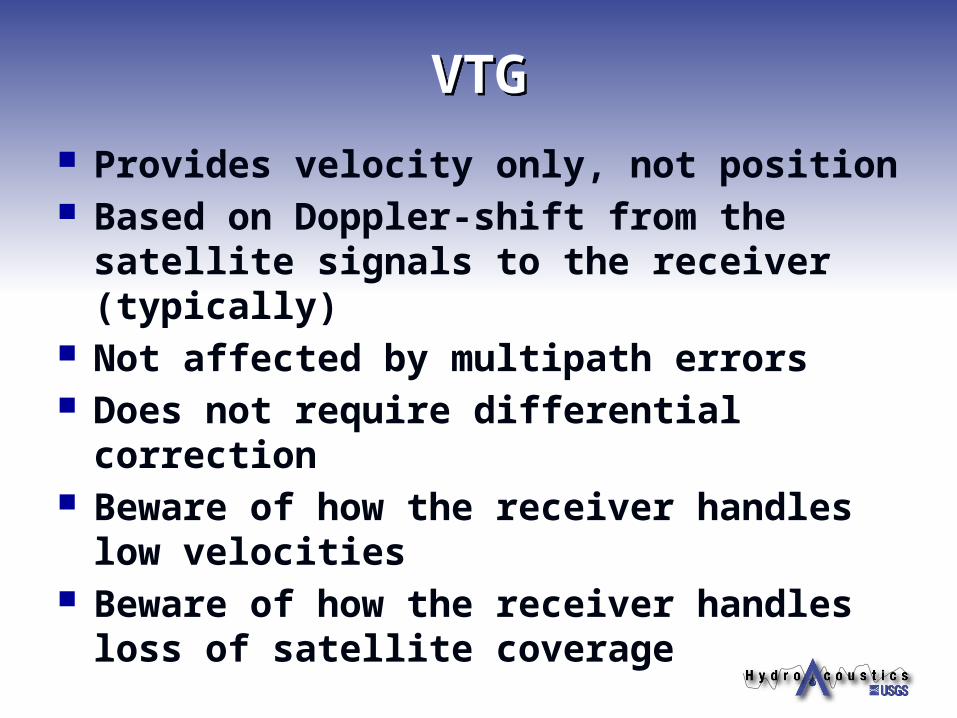
VTGVTG Provides velocity only, not position Based on Doppler-shift from the satellite
signals to the receiver (typically) Not affected by multipath errors Does not require differential correction Beware of how the receiver handles low
velocities Beware of how the receiver handles loss of
satellite coverage
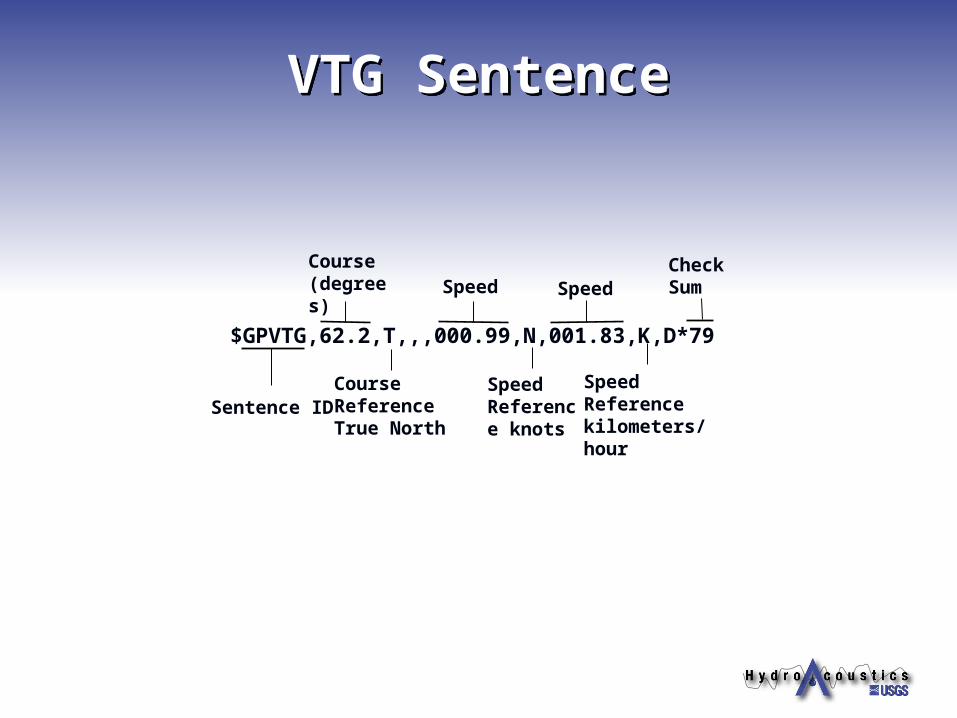
VTG SentenceVTG Sentence
$GPVTG,62.2,T,,,000.99,N,001.83,K,D*79
Sentence ID
Check SumSpeedSpeed
Course (degrees)
Speed Reference kilometers/hour
Speed Reference knots
Course Reference True North

Summary of VTG and GGA NMEA Sentences
Summary of VTG and GGA NMEA Sentences
GGA - Geographic position information determined by reference to the Global Positioning System. The position data includes the time, latitude, longitude, and information about the satellite constellation used to reach the position solution.
VTG - Velocity relative to the ground by measurement of the Doppler shift in the satellite carrier phase frequencies, which includes data on direction and speed.
Not all GPS receivers have the capability to provide the VTG string.
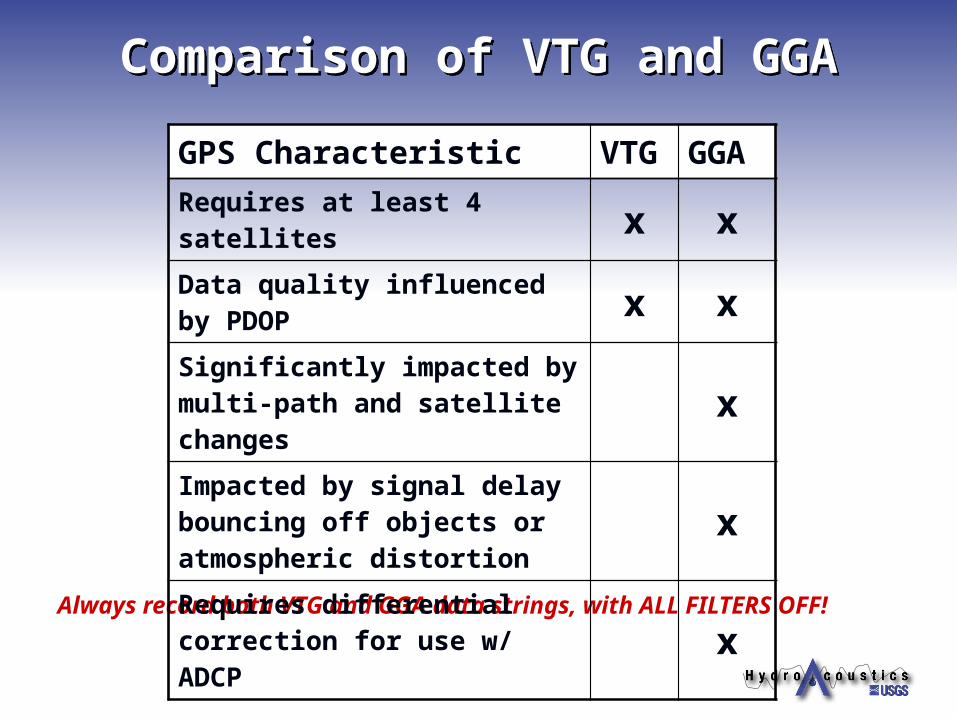
Comparison of VTG and GGAComparison of VTG and GGA
Always record both VTG and GGA data strings, with ALL FILTERS OFF!
GPS Characteristic VTG GGA
Requires at least 4 satellites x xData quality influenced by PDOP x x
Significantly impacted by multi-path and satellite changes xImpacted by signal delay bouncing off objects or atmospheric distortion
x
Requires differential correction for use w/ ADCP x

Overview
Background – why do we need GPS? Scope of GPS analysis Integration of GPS and ADCPs
GGA vs VTG Description of data Data analysis methods Results
Discharge comparisons Evaluation of differential correction sources
Summary
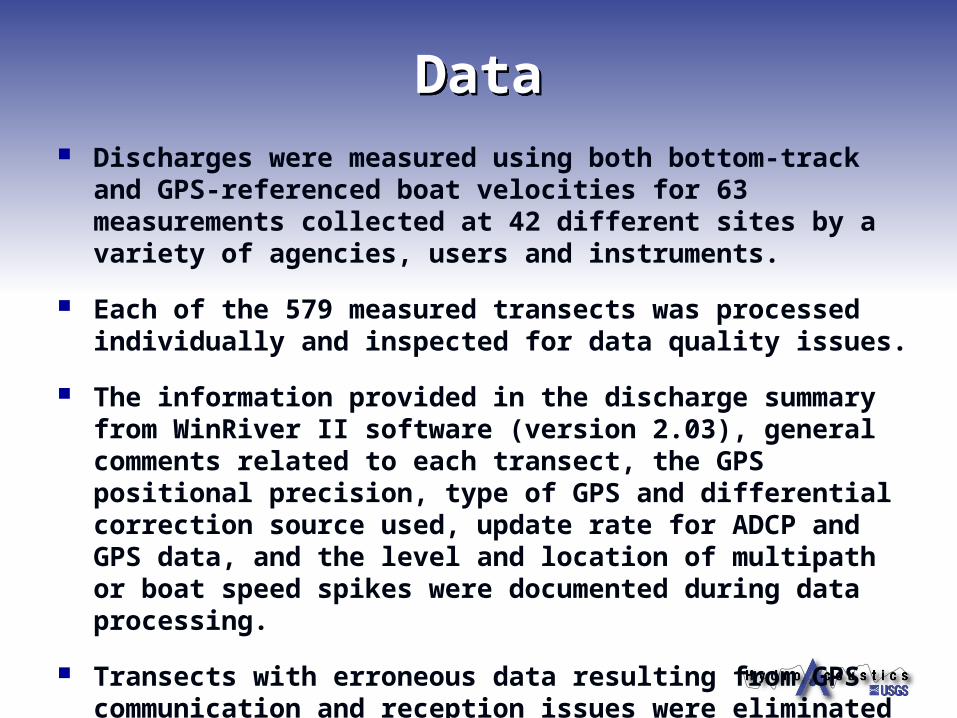
DataData Discharges were measured using both bottom-track and GPS-
referenced boat velocities for 63 measurements collected at 42 different sites by a variety of agencies, users and instruments.
Each of the 579 measured transects was processed individually and inspected for data quality issues.
The information provided in the discharge summary from WinRiver II software (version 2.03), general comments related to each transect, the GPS positional precision, type of GPS and differential correction source used, update rate for ADCP and GPS data, and the level and location of multipath or boat speed spikes were documented during data processing.
Transects with erroneous data resulting from GPS communication and reception issues were eliminated from the analysis.
DataData
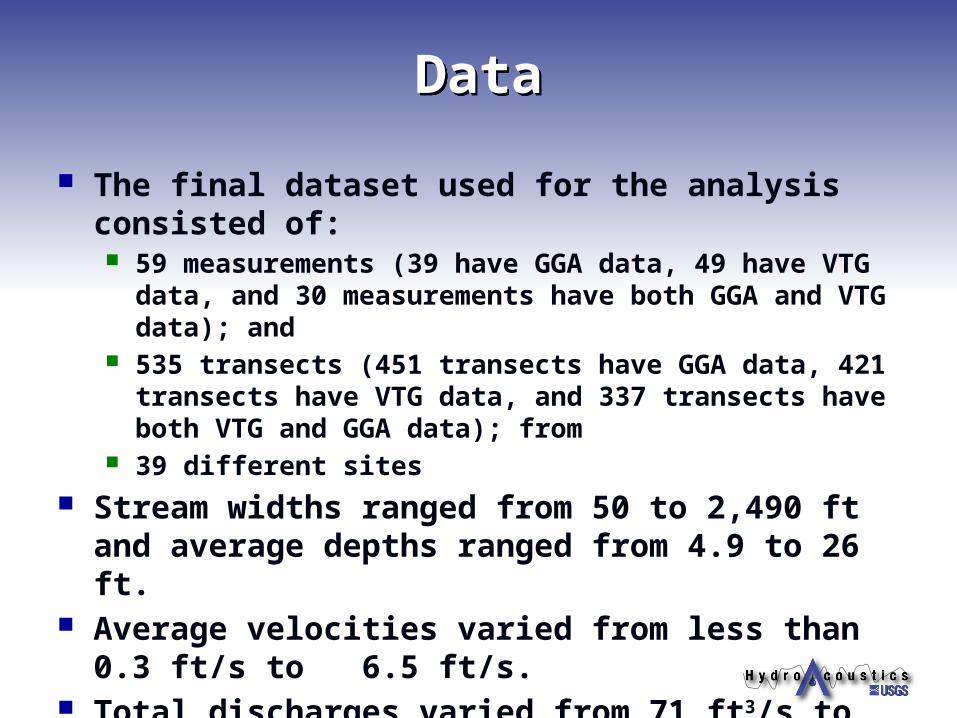
The final dataset used for the analysis consisted of: 59 measurements (39 have GGA data, 49 have VTG data, and
30 measurements have both GGA and VTG data); and 535 transects (451 transects have GGA data, 421 transects
have VTG data, and 337 transects have both VTG and GGA data); from
39 different sites
Stream widths ranged from 50 to 2,490 ft and average depths ranged from 4.9 to 26 ft.
Average velocities varied from less than 0.3 ft/s to 6.5 ft/s.
Total discharges varied from 71 ft3/s to 240,100 ft3/s.

Overview
Background – why do we need GPS? Scope of GPS analysis Integration of GPS and ADCPs
GGA vs VTG Description of data Data analysis methods Results
Discharge comparisons Evaluation of differential correction sources
Summary

Data Analysis MethodsData Analysis Methods
All data were compiled and inspected visually as well as statistically
Problems were easier to identify in GGA data because of the large spikes in boat velocity, but VTG errors were more subtle.
The percent differences (errors) between the GGA and bottom track (BT) referenced discharges, and the VTG and BT referenced discharges were calculated for each individual transect and the mean discharge of all transects at each of the measurement sites.

Data Analysis MethodsData Analysis Methods
A Wilcoxon Signed-Rank hypothesis test was used to determine if the mean percent differences (errors) between GGA and BT referenced discharges and VTG and BT referenced discharges are statistically different from zero (biased).

Overview
Background – why do we need GPS? Scope of GPS analysis Integration of GPS and ADCPs
GGA vs VTG Description of data Data analysis methods Results
Discharge comparisons Evaluation of differential correction sources
Summary

Results – Discharge Comparisons
Results – Discharge Comparisons
Data comparisons between GPS and Bottom track-based discharges were based only on the data where both GGA and VTG data were collected.
This approach eliminates any difference in site conditions that could affect the results of the analysis.
Discharges were compared using all individual transects and mean discharge at each measurement site.

Results – Discharge Comparisons Using Individual Transects
Results – Discharge Comparisons Using Individual Transects
Comparison of the discharges computed using bottom track and GGA as the boat velocity reference

Results – Discharge Comparisons Using Individual Transects
Results – Discharge Comparisons Using Individual Transects
Comparison of the discharges computed using bottom track and VTG as the boat velocity reference
Results – Discharge Comparisons Using Individual Transects
Results – Discharge Comparisons Using Individual Transects
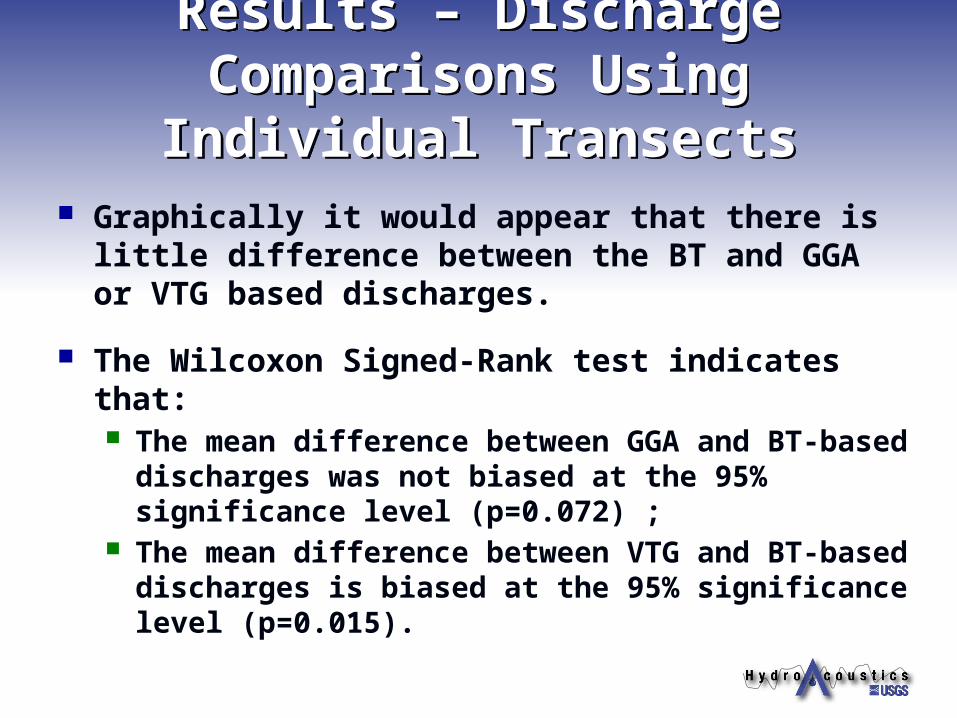
Graphically it would appear that there is little difference between the BT and GGA or VTG based discharges.
The Wilcoxon Signed-Rank test indicates that: The mean difference between GGA and BT-based
discharges was not biased at the 95% significance level (p=0.072) ;
The mean difference between VTG and BT-based discharges is biased at the 95% significance level (p=0.015).

Results – Discharge Comparisons Using Individual Transects
Results – Discharge Comparisons Using Individual Transects
Statistic
Percent Difference GGA-BT
Percent Difference VTG-BT
Mean -0.52% 0.39%Standard Deviation 3.71% 4.54%
Even though the Signed-Rank test indicates the VTG data is biased, the mean differences for both data sources are small (0.39% for VTG and -0.52% for GGA).

Results – Discharge Comparisons Using Individual Transects
Results – Discharge Comparisons Using Individual Transects
Variation in percent difference for transects based on mean water velocities and stream width

Results – Discharge Comparisons Using Individual Transects
Results – Discharge Comparisons Using Individual Transects
Filtering the data to evaluate only the data with velocities greater than 0.20 m/s(0.65 ft/s) results in a dataset with a minimum mean velocity of 1.1 ft/s and a minimum width of 48 ft.
For this condition, the hypothesis test again shows that the mean percent difference for the GGA data is not significantly different from zero (p=0.122) but the VTG data are biased (p=0.032) at the 95% significance level.
Results – Discharge Comparisons Using Individual Transects
Results – Discharge Comparisons Using Individual Transects
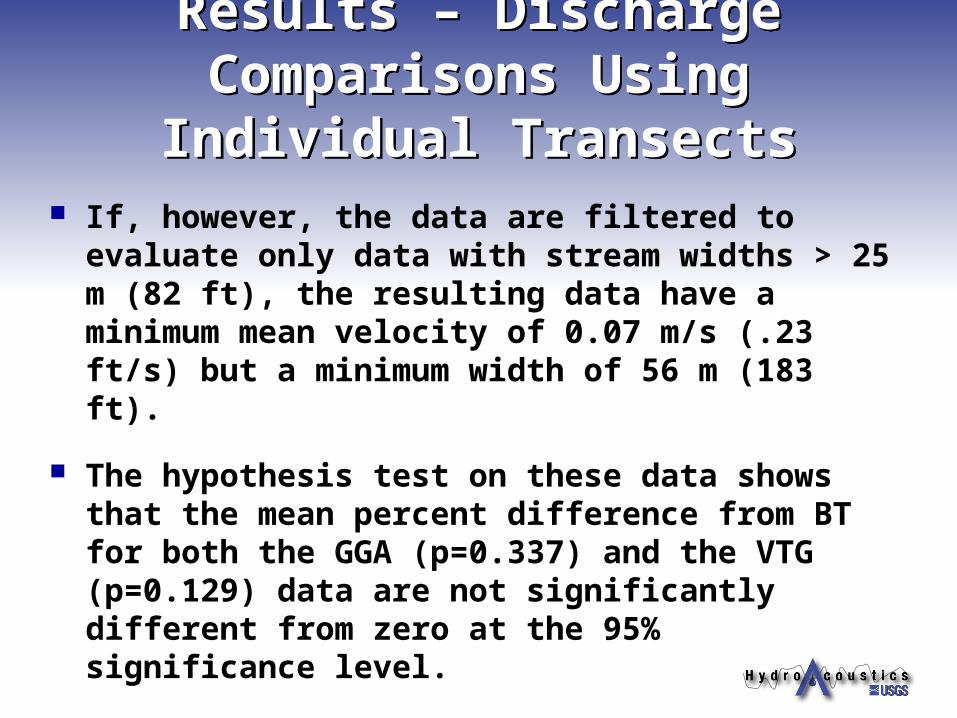
If, however, the data are filtered to evaluate only data with stream widths > 25 m (82 ft), the resulting data have a minimum mean velocity of 0.07 m/s (.23 ft/s) but a minimum width of 56 m (183 ft).
The hypothesis test on these data shows that the mean percent difference from BT for both the GGA (p=0.337) and the VTG (p=0.129) data are not significantly different from zero at the 95% significance level.

Results – Discharge Comparisons Using Individual Transects
Results – Discharge Comparisons Using Individual Transects
On the basis of these data and the hypothesis tests:
The discharges measured using GGA as the boat velocity reference can be considered to have no bias relative to discharges measured using bottom track as the boat velocity reference.
The hypothesis test on the VTG data indicate that there
is no bias in discharge for streams greater than 56 m (183 ft) wide, but a bias of 2.65% for streams with widths < 25 m (82 ft).

Results – Discharge Comparisons Using Mean Discharge Measurements
Results – Discharge Comparisons Using Mean Discharge Measurements
The discharge comparisons based on individual transects more heavily weights the effects of conditions at sites where a larger number of transects were collected.
To eliminate this potential problem the mean discharge at each measurement site was computed using each reference, which resulted in 30 measurements for each boat reference
Statistic
Percent Difference GGA-BT
Percent Difference VTG-BT
Mean -0.52% 0.41%

Results – Discharge Comparisons Using Mean Discharge Measurements
Results – Discharge Comparisons Using Mean Discharge Measurements
The hypothesis tests on mean discharge measurements indicate that the mean percent difference from bottom tracking for both the GGA (p=0.175) and the VTG (p=0.416) data are not significantly different from zero at the 95% significance level.

Results – Evaluation of Differential Correction
Sources
Results – Evaluation of Differential Correction
Sources Measured discharges were evaluated using differentially
corrected GGA as the navigation reference for three wide-area satellite-based differential correction sources commonly used in North America:
1. WAAS
2. OmniSTAR
3. CDGPS
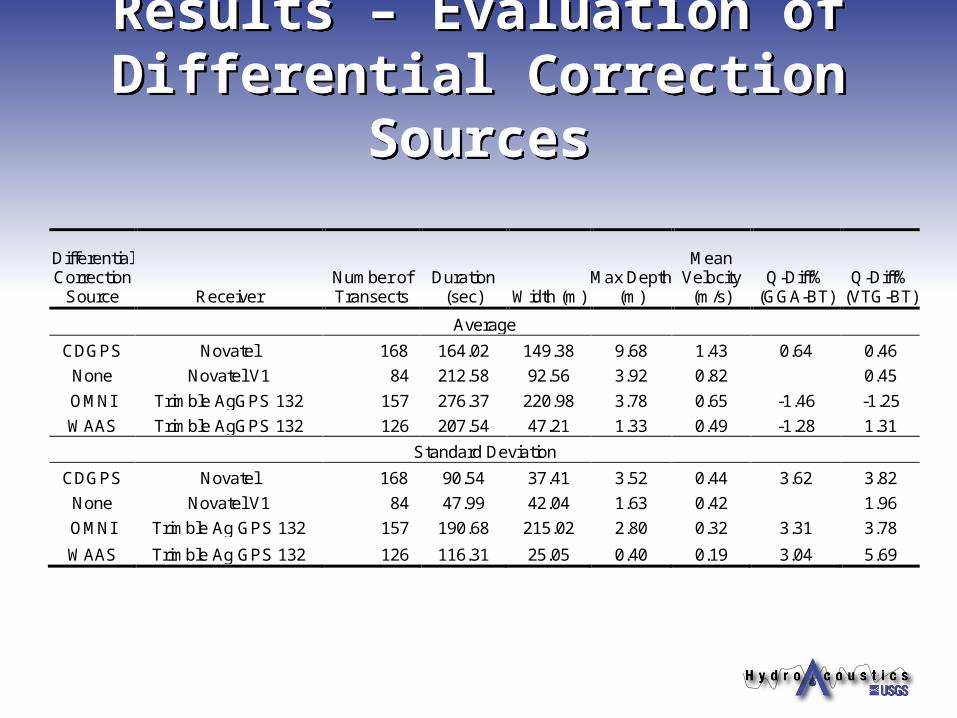
Results – Evaluation of Differential Correction
Sources
Results – Evaluation of Differential Correction
Sources
Differential Correction
Source Receiver Number of Transects
Duration (sec) Width (m)
Max Depth (m)
Mean Velocity
(m/s) Q-Diff%
(GGA-BT) Q-Diff%
(VTG-BT)
Average
CDGPS Novatel 168 164.02 149.38 9.68 1.43 0.64 0.46
None Novatel V1 84 212.58 92.56 3.92 0.82 0.45
OMNI Trimble AgGPS 132 157 276.37 220.98 3.78 0.65 -1.46 -1.25
WAAS Trimble AgGPS 132 126 207.54 47.21 1.33 0.49 -1.28 1.31
Standard Deviation
CDGPS Novatel 168 90.54 37.41 3.52 0.44 3.62 3.82
None Novatel V1 84 47.99 42.04 1.63 0.42 1.96
OMNI Trimble Ag GPS 132 157 190.68 215.02 2.80 0.32 3.31 3.78
WAAS Trimble Ag GPS 132 126 116.31 25.05 0.40 0.19 3.04 5.69

SummarySummary
The data and analysis indicate that discharge referenced to GGA or VTG data are, on average, within about +/- 0.5% of that measured using bottom tracking.
There were considerably more random errors and outliers in the percent differences between GPS and bottom track referenced discharges for sites with mean velocities less than 0.20 m/s (0.65 ft/s) and/or stream widths less than 25 m (82 ft).
SummarySummary
WAAS appears to be an adequate differential correction source for ADCP discharge measurements, if errors less than 2 % are acceptable.
The data also indicate that VTG provides similar discharges to those based on GGA data and could be a valuable alternative where differential corrections may be difficult or impossible to obtain.

Questions?Questions?


![Turbos de Geometría Variable (Vtg)[1][1]](https://img.pdfslide.us/doc/110x75/55cf8e9a550346703b93d857/turbos-de-geometria-variable-vtg11.jpg)