Embed Size (px)
Citation preview

o,*CH8?,.,, THE SOCIEN OF NAVAL ARCHITECTSAND MARINE ENGINEERS.$ One WorldTradeCenter,Suite1369,New York,N.Y.10048
>+’
cl)
+ Paper to be Presented at the Sh,p Ubretion Symposium.3 ;
: [email protected], Vs., October 1G17, 1978:40
●.
% ~,oJ*, .,.3.
Systematic Experiments to Determine the Influence ofSkew and Rake on Hull Vibratory Excitation Due toTransient CavitationJ. E. Kerwin, Associate Member, S. D. Lewis, Memberand S. Kobayashi, Visitor, Massachusetts Institute ofTechnology, Cambridge, Massachusetts
ABSTRACT
Results of a systematic Series ofexperiments showing the influence ofpropeller blade skew with and withoutrake,on hull vibratory excitation arepresented. These experiments werecarried out in a variable pressurewater tunnel using a screen generatedwake typical of a high-speed singlescrew cargo ship. These propellerswere operated at design advance co-efficient and at four cavitationnumbers ranging down to a typical valuefor full speed for this type of vessel.Measurements were made of the vibratoryforce on a large disc imbedded in aplate above the propeller. These forcemeasurements are intended to be repre-sentative, for comparative purposes, ofthe local propeller vibratory excitationon an actual ship hull . In addition,an extensive series of photographs wasobtained for each condition to illustratethe growth and collapse of wake -inducedpropeller blade cavities.
NOMENCLATURE
AD = disc area of propeller, ~.TTR2
c = section chord length
~ CTH= thrust loading coefficient,
CTH = T/+ P~VA2
D = propeller diameter
fM = maximum camber of propeller bladesection
KV = vertical force coefficient on disc,
Fv/pn2D4
.n = propeller revolutions per second
P = propeller section pitch
Pm = static pressure at depth ofpropel ler hub
1 Jointly sponsored by the society of
NaVal Architects and Marine Engineers,Panel H-FJ, under T&R P. O.#745, and by
the U.S. Department of commerce, Mari-time Administration Contract #6-38D68.
P“ = vapor pressure of water
r= radial distance from propeller axis
R = propeller radius
t = maximum thickness of propellersection
VA = speed Of advance of propeller inopen water
VS = ship speed
VX = ~a;~l axial flow velocity in ship Ts
1
Cartesian coordinates
)
hydrodynamic pitch angle
angle measured clockwise from zaxis when looking upstream(0=0° for vertical downward)
local projected skew angle or warpangle at radius r/R, relative toa radial reference line
mass density of water
P--P”-—
‘n -0.5pn2D2
Pm-.P”o“=—
0.5PVA2
1. INTRODUCTION
As a result of recent researchcarried out by a number of organiza-tions throughout the world, it is nowwell established that transient propel-ler cavitation can be a major source ofvibratory excitation of a hull (1).Much effort is now being expended todevelop analytical methods of predicting .the time history of blade cavitationboth with regard to extend and volume,and to determine the exciting forcesdeveloped on the hull by this cavitation.Both model and full-scale experimentshave been, or are being made to measurethese same quantities (1,2,3) .
One of these experimental studies _
Q -1
has been completed at MIT under thesponsorship of SNAME and under thetechnical administration of Panel H-8,(4). A relatively simple arrangf.mentwas devised for the measurement of thepropeller. induced vibratory force cm acircular disc flush mounted in a flatsurface located above the propeller.The measurements showed conclusivelythat in the extreme wake field used inthese tests the cavitation was of prin-cipal importance in determining thelevel of vibratory excitation on theplate. Howe”er, this study was limitedto one rather extreme wake field, sothat the results are not necessarilyvalid for all ship types.
what is needed, therefore ismore extensive data which the designermay use to decide whether or notcavitation- induced “ihration is likelyto be a major problem. If it is deter-mined that a potential problem exists,the designer is then advised to makeuse of appropriate experimental and/oranalytical techniques for more quanti-tative information.
A further refinement of theexperimental technique developed in(4) was used to generate systematicdata on vibratory excitation as afunction of cavitation for .3series offive 5–hladed propellers operating ina realistic ship wake. These propellers“aried systematically from an undis-torted uarent uroDeller to similarpropel l~rs with 3~0 and 720 skewrespectively and 360 and 72° warprespectively. 1 Cavitation numbers were~r~ej from 6.3 (almost no cavitation)
., the latter being typical offull speed for the merchant ship. Foreach propeller, measurements of thefirst three harmonics of vertical bladefrequency vibratory force acting on adisc abo”e the propeller were made.
Since the force measuring discdoes not represent an actual.hullsurface, the test results must be usedin a comparative way. In particular,the amount by which the force isaltered due to cavitation can serve asa means of correcting vibratory forceestimates determined by current non-cavitating methods. The effect ofchanges in propeller parameters suchas skew and warp can he again comparedwith the corresponding non-cavitatingresults.
The longitudinal screen generatedwake field was measured in the propel-ler rotational plane, with the propel-ler removed, using a recently acquiredlaser-doppler velocimeter. Manymeasurements were taken in a Y-Z grid,from which tbe radial distributions ofwake harmonics were computed.
four cavi.taticm numbers, a sequence ofstill pictures was taken at uniforminternals through one blade passage(720). These photographs show theextent of cavitation at each position,and allow comparison of the effects ofcavitation numbers and propeller dis-tortion. These photographic records oftransient blade cavitation, togetherwith the corresponding relative vibra-tory force le”els can be used by design-ers as a means of correlation withspecific ship designs and forcorrelation with theoretical methods.
2. PROCEDURE
2.1 wake Sur”ey
A longitudinal wake field wasgenerated by a wire screen extendingacross the test section at a point 53cm (20.9 in) upstream of the propeller.The wake field generated can be con-sidered typical of a fine-formed single-screw merchant ship with a low averagewake fraction and a sharp wake peak.
The measurement of the wakedistribution was accomplished using thelaboratory’s rece~tly acquired La.=, er-
Doppler velOcimeter. While the laser
system was acquired principally For themeasurement of unsteady velocity fieldsin the neighborhood of an operatingpropeller, it is well suited for steadyvelocity measurements.
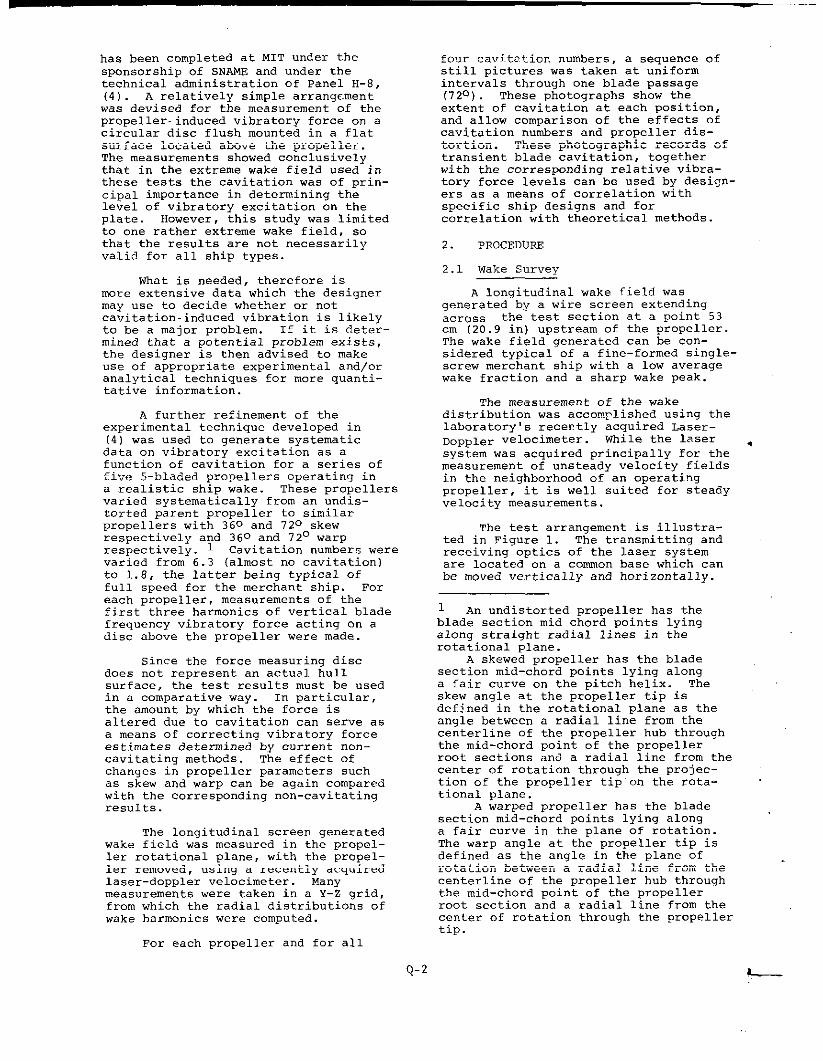
The test arrangement is illustra-ted in Figure 1. The transmitting andreceiving optics of the laser systemare located on a common base which canbe moved vertically and horizontally.
1 An undistorted propeller has theblade section mid chord points lyingalong straight radial lines in therotational plane.
A skewed propeller has the bladesection mid-chord points lying alonga fair curve on the pitch helix. Theskew angle at the propeller tip isdefined in the rotational plane as theangle between a radial line from thecenterline of the propeller hub throughthe mid-chord point of the propellerroot sections and a radial line from thecenter of rotation through the projec-tion of the propeller tip on the rota-tional plane.
A warped propeller has the bladesection mid-chord points lying alonga fair curve in the plane of rotation.The warp angle at the propeller tip isdefined as the angle in the plane ofrotation between a radial line from thecenterline of the propeller hub throughthe mid-chord point of the propellerroot section and a radial line from thecenter of rotation through tne propellertip.
For each propeller and for all
Q-2 -
-—..———
The wake field can therefore be mea–scred most conveniently in a Cartesiangrid in the plane of the propeller. Afiner grid spacing was used in the highwake region when higher resolution wasrequired. The output of the signalprocessor is a voltage, directly pro-portional to velocity, which can beaveraged electronically to provideaccurate measurements at each gridpoint.
A disadvantage of the Cartesiangrid is that measurements must beconverted to cylindrical coordinatesto enable the usual harmonic analysisof the wake field to be performed. Wehad considered moving the laser base inconstant increments of radius androtation angle, but had concluded thatthere would be less chance of error ifonly one degree of freedom of motionwas required. Obviously a fully auto-mated positioning system for the laserbase would be ideal for this purpose.
sIGNALP.OCESSM
Fig. 1 Experimental Setup for WakeSurvey
2.2 Force Measurements
2.2.1 Hull Simulation and Force Mea–urement r)lsc. The test arrangement islllt,strated ir,Figure 2. An extremelyrigid simulated hull is constructed ofsolid aluminum, and is attached to theupper window of the test section. Thedepth of the hull is designed to pro-“ide a tip clearance of 20% of the304.8 nun (12 in) propeller diameter.The bottom of the hull is flat exceptat the leading and trailing edges wherestreamlining was provided.
An exploded view of the force
measuring device is shown in Figure 3a,and a sectional view of the device isshown in Figure 3b. The force measure-ment disc is an aluminum plate 180 nun(7 in) in diameter with a thickness of13 mm (0.5 in) , mounted flush with thehull surface. Water is excluded fromthe cavity above the disc by an “O”ring seal. The disc is connected to a136 Kg (300 lb) strain-gage load cellwhich, in turn, is connected to an
extremely heavy al.minum dOme.
TOSIGNALPROCESSC6
I ~ALU.,NUMmm
‘-3==WME SCREEN d
1-
rj.q. 2 Test Section Arrangement
/
DOMEFORHOLDINGTHEDISC
4-...u&__.__...-F0RCEPICKUPDISC
ImonmDIA.[7”10-RING\ 13mmTH1cK(.5”)
.
Fig. 3a. Force Measuring Device -Exploded View
The air space inside the cavity issealed from the atmosphere as well asfrom the tunnel, and its pressure may bealtered by means of the tunnel’s vacuumsystem. This was found to be necessaryfor two practical reasons. At lowcavitation numbers, the differentialpressure on the disc would overload thestrain-gage load cell unless the cavitypressure was correspondingly reduced.On the other hand, a small positivedifferential between the cavity pressureand test section static pressure wasessential to pre”ent water from leaking
Q-3
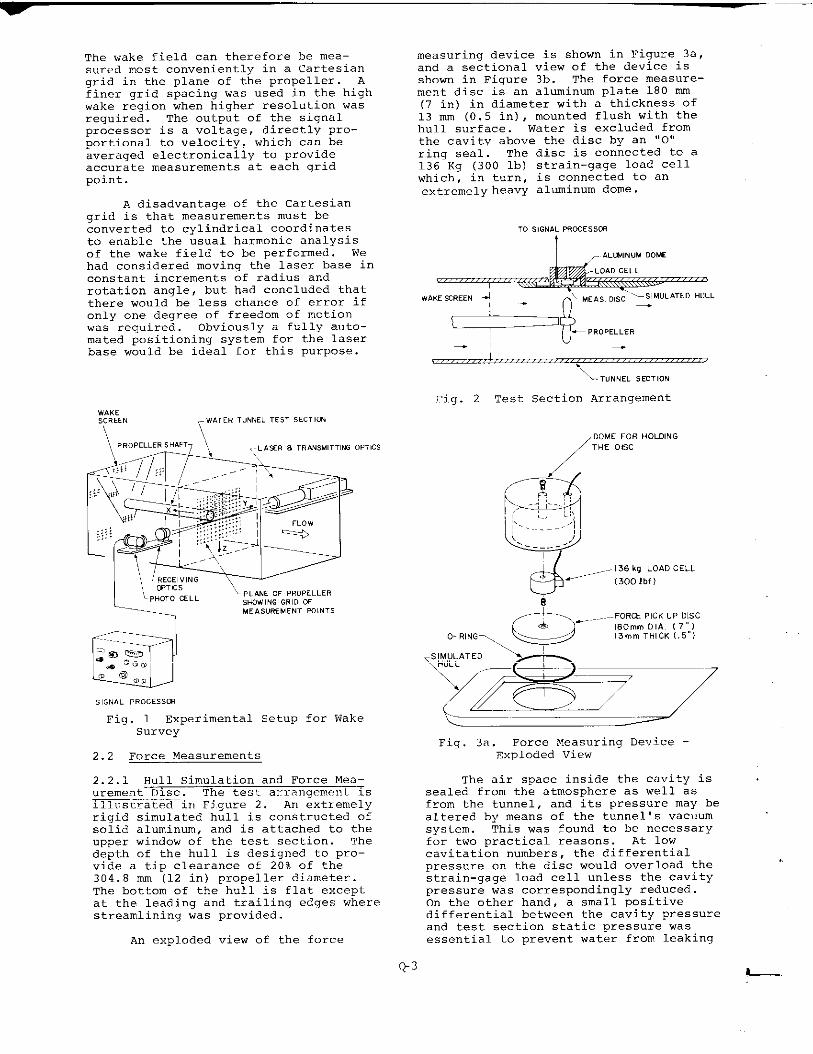
into the cavity and damaging the loadcell. This arranger.ent proved to bevery reliable and simple to use.
I 1 “,,,,.TUNE.PRss,m
,,M”L,,,,“ULLJ’‘L,.,,.,‘.,..,,PICK “, .,,.
Fig. 3b Force Measuring Device -Sectional View
While tbe position of the disc isfixed, the propeller drive can be movedlongitudinally. During the force tests,measurements were made with the propel-ler tips directly below the upstreamedge, center, and downstream edge ofthe disc as shown in Figure 4. Thiscorresponds to a longitudinal travelof +9% of the propeller radius.
TuNNELWINCOW
uPSTREAMFOSITlON
FLOW
Fig. 4 Force Test PropellerLocations
2.2.2 Measurement System and Calibra–tion. A block diaqram of the measure-ment system is shown in Fiqure 5. Theload cell is connected to ~ carriertYPe Strain-9a9e amplifier which pro–vldes a direct readout of the steadyload, and pro”ides an amplified, demod-ulated unsteady force output. Tbesteady readout is used botb for staticcalibration and for monitoring of thepressure differential between thetunne1 and the dome.
The amplifier Output is processedby a waveform eductor which is triggeredat blade frequency by a magnetic pick-up on the propeller shaft. The eductoraverages repeated “al”es of the signal
following any specified number of bladefrequency trigger pulses. The averagedsignal retains all harmonics of bladefrequency while greatly attenuatingperiodic components not related to bladefrequency and random components due toturbulence, cavity bubble dynamics andextraneous noise. While some of thelatter may actually be present in thefull-scale flow, previous experimentalrecords processed by a spectrum ana-lyser indicated that the discrete peaksat multiples of blade frequency stoodwell above the bread band component ofthe spectrum. This is no doubt fortu-nate since the proper interpretation ofthe latter with regard to scaling wouldbe most difficult.
~ —u- “u, ,., ,,,,,
?,,[, ,!,,,,,, 4
Fig. 5 Block Diagram of MeasurementSystem
The final averaged signal may beviewed on an oscilloscope or plottedon an x-y pen recorder. At the time ofthe present experiments there was nodirect means of transmitting the aver-aged signal to a digital computer forthe final step of scaling and harmonicanalysis. As an interim measure, thisstep was accomplished by taking thegraphs to a mini-computer equipped witha digitizer, and tracing the records byhand.
The capacity of the load cell wasselected on the basis of the usualcompromise between sensitivity andnatural frequency. It was determinedthat the processing system signal tonoise ratio would be adequate if theaverage force amplitude was as low asfive percent of the nominal capacity ofthe load cell. This would then resultin a natural frequency in the neighbor-hood of 5 times blade frequency, thuspermitting accurate estimate of forcecomponents up to three times bladefrequency. A higher capacity load cellwould result in a higher natural fre-auencv but would reduce the siunalievel; to a point where the si~nal/noiseratio would be too low.
A static calibration of the systemwas readily done with known weights andthe output of the strain-gage amplifier.Dynamic calibration was achieved by
Q-4 L-_
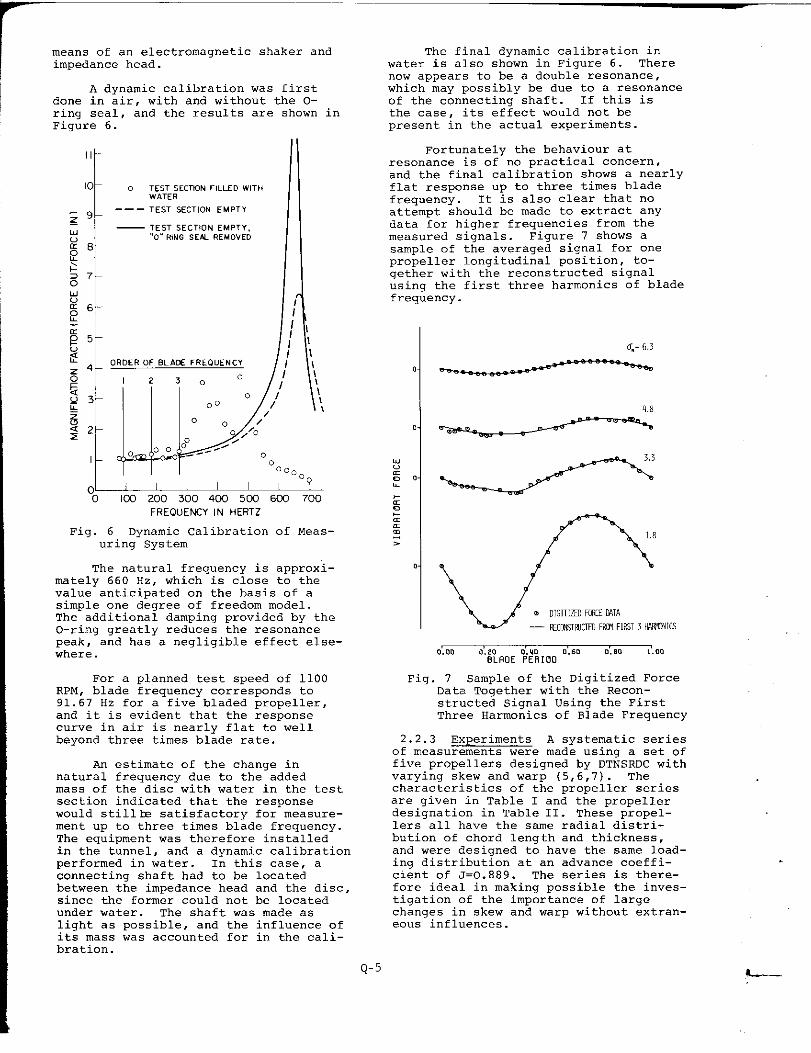
means of an electromagnetic shaker andimpedance head.
A dynamic calibration was firstdone in air, with and without the O-rinq seal, and the results are shown inFig~re 6.
o TESTSECT!3NFILLEDWITHwATER
-—— TESTSECTIONEMPTY
— TESTSECTIONEMPTY,,<0’<RINGSEbLREMOVED
ORDEROFBLAE FREOUENCY
123.0 i
UP
o.0 /1
O./’
0 /’0.0 OO”O<.
c-c -“” oc’OO.”
The final dynamic calibration inwater is also shown in Figure 6. There
now appears to be a double resonance,which may possibly be due to a resonanceof the connecting shaft. If this isthe case, its effect would not bepresent in the actual experiments.
Fortunately the behaviour atresonance is of no practical concern,and tbe final calibration shows a nearlyflat response up to three times bladefrequency. It is also clear that noattempt should be made to extract anydata for higher frequencies from themeasured signals. Figure 7 shows a
sample of the averaged signal for onepropeller longitudinal position, to-gether with the reconstructed signalusing the first three harmonics of bladefrequency.
I\\\
\,
\!
I I I.“
of jo Kx3 200 300 4C0 5C0 6CC 700
FREQuENCY IN HERTZ
Fig. 6 Oynamic Calibration of Meas-uring System
The natural frequency is approxi-mately 660 Hz, which is close to thevalue anticipated on the basis of asimple one degree of freedom model.Tbe additional damping provided by theO-ri!lg greatly reduces the resonancepeak, and has a negligible effect else-where.
For a planned test speed of 1100RPM, blade frequency corresponds to91.67 Hz for a fine bladed propeller,and it is evident that the resoonsecurve in air is nearlv flat to” well
beyond three times bl;de rate.
.lnestimate of the change innatural frequency due to the addedmass of the disc with water in the testsection indicated that the responsewould still h satisfactory for measure-ment up to three times blade frequency.The equipment was therefore installedin the tunnel, and a dynamic calibrationperformed in water. In this case, aconnecting shaft had to be locatedbetween the impedance head and the disc,since the former could not be locatedunder water. The shaft was made aslight as possible, and the influence ofits mass was .acco”nted for in the cali-bration.
6.=6,3
0,8
n 18I P \
Fig. 7 Sample of the Digitized ForceData Together with the Recon-structed Signal Using the FirstThree Harmonics of Blade Frequency
2.2.3 Experiments A systematic seriesof measurements were made using a set offive propellers designed by DTNSROC withvarying skew and warp (5,6,7). Thecharacteristics of the propeller seriesare given in Table 1 and the propellerdesignation in Table 11. These propel-lers all have the same radial distri-bution of chord lenqth and thickness,and were designed to have the same load-ing distribution at an advance coeffi-cient of J=o.889. The series is there-fore ideal in making possible the inves-tigation of the importance of lar~ech~nges in skew an~ warp without ~xtran-eo”s influences.
Q-5!---
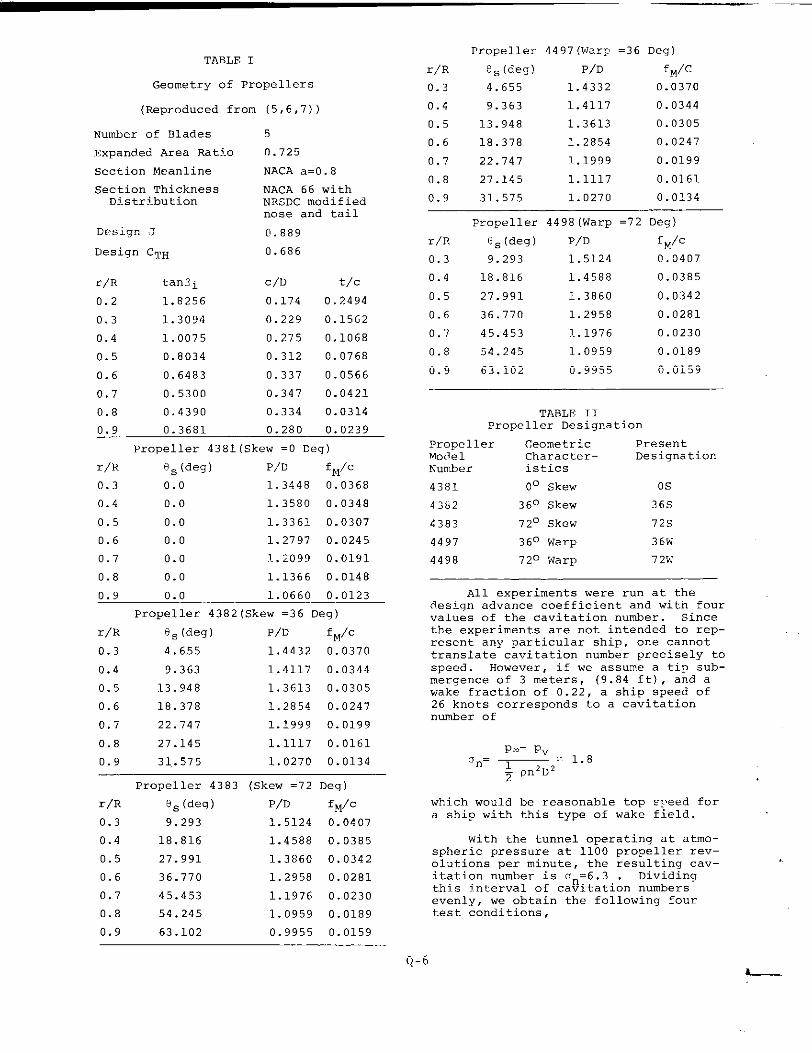
TABLE 1
Geometry of Propellers
(Reproduced from (5, 6,7 ) )
Number of Blades 5
Expanded Area Rat!.o 0.725
Section Neanline NACA a=O .8
Section Thickness NACA 66 withDistrj.bution NRSDC modified
nose and tail
Design J 0.889
Desiqn CTH 0.686
r/R tanf, i c/D t/c
0.2 1.8256 0.174 0.2494
0.3 1.3094 0.229 0.1562
0.4 1.0075 0.275 0.1068
0.5 0.8034 0.312 0.0768
0.6 0.6483 0.337 0.0566
0.7 0.5300 0.347 0.0421
0.8 0.4390 0.334 0.0314
0.9 0.3681 0.280 0.0239
Propeller 4381 (Skew =0 Deg)
r/R ~S (deg) P/D f ~,/c
0.3 0.0 1.3448 0.0368
0.4 0.0 1.3580 0.0348
0.5 0.0 1.3361 0.0307
0.6 0.0 1.2797 0.0245
0.7 0.0 1.. >099 0.0191
0.8 0.0 1.1366 0.0148
0.9 0.0 1.0660 0.0123
Propeller 4382 (Skew =36 Deg)
I/R 6S (deq) P/D fM/c
0.3 4.655 1.4432 0.0370
0.4 9.363 1.4117 0.0344
0.5 13.948 1.3613 0.0305
0.6 18.378 1.2854 0.0247
0.7 22.747 1.1999 0.0199
0.8 27.145 1.1117 0.0161
0.9 31..575 1.0270 0.0134
Propeller
r/R II. (deg)
0.3 4.655
0.4 9.363
0.5 13.948
0.6 18.378
0.7 22.747
0.8 27.145
0.9 31.575
4497 (warp
P/D
1.4332
1.4117
1.3613
1.2854
1..1999
1.1117
1.0270
=36 Deg)
fN/c
0.0370
0.0344
0.0305
0.0247
0.0199
0.0161
0.0134
Propeller 4383 (Skew =72 rleg)
r/R 8S (deg) P/D fM/c
0.3 9.293 1.5124 0.0407
0.4 18.816 1.4588 0.0385
0.5 27.991 1.3860 0.0342
0.6 36.770 1.2958 0.0281
0.7 45.453 1.1976 0.0230
0.8 54.245 1.0959 0.0189
0.9 63.102 0.9955 0.0159
0-6
Propeller 4498 (Warp =72 Deg)
r/R GS(deg) P/D fM/c
0.3 9.293 1.5124 0.0407
0.4 18.816 1.4588 0.0385
0.5 27.991 1.3860 0.0342
0.6 36.770 1.2958 0.0281
0.7 45.453 1..1976 0.0230
0.8 54.245 1.0959 0.0189
0.9 63.102 0.9955 0.0159
TABLE 11Propeller Designation
PrOpe 1 ler Geometric PresentModel Character- DesignationNumber istics
4381 0° Skew 0s
42b2 360 Skew 36s
4383 720 skew 72s
4497 36° Warp 36W
4498 72° Warp 72N
All experiments were run at thedesign advance coefficient and with four
values of the cavitation number. Sincethe experiments are not intended to rep-resent any particular ship, one cannottranslate cavitation number precisely tospeed. However, if we assume a tip sub-mergence of 3 meters, (9.84 ft) , and awake fraction of O. 22, a ship speed of26 knots corresponds to a cavitationnumber of
P.- P“IJ~= —= 1.8
~2D2;0
which would be reasonable top s~eed fora ship with this type of wake field.
With the tunnel operating at atmo–spheric pressure at 1100 propeller rev–olutions per minute, the resulting cav–
‘t?t’?n ‘umber ‘s ‘n76. 3, . Dividingth, s ].nterval of cavitation numbersevenly, we obtain the following fourtest conditions,
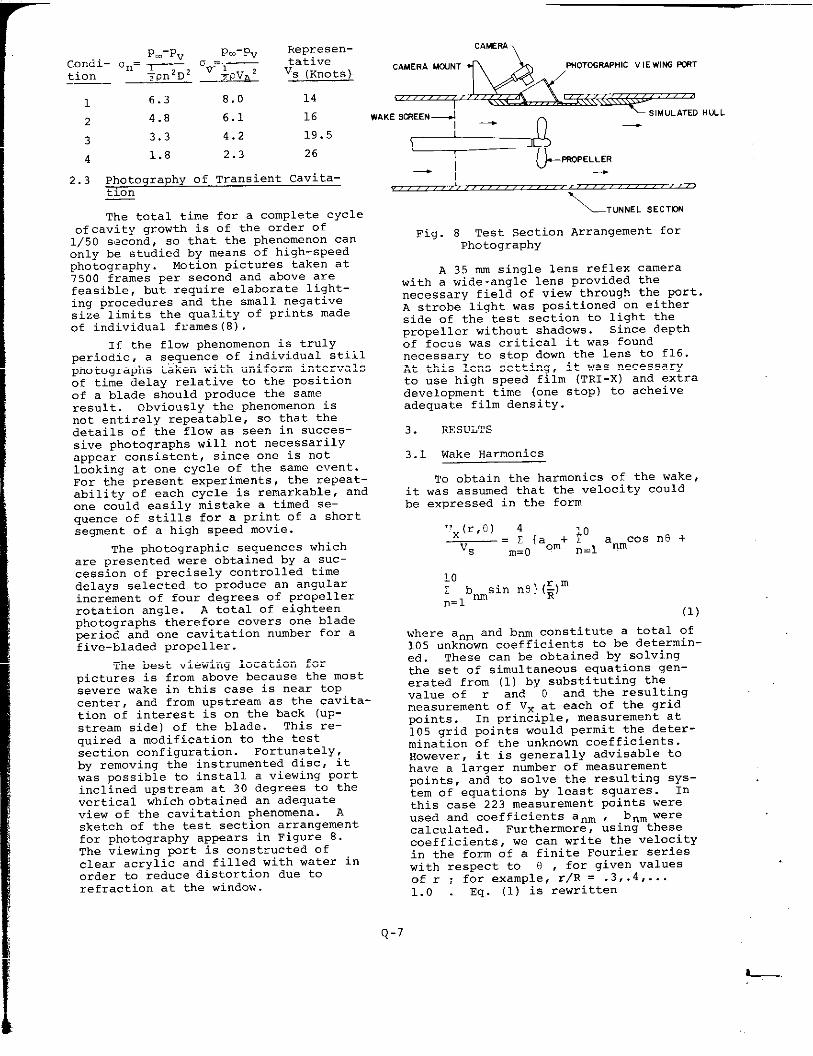
P.-Pv P--P” Represen- cAMEl?A
Condi- on= ~ — tativetion
Oe-=“1Tpn2D2 Tpvn 2 v~ ~Knot.~> CAMERA‘NT
d.
F+IOTOGRAPHICV[EWING-1——
1
2
3
4
2.3
1 T6.3 8.0 14 \_~”””
4.8 6.1 16 WAKESmEEN~n
SIMULATEtIHULL1- .
3.3 4.2 19.5
1.8 2.3 26
Photography of Transient cavita-t~on
The total time for a complete cycleof cavity growth is of the order of1/50 szcond, so that the phenomenon canonly be studied by means of high-speedphotography. Motion pictures taken at7500 frames per second and above arefeasible, but require elaborate light-ing procedures and tbe small negativesize limits the quality of prints madeof individual frames (8).
If the flow phenomenon is trulyperiodic, a sequence of individual stiilphotographs taken with uniform intervalsof time delay relative to the positionof a blade should produce the sameresult. obviously tbe phenomenon isnot entirely repeatable, so that thedetails of the flow as seen in succes-sive photog~aphs will not necessarilyappear conslstentr since one is notlooking at one cycle of the same event.For the present experiments, the repeat-ability of each cycle is remarkable, andone could easily mistake a timed se-quence of stills for a print of a shortsegment of a high speed movie.
The photographic sequences whichare presented were obtained by a suc–cession of precisely controlled timedelays selected to produce an angularincrement of four degrees of propellerrotation angle. A total of eighteenphotographs therefore covers one bladepermd and one cavitation number for afive-bladed propeller.
The best viewing location forpictures is from above because the mostsevere wake in this case is near topcenter, and from upstream as the cavita-tion of interest is on the back (up-stream side) of the blade. This re-guired a modification to the testzection configuration. Fortunately,by removing the instrumented disc, itwas possible to install a viewing portinclined upstream at 30 degrees to thevertical which obtained an adequateview of the cavitation phenomena. Asketch of the test section arrangementfor photography appears in Figure 8.The viewing port is constructed ofclear acrylic and filled with water inorder to reduce distortion due torefraction at the window.
~&,_R
I
\ TUNNELSECTC?.
Fig. 8 Test Section Arrangement forPhotography
A 35 nunsingle lens reflex camerawith a wide -angle lens provided thenecessary field of view through the port.A strobe light was positioned on eitherside of the test section to light theprope 11er without shadows. Since depthof focus was critical it was foundnecessary to stop down the lens to f16.At this lens setting, it was necessaryto use high speed film (TR1-x) and extradevelopment time (one stop) to acheiveadequate film density.
3. RESULTS
3.1 Wake Harmonics
To obtain the harmonics of the wake,it was assumed that the velocity couldbe expressed in the form
,’x(r,e) 4— . Z {aon+ *o cos n8 +
Vs 11=1anmm= o
10Z bnmsin n9} (~)m~=1
(1)
where anm and barnconstitute a total ‘f105 unknown coefficients to be determin-ed. These can be obtained by solvingthe set of simultaneous equations gen-erated from (1) by substituting thevalue of r and e and the resultingmeasurement of VX at each Of the gridpoints. In principle, measurement at105 grid points would permit the deter-mination of the unknown coefficients.However, it is generally advisable tohave a larger number of measurementpoints, and to solve the resulting sys-tem of eauations by least squares. Inthis cas~ 223 measurement points wereused and coefficients anm , bnm werecalculated. Furthermore, uSin9 thesecoefficients, we can write the velocityin the form of a finite Fourier serieewith respect to 0 , for given valuesof r ; for example, r/R = .3,.4,...1.0 . Eq. (1) is rewritten
Q-7
vx(r, fJ] 4 m= z aom (;)
Vs ~=(j
10 4
‘n!l ‘~~oanm ‘~)m} co’ ‘8
4+{E b~(~)ml sin n81
~= 0
10Z Ao~~l[An cos n8 + Bnsin n8]
where
N
o12345
(2) 89
10
N
o123456789
10
N
o12345678
1:
0.84280.0843
-0.11440.01990.0046
-0.0339-0.00010.0159
-0.0508-0.1256-0.0886
0.500RA(N)
0.98070.1502
-0.17960.06740.0109
-0.01340.0052
-0.00960.0189
-0.0345-0.0233
0.00000.11230.0808
-0.0045-0.0230-0.0261-0.0126-0.0530-0.0977-0.04070.0476
B(N)
0.0000-0.00100.01960.0193
-0.0281-0.0042-0.0105-0.0264-0.0278-0.01240.0007
67
0.700RA(N)
0.99630.1788
-0.16690.0865
-0.0310-0.0112
B(N)
O.oono-0.0129-0.01740.0142
-0.0115-0.0010
0.800RA(N) B(N)
1.0010 0.00000.1733 0.0255
-0.1675 -0.02870.0971 -0.0107
-0.0411 0.0047-0.0161 0.0064
0.0050 0.0011 -0.0025 -0.0022-0.0031 -0.0059 0.0050 0.00110.0042 0.0068 -0.0076 0.01250.0136 -0.0036 0.0176 -0.00530.0028 -0.0226 0.0035 -0.0212
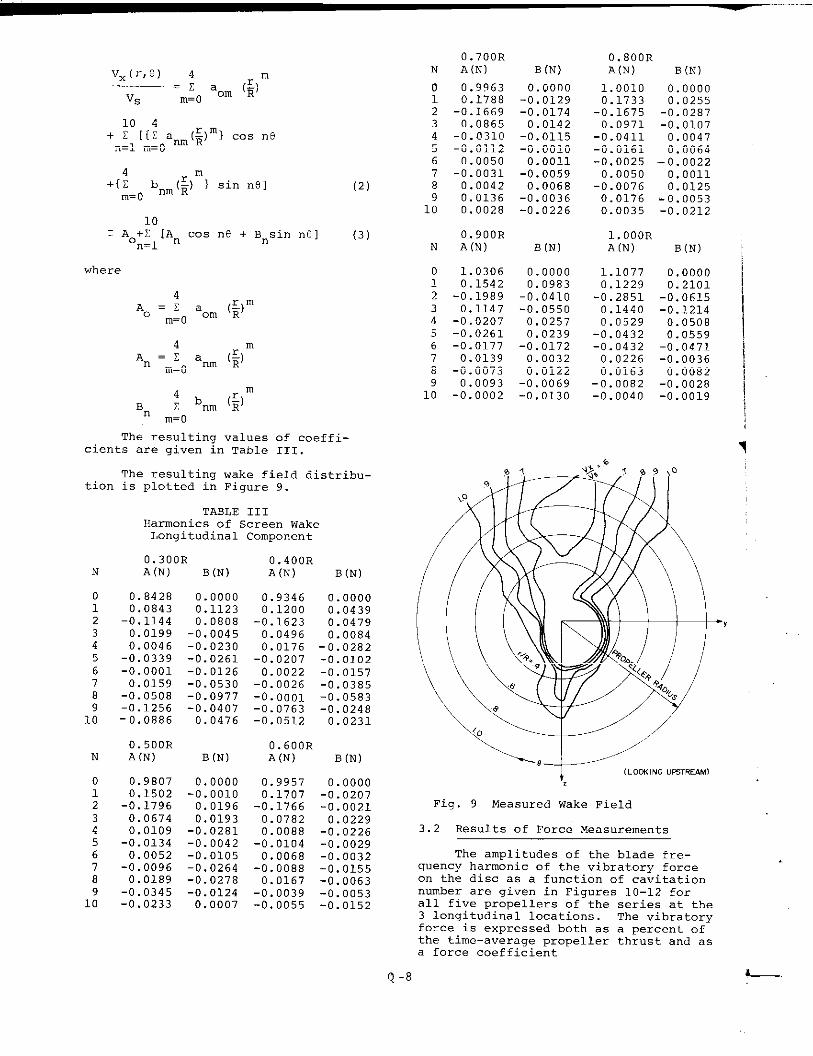
The resulting values of coeffi-cients are given in Table 111.
The resulting wake field distribu-tion is plotted in FiTure 9.
TABLE 111Harmonics of screen WakeLongitudinal Component
(3) 0.900R 1.000RN A(N) B(N) A(N) B(N)
o123456789
10
1.0306 0.0000 1.10770.1542 0.0983 0.1229
-0.1989 -0.0410 -0.28510.1147 -0.0550 0.1440
-0.0207 0.0257 0.0529-0.0261 0.0239 -0.0432-0.0177 -0.0172 -0.04320.0139 0.0032 0.0226
-0.0073 0.0122 0.01630.0093 -0.0069 -0.0082
-0.0002 -0.0130 -0.0040
0.00000.2101
-0.0615-0.12140.05080.0559
-0.0471-0.00360.0082
-0.0028-0.0019
0.300R 0.400RA(N) B(N) A(N) B (N)
0.9346 0.00000.1200 0.0439
-0.1623 0.04790.0496 0.00840.0176 -0.0282
-0.0207 -0.01020.0022 -0.0157
-0.0026 -0.0385-0.0001 -0.0583-0.0763 -0.0248-0.0512 0.0231
0.600RA(N) B(N)
0.9957 0.00000.1707 -0.0207
-0.1766 -0.00210.0782 0.02290.0088 -0.0226
-0.0104 -0.00290.0068 -0.0032
-0.0088 -0.01550.0167 -0.0063
-0.0039 -0.0053-0.0055 -0.0152
‘+’=-Fig. 9 Measured Wake Field
3.2 Results of Force Measurements
The amplitudes of the blade fre-quency harmonic of the “ibratory forceon the disc as a function of cavitationnumber are gi”en in Figures 10-12 forall five propellers of the series at the3 lcmqitudinal locations . The “ibratoryforce is expressed both ?.sa percent ofthe time-a”erage propeller thrust and asa force coefficient
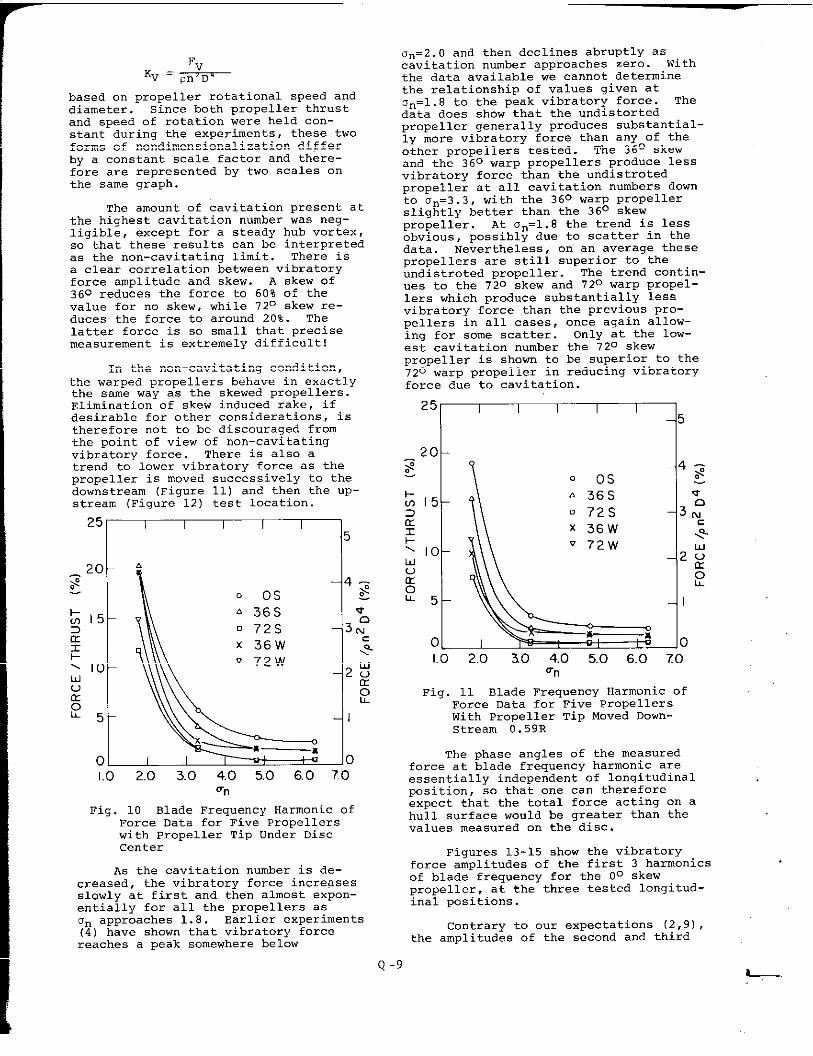
Fv‘V ‘“pn’D’
based on propeller rotational speed anddiameter. Since both propeller thrustand speed of rotation were held con-stant during the experiments, these twoforms of nondimensional ization differby a constant scale factor and there-fore are represented by two scales onthe same graph.
The amount of cavitation present atthe highest cavitation number was neg-ligible, except for a steady hub vortex,so that these results can be interpretedas the non-cavitating limit. There isa clear correlation between vibratoryforce amplitude and skew. A skew of~~0 red”ceS the force to 60% of the
value for no skew, while 72° skew re-duces the force to around 20%. Thelatter force is so small that precisemeasurement is extremely difficult!
In the non-cavitating condition,the warped propellers behave in exactlythe same way as the skewed propellers.Elimination of skew induced rake, ifdesirable for other considerations, istherefore not to be discouraged fromthe point of view of non-cavitatingvibratory force. There is also atrend to lower vibratory force as thepropeller is moved successively to thedownstream (Figure 11) and then the uP-stream (Figure 12) test location.
1.0 2.0 3.0 4.0 5.0 6.0 7.0‘n
Fig. 10 Blade Frequency Harmonic ofForce Data for Five Propellerswith Propeller Tip Under Disccenter
As the cavitation number is de-creased, tbe vibratory force increasesslowly at first and then almost expon-entially for all the propellers as
on approaches 1.8. Earlier experiments(4) have shown that vibratory forcereaches a peak somewhere below
on=?.O and then declines abruptly ascavitation number approaches zero. Withthe data available we cannot determinethe relationship of values given at‘Jn=l.8 to the peak vibratory force. Thedata does show that the undistortedpropeller generally produces substantial-ly more vibratory force than any of theother propellers tested. The 36° skewand the 360 warp propellers produce lessvibratory force than the undistrotedpropeller at all cavitation numbers downto un=3. 3, with the 360 warp propellerslightly better than the 36° skewpropeller. At an=l.8 tbe trend is lessobvious, possibly due to scatter in thedata. Nevertheless, on an average thesepropellers are still superior to theundistroted propeller. The trend contin-ues to tbe 720 skew and 72° warp propel-lers which produce substantially lessvibratory force than tbe previous Pro-pellers in all cases, once again allOw-ing for some scatter. Only at the low-est cavitation number the 72° skewpropeller is shown to be superior to the720 warp propeller in reducing “ibratory
force due to cavitation.
25~
Fig. 11 Blade Frequency Harmonic ofForce Data for Five PropellersWith Propeller Tip Moved Down-stream 0.59R
The phase angles of the measuredforce at blade frequency harmonic areessentially independent of longitudinalposition, so that one can thereforeexpect that the total force acting on ahull surface would be greater than thevalues measured on the disc.
Figures 13-15 show the vibratoryforce amplitudes of the first 3 harmonicsof blade frequency for the 0° skewpropeller, at the three tested longitud-inal positions.
contrary to our expectations (2,9),the amplitudes of the second and third
Q -9
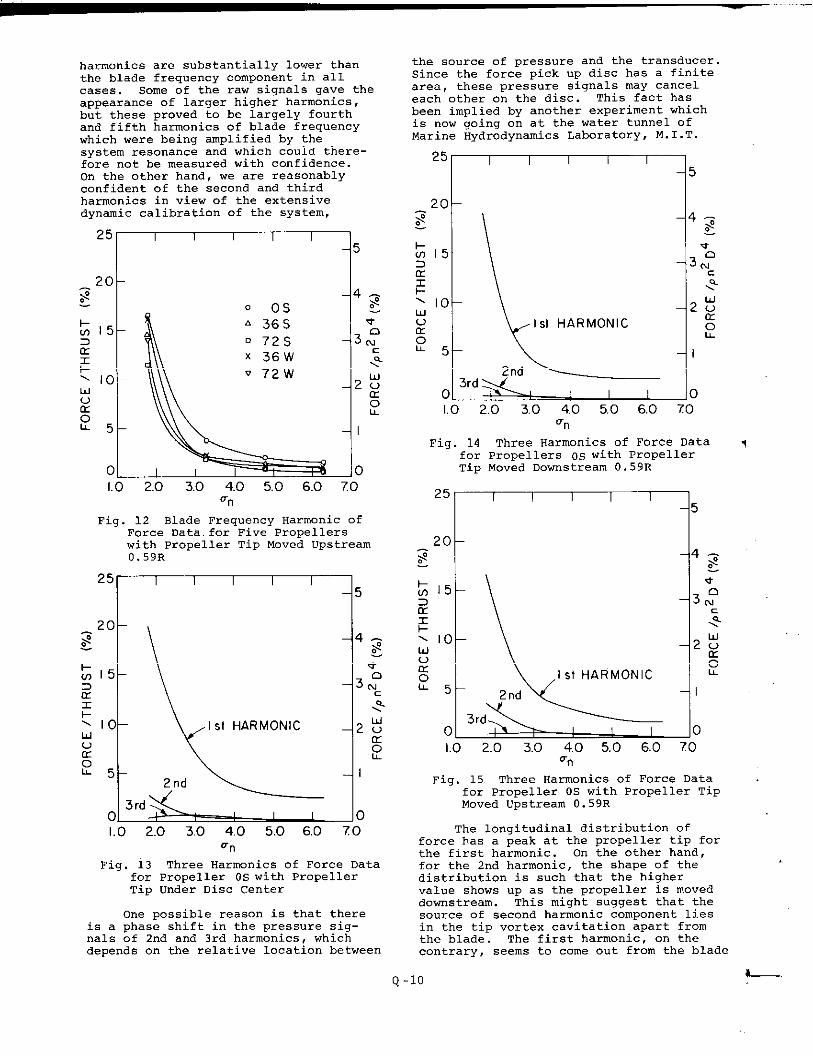
harmonics are substantially lower thanthe blade frequency component in al 1cases. Some of the raw signals gave theappearance of larger higher harmonics,but these proved to be largely fourthand fifth harmonics of blade frequencywhich were being amplified by thesystem resonance and which could there-fore not be measured with confidence.On the other hand, we are reasonablyconfident of the second and thirdharmonics in view of the extensivedynamic calibration of the system,
I4 -a
o 0s >
A 36S u
D 72S 3:
~ 36W :Q
Q 72W2:
0k
‘n
Fig. 12 Blade Frequency Harmonic ofForce Data. for Five Propellerswith Propeller Tip Moved upstream0.59R
k
k\Q
~ 10 I st HARMONICw 2%
u cc
m g
~’2nd
3rdo 01.0 2.0 3.0 4.0 5.0 6.0 70
‘n
Fig. 13 Three Harmonics of Force Datafor Propeller 0s with PropellerTip Under Disc Center
One possible reason is that thereis a phase shift in tbe pressure sig-nals of 2nd and 3rd harmonics, whichdepends on the relative location between
the source of pressure and the transducer.Since the force pick up disc has a finitearea, these pressure signals may canceleach other on the disc. This fact hasbeen implied by another experiment whichis now going on at the water tunnel ofMarine Hydrodynamics Laboratory, M.1.T.
I II I I
[
ISI HARMONIC
\ +1
3rd ~2nd ~
o I I IILO 2.0 3.0 4.0 5.0 6.0
‘n
Fig. 14 Three Harmonics of Force Data yfor Propellers os with PropellerTip Moved Downstream O.59R
Lkd!1.0 2.0 3.0 4.0 5.0 6.0 70
‘n
Fig. 15 Three Harmonics of Force Datafor Propeller OS with Propeller TipMoved Upstream 0.59R
Tbe longitudinal distribution offorce I?asa peak at the propeller tip fortbe first harmonic. On the other hand,for the 2nd harmonic, the shape of thedistribution is such that the highervalue shows up as the propeller is moveddownstream. This might suggeSt that tbesource of second harmonic component liesin the tip vortex cavitation apart fromthe blade. The first harmonic, on tbecontrary, seems to come out from the blade
Q-10
attached cavitation. This differenceof source may explain the fact that thesecond harmonic has phase shift whereasthe first does not.
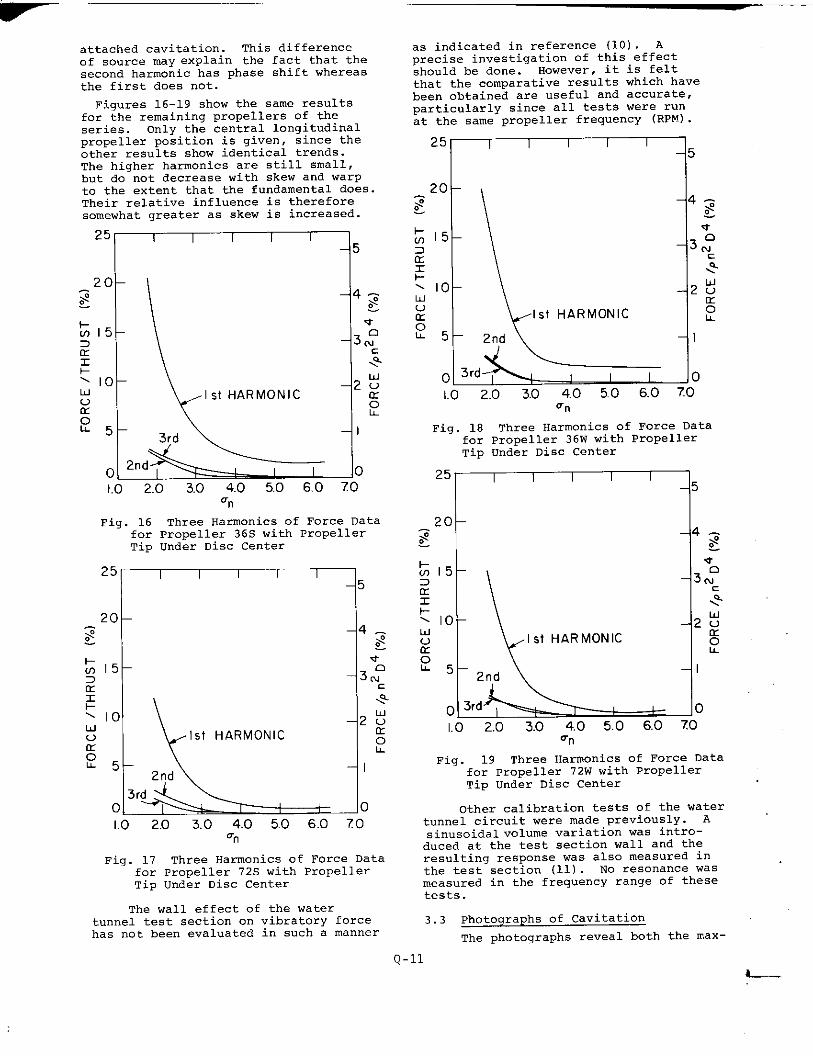
F;.gures 16-19 show the same resultsfor the remaining propellers of theseries. Only the central longitudinalpropeller position is given, since theother results show identical trends.The higher harmonics are still small,but do not decrease with skew and warPto the extent that the fundamental does.Their relative influence is thereforesomewhat greater as skew is increased.
I I I I
‘i
5
,L ~4-3
>
*
3 ~“
<a
2:I st HARMONIC
~
3rd
o 2nd o1.0 2.0 3.0 4.0 5.0 6.0 70
‘n
Fig. 16 Three Harmonics of Force Datafor Propeller 36s with PropellerTip Under Disc Center
I4 -a>
*
3 ~“
I
:Q
2:Ist HARMONIC a
L
o~:ILO 2.0 3.0 4.0 5.0 6.0 70
%
Fig. 17 Three Harmonics of Force Datafor Propeller 72s with PropellerTip Under Disc Center
The wall effect of the watertunnel test section on vibratory forcehas not been evaluated in such a manner
as indicated in reference (10). Aprecise investigation of this effectshould be done. However, it is feltthat the comparative results which havebeen obtained are useful and accurate,particularly since all tests were runat the same propeller frequency (RPM).
I
k~15
zs+~ 10wvlx
L
‘ : 3rd2ndL ‘o
1.0 2.0 3.0 4.0 5.0 6.0 7.0‘n
Fig. 18 Three Harmonics of Force Datafor Propeller 36w with PropellerTip under Disc Center
‘n
Fig. 19 Three Harmonics of Force Datafor Propeller 72w with PropellerTip Under Disc Center
other calibration tests of the watertunnel circuit were made previously. Asinusoidal volume variatiOn was intro-duced at the test section wall and theresulting response was also measured inthe test section (11). NO resonance wasmeasured in the frequency range of thesetests.
3.3 Photographs of Cavitation
The photographs reveal both the max -
Q-l]
an = 1.8‘n = 3.3
e
‘n = 1.8
4
4
41
j2
;6
o
54
8
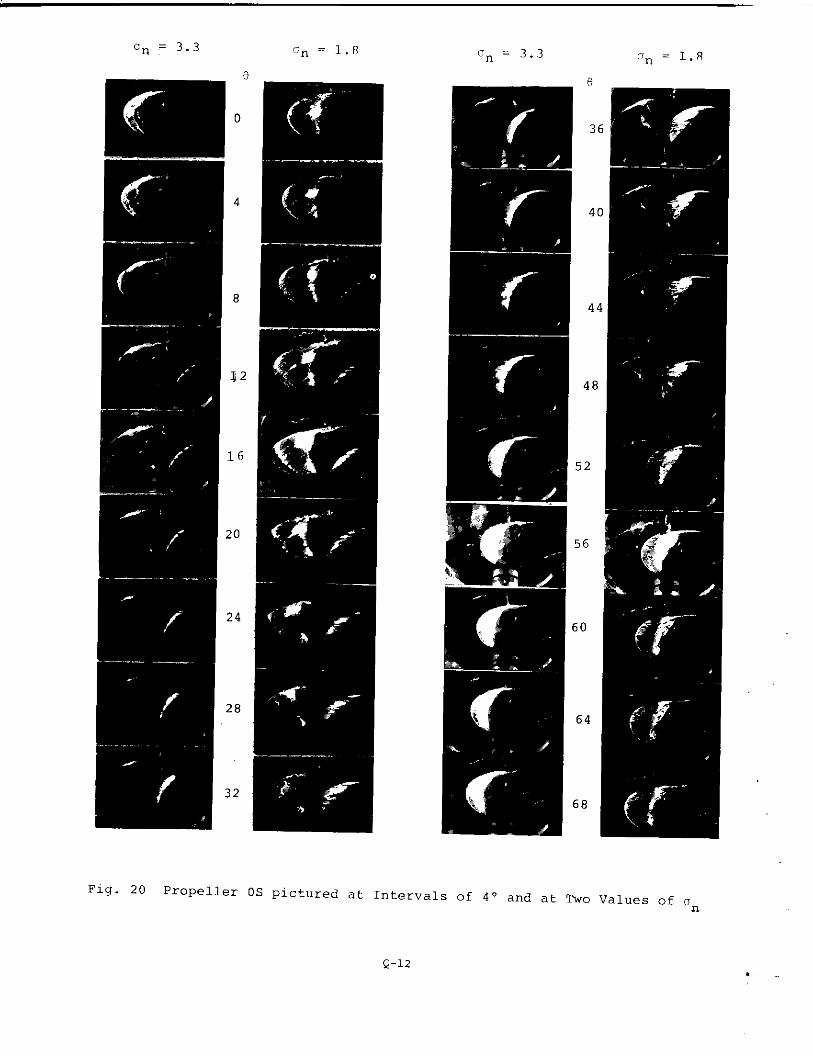
Fig. 20 Propeller OS pictured at Intervals of 4° and at TWO Values of on
Q-12.
an = 3.3 ‘n = 1.8n
o
4
8
12
16
20
24
28
32
‘]n = 3.3 ‘n = I..Ue
36
40
44
48
52
56
60
64
68
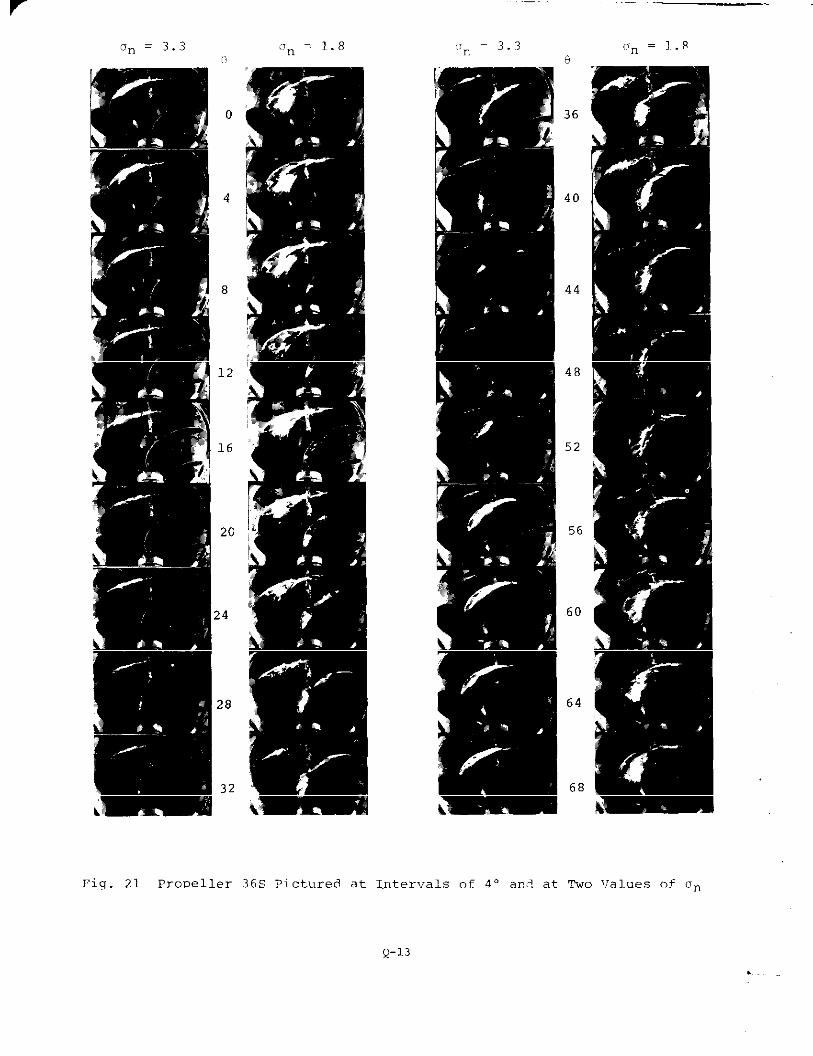
Fig. 21 PrODeller 36s pi .ctured at Intervals ,7al.ues of on
Q-13
.
—— ,-
‘n = 3.3
e
o
4
8
12
16
20
24
28
32
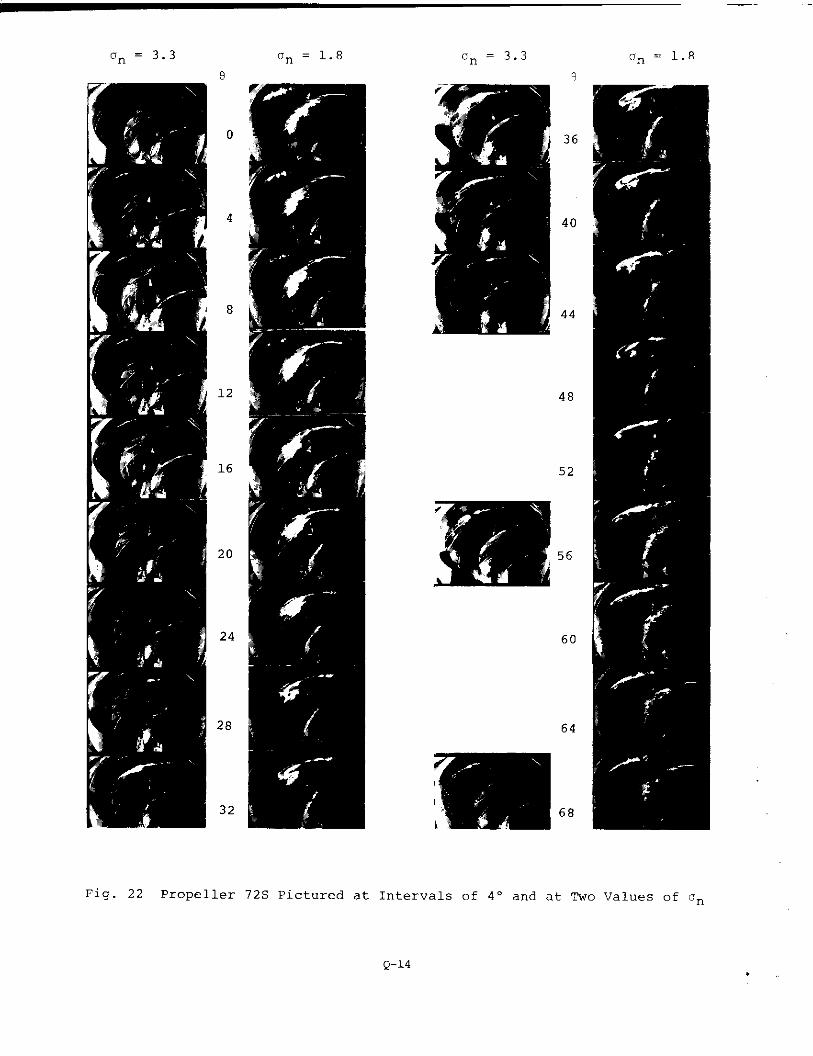
Fig. 22 Propeller
‘n = 1.8‘n = 3.3
9
36
40
44
48
52
60
64
68
‘n = 1.8
72s Pictured at Intervals of 4° and at TWO VaIueS of On
Q-14●
.-
“n = 3.3 “r)= 1.8
0
4
8
12
16
20
24
28
32
(cn = 3.3 ‘n = 1.8
36
40
44
60
64
B
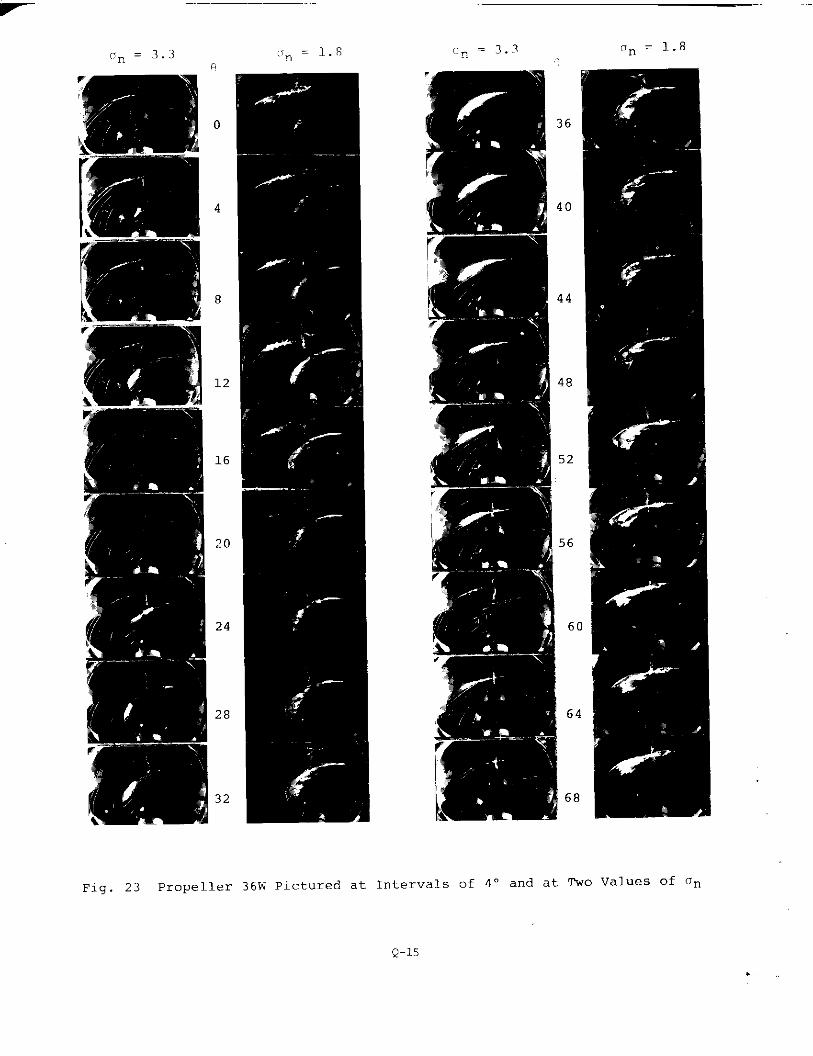
Fig. 23 Propeller 36W Pictured at Intervals of 4° and at TWO Values of On
Q-15
●
Un = 3.3 ‘n = 1.8 ‘n = 3.3
4
8
12
16
20
2,
2
.3
8
36
40
44
48
52
5(
6(
‘n = 1.8
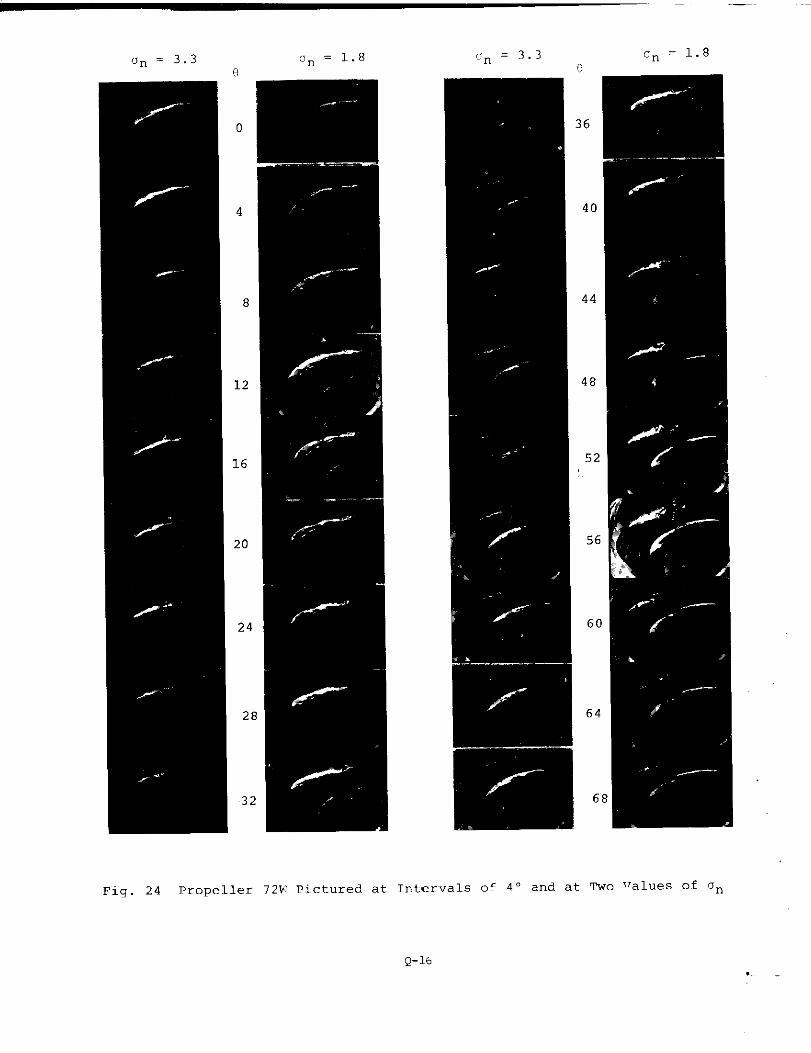
Fig. 24 Propeller 72W Pictured at Intervals of 4“ and at TWO ‘~alUes Of an
Q-16,
imum extent of blade cavitation as afunction of cavitation number, as wellas the nature of the cavity collapse.
For the zero degree skew propeller,Figure 20, it is evident that at un=3. 3the cavity collapses by moving outtoward the tip, while for Un=l. 8 thecavity initially rolls back from theleading edge.
The maximum extent of cavitationappears to decrease with increasingskew or warp, which one might anticipateon the basis of the relative intensityof the measured vibratory forces. Therealso appears to be more of a tendencyfor the cavity to collapse into thevortex as skew is increased.
In figures 20 and 21 for example,the photographic data for propellersOS and 36s respectively are presented.Each column of photos is for a constantcavitation number, and propeller angu-lar position advances in four degreeincrements from top to bottom of thepage, continuing onto a second column.
Similarly, figures 22, 23, and24 present results for propellers 72s,36w and 72w respectively.
4. CONCLUS1ONS
It was shown by the experimentsdone with a relatively simple arrange-ment that the transient cavitation hasa significant role in propeller vibra-tory force. As transient cavitationbecomes worse, the vibratory force ismagnified by a factor of the order of10 or more. This trend agrees withthe results of previous research (1).
It “as shown that skew and warpare effective in reducing vibratoryforce in both non-cavitating and cavita-ting cases. However, the relativemagnitude of vibratory force withcavitation to that without cavitationis much higher for the skewed or warpedpropeller. In other words, we can say,skewed or warped propellers are sensi-tive to the influence of cavitation(Figures 10-12) .
The higher harmonics, namely secondand third, were not as large as we badexpected. One possible reason for thisIS that these harmonics have a phaseshift and tbe signals cancel each otheron the force measurinq disc. This isnot the case for the first harmonic,on the other hand. The different sourceswhich were implied from observingFigures 13-15 may underline it. Furtherinvestigation would be required tosubstantiate this.
The ratio of disc to propellerdiameter was chosen so as to make thesetest results as realistic as possible.‘Therefore, it is felt that the r~lativechange in hull vibration excitationfor these propeller geometries shouldbe applicable to the full-scale ship.
RKFERJ3NCES
1.
2.
3.
4.
5.
6.
7.
8.
9.
10,
E. Huse, ,,Cavitation. Induced HullPressures, Some Recent Develop-ments of Model Testing Tech-niques, ” symposium on “HighPowered Propulsion of Large. ScaleShips, ” Decemeber 1974,Wageningen.
c. A. Johnsson, 0. RyIgersson,s. olsson and 0. B]orheden,“Vibration Excitation Forces Froma cavitating Propeller. Model andFull- Scale Tests on a High- SpeedContainer Ship, ” Eleventh symposiumon Naval Hydrodynamics, March 1976,London.
T. s~ntvedt and H. Frivold, “LOWFrequency variation of the SurfaceShape of Tip Region Cavitation onMarine Propeller Blades andCorresponding Disturbances onNearby solid Boundaries, ” Ele~enthSYmPosiUM on Naval Hydrodynamics,March 1976, London.
F. M. LeWis and J. E. Kerwin,“Vibratory Forces on a SimulatedHull Surface Produced by Transientpropeller cavitation, ” preparedfor SANME Panel H-8, February 1976.
R. J. Boswell, ,,Design, CavitationPerformance, and Open-Water Perfor-mance of a Series of ResearchSkewed Propel lers, ” NS~C RePort3339, March 1971.
R. A. Cvmming, W. B. Morgan andR. J. Boswell, “Highly SkewedPropel lers, ” SNAME Annual Meeting,November 1972, New York.
J. J. Nelka, ,,Experimental Evalua-tion of a series of Skewed Pro-pellers with Forward Rake : Open-Water Performance, CavitationPerformance, Field-Point Pressuresand Unsteady Propeller Loading, ”NSRDC Report 4113, July 1974.
J. K. Vandiver and C. A. Wales,“High-Speed Photography of Trans-ient Cavitation on Marine Propel-lers, ” High Speed Photography:Proceedings of the 12th International
Congress on High Speed Photography,AugUSt 1976, PP. 172-174, Toronto.
J. P. Breslin, C,ATheory for theVibratory Forces on a Flat PlateArising from Intermittent PropellerBlade Cavitation, ” Symposium On,,Hydrodynamics of Ship and Off-Shore Propulsion Systems, ” March1977, 0s10.
E. Hu~e, ,,Effeet of Tunnel walls upon
Propeller-Induced Pressure incavitation Tunnels,” Report ofthe Ship Research Institute ofNorway, September 1973.
Q-17

11. C. J. Gedney, “An Investigationof the Acoustical Characteristicsof the M.I.T’.Water Tunnel, ,vM.1.T. , Department of oceanEngineering, Report 84188-1,January 1978.
Q-18