Embed Size (px)
Citation preview

http://www.cs.ubc.ca/~tmm/courses/547-15
Ch 5: Marks and ChannelsPaper: Polaris
Tamara MunznerDepartment of Computer ScienceUniversity of British Columbia
CPSC 547, Information VisualizationDay 2: 15 September 2015

News
• Three copies of physical book available in Reading Room (ICICS/CS 262)• Signup sheet: mark last column with new probabilities
– add yourself at end if you weren’t here last time
• Waitlist update: 38 registered so 2 slots open; 2 on waitlist• Questions/comments were due at 1:30pm today• Guest lecture from Robert Kosara on Tableau at 2:20
– my section only 20 minutes
2

VAD Ch 5: Marks and Channels
3
Magnitude Channels: Ordered Attributes Identity Channels: Categorical Attributes
Spatial region
Color hue
Motion
Shape
Position on common scale
Position on unaligned scale
Length (1D size)
Tilt/angle
Area (2D size)
Depth (3D position)
Color luminance
Color saturation
Curvature
Volume (3D size)
Channels: Expressiveness Types and E!ectiveness Ranks
[VAD Fig 5.1]

Encoding visually
• analyze idiom structure
4

5
Definitions: Marks and channels• marks
– geometric primitives
• channels– control appearance of marks
Horizontal
Position
Vertical Both
Color
Shape Tilt
Size
Length Area Volume
Points Lines Areas

Encoding visually with marks and channels
• analyze idiom structure– as combination of marks and channels
6
1: vertical position
mark: line
2: vertical positionhorizontal position
mark: point
3: vertical positionhorizontal positioncolor hue
mark: point
4: vertical positionhorizontal positioncolor huesize (area)
mark: point

7
Channels: Expressiveness types and effectiveness rankingsMagnitude Channels: Ordered Attributes Identity Channels: Categorical Attributes
Spatial region
Color hue
Motion
Shape
Position on common scale
Position on unaligned scale
Length (1D size)
Tilt/angle
Area (2D size)
Depth (3D position)
Color luminance
Color saturation
Curvature
Volume (3D size)
8
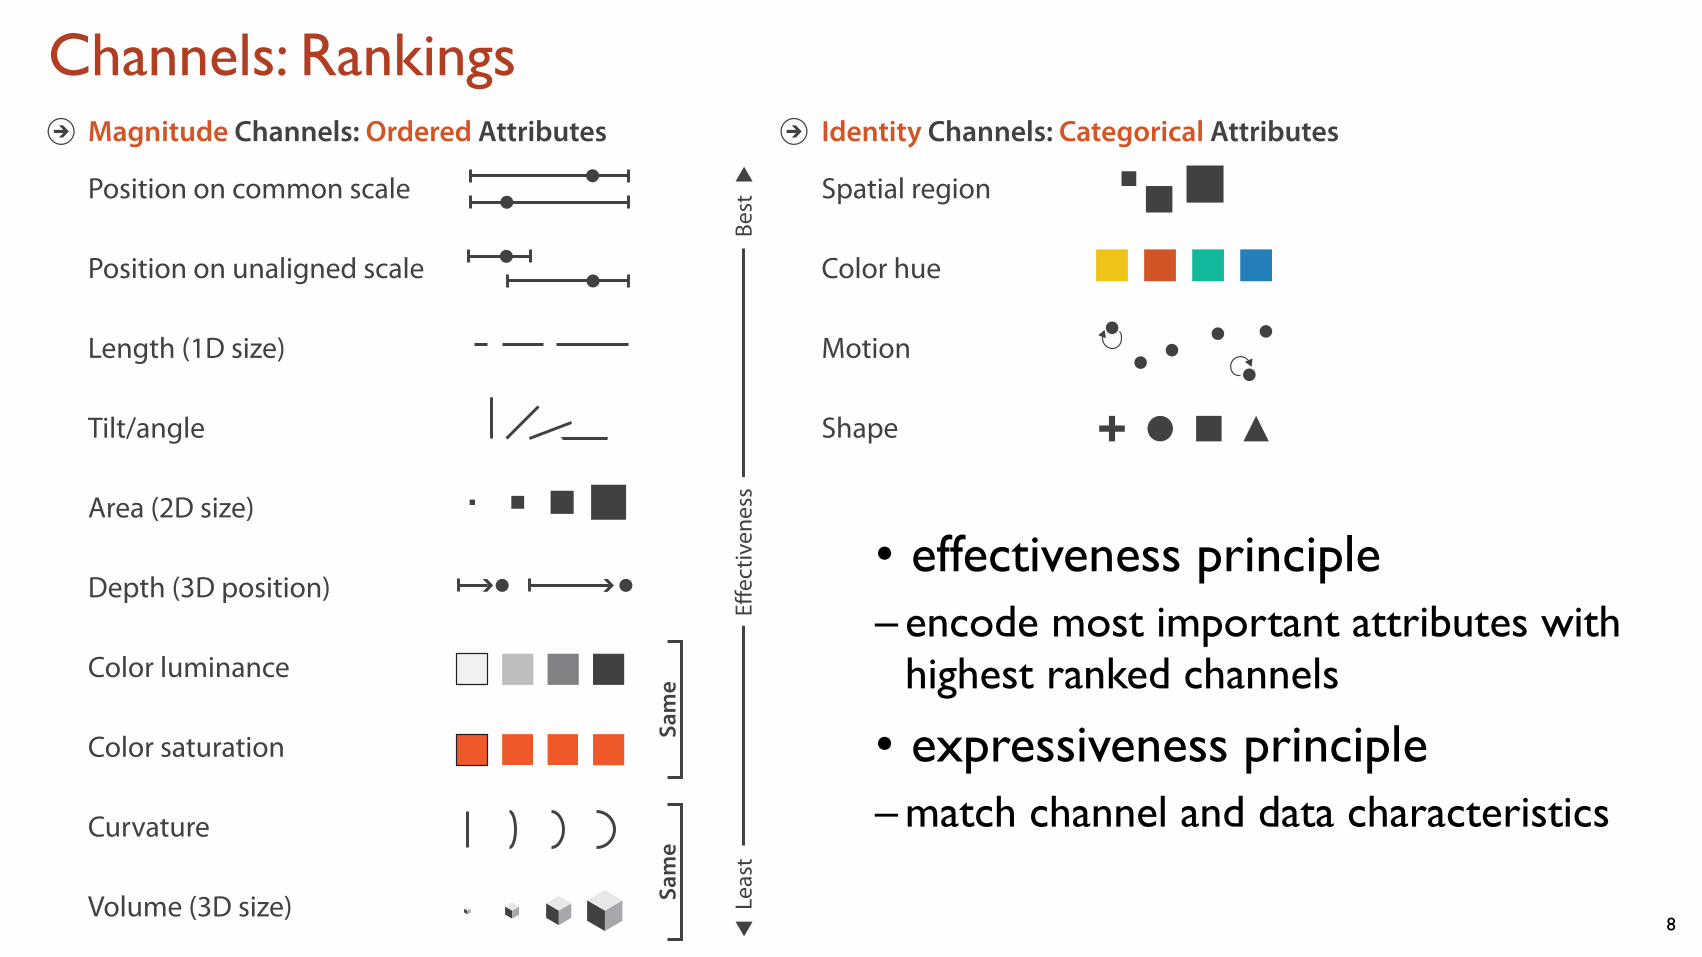
Channels: RankingsMagnitude Channels: Ordered Attributes Identity Channels: Categorical Attributes
Spatial region
Color hue
Motion
Shape
Position on common scale
Position on unaligned scale
Length (1D size)
Tilt/angle
Area (2D size)
Depth (3D position)
Color luminance
Color saturation
Curvature
Volume (3D size)
• effectiveness principle– encode most important attributes with
highest ranked channels
• expressiveness principle– match channel and data characteristics

Accuracy: Fundamental Theory
9

Accuracy: Vis experiments
10after Michael McGuffin course slides, http://profs.etsmtl.ca/mmcguffin/
[Crowdsourcing Graphical Perception: Using Mechanical Turk to Assess Visualization Design. Heer and Bostock. Proc ACM Conf. Human Factors in Computing Systems (CHI) 2010, p. 203–212.]
Positions
Rectangular areas
(aligned or in a treemap)
Angles
Circular areas
Cleveland & McGill’s Results
Crowdsourced Results
1.0 3.01.5 2.52.0Log Error
1.0 3.01.5 2.52.0Log Error

Discriminability: How many usable steps?
• must be sufficient for number of attribute levels to show– linewidth: few bins
11
[mappa.mundi.net/maps/maps 014/telegeography.html]

Separability vs. Integrality
12
2 groups each 2 groups each 3 groups total:integral area
4 groups total:integral hue
Position Hue (Color)
Size Hue (Color)
Width Height
Red Green
Fully separable Some interference Some/signi!cant interference
Major interference

A System for Query, Analysis and Visualization of Multi-dimensional Relational Databases
Stolte, Tang and Hanrahan, IEEE TVCG 8(1):52-65 2002
Polaris
Chris Stolte, Diane Tang, Pat Hanrahan
http://www.graphics.stanford.edu/projects/polaris/
Polaris: A System for Query, Analysis and Visualization of Multi-dimensional Relational Databases.
13

Polaris: Stolte, Tang, and Hanrahan
• infovis spreadsheet– table cells have graphical
elements, not just numbers– wide range of channels and
marks
• example– marks: circles– color channel: saturation– size channel: area– partition: state x
product:month• ord x ord
14
[Fig 3a. Polaris: A System for Query, Analysis and Visualization of Multi-dimensional Relational Databases. Stolte, Tang and Hanrahan, IEEE TVCG 8(1):52-65 2002.]

Table Algebra :: Interactive Interface
• drag and drop actions map to formal language underneath– partitioning using shelves– different results for ord vs quant
15
[Fig 2. Polaris: A System for Query, Analysis and Visualization of Multi-dimensional Relational Databases. Stolte, Tang and Hanrahan, IEEE TVCG 8(1):52-65 2002.]

Polaris
• example– marks: Gantt chart bars– color channels: nominal /
categorical– spatial position channels:
country x year• ord x quant
16
[Fig 3b. Polaris: A System for Query, Analysis and Visualization of Multi-dimensional Relational Databases. Stolte, Tang and Hanrahan, IEEE TVCG 8(1):52-65 2002.]

Polaris
• example– views: scatterplots– marks: points– spatial position channels:
profit x month• quant x (2 ord)
17
[Fig 3d Polaris: A System for Query, Analysis and Visualization of Multi-dimensional Relational Databases. Stolte, Tang and Hanrahan, IEEE TVCG 8(1):52-65 2002.]

Terminology I: Now and Upcoming
• Marks and Channels– retinal variables/properties: visual channels– mark: mark
• Data Abstraction– column or field: attribute
• nominal: categorical
• ordinal: ordered• quantitative: quantitative
– row or record: item– dimension / independent / ordinal: key attribute
• all ordinal fields treated as dimensions in Polaris
– measure / dependent : value attribute• all quantitative fields treated as measures in Polaris
18

Terminology II: Upcoming• Data Abstraction
– deriving data
• Map Color and Other Channels– hue: hue
– value: saturation
– brightness: luminance
• Manipulate View– sorting
• Facet Into Multiple Views– pane: view
– partitioning
– brushing: linked highlighting
• Reduce Items and Attributes– aggregation, filtering
19

Polaris: Pre and post
• influences– Bertin’s Semiology of Graphics book (1967 / 1998)– Wilkinson’s Grammar of Graphics book (1999 / 2005)– Mackinlay’s APT paper/system (1986)– Cleveland’s Visualizing Data book (1993)
• Stolte and Hanrahan commercialized as Stanford spinoff Tableau Software– major success story in vis, $2B IPO in 2013– Mackinlay joined in 2004, Wilkinson joined in 2014
• Tableau use in this course– very useful for analysis projects– possible sandbox for experimentation when starting programming projects– you can request free student license, good for one year
• http://www.tableau.com/academic/students20

Further reading: Articles• Crowdsourcing Graphical Perception: Using Mechanical Turk to Assess Visualization Design. Jeffrey Heer and Michael
Bostock. Proc. CHI 2010• Graphical Perception: Theory, Experimentation and the Application to the Development of Graphical Models. William S.
Cleveland, Robert McGill, J. Am. Stat. Assoc. 79:387, pp. 531-554, 1984.• A Model for Studying Display Methods of Statistical Graphics (with Discussion). William S. Cleveland. Journal of
Computational and Statistical Graphics 2(4):323-364 1993.• Automating the Design of Graphical Presentations of Relational Information. Jock Mackinlay, ACM Transaction on Graphics,
vol. 5, no. 2, April 1986, pp. 110-141.• Taxonomy-Based Glyph Design---With a Case Study on Visualizing Workflows of Biological Experiments. Eamonn Maguire,
Philippe Rocca-Serra, Susanna-Assunta Sansone, Jim Davies, and Min Chen. IEEE TVCG (Proc. InfoVis 12) 18(12):2603-2612 2012.
• Glyph-Based Visualization: Foundations, Design Guidelines, Techniques and Applications. Rita Borgo, Johannes Kehrer, David H.S. Chung, Eamonn Maguire, Robert S. Laramee, Helwig Hauser, Matthew Ward, and Min Chen. Eurographics State of the Art Reports (STAR):39-63 2013.
• On the Theory of Scales of Measurement. S. S. Stevens. Science 103(2684):677-680, 1946.• Perception in Vision web page with demos, Christopher Healey. (see also Attention and Visual Memory in Visualization and
Computer Graphics, Christopher G. Healey and James T. Enns, IEEE TVCG 18(7):1170-1188 2012.)• Feature Analysis in Early Vision: Evidence from Search Asymmetries. Treisman and Gormican. Psychological Review 95(1):
15-48, 1988.21

Further reading: Books• Visualization Analysis and Design. Munzner. CRC Press, 2014.
– Chap 5: Marks and Channels
• The Grammar of Graphics, Leland Wilkinson, Springer-Verlag 1999.
• Semiology of Graphics, Jacques Bertin, Gauthier-Villars 1967, EHESS 1998.• Psychophysics: Introduction to its Perceptual, Neural, and Social Prospects.
Stevens. Wiley, 1975.• Visual Thinking for Design. Ware. Morgan Kaufmann, 2008.• Information Visualization: Perception for Design, 3rd edition. Ware. Morgan
Kaufmann /Academic Press, 2013.
• How Maps Work: Representation, Visualization, and Design. Alan M. MacEachren. Guilford Press, 1995.
22

Next Time
• to read– VAD Ch. 1: What’s Vis, and Why Do It? (review, mostly covered in first class)– VAD Ch. 2: Data Abstraction (new material)
23

Now
• Guest lecture/demo from Robert Kosara on Tableau
24


![545 547 st. marks avenue - brooklyn - new york [bhre group]](https://img.pdfslide.us/doc/110x75/55a505731a28abc5648b45d0/545-547-st-marks-avenue-brooklyn-new-york-bhre-group.jpg)