Embed Size (px)
Citation preview
i
CFD SIMULATION OF THE DYNAMIC FLOW BEHAVIOR IN A BUBBLE
COLUMN REACTOR
SAZALI BIN MD HASAN
A project report submitted in partial
fulfillment of the requirement for the award of the
Degree of Master of Mechanical Engineering
Faculty of Mechanical and Manufacturing Engineering
Universiti Tun Hussein Onn Malaysia
JULY 2015
v
ABSTRACT
In this project report an Eulerian two-phase Computational Fluid Dynamics (CFD)
model for modelling bubble columns is presented. This model is able to predict the
bubbly flow parameter such as gas holdup, contact surface area, air volume fraction,
pressure drop, and velocity magnitude to understanding the hydrodynamic flow
behaviors. Three types of gas distributor design are tested on the 1.5 m height and
0.15 m diameter bubble column cylinder. Five different velocities are used on the
each gas distributor design in order to produces a variety flow pattern in the bubble
column. The ANSYS Fluent Workbench 15.0 was used as the numerical solution to
make the simulation analysis on the bubble column problems. In this simulation, gas
(air) is dispersed through the gas distributor into liquid (water) in the bubble column
to produces the bubbles rising along the cylinder. The graphically simulation result
of gas holdup and velocity profile are compare to the previous simulation result
similarly tendency in shape. Quite good agreement is obtained. It observed that by
increasing the superficial gas velocity, gas holdup also increases and magnitude
velocity will decreases when approached the wall. From the simulation result
obtained, design “c” with larger holes diameter and open area ratio mostly given the
highest value of gas holdup, contact surface area, air volume fraction and magnitude
velocity compare to other design. The gas distributor holes sizing will be determined
the size of bubble produces. The large bubble having more buoyancy force and rise
velocity compare to small bubble.
vi
ABSTRAK
Kaedah pemodelan bubble column menggunakan Eulerian two-phase Computational
Fluid Dynamics (CFD) model yang di tunjukkan dalam laporan ini berupaya
mengesan bubbly flow parameter seperti“gas holdup”, “contact surface area”, “air
volume fraction”, pressure drop”, dan “velocity magnitude” bagi memahami
tingkah laku aliran hidrodinamik. Dalam simulasi ini, tiga jenis pembahagi gas di uji
terhadap“bubble column cylinder” yang berketinggian 1.5 m dengan diameter 0.15
m. Untuk menghasilkan pelbagai corak aliran di dalam“bubble column”, lima halaju
gas yang berbeza digunakan keatas setiap rekabentuk pembahagi gas. ANSYS Fluent
Workbench 15.0 digunakan sebagai kaedah penyelesaian berangka bagi membuat
analisis simulasi terhadap“bubble column”. Bagi menghasilkan gelembung udara
yang naik di sepanjang silinder, gas (udara) di sesarkan melalui pembahagi gas
kedalam cecair (air). Bagi mengesahkan keputusan yang diperolehi, satu
perbandingan keputusan “gas holdup” dan “velocity magnitude” dalam bentuk graf
telah dilakukan terhadap keputusan simulasi penyelidik terdahulu dan persetujuan
yang agak baik dicapai. Daripada pemerhatian didapati, dengan meningkatnya
“superficial gas velocity”, “gas holdup” juga meningkat dan “velocity magnitude”
akan berkurangan apabila menghampiri dinding silinder. Daripada keputusan yang
diperolehi, didapati bahawa pembahagi gas rekabentuk “c” dengan diameter lubang
dan nisbah kawasan terbuka paling besar selalunya memberikan nilai “gas holdup”,
“contact surface area”, “air volume fraction”, dan “velocity magnitude” yang
tinggi jika dibandingkan dengan design yang lain. Saiz lubang pembahagi gas akan
menentukan saiz gelembung udara yang terhasil. Gelembung udara yang bersaiz
besar mempunyai daya angkatan dan halaju kenaikan yang lebih jika dibandingkan
dengan gelembung udara yang lebih kecil.
vii
CONTENTS
TITLE
DECLARATION
DEDICATION
ACKNOWLEDGEMENT
ABSTRACT
ABSTRAK
CONTENTS
LIST OF TABLES
LIST OF FIGURES
LIST OF SYMBOLS AND ABBREVIATIONS
LIST OF APPENDICES
i
ii
iii
iv
v
vi
vii
x
xi
xv
xvi
CHAPTER 1 INTRODUCTION
1.1 Research background
1.2 Problem statement
1.3 Objective
1.4 Scope of study
1.5 Significant of study
1
1
3
4
4
5
CHAPTER 2 LITERATURE REVIEW
2.1 Introduction
2.2 Application of bubble column
2.3 Hydrodynamic and operation of bubble
column
2.3.1 Gas holdup
2.3.1.1 Effect of superficial
gas velocity to gas
holdup
2.3.2 Axial liquid velocity
2.3.3 Turbulent kinetic energy
6
6
7
8
8
8
11
12
viii
2.4 Flow pattern
2.5 Hydrodynamic regime
2.6 The bubble column geometry and
parameter
2.7 Sparger design
2.8.1 Effect of sparger geometry on the
distribution of gas holdup
2.8.2 Effect of sparger type on gas holdup
2.8 CFD analysis
13
14
17
18
20
23
24
CHAPTER 3 METHODOLOGY
3.1 Flow chart
3.2 Bubble column reactor modeling process
3.2.1 Bubble column cylinder
3.2.2 Bubble column perforated plate
sparger
3.3 Properties material used
3.4 Parameter used
3.5 Geometry
3.5.1 Boundary condition
3.6 Meshing
3.7 Solution setup
3.8.1 Boundary conditions
3.8 Solution method
25
26
27
28
29
30
31
31
31
32
35
35
37
CHAPTER 4 RESULT AND DISCUSSION
4.1 Validations
4.2 Gas Holdup
4.2.1 Effect of sparger holes diameter
on gas holdup
4.2.2 Effect of superficial velocity
toward gas holdup
4.3 Contact Surface Area
4.4 Design “c” as the selected sparger design
based on the previous result
39
39
42
42
46
48
50
ix
4.4.1 Pressure drop
4.4.2 Volume fraction (air)
4.4.3 Velocity magnitude
50
51
53
CHAPTER 5 CONCLUSION AND RECOMMENDATION
5.1 Conclusion
5.2 Recommendation
56
56
57
REFERENCES 58
x
LIST OF TABLES
2.1
2.2
2.3
3.1
3.2
3.3
3.4
3.5
3.6
3.7
Some of the typical application of bubble
column
The bubble column geometry and parameter
The bubble column geometry and parameter
Bubble Column Cylinder geometry data
Bubble Column Perforated Plate Sparger
geometry data
Properties of air and water
Parameter used in the simulation analysis
The number of nodes and elements after
meshing
Meshing Parameter
Detailed of the boundary conditions parameter
setup
7
17
18
28
29
30
31
33
34
36
xi
LIST OF FIGURES
2.1
2.2
2.3
2.4
2.5
2.6
2.7
2.8
2.9
Effect of superficial gas velocity on gas holdup
Overall gas holdup (εg) versus superficial gas
velocity (Usg)
Gas Holdup versus air velocity for constant
liquid velocity
Comparison between the simulated and
experimental profiles of axial liquid velocity at
different axial positions in a 150mm i.d. bubble
column with a single point sparger at VG = 20
mm/s: (a) H/D = 0.5; (b) H/D = 2.5; (c) H/D =
3.4; and (d) H/D = 4.6
Comparison between the simulated and
experimental profiles of turbulent kinetic energy
at different axial positions in a 150mm i.d.
bubble column with multi-point sparger at VG =
20 mm/s: (a) H/D = 0.2; (b) H/D = 1.4; (c) H/D
= 2.6; (d) H/D = 3.9; (e) H/D = 5.0; and (f) H/D
= 6.2
Liquid circulation patterns in bubble columns, a)
large-scale overall circulation; b) donut-model
of Joshi and Sharma (1979); c) circulation cells
The flow regime observed in gas-liquid bubble
column reactors: bubbly flow or homogeneous
regime (left); heterogeneous regime (middle)
and slug flow regime (right)
Flow regime map for bubble columns
Definition sketch of flow regimes in bubble
column. Full line: Ho-homogeneous regime; Tr-
9
10
10
11
13
14
15
16
16
xii
2.10
2.11
2.12
2.13
2.14
2.15
3.1
3.2
3.3
3.4
3.5
3.6
3.7
3.8
3.9
4.1
4.2
transition regime; He-heterogeneous regime; qs-
stable plate operation regime, beginning of
homogeneous regime; qc-critical point, end of
homogeneous
Gas distributor plates: (a) A=0.57%, (b)
A=0.99%, and (c) A=2.14%
Gas holdup and flow regime transition using
different aeration plates in an air-water system
Experimental Setup
Effect of sparger geometry on the cross
sectional image of gas hold-up
Two sparger type are used in the experimental
setup
Effect of sparger types on gas hold up
CFD modeling overview
Flow Chart of Methodology
Bubble column cylinder
Perforated plate sparger with 3 different holes
diameter (a) Ø = 1 mm, (b) Ø = 2 mm and (c) Ø
= 3 mm
The bubble column boundary condition
The illustration of bubble column mesh
The illustrated of three design of sparger after
mesh, (a) Ø holes = 1 mm, (b) Øholes = 2 mm and
(c) Øholes = 3 mm
The different cell zones of air (red) and water
(blue) after patch process
Plot of scaled residual progress in calculate the
solution
Simulation result from the study about gas
holdup versus gas velocity
Simulation result from the study about velocity
magnitude versus cross sectional of the bubble
19
19
21
22
23
24
26
27
29
30
32
33
34
38
38
40
40
xiii
4.3
4.4
4.5
4.6
4.7
4.8
4.9
4.10
4.11
4.12
4.13
4.14
4.15
4.16
column diameter
Simulation result from previous study about gas
holdup versus air velocity
Simulation result from previous study about
velocity magnitude versus cross sectional of the
bubble column diameter
Gas holdup transition using different open area
ratio for 1 m/s superficial gas velocity
Gas holdup transition using different open area
ratio for 2.5 m/s superficial gas velocity
Gas holdup transition using different open area
ratio for 5 m/s velocity
Gas holdup transition using different open area
ratio for 7 m/s velocity
Gas holdup transition using different open area
ratio for 9 m/s velocity
Percentage of gas holdup using different
superficial gas velocity for design “a”
Percentage of gas holdup using different
superficial gas velocity for design “b”
Percentage of gas holdup using different
superficial gas velocity for design “c”
Effect of gas distributor holes size on contact
surface area by using superficial gas velocity 1
m/s
Pressure drop in the bubble column for gas
distributor holes 3 mm diameter at superficial
gas velocity 9 m/s
Illustration of air volume fraction along 0.3 m of
bubble column height at superficial gas velocity
9 m/s
Contour of air volume fraction for gas
distributor (3 mm holes diameter) at superficial
41
41
43
44
45
45
46
47
47
48
50
51
52
53
xiv
4.17
4.18
4.19
gas velocity of 9 m/s
Velocity magnitude for gas distributor ( 3 mm
holes diameter) at superficial gas velocity 9 m/s
Contour of velocity magnitude for gas
distributor ( 3 mm holes diameter) at superficial
gas velocity 9 m/s
Velocity vectors by velocity magnitude for gas
distributor ( 3mm holes diameter) at superficial
gas velocity 9 m/s
54
55
55
xv
LIST OF SYMBOLS AND ABBREVIATIONS
Ø
3D
A
CFD
ERT
H/D
HFA
k-ε
LDA
PIV
Usg
Ut
V
VG
VOF
–
–
–
–
–
–
–
–
–
–
–
–
–
–
–
–
Diameter
Three Dimensional
Open Area Ratio
Computational Fluid Dynamics
Gas Hold up
Electrical Resistance Tomography
Height/Diameter k-epsilon
Hot Film Anemometer second
K-epsilon
Laser Doppler Anemometer
Particle Image Velocimeter
Superficial Gas Velocity
Transition Velocity
Velocity
Gas Velocity
Volume of Fluid
xvi
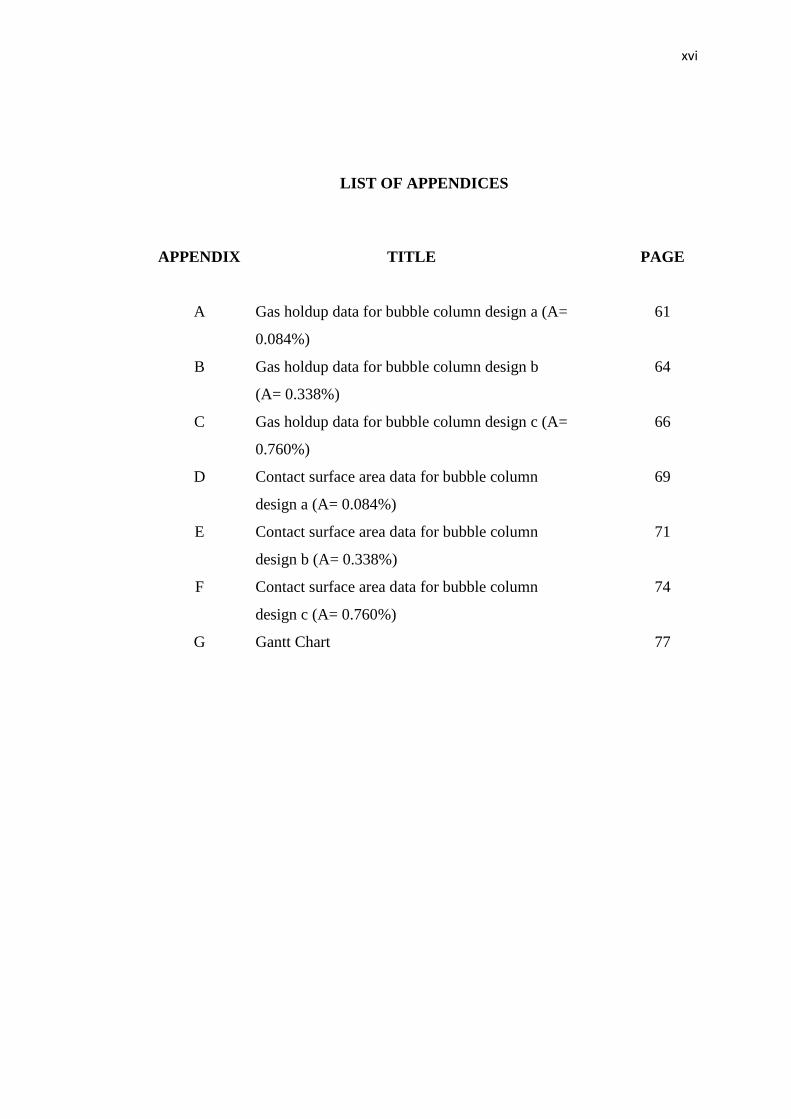
LIST OF APPENDICES
APPENDIX
A
B
C
D
E
F
G
TITLE
Gas holdup data for bubble column design a (A=
0.084%)
Gas holdup data for bubble column design b
(A= 0.338%)
Gas holdup data for bubble column design c (A=
0.760%)
Contact surface area data for bubble column
design a (A= 0.084%)
Contact surface area data for bubble column
design b (A= 0.338%)
Contact surface area data for bubble column
design c (A= 0.760%)
Gantt Chart
PAGE
61
64
66
69
71
74
77
1
CHAPTER 1
INTRODUCTION
Bubble column are important devices as gas liquid contactor in multiple industry
processes. In the bubble columns, gases are representing in the form of bubbles, and
come in contact with liquid. The purpose may be simply to mix the liquid phase and
finally to produce fuel. A bubble column reactor is basically a cylindrical vessel with
a gas distributor at the bottom. According to Kantarci et al., (2005) the gas is sparged
in the form of bubbles into either a liquid phase or a liquid–solid suspension.
Bubble column reactors owe their wide application area to a number of
advantages they provide both in design and operation as compared to other reactors
(Shahimie, 2010). First, they have excellent heat and mass transfer characteristics,
meaning high heat and mass transfer coefficients (Kantarci et al., 2005). Little
maintenance and low operating cost because of the less parts moving and
uncomplicated design. The durability of the component or other packing material is
high.
1.1 Research Background
Understanding on the hydrodynamics of bubble column are very important
part to indicates the operation of bubble column because it is determined by many
variables such as high of the liquid inside the column, superficial gas velocity, gas
sparger design and the diameter of bubble column. However, mostly the parameters
that affect the performance of bubble column are the gas hold-up distribution, gas-
liquid mass and heat transfer coefficients, while bubble rise velocities and bubble
size distributions often will affect the mixing criteria.
2
Bubble column reactors are widely used in chemical, petrochemical and
biochemical processes (Zhang et al., 2006 and Kantarci et al., 2005). It is also widely
used for conducting gas–liquid reactions in a variety of practical applications in
industry such as absorption, fermentations, bio-reactions, coal liquefaction and waste
water treatment (Mouza et al., 2004).
Gas-liquid bubble columns can be operated in a number of different regimes.
The flow regime encountered in the column depends on one hand on the superficial
gas velocity and the physical properties of the phases, and on the other hand, on the
aspect ratio of the column (Delnoij et al., 1997). Broadly, the regimes of operation in
a bubble column are homogeneous, heterogeneous and the transition regime.
Bubble column reactor have a different behavior in homogeneous and
heterogeneous regime, thus, the dependencies of rates of mass, heat and momentum
transfer on the design and operating parameters (such as reactor geometry, gas and
liquid flow rates and properties of the contacting phases) are also very different
(Miguel et al., 2005).
Flow pattern in a bubble column reactor is a result of multitude of factors
arising out of the motion of individual phases associated with pertinent viscous and
the turbulent effects, which render it fully three dimensional at various levels of
complexities in different directions. At low gas velocities, the rise velocity of
bubbles and hence the downward flow of liquid is not very dominant to generate an
appreciable flow pattern in the column (Kulkarni et al., 2007).
During the last 10 years, vigorous attempts have been made for experimental
measurements of flow pattern using some of the advanced flow visualization
techniques viz. laser Doppler anemometer (LDA), particle image velocimeter (PIV),
hot film anemometer (HFA) and tomography.
The main focus of dissertation is to understand the hydrodynamic behavior of
a concurrent gas-liquid up-flow bubble column with a different sparger design by
using CFD analysis. One of the main reasons behind focusing on the hydrodynamics
is its strong influence on the design and hence on the performance of a bubble
column (Kulkarni et al., 2007). The air and water will be used as the function of gas
and liquid in the bubble column reactor. The gas holdup, contact surface area,
pressure drop, air volume fraction and velocity profile will be observers to
understand the hydrodynamic behavior in the bubble column. There are currently
strong efforts in industry to enable the use of computational fluid dynamics (CFD)
3
for the design, scale-up, and optimum operation of bubble column reactors. The
simulation of bubbly flows is still not fully mastered mainly due to its complexity
and the manifold interacting phenomena. The bubble column hydrodynamics are
dominated by the movement of the bubble plume and the 3-D vortical flow structures
in the liquid phase that continuously change sizes and positions.
It is generally accepted that only dynamic 3D flow models are able to
simulate the essential features encountered in bubble columns to a reasonable extent.
The results of CFD analysis are relevant engineering data used in conceptual studies
of new designs, detailed product development, troubleshooting, and redesign and
therefore CFD is gaining importance in general process applications (Anil et al.,
2007).
The simulation method (CFD) will give more advantages compare to the
others method. It is a very compelling, non-intrusive, virtual modeling technique
with powerful visualization capabilities and can represent data in a various forms
with chippers cost and time. Furthermore, CFD can predict a gas hold-up with
different superficial gas velocity and a time-averaged flow structure. All the
modelling in this study is done with the Eulerian-Eulerian approach, as this is
considered as being the most suitable method for modelling the dynamic flow to
understand the hydrodynamic behavior in a bubble column reactor.
1.2 Problem Statement
The hydrodynamic behaviour in the bubble column reactor is the most important part
to ensure that the mixing capability of gas and liquid. Many factors are affected to
the capability of these mixing. The gas volume fraction, gas hold-up and time-
average flow structure, pressure drop is the some of them. These factors are
depending on the parameter that will be used in the study such as superficial gas
velocity and distributor design. The main problem is to determining the optimization
of three design sparger by observation of hydrodynamic behaviour in the bubble
column reactor with considering the factors.
4
1.3 Objective
1. To understand the hydrodynamic behaviour of a concurrent gas-liquid up-
flow bubble column by CFD analysis.
2. To predict a gas hold-up and magnitude velocity with different sparger
distributor geometry and superficial gas velocity.
3. To predict a surface contact area, pressure drop and volume fraction in order
to describe bubble characteristic and dynamic behaviours.
1.4 Scope of the Study
These studies are conducted with the limitations below to ensure that, it’s did not
exceed the required purpose:-
1. The system used in the study is a cylindrical column of 15cm diameter and
1.5 m height.
2. A single gas distributors with different geometry are employed: a perforated
plate (19 holes of ϕ1 mm, opening area: 0.084%), (19 holes of ϕ2 mm,
opening area: 0.338%) and (19 holes of ϕ3 mm, opening area: 0.760%).
3. The plate sparger aerates the whole cross-section of the bubble column and
three different gas distributors has a diameter of 1 mm, 2 mm and 3 mm and
five different superficial gas velocities 1 m/s, 2.5 m/s, 5 m/s, 7 m/s and 9 m/s
were use to produces fully turbulent flow in the sparger zone.
4. The eulerian-eulerian approach will be used for modeling the volume of fluid
multiphase model flow.
5. The standard k-ε mixture turbulence, implicit model and transient time will
be used to account the effect of turbulence.
6. Ansys Fluent software package will be used to simulate the system for
various hydrodynamics parameters and results will be comparing to the
previous simulation result as the validation process.
5
1.5 Significant of the Study
The significant of the study is with three different gas distributors design, time step,
and various superficial gas velocities the variety of gas bubble hold up in a bubble
column reactor can be obtained. The gas hold-up and the contact surface area
predicted describe the hydrodynamic behaviour in the bubble column. Furthermore,
the optimum design of sparger gas distributors can be obtained by the higher gas
holdup and contact surface area produces in the result represented. After that, the
optimum gas distributor was selected to present more parameter of hydrodynamic
behaviour.
6
CHAPTER 2
LITERATURE REVIEW
The current development on CFD modelling of hydrodynamics bubble column is
presented in this chapter. The CFD simulation on bubble column emphasis on
parameters such as superficial gas velocity, gas hold-up profile contact surface area
and air volume fraction that probably affects the hydrodynamic behavior of a
concurrent gas-liquid up-flow bubble column is the main interest in this study.
Besides that, a brief summary about the experimental measurement technique to
predict the gas hold-up and the time-average flow structure was also discussed.
2.1 Introduction
A bubble column reactor is an apparatus that widely used in industry application for gas-
liquid reactions. This apparatus are presented in most simple form basically in vertically
square and cylindrical. A simple construction and lack of mechanical part are synonym
with the reactor characteristic. Because of the reasonable cost and can be built in large
size, a bubble column can be category as an adaptable reactor compare to the ability of
the operationally.
In their operation, the gas normally are aerated through the sparger distributor
locate at the bottom of column reactor. With the certain velocity, it wills dispersed by the
distributor into bubble to the continuous liquid phase to produce the dynamic turbulent
stream that cause the optimum gas exchange. Normally, the liquid flow rate is very low
when it’s passing through a bubble column. Otherwise, the gas hold up flow may vary
widely according to the specified conversion level.
7
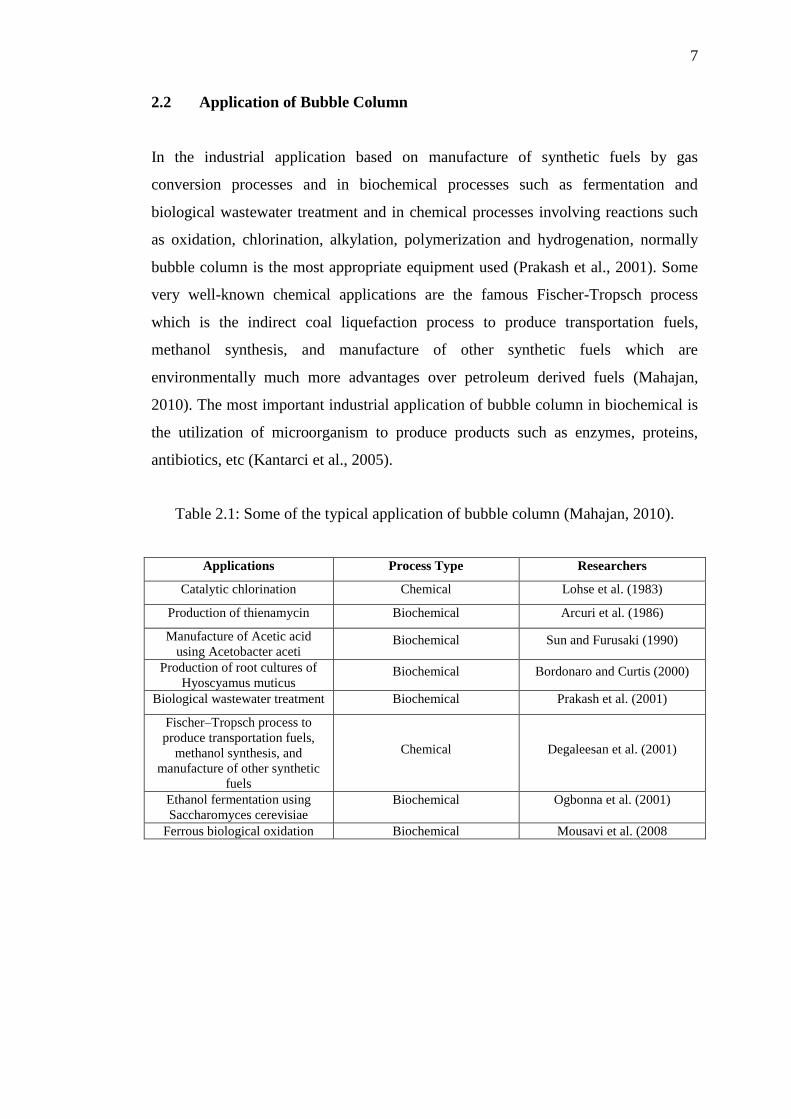
2.2 Application of Bubble Column
In the industrial application based on manufacture of synthetic fuels by gas
conversion processes and in biochemical processes such as fermentation and
biological wastewater treatment and in chemical processes involving reactions such
as oxidation, chlorination, alkylation, polymerization and hydrogenation, normally
bubble column is the most appropriate equipment used (Prakash et al., 2001). Some
very well-known chemical applications are the famous Fischer-Tropsch process
which is the indirect coal liquefaction process to produce transportation fuels,
methanol synthesis, and manufacture of other synthetic fuels which are
environmentally much more advantages over petroleum derived fuels (Mahajan,
2010). The most important industrial application of bubble column in biochemical is
the utilization of microorganism to produce products such as enzymes, proteins,
antibiotics, etc (Kantarci et al., 2005).
Table 2.1: Some of the typical application of bubble column (Mahajan, 2010).
Applications Process Type Researchers
Catalytic chlorination Chemical Lohse et al. (1983)
Production of thienamycin Biochemical Arcuri et al. (1986)
Manufacture of Acetic acid
using Acetobacter aceti Biochemical Sun and Furusaki (1990)
Production of root cultures of
Hyoscyamus muticus Biochemical Bordonaro and Curtis (2000)
Biological wastewater treatment Biochemical Prakash et al. (2001)
Fischer–Tropsch process to
produce transportation fuels,
methanol synthesis, and
manufacture of other synthetic
fuels
Chemical Degaleesan et al. (2001)
Ethanol fermentation using
Saccharomyces cerevisiae
Biochemical Ogbonna et al. (2001)
Ferrous biological oxidation Biochemical Mousavi et al. (2008
8
2.3 Hydrodynamics and Operation of Bubble Column
2.3.1 Gas Hold-Up (Ɛg)
Gas hold-up plays an important role in the hydrodynamic parameters such as design,
development, scale-up and troubleshooting of multiphase system. Gas hold-up is
dimensionless key parameter for phenomena purposes of bubble column systems
(Nader, 2008). Usually, it is known as the volume fraction of gas phase occupied by
the gas bubbles (Shahimie, 2010). All studies examine gas holdup because it plays an
important role in design and analysis of bubble columns. In the bubble column
reactor, overall gas hold-up is used to characterize the hydrodynamics behaviour. It
depends mainly on the gas velocity, physical properties of the liquid and type of gas
sparger (Pirdashti & Kompany, 2009).
The variation in gas hold-up is the important thing in the gas-liquid phase,
one of them is gas hold-up profile gives rise to pressure variation and thus liquid
recirculation (Nader, 2008). Liquid recirculation is an important on mixing and heat
and mass transfer predictions of radial gas hold up, it’s would lead to better
understanding of this phenomenon to scale-up the bubble column (Nader, 2008).
2.3.1.1 Effect of Superficial Gas Velocity to Gas Hold-up
Superficial gas velocity mainly affected the gas holdup in the bubble column.
Superficial gas velocity is the average velocity of the gas that is sparged into the
column which is simply expressed as the volumetric flow rate divided by the cross-
sectional area of the column (Kantarci et al., 2005). According to Nader (2008), the
slurry bed expands and holdup of each phase will be formed after the gas was
injected into the slurry bubble column reactor. He found the different velocity and
recirculation patterns of each phase presents. Superficial velocity is proportional to
the gas holdup in the bubbly flow regime. With increasing the superficial gas
velocity, the gas holdup also increase for both bubble columns and slurry bubble
columns. However, the effect of superficial velocity on gas holdup is less obvious in
the heterogeneous regime. As the superficial velocity increases, the overall holdup
increases due to the large bubble holdup increase (Kantarci et al., 2005).
9
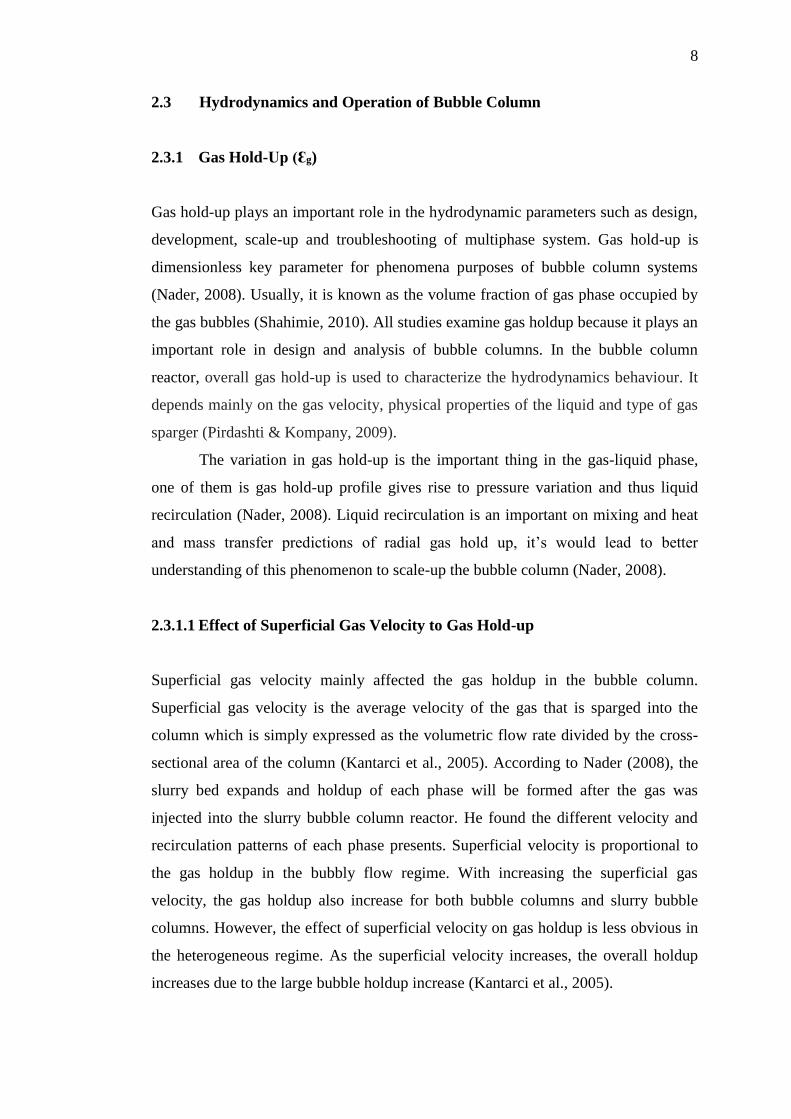
According to Moshtari et al., (2009), the homogeneous and regime occurs at
low gas flow, while the heterogeneous regime at high gas flows. Based on their
experimental result, the bubble size is small and uniform and bubble travel upwards
in a helical path without any major collision or coalescence at superficial velocity. At
9 cm/s superficial gas velocity, all the bubble will large. The transition from
homogeneous to heterogeneous regime is observed at a superficial gas velocity
between 0.9 to 0.11 m/s (Moshtari et al., 2009). The measurement result of gas hold
up at different superficial gas velocity, with differential pressure method is shown in
the figure 2.1.
Figure 2.1: Effect of superficial gas velocity on gas holdup in air-water system
(Moshtari et al., 2009)
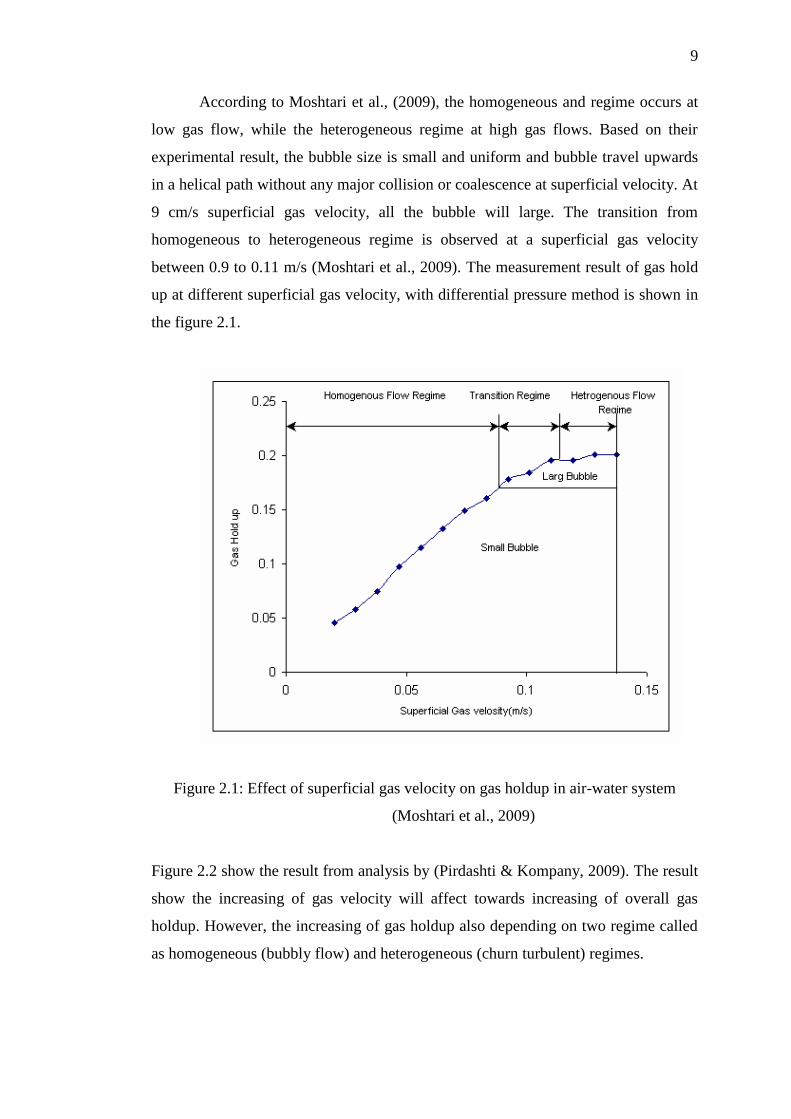
Figure 2.2 show the result from analysis by (Pirdashti & Kompany, 2009). The result
show the increasing of gas velocity will affect towards increasing of overall gas
holdup. However, the increasing of gas holdup also depending on two regime called
as homogeneous (bubbly flow) and heterogeneous (churn turbulent) regimes.
10
Figure 2.2: Overall gas holdup (εg) versus superficial gas velocity (Usg) (Pirdashti &
Kompany, 2009).
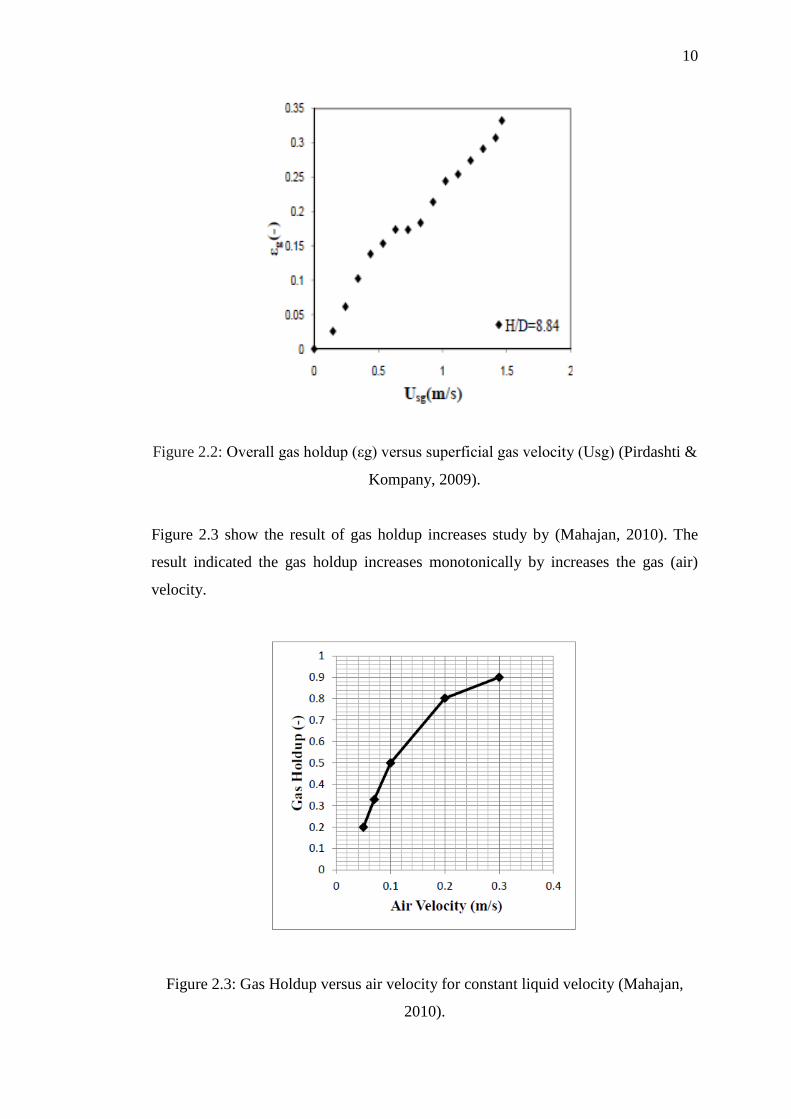
Figure 2.3 show the result of gas holdup increases study by (Mahajan, 2010). The
result indicated the gas holdup increases monotonically by increases the gas (air)
velocity.
Figure 2.3: Gas Holdup versus air velocity for constant liquid velocity (Mahajan,
2010).
11
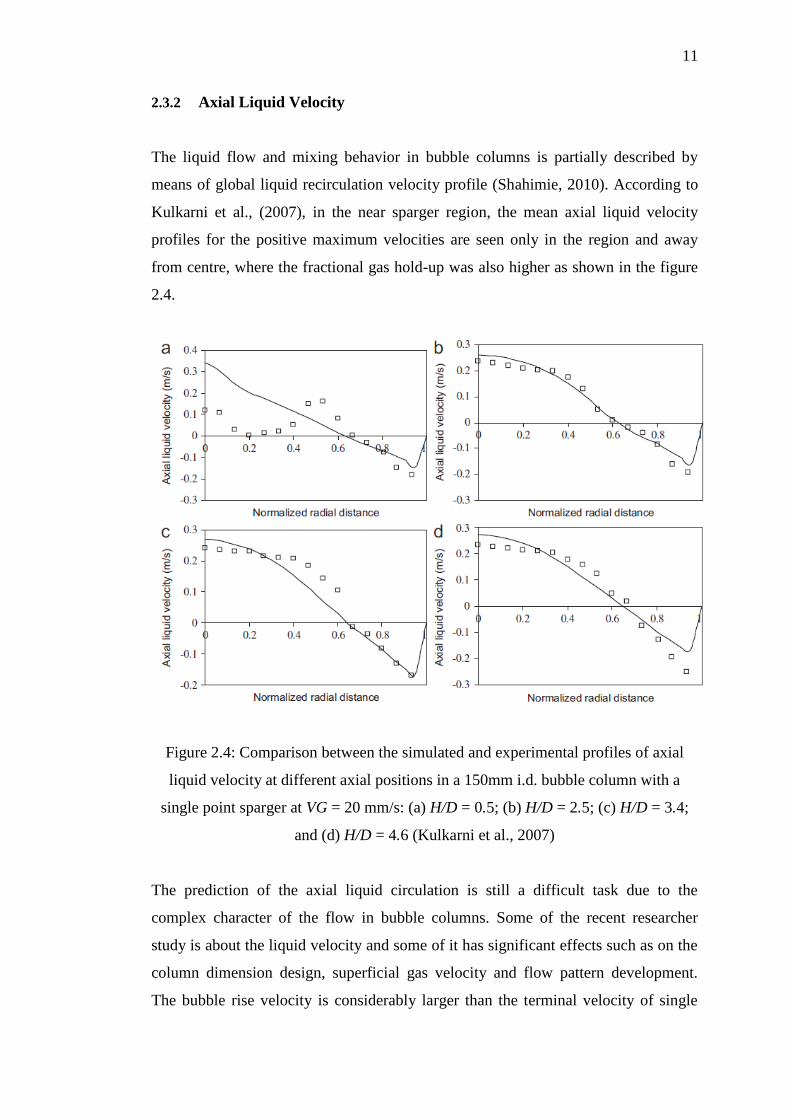
2.3.2 Axial Liquid Velocity
The liquid flow and mixing behavior in bubble columns is partially described by
means of global liquid recirculation velocity profile (Shahimie, 2010). According to
Kulkarni et al., (2007), in the near sparger region, the mean axial liquid velocity
profiles for the positive maximum velocities are seen only in the region and away
from centre, where the fractional gas hold-up was also higher as shown in the figure
2.4.
Figure 2.4: Comparison between the simulated and experimental profiles of axial
liquid velocity at different axial positions in a 150mm i.d. bubble column with a
single point sparger at VG = 20 mm/s: (a) H/D = 0.5; (b) H/D = 2.5; (c) H/D = 3.4;
and (d) H/D = 4.6 (Kulkarni et al., 2007)
The prediction of the axial liquid circulation is still a difficult task due to the
complex character of the flow in bubble columns. Some of the recent researcher
study is about the liquid velocity and some of it has significant effects such as on the
column dimension design, superficial gas velocity and flow pattern development.
The bubble rise velocity is considerably larger than the terminal velocity of single
12
bubbles obtained by measurement liquid and bubble velocities in a bubble column
(Shahimie, 2010). For the example, with increasing the superficial gas velocity, the
axial liquid velocity becomes higher, and the correlation predicts the point of zero
velocity well. To prediction the axial liquid velocity profile over arrange of
conditions, the simulation technique can be used which help the process engineers
should assess convective liquid mixing in bubble column rapidly.
2.3.3 Turbulent Kinetic Energy
The energy exchange in the bubble column can occur from gas to liquid or vice
versa. Understanding the energy transfer from phase to phase as well as internal
energy within the phase is very important because the liquid circulation in the
column depends on the energy balance (Shahimie, 2010). The potential energy is
maximum when the bubble reaches the top of the liquid. The kinetic energy remains
the same when the bubble rises at its constant slip velocity. The energy associated
with a bubble decreases and the same amount is dissipated in friction (drag/inertia)
between bubble and liquid during the rising process (Shahimie, 2010). Velocity rise
and drag force increase will causing higher amount of energy released to the liquid at
each stage as a result of increase in bubble volume. Turbulent kinetic energy can be
estimated from the velocity–time series data with measurement the average of eddy
energy values (Kulkarni et al., 2007).
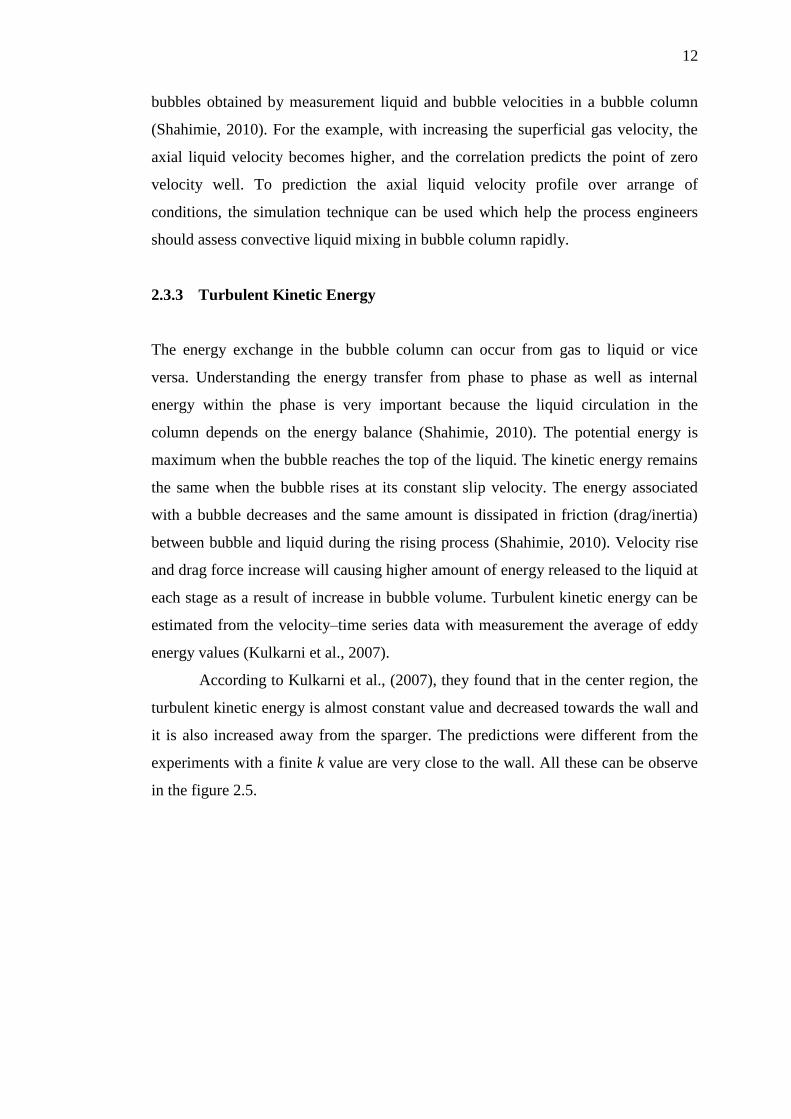
According to Kulkarni et al., (2007), they found that in the center region, the
turbulent kinetic energy is almost constant value and decreased towards the wall and
it is also increased away from the sparger. The predictions were different from the
experiments with a finite k value are very close to the wall. All these can be observe
in the figure 2.5.
13
Figure 2.5: Comparison between the simulated and experimental profiles of turbulent
kinetic energy at different axial positions in a 150mm i.d. bubble column with multi-
point sparger at VG = 20 mm/s: (a) H/D = 0.2; (b) H/D = 1.4; (c) H/D = 2.6; (d) H/D
= 3.9; (e) H/D = 5.0; and (f) H/D = 6.2 (Kulkarni et al., 2007).
2.4 Flow Pattern
The liquid flow structure in the bubble column are varies in their pattern. It is
depending on the hydrodynamic regime, gas hold-up, bubble column geometry and
etc. In the bubble column operation, gases with certain velocity are dispersed by
sparger distributor and carry liquid upwards with them in their wake and, at higher
gas loading. Moreover, the liquid will flow down again, to produce liquid circulation
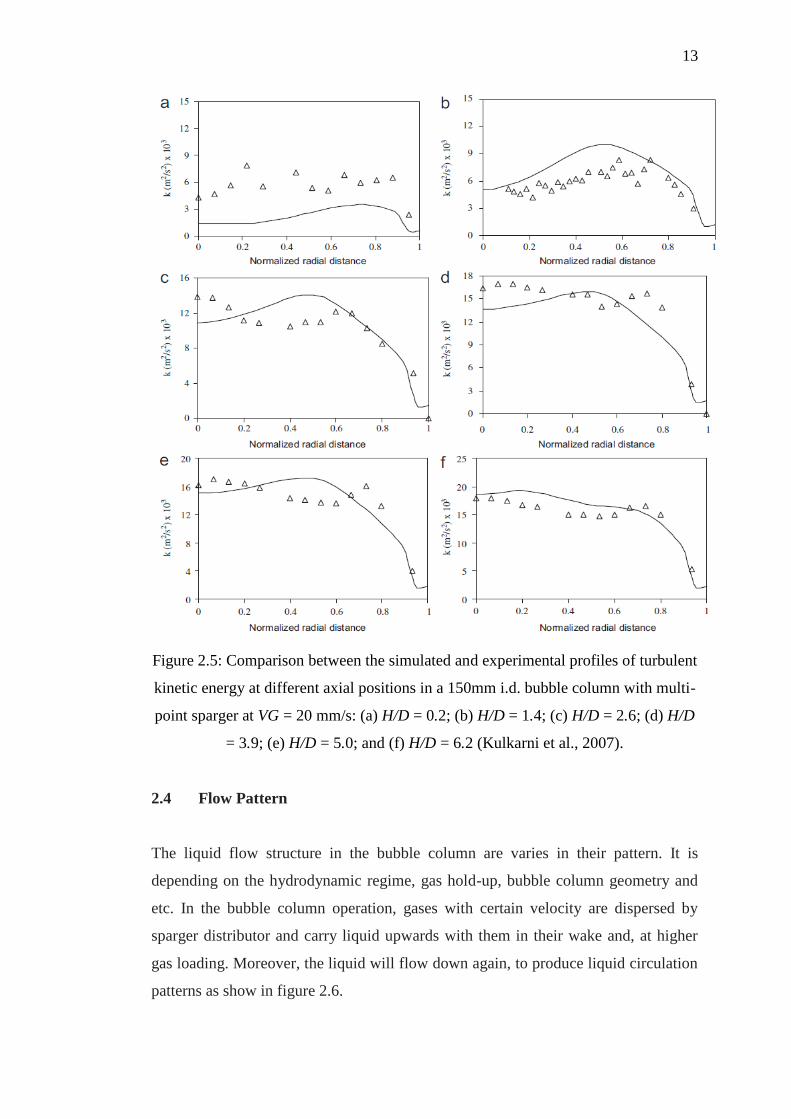
patterns as show in figure 2.6.
14
Figure 2.6: Liquid circulation patterns in bubble columns, a) large-scale overall
circulation; b) donut-model of Joshi and Sharma (1979); c) circulation cells
according to Zehner (1986).
2.5 Hydrodynamics Regime
Basically, there have three types of flow regimes in the bubble column which are the
homogeneous (bubbly flow) regime; the heterogeneous (churn-turbulent) regime and
slug flow regime (Kantarci et al., 2005). These regimes largely depend on the
superficial velocity, physicochemical properties of the gas–liquid system, sparger
design (mainly the hole diameter), column diameter and also the column inclination
(Kulkarni et al., 2007). The homogeneous regime is characterized by a narrow
bubble size distribution and radially uniform void fraction distribution. The bubbles
interaction is minor and liquid recirculation takes place in between the bubbles. If the
gas flow rate is increased, the void fraction increases and the flow become unstable.
Instead, the bubble size distribution widens and the radial void fraction distribution is
not homogeneous anymore. The void fraction near the center of the bubble column is
larger than the average void fraction, and large vortical structures appear with a size
comparable to the column diameter. These large scale structures contribute to the
large scale circulation in the bubble column with up flow in the center and down
flow near the wall.
When a liquid is sparged with gas, the bed of liquid begins to expand
“homogeneously” and the bed height increases almost linearly with the superficial
15
gas velocity. This regime of operation in a bubble column is called the homogeneous
bubbly flow regime. The regime of operating for superficial gas velocity exceeding
Utransition is commonly referred to as heterogeneous or churn turbulent regime
(Moshtari et al., 2009). Homogeneous flow regime is obtained at low superficial gas
velocities, approximately less than 5 cm/s in semi batch columns. This flow regime is
characterized by bubbles of relatively uniform small sizes and rise velocities
(Kantarci et al., 2005). The heterogeneous (churn-turbulent) regime exists for even
higher gas throughput, when coalescence and breakup reach equilibrium. It is marked
by a wide bubble size distribution. The bubble diameter can vary an order of
magnitude. The degree of mixing in the flow is very strong (Harteveld, 2005). A slug
flow regime has been only observed in small diameter laboratory columns at high gas
flow rates. A slug flow means the formation of bubble slugs when larger bubbles are
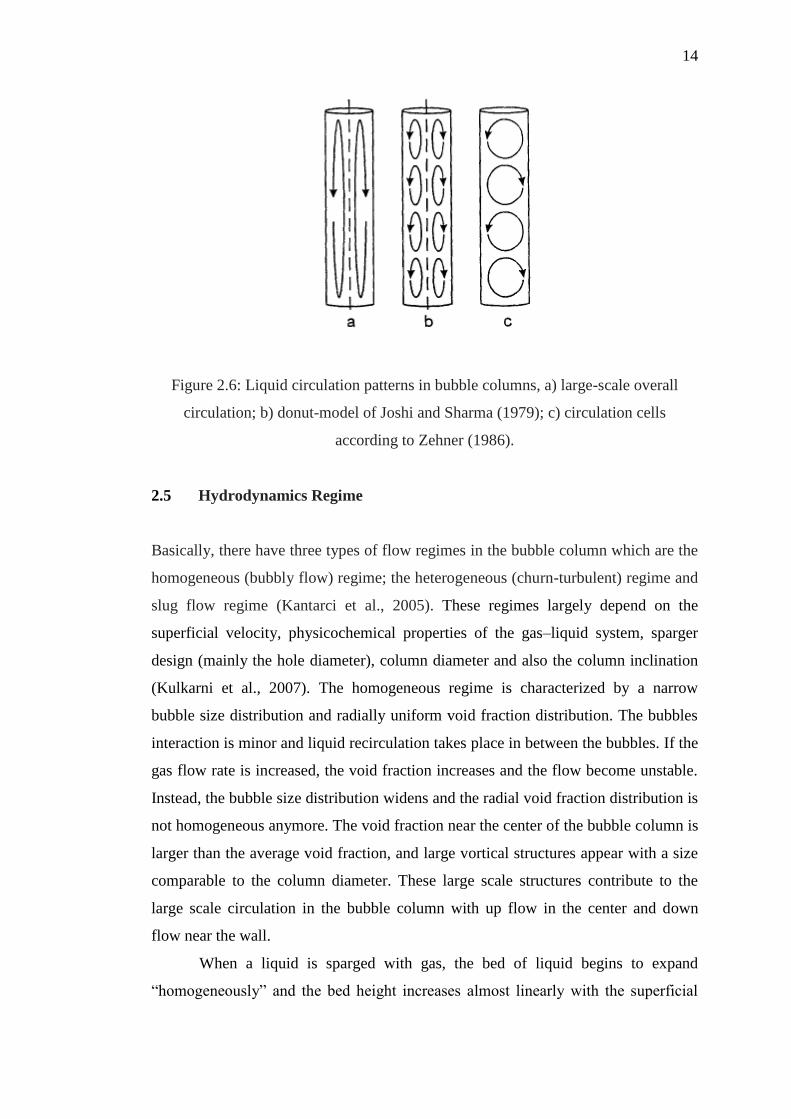
stabilized by the column wall (Kantarci et al., 2005). Figure 2.7 shows the three types
of flow regime that has been observe by (Mahajan, 2010).
Figure 2.7: The flow regime observed in gas-liquid bubble column reactors: bubbly flow
or homogeneous regime (left); heterogeneous regime (middle) and slug flow regime
(right) (Mahajan, 2010).
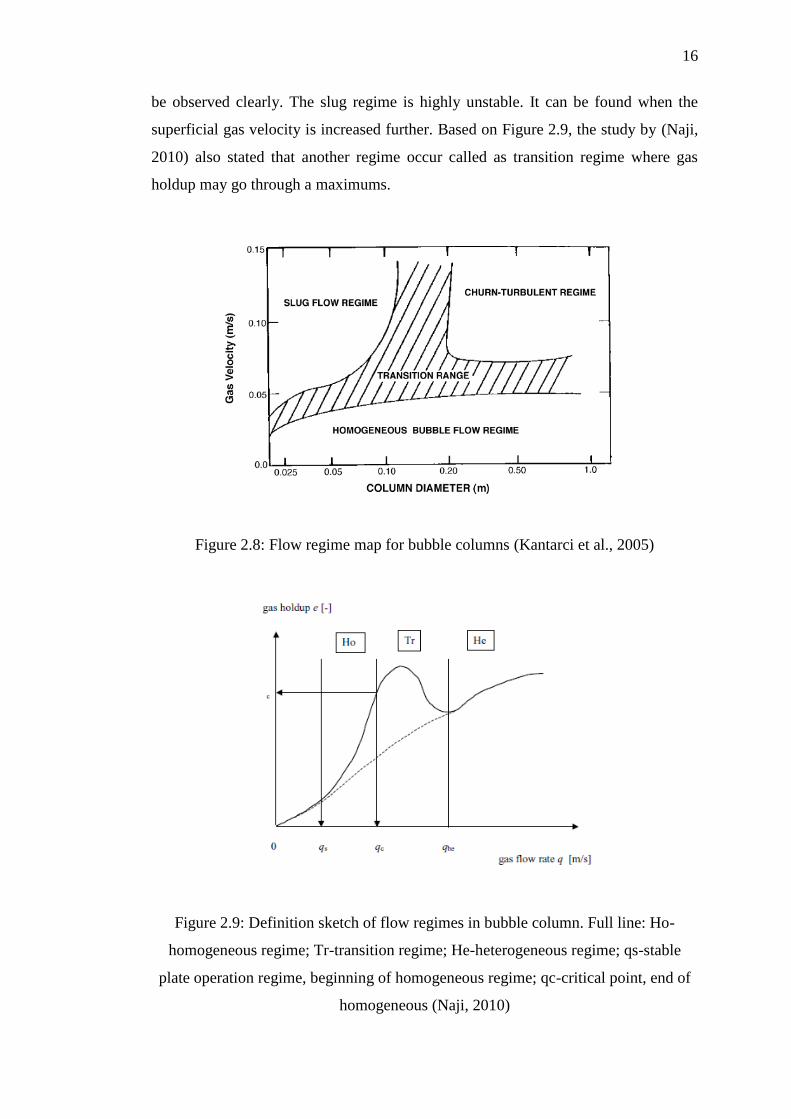
According to the Figure 2.8, the homogeneous flow regime is obtained at low
superficial gas velocities, approximately less than 0.05 m/s in semi batch columns.
The churn-turbulent regime, also called the heterogeneous regime is maintained at
higher superficial gas velocities (greater than 0.05 m/s in batch columns). At the
small diameter (lower than 0.2 m) and at high gas flow rate, a slug flow regime can
16
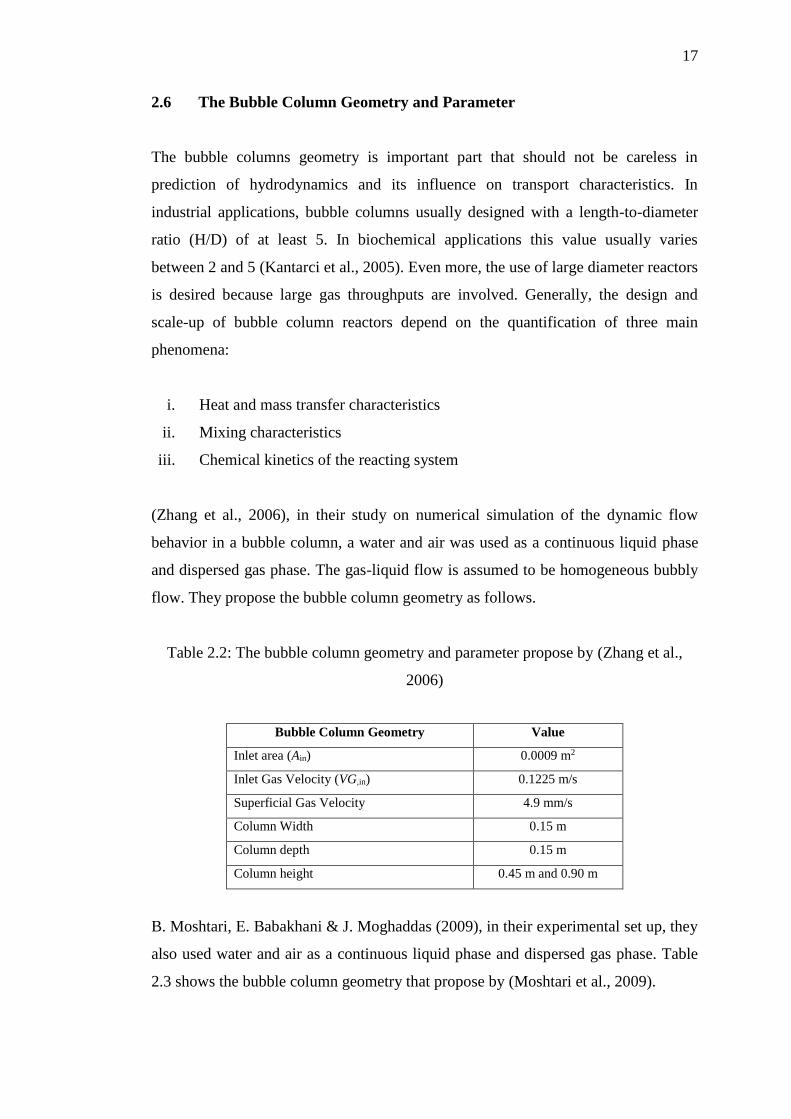
be observed clearly. The slug regime is highly unstable. It can be found when the
superficial gas velocity is increased further. Based on Figure 2.9, the study by (Naji,
2010) also stated that another regime occur called as transition regime where gas
holdup may go through a maximums.
Figure 2.8: Flow regime map for bubble columns (Kantarci et al., 2005)
Figure 2.9: Definition sketch of flow regimes in bubble column. Full line: Ho-
homogeneous regime; Tr-transition regime; He-heterogeneous regime; qs-stable
plate operation regime, beginning of homogeneous regime; qc-critical point, end of
homogeneous (Naji, 2010)
17
2.6 The Bubble Column Geometry and Parameter
The bubble columns geometry is important part that should not be careless in
prediction of hydrodynamics and its influence on transport characteristics. In
industrial applications, bubble columns usually designed with a length-to-diameter
ratio (H/D) of at least 5. In biochemical applications this value usually varies
between 2 and 5 (Kantarci et al., 2005). Even more, the use of large diameter reactors
is desired because large gas throughputs are involved. Generally, the design and
scale-up of bubble column reactors depend on the quantification of three main
phenomena:
i. Heat and mass transfer characteristics
ii. Mixing characteristics
iii. Chemical kinetics of the reacting system
(Zhang et al., 2006), in their study on numerical simulation of the dynamic flow
behavior in a bubble column, a water and air was used as a continuous liquid phase
and dispersed gas phase. The gas-liquid flow is assumed to be homogeneous bubbly
flow. They propose the bubble column geometry as follows.
Table 2.2: The bubble column geometry and parameter propose by (Zhang et al.,
2006)
Bubble Column Geometry Value
Inlet area (Ain) 0.0009 m2
Inlet Gas Velocity (VG,in) 0.1225 m/s
Superficial Gas Velocity 4.9 mm/s
Column Width 0.15 m
Column depth 0.15 m
Column height 0.45 m and 0.90 m
B. Moshtari, E. Babakhani & J. Moghaddas (2009), in their experimental set up, they
also used water and air as a continuous liquid phase and dispersed gas phase. Table
2.3 shows the bubble column geometry that propose by (Moshtari et al., 2009).
18
Table 2.3: The bubble column geometry and parameter propose by (Moshtari et al.,
2009)
Bubble Column Geometry Value
Sparger Holes Diameter (Ain) 0.001 m
Superficial Gas Velocity 0.11 – 0.9 m/s
Column Inner Diameter 0.15 m
Column height 2.8 m
Number of Sparger Holes 19
2.7 Sparger Design
Gas Sparger is important parameters to indicate the characteristic of bubble and
indirectly affects gas hold up value. The sparger used to determines the bubble sizes
observed in bubble columns. Basically, small orifices of diameter plate enable the
formation of small bubble sizes. The common used gas sparger types in recent study
are perforated plate, ring type, and porous plate. Regarding to the literature study by
(Kantarci et al., 2005), stated that the smaller the bubbles, the greater of the gas hold
up values. It can be concluded that with small gas distributors their gas hold up
values were higher. Literature study of (Kantarci et al., 2005) also stated that gas
holdup was found to be strongly affected by the type of gas distributor and another
conclusion about the type of spargers was that the contributions of both small and
large bubbles to gas velocity were lower with ring sparger as compared to the
perforated plate.
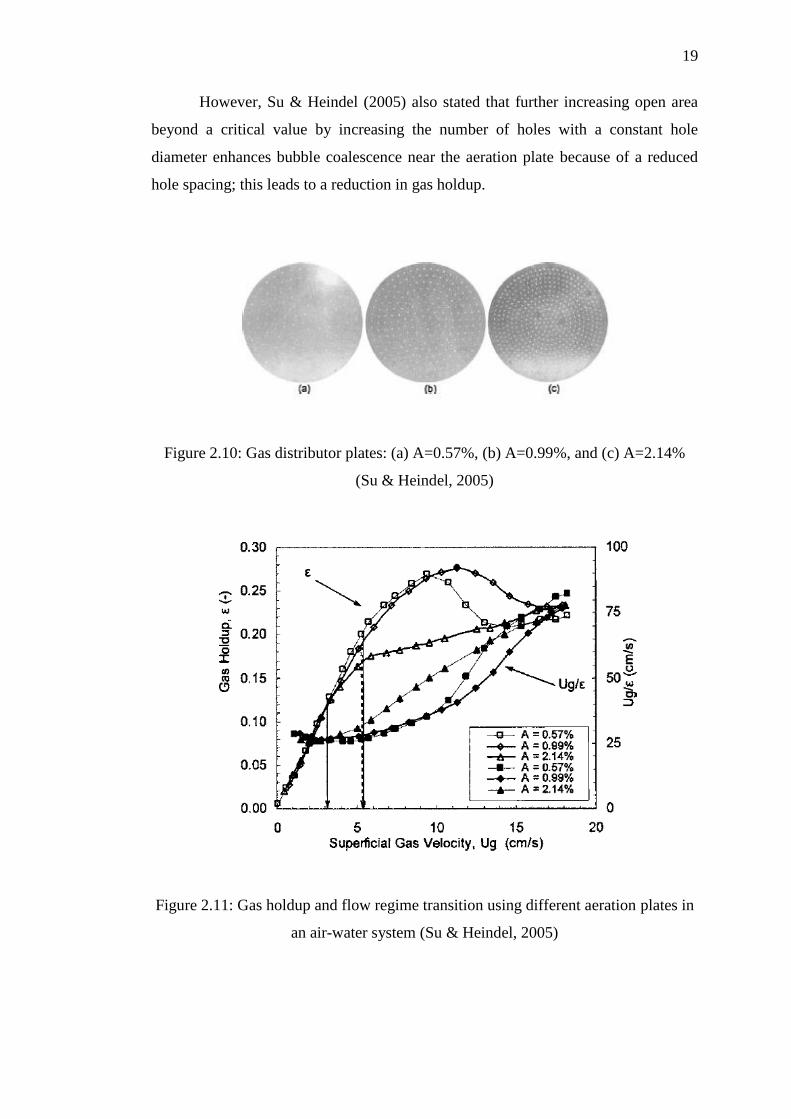
The effect of perforated plate open area analysis by (Su & Heindel, 2005),
show in figure has been studied. From the result, the gas hold up increasing with
increasing open area ratio from A=0.57% and A=0.99 %. Based on figure, for both
A=0.57% and 0.99%, gas holdup increases with increasing superficial gas velocity
until a maximum gas holdup is reached, and then gas holdup decreases with
increasing superficial gas velocity to a minimum value which indicates the end of the
transitional flow regime. For A=2.14%, no maximum gas holdup is observed, and the
gas holdup continuously increases with superficial gas velocity. It means that the gas
hold up will perform effectively if the perforated plates open area within certain
range (A≤1%). If the open area is beyond this range, it will decrease the effectiveness
of gas hold up.
19
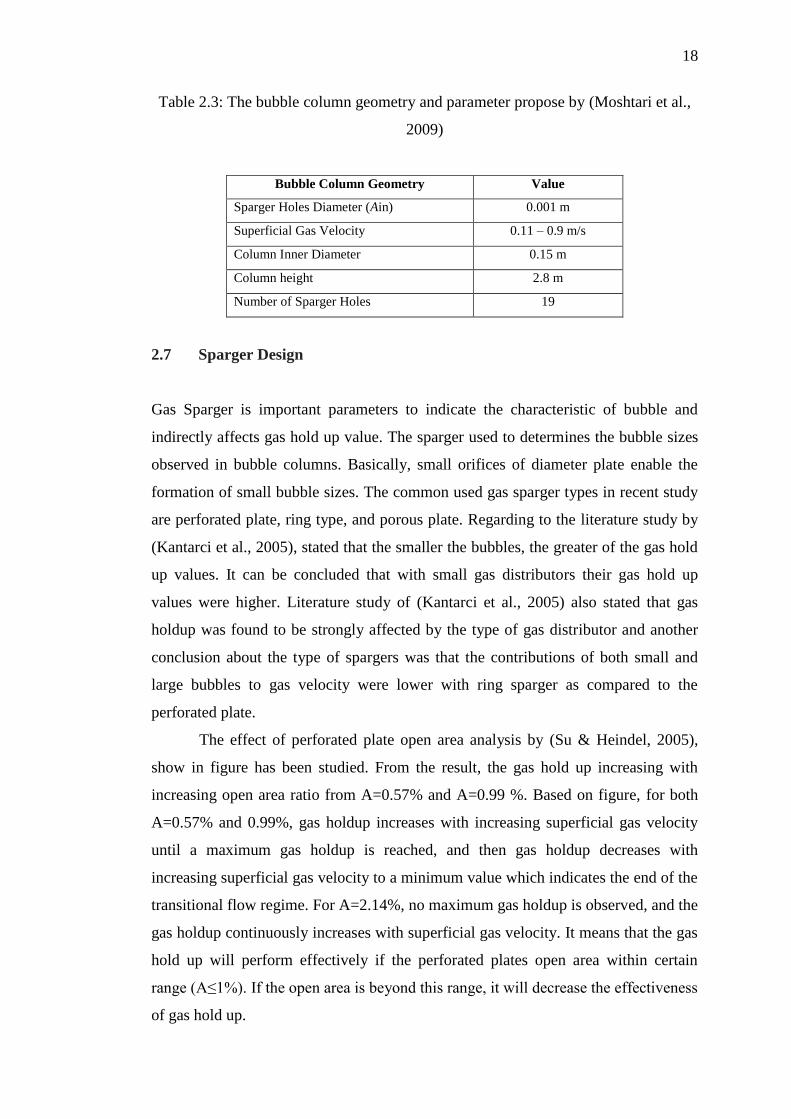
However, Su & Heindel (2005) also stated that further increasing open area
beyond a critical value by increasing the number of holes with a constant hole
diameter enhances bubble coalescence near the aeration plate because of a reduced
hole spacing; this leads to a reduction in gas holdup.
Figure 2.10: Gas distributor plates: (a) A=0.57%, (b) A=0.99%, and (c) A=2.14%
(Su & Heindel, 2005)
Figure 2.11: Gas holdup and flow regime transition using different aeration plates in
an air-water system (Su & Heindel, 2005)
20
2.7.1 Effect of Sparger Geometry on the Distribution of Gas Holdup
The sparger geometry affects less the distribution of hold-ups when the superficial
velocity rises (Haibo et al., 2006). According to (Su & Heindel, 2005) gas holdup
increases with increasing plate open area or by increasing the number of holes. The
ERT is a very powerful tool that used to diagnose the “inside” flow behavior,
meanwhile in their study, the distribution of gas hold-up in the sparger region is
mainly depend on the sparger design. Based on the previous study by (Su & Heindel,
2005), hole spacing play an important role at the inlet and directly influences the
interfacial area and transport rate in bubble column reactor.
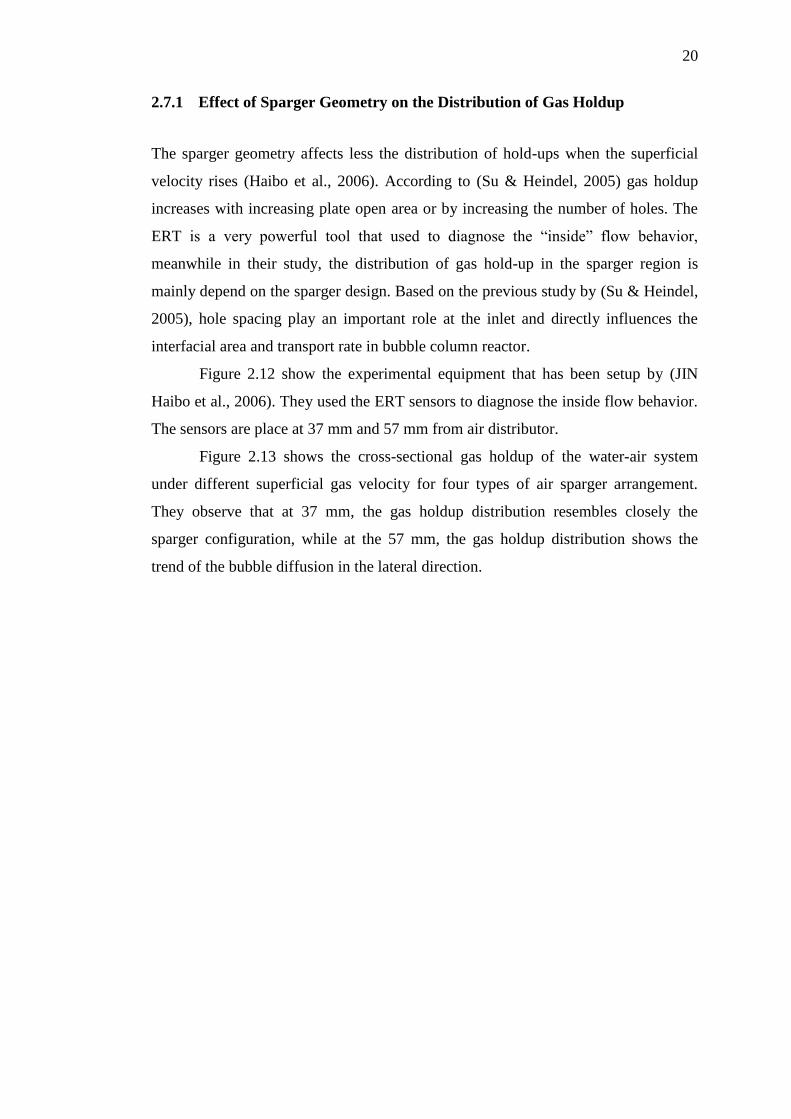
Figure 2.12 show the experimental equipment that has been setup by (JIN
Haibo et al., 2006). They used the ERT sensors to diagnose the inside flow behavior.
The sensors are place at 37 mm and 57 mm from air distributor.
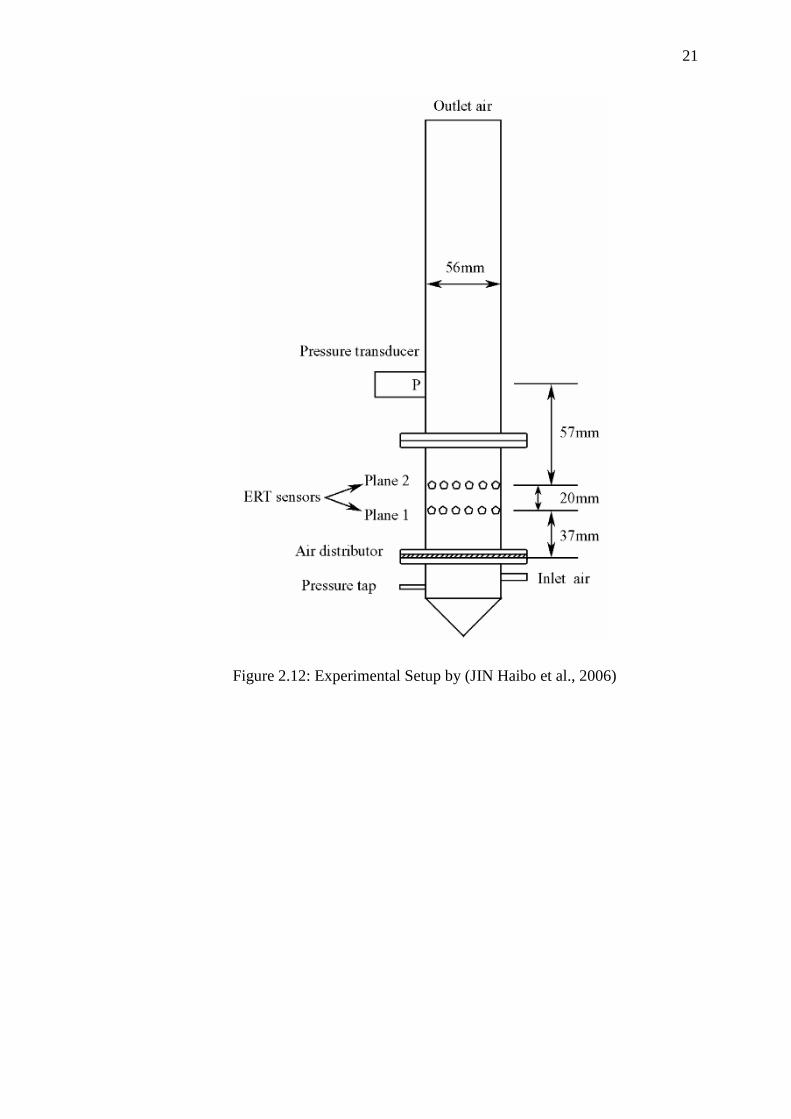
Figure 2.13 shows the cross-sectional gas holdup of the water-air system
under different superficial gas velocity for four types of air sparger arrangement.
They observe that at 37 mm, the gas holdup distribution resembles closely the
sparger configuration, while at the 57 mm, the gas holdup distribution shows the
trend of the bubble diffusion in the lateral direction.
21
Figure 2.12: Experimental Setup by (JIN Haibo et al., 2006)
22
(a) 37 mm from air distributor
(b) 57 mm from air distributor
Figure 2.13: Effect of sparger geometry on the cross sectional image of gas hold-up
(JIN Haibo et al., 2006)
23
2.7.2 Effect of Sparger Type on Gas Hold-up.
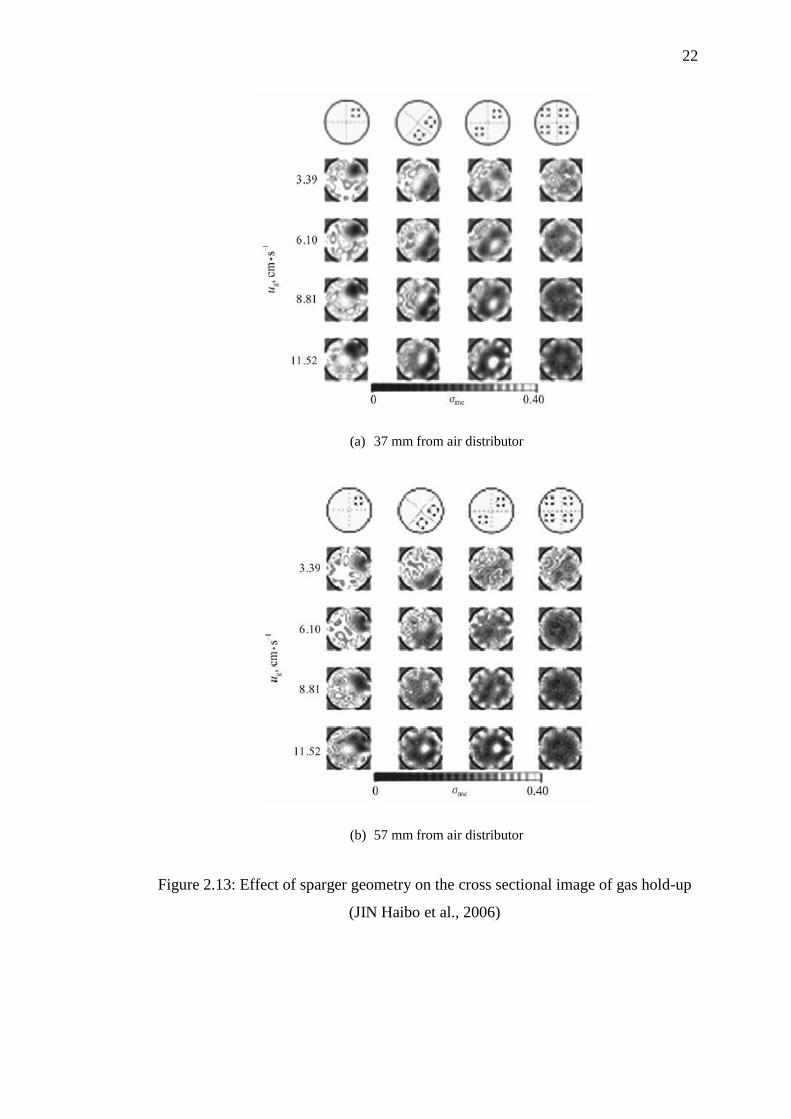
According to B. Moshtari, E. Babakhani & J. Moghaddas (2009), in their
experimental setup, they used perforated plate and porous plate with 0.1% porosity
as shown in the figure 2.14.
Figure 2.14: Two sparger type are used in the experimental setup (Moshtari et al.,
2009)
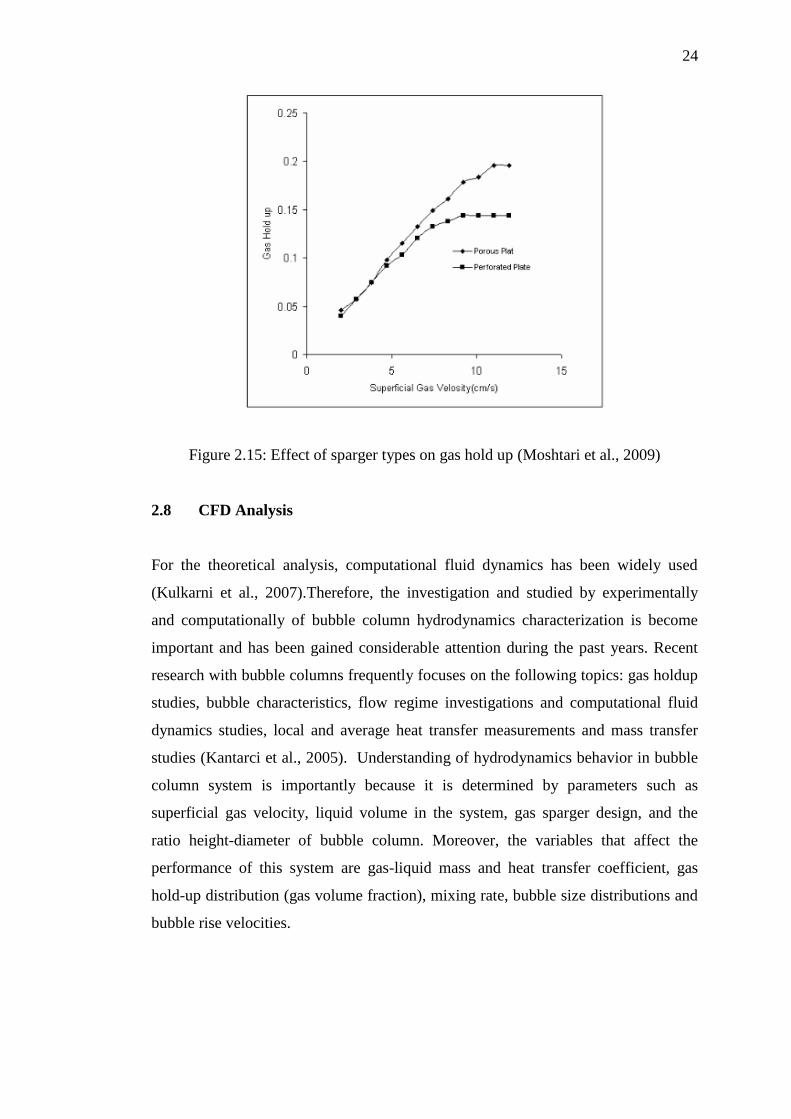
Figure 2.15 shows the effect of sparger type on gas hold up in the bubble column that
has been observed in the experimental setup by (Moshtari et al., 2009). Based on the
experimental data, the break up and coalescence of the gas bubbles are affected the
gas hold up in the column. Porous plate generates smaller gas bubble compare to
perforated plate. Based on the figure, at the higher superficial gas velocity, the
smaller size of pore will increased 40% the gas hold up compared to larger pore size.
24
Figure 2.15: Effect of sparger types on gas hold up (Moshtari et al., 2009)
2.8 CFD Analysis
For the theoretical analysis, computational fluid dynamics has been widely used
(Kulkarni et al., 2007).Therefore, the investigation and studied by experimentally
and computationally of bubble column hydrodynamics characterization is become
important and has been gained considerable attention during the past years. Recent
research with bubble columns frequently focuses on the following topics: gas holdup
studies, bubble characteristics, flow regime investigations and computational fluid
dynamics studies, local and average heat transfer measurements and mass transfer
studies (Kantarci et al., 2005). Understanding of hydrodynamics behavior in bubble
column system is importantly because it is determined by parameters such as
superficial gas velocity, liquid volume in the system, gas sparger design, and the
ratio height-diameter of bubble column. Moreover, the variables that affect the
performance of this system are gas-liquid mass and heat transfer coefficient, gas
hold-up distribution (gas volume fraction), mixing rate, bubble size distributions and
bubble rise velocities.
58
REFERENCES
Anil, M., Agarwal, V. K., Siraj Alam, M., & Wasewar, K. L. (2007). CFD modeling
of three-phase bubble column: 1. study of flow pattern. Chemical and
biochemical engineering quarterly, 21(3), 197-205.
Delnoij, E., Lammers, F. A., Kuipers, J. A. M., & Van Swaaij, W. P. M. (1997).
Dynamic simulation of dispersed gas-liquid two-phase flow using a discrete
bubble model. Chemical Engineering Science, 52(9), 1429-1458.
Harteveld, W. (n.d.).(2005). Bubble columns-structures or stability, 90-64642-26-5
Haibo, J. I. N., Wang, M., & Williams, R. A. (2006). The effect of sparger geometry
on gas bubble flow behaviors using electrical resistance tomography. Chinese
Journal of Chemical Engineering, 14(1), 127-131..
Kantarci, N., Borak, F., & Ulgen, K. O. (2005). Bubble column reactors. Process
Biochemistry, 40(7), 2263-2283..
Kulkarni, A. A., Ekambara, K., & Joshi, J. B. (2007). On the development of flow
pattern in a bubble column reactor: experiments and CFD. Chemical
engineering science, 62(4), 1049-1072.
Mena, P. M. P. N. C. (2005). Mass transfer and hydrodynamics in multiphase
systems (Doctoral dissertation, Universidade do Porto).
Shahimie, S. (2010). Modelling of hydrodynamics in heterogeneous. (Bachelor of
chemical engineering, University Malaysia Pahang)
Moshtari, B., Babakhani, E. G., & Moghaddas, J. S. (2009). Experimental study of
gas hold-up and bubble behavior in gas-liquid bubble column. Petroleum &
Coal, 51(1), 27-32.
Nader, A. A. (2008). Simulation of Gas-to-Liquid ( GTL ) Process in Slurry Bubble
Column Reactor (Master of science in chemical engineering, University of
Technology)
Naji, O. I. (2010). Heat Transfer in Bubble Columns Using Two Different Column
Diameters (Doctoral dissertation, UNIVERSITY OF TECHNOLOGY).
59
Pirdashti, M., & Kompany, R. (2009). Effects of Height to Diameter Ratio and
Aeration rate on Liquid Mixing and Hydrodynamic Properties in a Bubble
Column. Iranian Journal of Chemical Engineering, 6(3), 47.
Su, X., & Heindel, T. J. (2005). Effect of perforated plate open area on gas holdup in
rayon fiber suspensions. Journal of fluids engineering, 127(4), 816-823.
Xue, J., Al‐Dahhan, M., Dudukovic, M. P., & Mudde, R. F. (2008). Bubble velocity,
size, and interfacial area measurements in a bubble column by four‐point optical
probe. AIChE journal, 54(2), 350-363.
Yoshimura, H., Matsumura, H., Niwa, K., Nakamura, T., & Itoigawa, F. (2004).
Study on Eco-Friendly Oil on Water Drop Metalworking Fluid (No. 2004-01-
0789). SAE Technical Paper.
Zhang, D., Deen, N. G., & Kuipers, J. A. M. (2006). Numerical simulation of the
dynamic flow behavior in a bubble column: a study of closures for turbulence
and interface forces. Chemical Engineering Science, 61(23), 7593-7608.
Shaikh, A., & Al-Dahhan, M. H. (2007). A review on flow regime transition in
bubble columns. International Journal of Chemical Reactor Engineering, 5(1).
Mahajan, V. (2010). CFD analysis of hydrodynamics and mass transfer of a gas-
liquid bubble column (Doctoral dissertation, NATIONAL INSTITUTE OF
TECHNOLOGY, ROURKELA).
Irani, M., & Khodagholi, M. A. (2011). Investigation of bubble column
hydrodynamics using cfd simulation (2d and 3d) and experimental validation.
Petroleum & coal, 53(2), 146-158.
Kheradmandnia, S., Mousavi, S. M., Hashemi-Najafabadi, S., & Shojaosadati, S. A.
(2014). Modelling and CFD Simulation of Hydrodynamics and Mass Transfer
in a Miniature Bubble Column Bioreactor. International Journal of Engineering
and Technology, 2(3), 223-242.