Embed Size (px)
Citation preview
CFD FINAL PROJECT MODELING THE ACCESS POINT ON THE BRACHIAL ARTERY
Novemer 16, 2010
Nicole Varble
Problem Definition- Overview
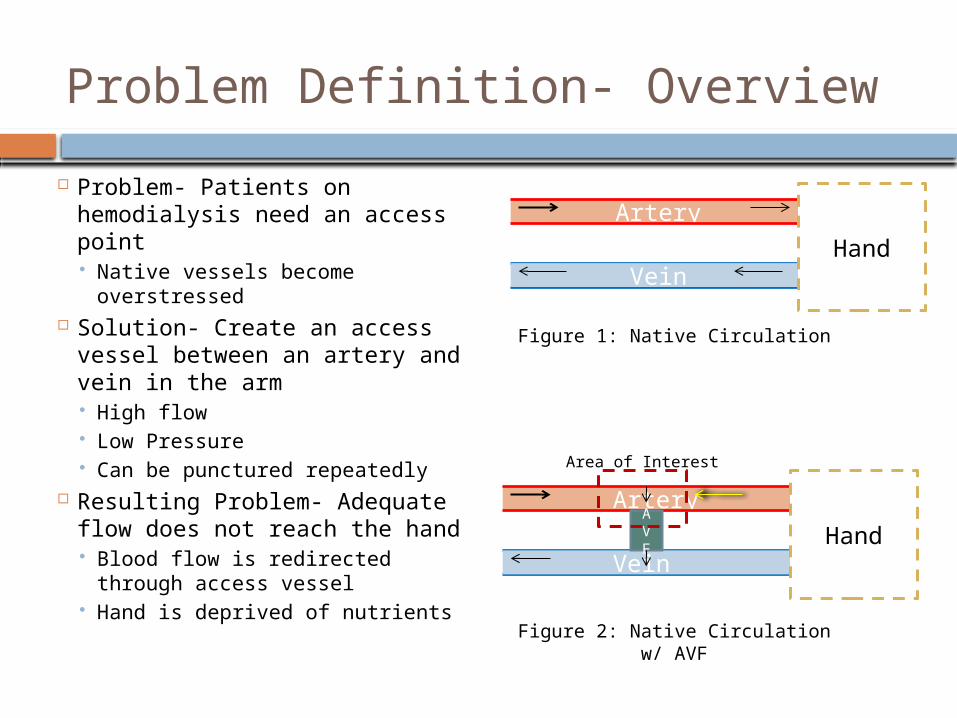
Problem- Patients on hemodialysis need an access point Native vessels become
overstressed Solution- Create an access
vessel between an artery and vein in the arm High flow Low Pressure Can be punctured repeatedly
Resulting Problem- Adequate flow does not reach the hand Blood flow is redirected through
access vessel Hand is deprived of nutrients
Artery
Figure 1: Native Circulation
VeinHand
Artery
VeinHand
Figure 2: Native Circulation w/ AVF
AVF
Area of Interest
Problem Definition- Overview
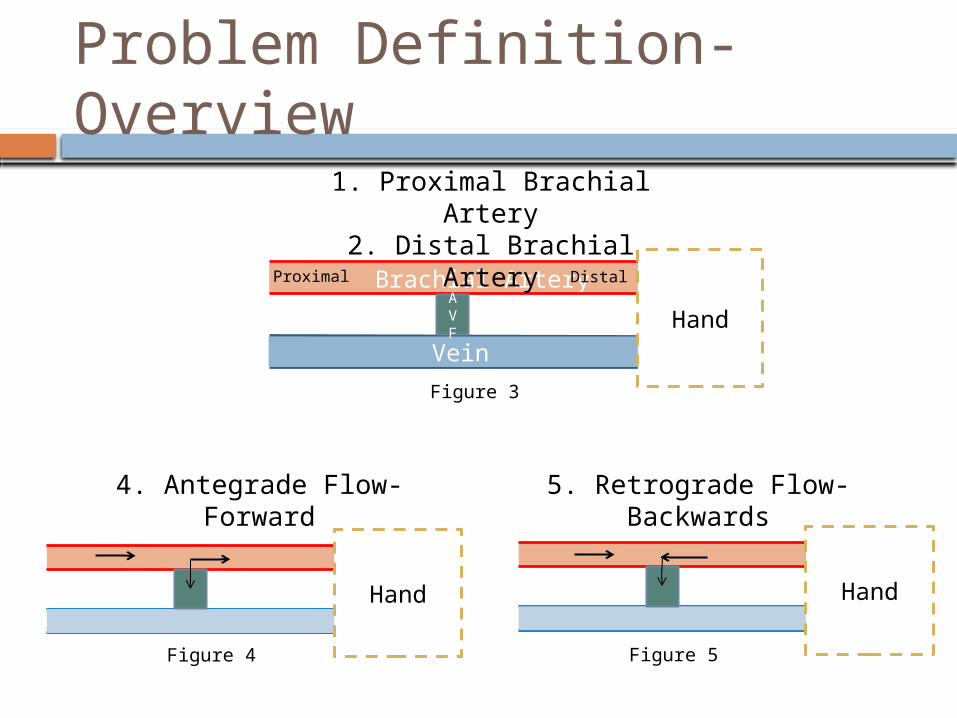
Brachial ArteryProximal Distal
VeinHand
AVF
Hand
Hand
1. Proximal Brachial Artery2. Distal Brachial Artery
4. Antegrade Flow- Forward
5. Retrograde Flow- Backwards
Figure 3
Figure 4 Figure 5
Project Definition- Overview
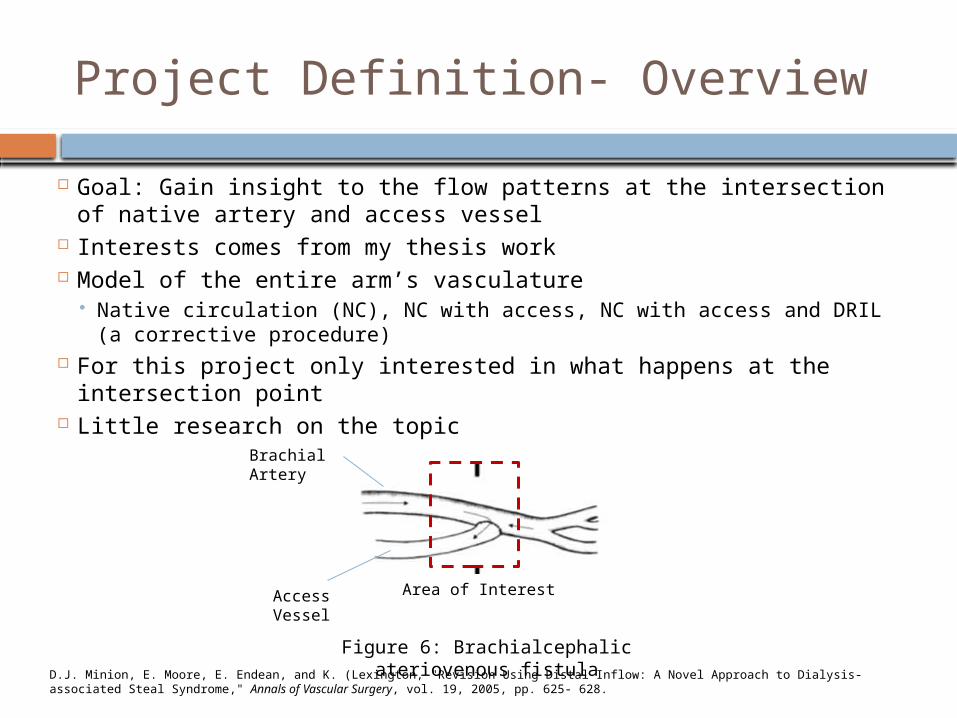
Goal: Gain insight to the flow patterns at the intersection of native artery and access vessel
Interests comes from my thesis work Model of the entire arm’s vasculature
Native circulation (NC), NC with access, NC with access and DRIL (a corrective procedure)
For this project only interested in what happens at the intersection point
Little research on the topic
Area of Interest
D.J. Minion, E. Moore, E. Endean, and K. (Lexington, "Revision Using Distal Inflow: A Novel Approach to Dialysis- associated Steal Syndrome," Annals of Vascular Surgery, vol. 19, 2005, pp. 625- 628.
Figure 6: Brachialcephalic ateriovenous fistula
Brachial Artery
Access Vessel
Project Definition- Aims
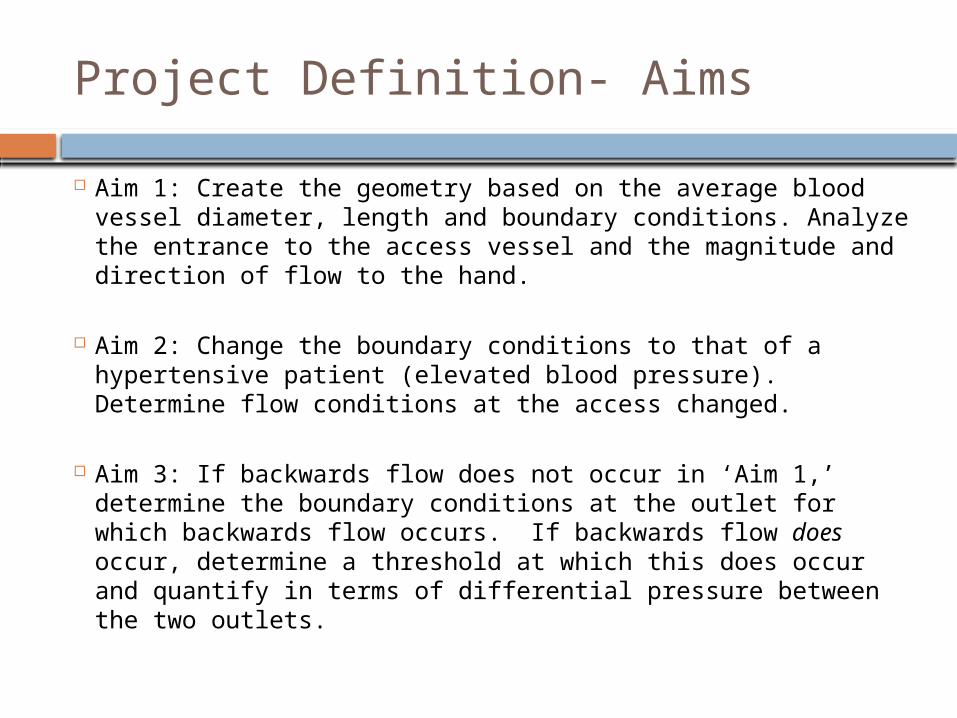
Aim 1: Create the geometry based on the average blood vessel diameter, length and boundary conditions. Analyze the entrance to the access vessel and the magnitude and direction of flow to the hand.
Aim 2: Change the boundary conditions to that of a hypertensive patient (elevated blood pressure). Determine flow conditions at the access changed.
Aim 3: If backwards flow does not occur in ‘Aim 1,’
determine the boundary conditions at the outlet for which backwards flow occurs. If backwards flow does occur, determine a threshold at which this does occur and quantify in terms of differential pressure between the two outlets.
Project Definition- Assumptions
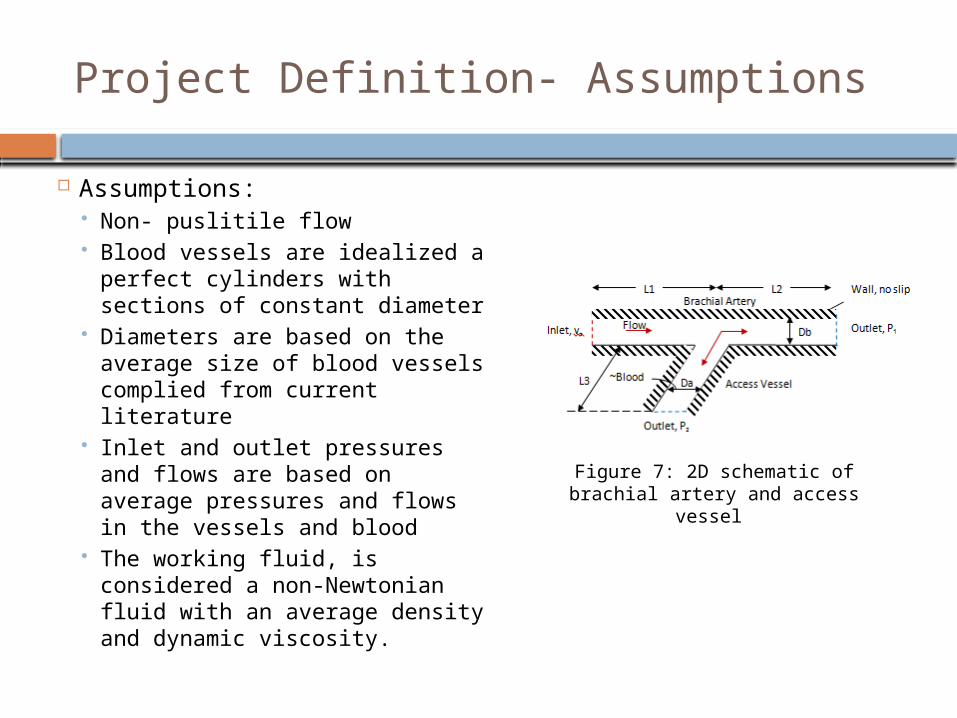
Assumptions: Non- puslitile flow Blood vessels are idealized a
perfect cylinders with sections of constant diameter
Diameters are based on the average size of blood vessels complied from current literature
Inlet and outlet pressures and flows are based on average pressures and flows in the vessels and blood
The working fluid, is considered a non-Newtonian fluid with an average density and dynamic viscosity.
Figure 7: 2D schematic of brachial artery and access vessel
Project Definition- Boundary Conditions
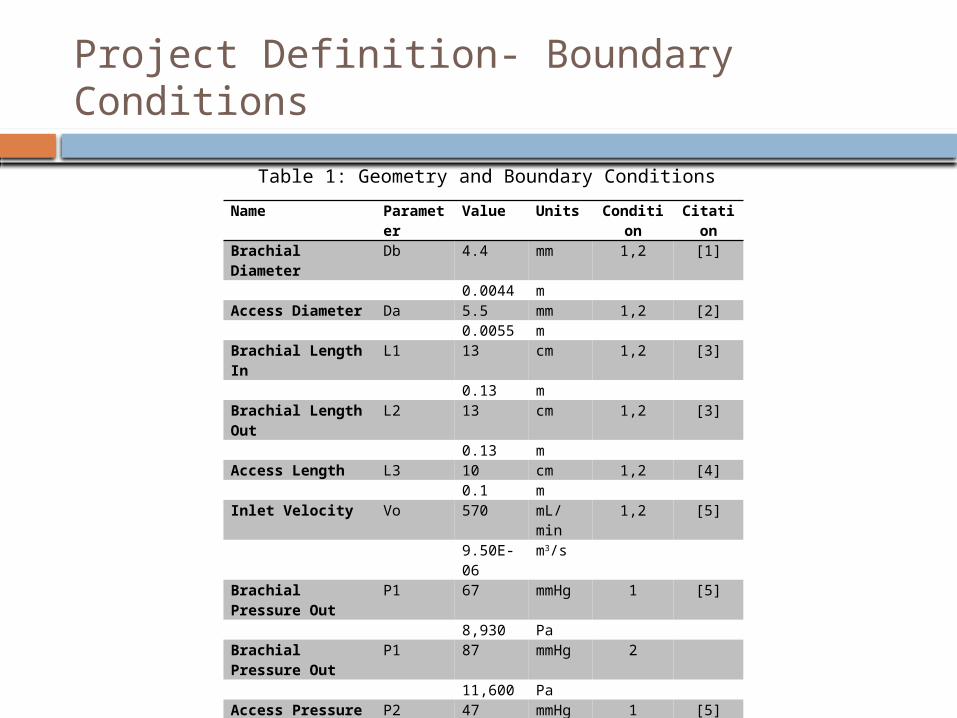
Name Parameter Value Units Condition CitationBrachial Diameter Db 4.4 mm 1,2 [1]
0.0044 mAccess Diameter Da 5.5 mm 1,2 [2]
0.0055 mBrachial Length In L1 13 cm 1,2 [3]
0.13 mBrachial Length Out L2 13 cm 1,2 [3]
0.13 mAccess Length L3 10 cm 1,2 [4]
0.1 mInlet Velocity Vo 570 mL/min 1,2 [5]
9.50E-06 m3/s
Brachial Pressure Out P1 67 mmHg 1 [5]8,930 Pa
Brachial Pressure Out P1 87 mmHg 211,600 Pa
Access Pressure Out P2 47 mmHg 1 [5]6,270 Pa
Access Pressure Out P2 67 mmHg 28,930 Pa
Table 1: Geometry and Boundary Conditions
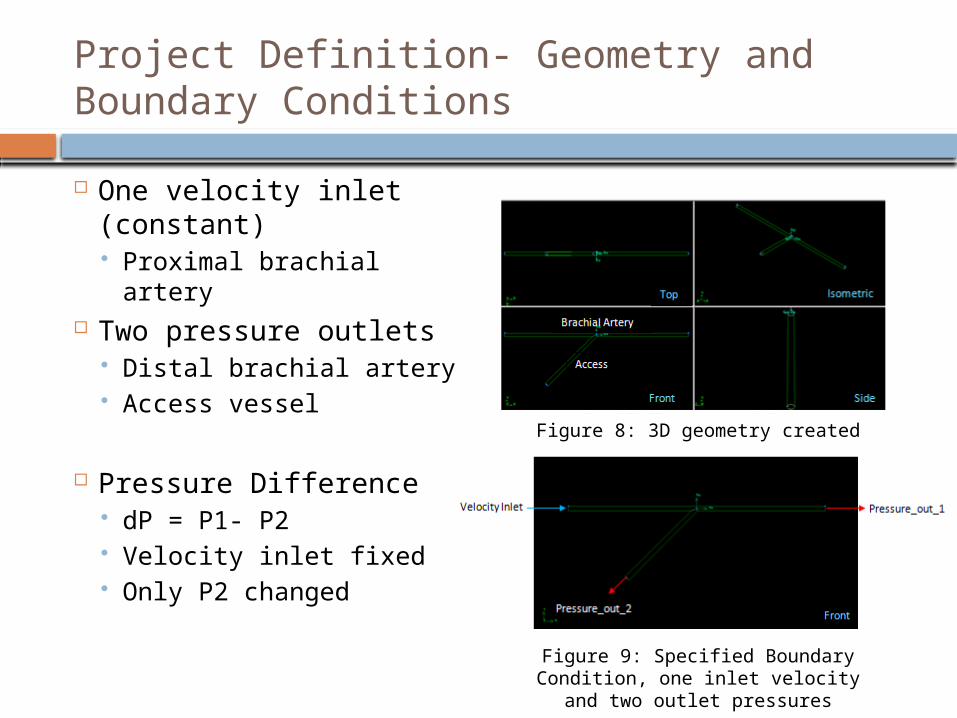
Project Definition- Geometry and Boundary Conditions
One velocity inlet (constant) Proximal brachial
artery Two pressure outlets
Distal brachial artery Access vessel
Pressure Difference dP = P1- P2 Velocity inlet fixed Only P2 changed
Figure 8: 3D geometry created in Gambit
Figure 9: Specified Boundary Condition, one inlet velocity and two
outlet pressures
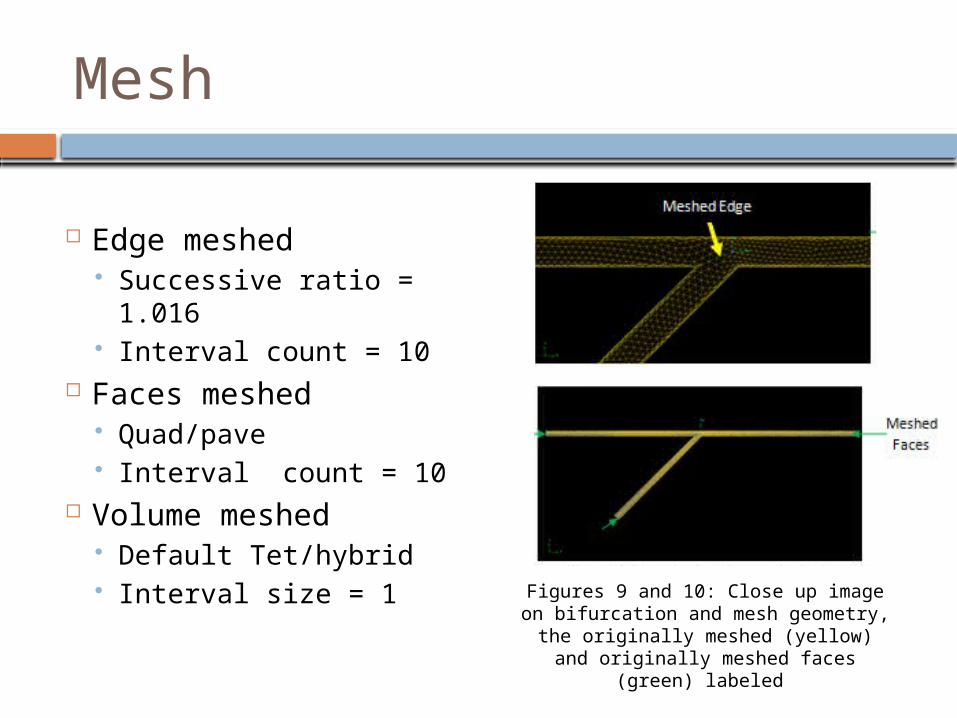
Mesh
Edge meshed Successive ratio = 1.016 Interval count = 10
Faces meshed Quad/pave Interval count = 10
Volume meshed Default Tet/hybrid Interval size = 1 Figures 9 and 10: Close up image on
bifurcation and mesh geometry, the originally meshed (yellow) and originally meshed faces (green)
labeled
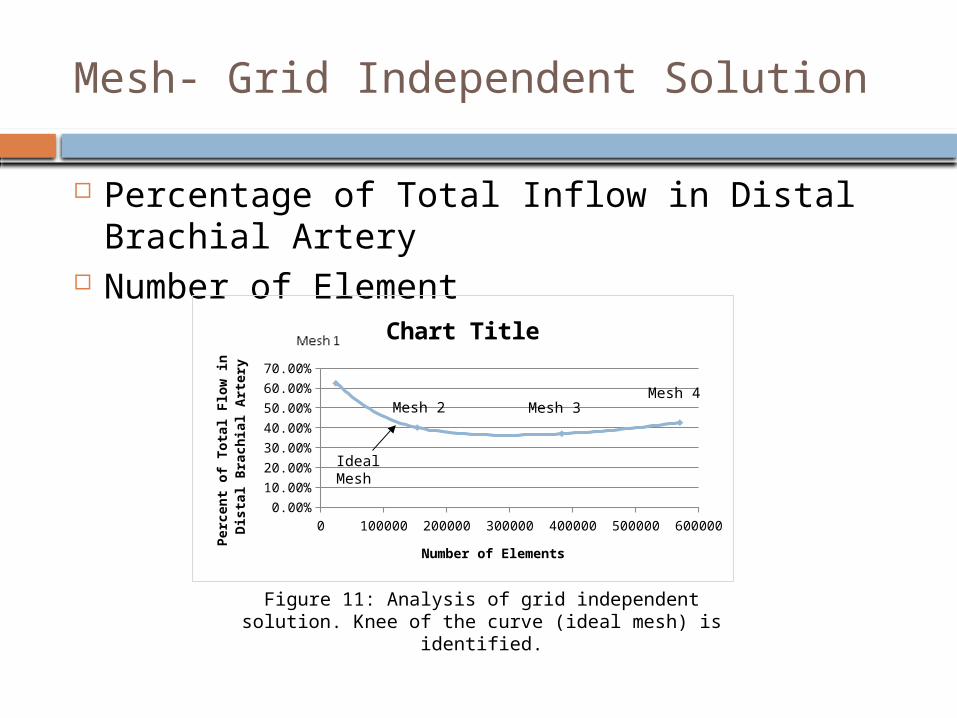
Mesh- Grid Independent Solution
Percentage of Total Inflow in Distal Brachial Artery
Number of Element
0 100000 200000 300000 400000 500000 6000000.00%
10.00%
20.00%
30.00%
40.00%
50.00%
60.00%
70.00%
Chart Title
Number of Elements
Perc
ent
of
Tota
l Flo
w in
Dis
tal B
rachia
l A
rtery
Mesh 2 Mesh 3Mesh 4
Ideal Mesh
Figure 11: Analysis of grid independent solution. Knee of the curve (ideal mesh) is identified.
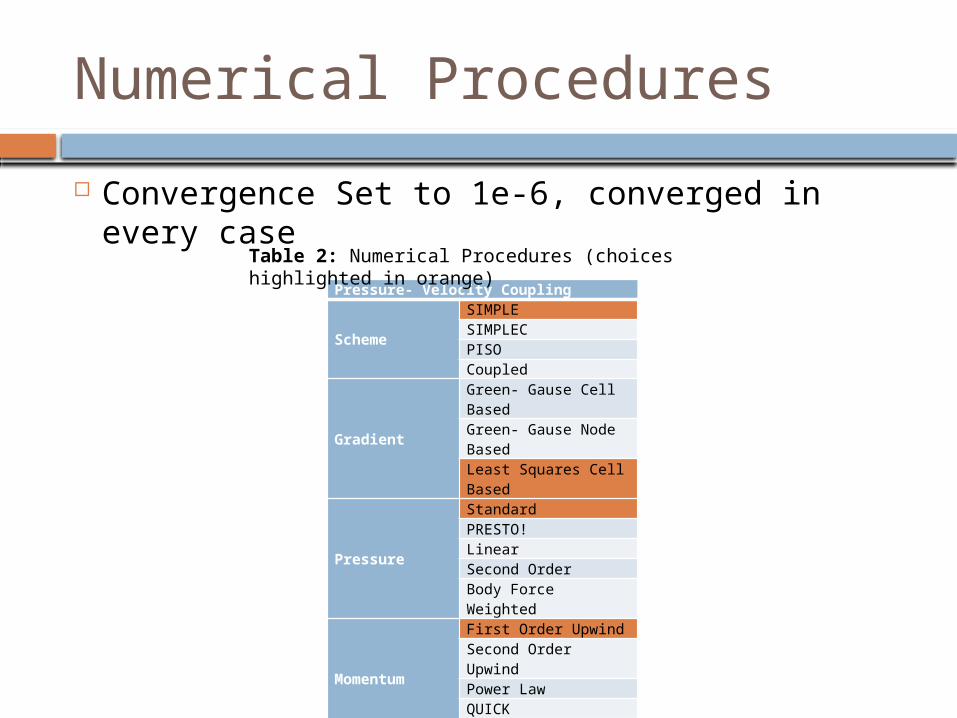
Numerical Procedures
Convergence Set to 1e-6, converged in every case
Pressure- Velocity Coupling
Scheme
SIMPLESIMPLECPISOCoupled
Gradient
Green- Gause Cell BasedGreen- Gause Node BasedLeast Squares Cell Based
Pressure
StandardPRESTO!LinearSecond OrderBody Force Weighted
Momentum
First Order UpwindSecond Order UpwindPower LawQUICKThird Order MUSCL
Table 2: Numerical Procedures (choices highlighted in orange)
Results
Analyzed Aim 1 and 2
Nature of flow in normal and hypertensive cases Aim 1, 2 and 3
Point of maximum flow Pressure throughout control volume to identify the low
pressure vessel Direction and Magnitude of flow in the distal brachial artery
Outcome Identify what at what pressure difference retrograde
(backwards) flow occurs
Results- Normal and Hypertensive Case
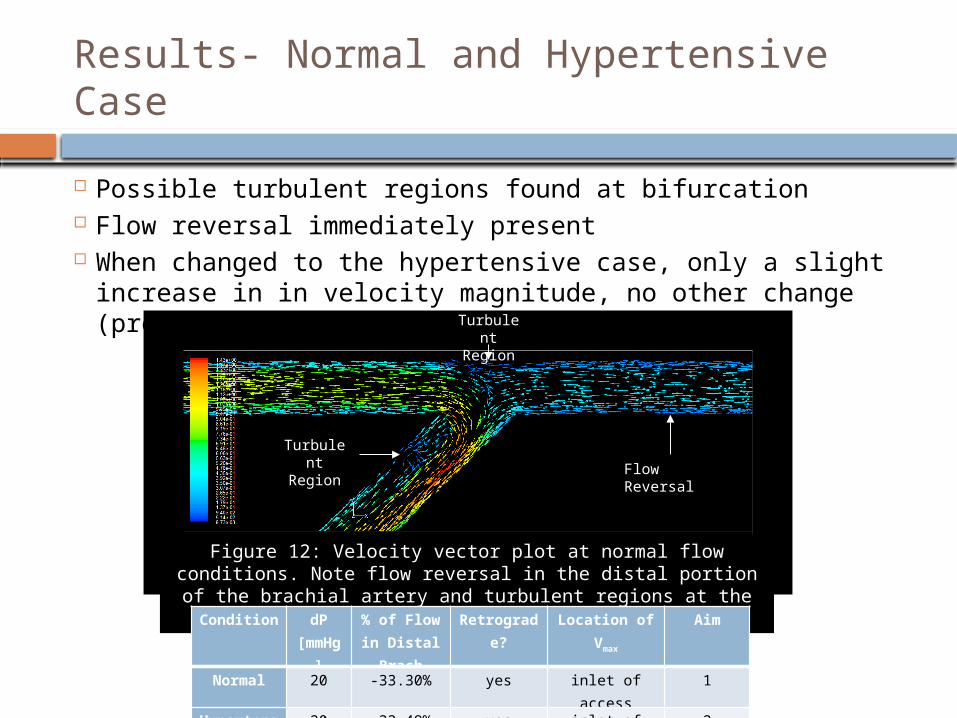
Possible turbulent regions found at bifurcation Flow reversal immediately present When changed to the hypertensive case, only a slight
increase in in velocity magnitude, no other change (pressure difference??) Turbulent
Region
Flow Reversal
Turbulent Region
Figure 12: Velocity vector plot at normal flow conditions. Note flow reversal in the distal portion of the brachial artery and
turbulent regions at the bifurcationCondition dP
[mmHg]
% of Flow in Distal
Brach
Retrograde?
Location of Vmax
Aim
Normal 20 -33.30% yes inlet of access
1
Hypertensive
20 -33.49% yes inlet of access
2
Results- Velocity Magnitude
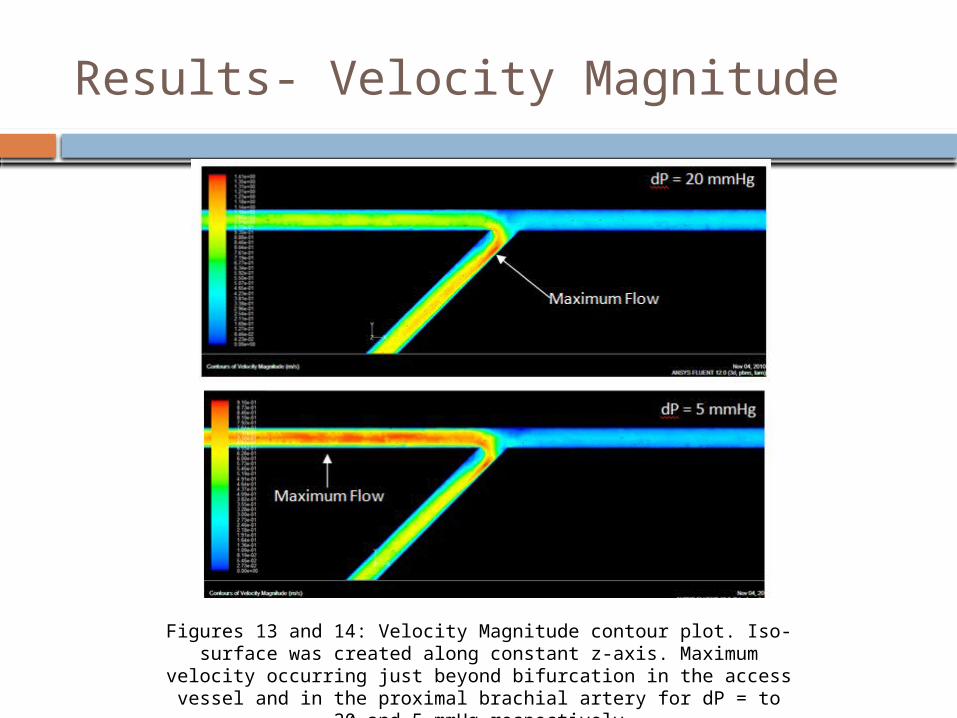
Figures 13 and 14: Velocity Magnitude contour plot. Iso-surface was created along constant z-axis. Maximum velocity occurring just
beyond bifurcation in the access vessel and in the proximal brachial artery for dP = to 20 and 5 mmHg respectively
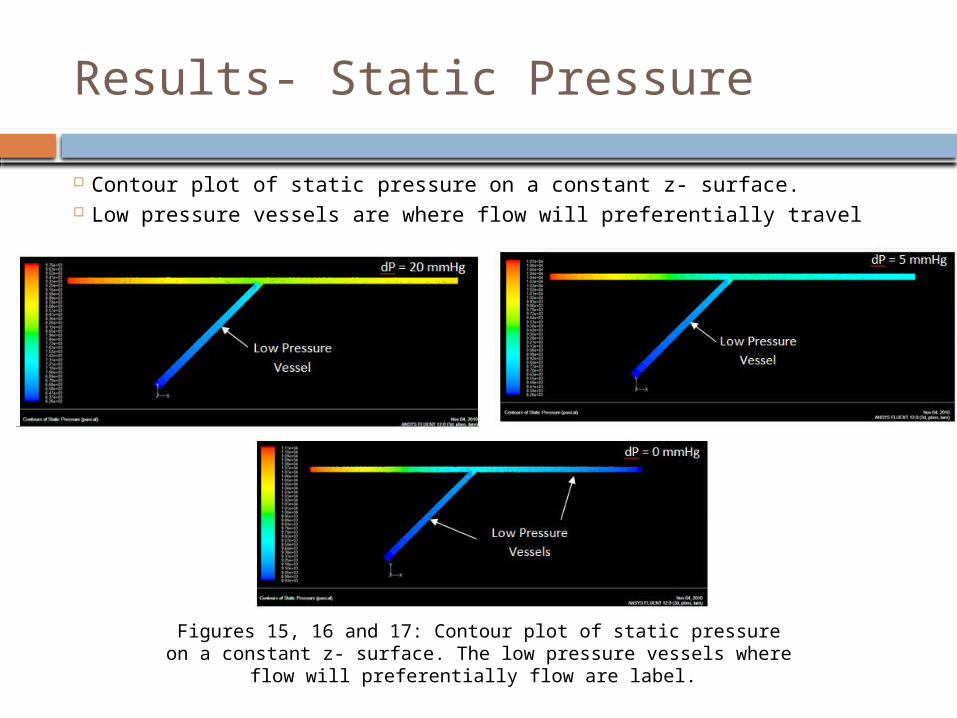
Results- Static Pressure
Contour plot of static pressure on a constant z- surface. Low pressure vessels are where flow will preferentially travel
Figures 15, 16 and 17: Contour plot of static pressure on a constant z- surface. The low pressure vessels where flow will preferentially
flow are label.
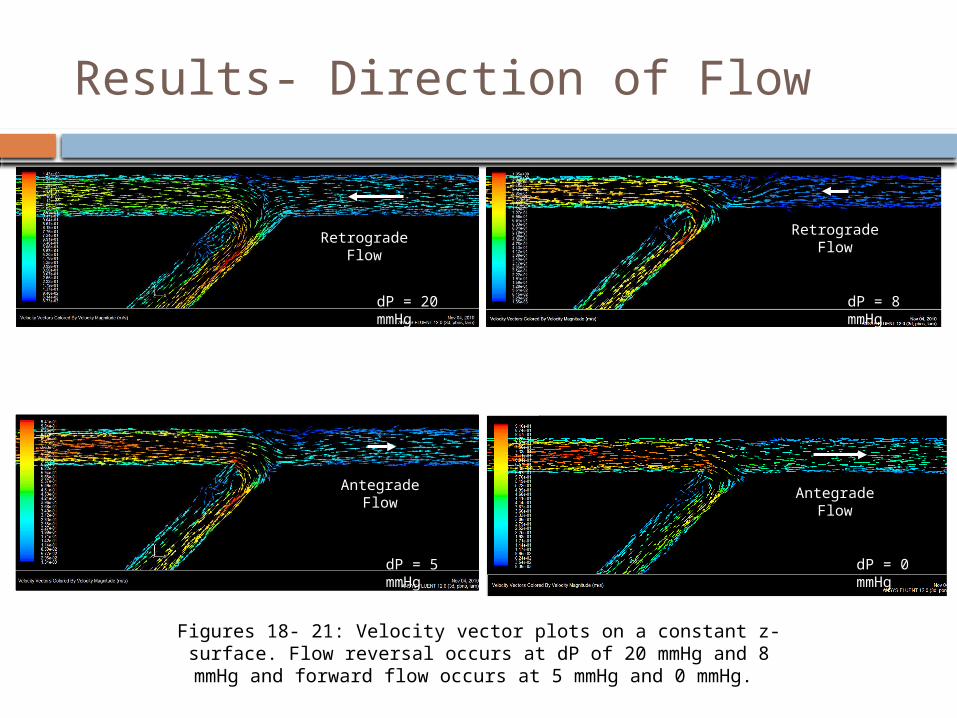
Results- Direction of Flow
Figures 18- 21: Velocity vector plots on a constant z- surface. Flow reversal occurs at dP of 20 mmHg and 8 mmHg and forward flow
occurs at 5 mmHg and 0 mmHg.
dP = 20 mmHg dP = 8 mmHg
dP = 5 mmHg dP = 0 mmHg
Retrograde Flow Retrograde Flow
Antegrade Flow Antegrade Flow
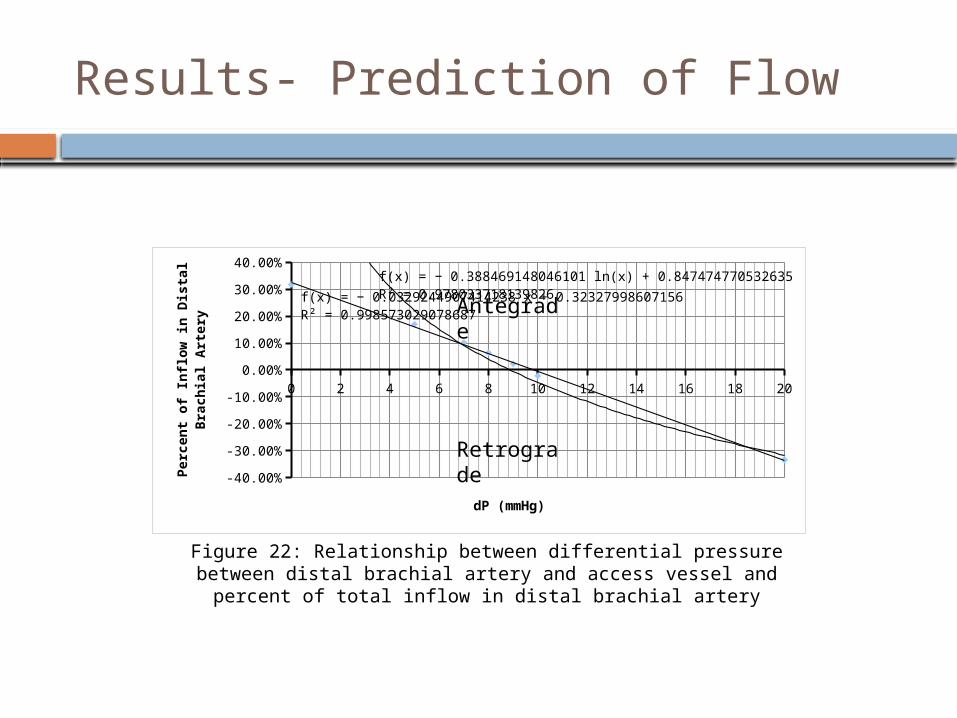
Results- Prediction of Flow
0 2 4 6 8 10 12 14 16 18 20
-40.00%
-30.00%
-20.00%
-10.00%
0.00%
10.00%
20.00%
30.00%
40.00%f(x) = − 0.388469148046101 ln(x) + 0.847474770532635R² = 0.978033718139826f(x) = − 0.0329244907414238 x + 0.32327998607156
R² = 0.998573029078687
dP (mmHg)
Perc
ent
of
Infl
ow
in D
ista
l B
rachia
l A
rtery
Retrograde
Antegrade
Figure 22: Relationship between differential pressure between distal brachial artery and access vessel and percent of total inflow
in distal brachial artery
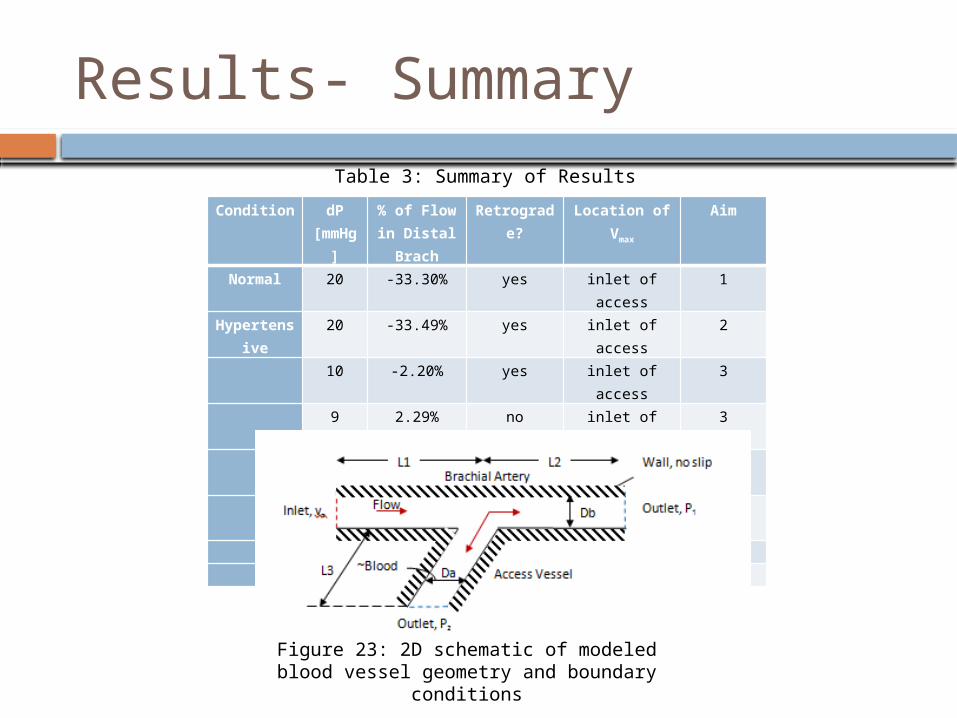
Results- Summary
Condition dP [mmH
g]
% of Flow in Distal
Brach
Retrograde?
Location of Vmax
Aim
Normal 20 -33.30% yes inlet of access
1
Hypertensive
20 -33.49% yes inlet of access
2
10 -2.20% yes inlet of access
3
9 2.29% no inlet of access
3
8 6.38% no inlet of access
3
7 10.13% no inlet of access
3
5 16.98% no prox brach 30 31.74% no prox brach 3
Figure 23: 2D schematic of modeled blood vessel geometry and boundary
conditions
Table 3: Summary of Results
Conclusions
Maximum velocity occurs just beyond bifurcation or in proximal brachial artery
All cases, access vessel acts as a low pressure vessel (flow preferentially travels through it)
When differential pressure between outlets is limited to 10 mmHg flow is antegrade
CFD model predicts when retrograde flow in distal brachial artery will occur based on differential pressure
Experimental verification needed Potentially physicians can use this relationship or
something similar to eliminate need for corrective procedures (DRIL)

Questions?
References
[1] A. Peretz, D.F. Leotta, J.H. Sullivan, C.a. Trenga, F.N. Sands, M.R. Aulet, M. Paun, E.a. Gill, and J.D. Kaufman, "Flow mediated dilation of the brachial artery: an investigation of methods requiring further standardization.," BMC cardiovascular disorders, vol. 7, 2007, p. 11.
[2] J. Zanow, U. Krueger, P. Reddemann, and H. Scholz, "Experimental study of hemodynamics in procedures to treat access-related ischemia," Journal of Vascular Surgery, 2008, pp. 1559-1565.
[3] V. Patnaik, G. Kalsey, and S. Rajan, "Branching Pattern of Brachial Artery-A Morphological Study," J. Anat. Soc. India, vol. 51, 2002, pp. 176-186.
[4] W.S. Gradman, C. Pozrikidis, L. Angeles, and S. Diego, "Analysis of Options for Mitigating Hemodialysis Access-Related Ischemic Steal Phenomena," Annals of Vascular Surgery, vol. 18, 2004, pp. 59-65.
[5] K.A. Illig, S. Surowiec, C.K. Shortell, M.G. Davies, J.M. Rhodes, R.M. Green, and N. York, "Hemodynamics of Distal Revascularization- Interval Ligation," Annals of Vascular Surgery, vol. 19, 2005, pp. 199-207.
[6] C.L. Wixon, J.D. Hughes, and J.L. Mills, "Understanding Strategies for the Treatment of
Ischemic Steal Syndrome after Hemodialysis Access," Elsevier Science, 2000, pp. 301-310.