Embed Size (px)
Citation preview
CFD Analysis of the oil-water separation performance on hydrocyclones
with functionalized surfaces
Plested, D; Vargas, W
Chemical Engineering department, Universidad de los Andes, Bogota D.C, Colombia
The present work seeks to simulate the three dimensional oil-water turbulent flow and oil separation process on a
traditional deoiling hydrocyclone using STAR-CCM+ CFD (Computational Fluid Dynamics) software. In order to evaluate
the effect of the implementation of functionalized surfaces on the deoiling process, The Reynolds Stress model and the
eulerian-eulerian model are combined to handle the complex anisotropic turbulent two-phase flow. Velocity and pressure
profiles were obtained for a single phase simulation in order to evaluate the flow behavior on the hydrocyclone. Then, oil
volume fraction, velocity, and pressure profiles were obtained for a multiphase simulation and the results were in
agreement with previously reported data in the literature. At last, surface functionalization was implemented on the
monophasic simulation due to convergence issues with the multiphase modified simulation. The results were not
conclusive towards the effect of surface functionalization on separation performance but strongly showed the need of
continuing this work into the multiphase simulation or experimental research.
Keywords: Deoling hydrocyclone, CFD, Anisotropic turbulent, eulerian-eulerian model, Reynolds Stress model.
1. Introduction
Water tends to become the dominant produced
fluid in oil production. Globally, It is estimated that
3 barrels of water are extracted for each oil barrel
(Universidad Estatal de Nuevo Mexico, Centro de
investigacion agricola Farmington, 2012), value that
varies with mature wells. On Rubiales Oil Field, 9
barrels of water are produced for each oil barrel
which demonstrates how high can this proportion
get (RWL Water group). At the same time, Produced
Water (PW) should meet the international
standards in terms of oil-residuals fraction (Young &
Wakley, 1993), besides this stringent standards and
the magnitude of PW, progressing into deeper
water and more hostile environments in the search
for new oil and gas reserves has also placed and
increasing demand on the industry to develop
lighter, more compact, and more efficient process
equipment to replace their traditional counterparts
(Meldrum, 1987). One solution to the mentioned
problem is the use of hydrocyclone separators, in
contrast to conventional produced water treatment
systems; hydrocyclones provide offshore and
onshore operators the benefits of light weight,
compact size, easy and reliable operation, low
maintenance, complete insensivity platform
motions, low utility requirements, and highly
predictable capacity (Choi, 1990).
The modern renaissance in deoiling hydrocyclone
was instigated by martin Thew and Derek Colman at
the University of Southampton (Woodruff, 1990);
Hydrocyclones technology has been designed to
generate high centrifugal forces (over one thousand
times the force of gravity) without creating
significant droplet shear (Schubert, 1992).
As shown in figure 1, water-oil mixture is fed
tangentially under pressure through the inlet
chamber forcing rotation of the fluids within the
device. As the fluid is forced down the liner, the two
conical shape sections (Reducing section and
Tapered Section) of the hydrocyclone, accelerates
the fluid into a helical pattern setting up a vortex
and creating large centrifugal forces, this forces
cause the lighter material (oil) to migrate to the
hydrocyclone axis, while the denser material
(water) is forced to the outer wall (Bowers, 1998),
under this conical shape sections there’s another
cylindrical section (Tail-Pipe-section) with the
purpose of maintaining the swirl effect as long as
possible. By maintaining the underflow outlet at a
higher pressure than the overflow outlet, the
concentrated oil core of the vortex is forced to flow
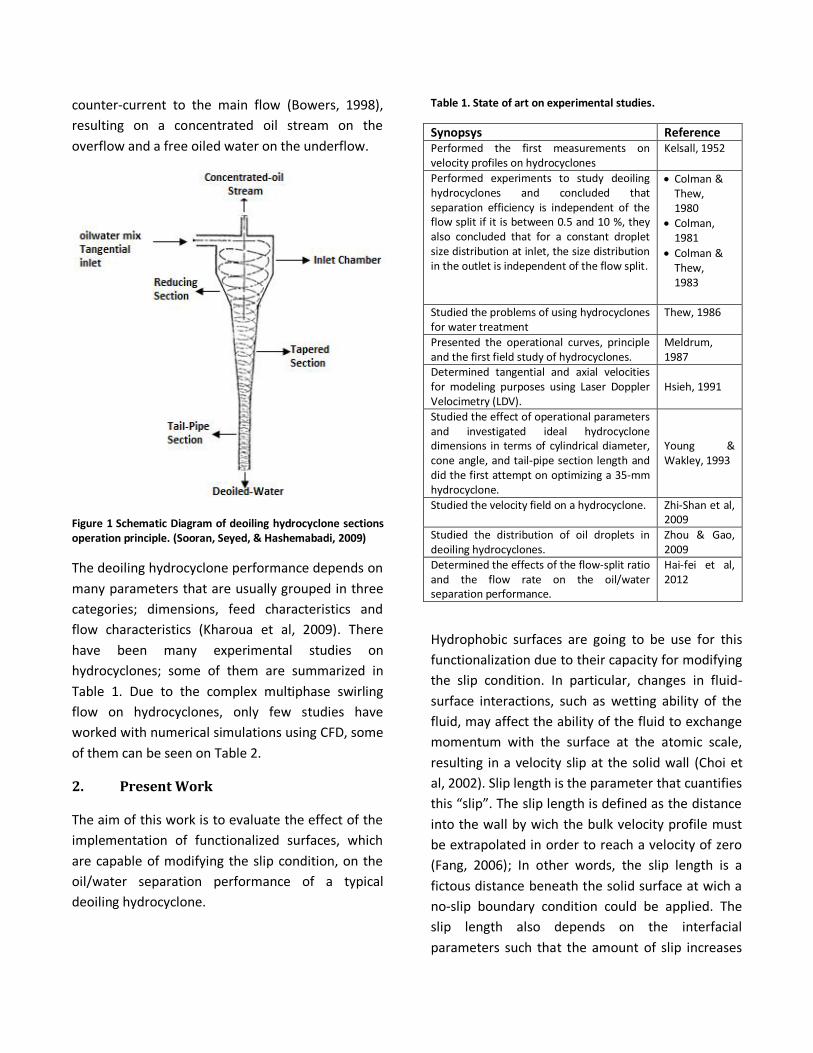
counter-current to the main flow (Bowers, 1998),
resulting on a concentrated oil stream on the
overflow and a free oiled water on the underflow.
Figure 1 Schematic Diagram of deoiling hydrocyclone sections operation principle. (Sooran, Seyed, & Hashemabadi, 2009)
The deoiling hydrocyclone performance depends on
many parameters that are usually grouped in three
categories; dimensions, feed characteristics and
flow characteristics (Kharoua et al, 2009). There
have been many experimental studies on
hydrocyclones; some of them are summarized in
Table 1. Due to the complex multiphase swirling
flow on hydrocyclones, only few studies have
worked with numerical simulations using CFD, some
of them can be seen on Table 2.
2. Present Work
The aim of this work is to evaluate the effect of the
implementation of functionalized surfaces, which
are capable of modifying the slip condition, on the
oil/water separation performance of a typical
deoiling hydrocyclone.
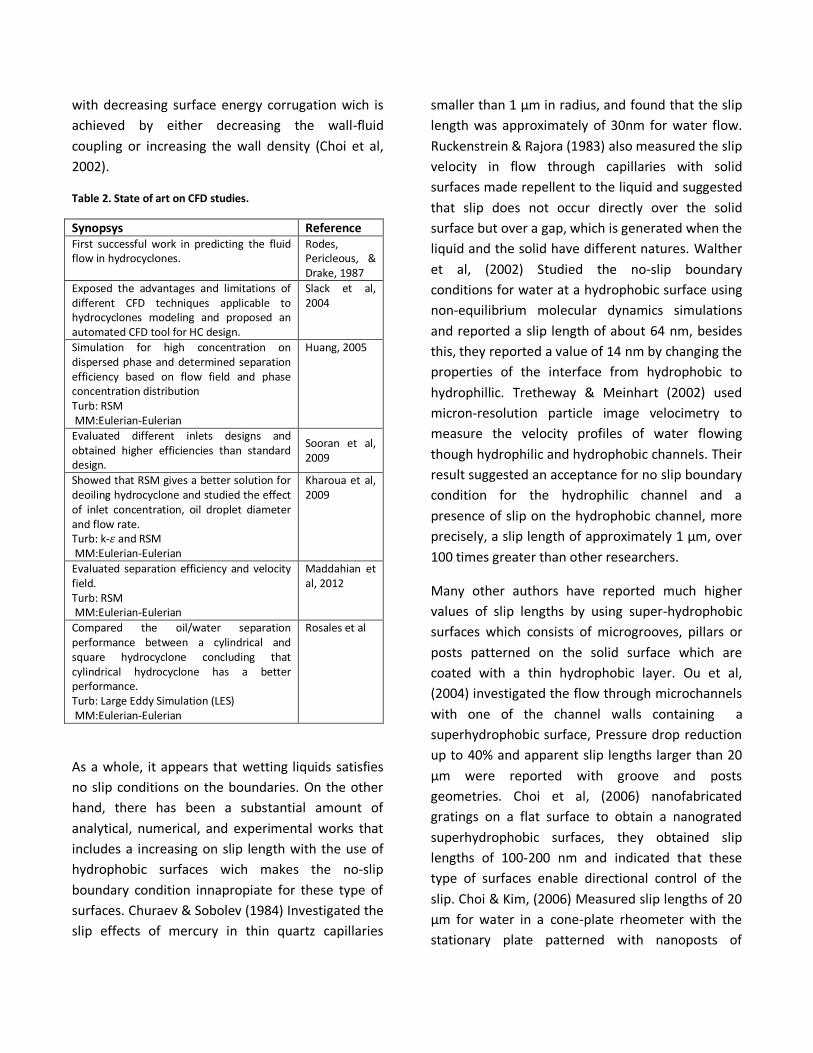
Table 1. State of art on experimental studies.
Synopsys Reference Performed the first measurements on velocity profiles on hydrocyclones
Kelsall, 1952
Performed experiments to study deoiling hydrocyclones and concluded that separation efficiency is independent of the flow split if it is between 0.5 and 10 %, they also concluded that for a constant droplet size distribution at inlet, the size distribution in the outlet is independent of the flow split.
Colman & Thew, 1980
Colman, 1981
Colman & Thew, 1983
Studied the problems of using hydrocyclones for water treatment
Thew, 1986
Presented the operational curves, principle and the first field study of hydrocyclones.
Meldrum, 1987
Determined tangential and axial velocities for modeling purposes using Laser Doppler Velocimetry (LDV).
Hsieh, 1991
Studied the effect of operational parameters and investigated ideal hydrocyclone dimensions in terms of cylindrical diameter, cone angle, and tail-pipe section length and did the first attempt on optimizing a 35-mm hydrocyclone.
Young & Wakley, 1993
Studied the velocity field on a hydrocyclone. Zhi-Shan et al, 2009
Studied the distribution of oil droplets in deoiling hydrocyclones.
Zhou & Gao, 2009
Determined the effects of the flow-split ratio and the flow rate on the oil/water separation performance.
Hai-fei et al, 2012
Hydrophobic surfaces are going to be use for this
functionalization due to their capacity for modifying
the slip condition. In particular, changes in fluid-
surface interactions, such as wetting ability of the
fluid, may affect the ability of the fluid to exchange
momentum with the surface at the atomic scale,
resulting in a velocity slip at the solid wall (Choi et
al, 2002). Slip length is the parameter that cuantifies
this “slip”. The slip length is defined as the distance
into the wall by wich the bulk velocity profile must
be extrapolated in order to reach a velocity of zero
(Fang, 2006); In other words, the slip length is a
fictous distance beneath the solid surface at wich a
no-slip boundary condition could be applied. The
slip length also depends on the interfacial
parameters such that the amount of slip increases
with decreasing surface energy corrugation wich is
achieved by either decreasing the wall-fluid
coupling or increasing the wall density (Choi et al,
2002).
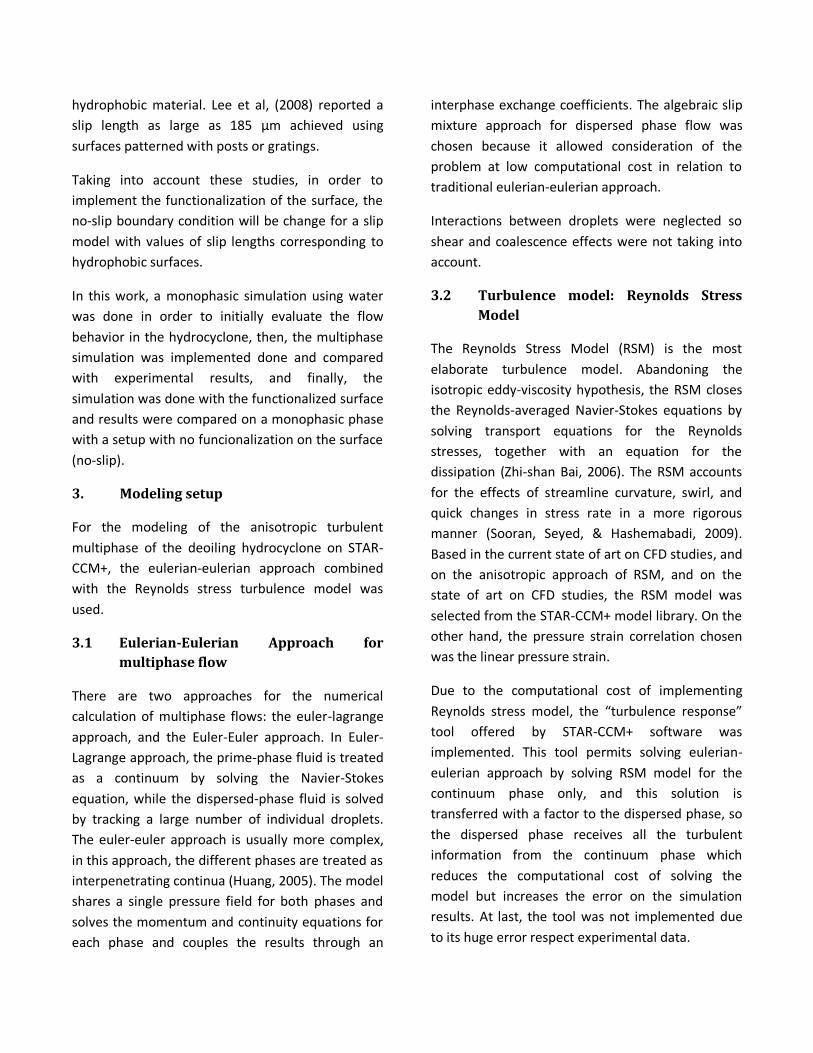
Table 2. State of art on CFD studies.
Synopsys Reference First successful work in predicting the fluid flow in hydrocyclones.
Rodes, Pericleous, & Drake, 1987
Exposed the advantages and limitations of different CFD techniques applicable to hydrocyclones modeling and proposed an automated CFD tool for HC design.
Slack et al, 2004
Simulation for high concentration on dispersed phase and determined separation efficiency based on flow field and phase concentration distribution Turb: RSM MM:Eulerian-Eulerian
Huang, 2005
Evaluated different inlets designs and obtained higher efficiencies than standard design.
Sooran et al, 2009
Showed that RSM gives a better solution for deoiling hydrocyclone and studied the effect of inlet concentration, oil droplet diameter and flow rate. Turb: k- and RSM MM:Eulerian-Eulerian
Kharoua et al, 2009
Evaluated separation efficiency and velocity field. Turb: RSM MM:Eulerian-Eulerian
Maddahian et al, 2012
Compared the oil/water separation performance between a cylindrical and square hydrocyclone concluding that cylindrical hydrocyclone has a better performance. Turb: Large Eddy Simulation (LES) MM:Eulerian-Eulerian
Rosales et al
As a whole, it appears that wetting liquids satisfies
no slip conditions on the boundaries. On the other
hand, there has been a substantial amount of
analytical, numerical, and experimental works that
includes a increasing on slip length with the use of
hydrophobic surfaces wich makes the no-slip
boundary condition innapropiate for these type of
surfaces. Churaev & Sobolev (1984) Investigated the
slip effects of mercury in thin quartz capillaries
smaller than 1 µm in radius, and found that the slip
length was approximately of 30nm for water flow.
Ruckenstrein & Rajora (1983) also measured the slip
velocity in flow through capillaries with solid
surfaces made repellent to the liquid and suggested
that slip does not occur directly over the solid
surface but over a gap, which is generated when the
liquid and the solid have different natures. Walther
et al, (2002) Studied the no-slip boundary
conditions for water at a hydrophobic surface using
non-equilibrium molecular dynamics simulations
and reported a slip length of about 64 nm, besides
this, they reported a value of 14 nm by changing the
properties of the interface from hydrophobic to
hydrophillic. Tretheway & Meinhart (2002) used
micron-resolution particle image velocimetry to
measure the velocity profiles of water flowing
though hydrophilic and hydrophobic channels. Their
result suggested an acceptance for no slip boundary
condition for the hydrophilic channel and a
presence of slip on the hydrophobic channel, more
precisely, a slip length of approximately 1 µm, over
100 times greater than other researchers.
Many other authors have reported much higher
values of slip lengths by using super-hydrophobic
surfaces which consists of microgrooves, pillars or
posts patterned on the solid surface which are
coated with a thin hydrophobic layer. Ou et al,
(2004) investigated the flow through microchannels
with one of the channel walls containing a
superhydrophobic surface, Pressure drop reduction
up to 40% and apparent slip lengths larger than 20
µm were reported with groove and posts
geometries. Choi et al, (2006) nanofabricated
gratings on a flat surface to obtain a nanograted
superhydrophobic surfaces, they obtained slip
lengths of 100-200 nm and indicated that these
type of surfaces enable directional control of the
slip. Choi & Kim, (2006) Measured slip lengths of 20
µm for water in a cone-plate rheometer with the
stationary plate patterned with nanoposts of
hydrophobic material. Lee et al, (2008) reported a
slip length as large as 185 µm achieved using
surfaces patterned with posts or gratings.
Taking into account these studies, in order to
implement the functionalization of the surface, the
no-slip boundary condition will be change for a slip
model with values of slip lengths corresponding to
hydrophobic surfaces.
In this work, a monophasic simulation using water
was done in order to initially evaluate the flow
behavior in the hydrocyclone, then, the multiphase
simulation was implemented done and compared
with experimental results, and finally, the
simulation was done with the functionalized surface
and results were compared on a monophasic phase
with a setup with no funcionalization on the surface
(no-slip).
3. Modeling setup
For the modeling of the anisotropic turbulent
multiphase of the deoiling hydrocyclone on STAR-
CCM+, the eulerian-eulerian approach combined
with the Reynolds stress turbulence model was
used.
3.1 Eulerian-Eulerian Approach for
multiphase flow
There are two approaches for the numerical
calculation of multiphase flows: the euler-lagrange
approach, and the Euler-Euler approach. In Euler-
Lagrange approach, the prime-phase fluid is treated
as a continuum by solving the Navier-Stokes
equation, while the dispersed-phase fluid is solved
by tracking a large number of individual droplets.
The euler-euler approach is usually more complex,
in this approach, the different phases are treated as
interpenetrating continua (Huang, 2005). The model
shares a single pressure field for both phases and
solves the momentum and continuity equations for
each phase and couples the results through an
interphase exchange coefficients. The algebraic slip
mixture approach for dispersed phase flow was
chosen because it allowed consideration of the
problem at low computational cost in relation to
traditional eulerian-eulerian approach.
Interactions between droplets were neglected so
shear and coalescence effects were not taking into
account.
3.2 Turbulence model: Reynolds Stress
Model
The Reynolds Stress Model (RSM) is the most
elaborate turbulence model. Abandoning the
isotropic eddy-viscosity hypothesis, the RSM closes
the Reynolds-averaged Navier-Stokes equations by
solving transport equations for the Reynolds
stresses, together with an equation for the
dissipation (Zhi-shan Bai, 2006). The RSM accounts
for the effects of streamline curvature, swirl, and
quick changes in stress rate in a more rigorous
manner (Sooran, Seyed, & Hashemabadi, 2009).
Based in the current state of art on CFD studies, and
on the anisotropic approach of RSM, and on the
state of art on CFD studies, the RSM model was
selected from the STAR-CCM+ model library. On the
other hand, the pressure strain correlation chosen
was the linear pressure strain.
Due to the computational cost of implementing
Reynolds stress model, the “turbulence response”
tool offered by STAR-CCM+ software was
implemented. This tool permits solving eulerian-
eulerian approach by solving RSM model for the
continuum phase only, and this solution is
transferred with a factor to the dispersed phase, so
the dispersed phase receives all the turbulent
information from the continuum phase which
reduces the computational cost of solving the
model but increases the error on the simulation
results. At last, the tool was not implemented due
to its huge error respect experimental data.
3.3 Surface Functionalization
In order to implement the surface functionalization
the no-slip boundary condition will be abandoned
and a slip model will be used, this model is
described on the following expression:
In Equation 1, is the velocity at the wall, is
the slip length, and is the normal at the wall
inwards to the liquid.
The no-slip boundary condition was chosen on
STAR-CCM+ software with an option for fixing the
velocity at the wall instead of using the
conventional configuration which fixes a zero
velocity at the wall, this velocity was calculated with
an user function that takes into account the slip
model previously shown. For the implementation of
the model, a value of 1 µm of slip length was used
which was a value obtained by Tretheway &
Meinhart, (2002) and a value of 5 µm that was
chosen in order to verify the independence of the
solution with slip length. It is important that lower
and upper values of slip lengths are proven on a
future work due to the wide gap of slip lengths
values that are reported on literature; the upper
values of slip length can be proven by using high
values of slip length or by changing the geometric
slip configuration in order to represent the patterns
present on these super-hydrophobic surfaces.
As it is seen on the slip model, the velocity is
calculated for one direction, so these model will be
extrapolated for three dimensions by using the
same value of slip length as an approximation for
this work.
These functionalization was programmed by using
the following user-defined function:
Were is the instant velocity at the wall, is the
slip length and is the slip velocity that will be
calculated by this function. Besides the user
function, a table is created, this table is filled with
the result of the user function in every cell that
touches the wall; and the information of these table
is used as the velocity vector fixed on the slip
boundary condition.
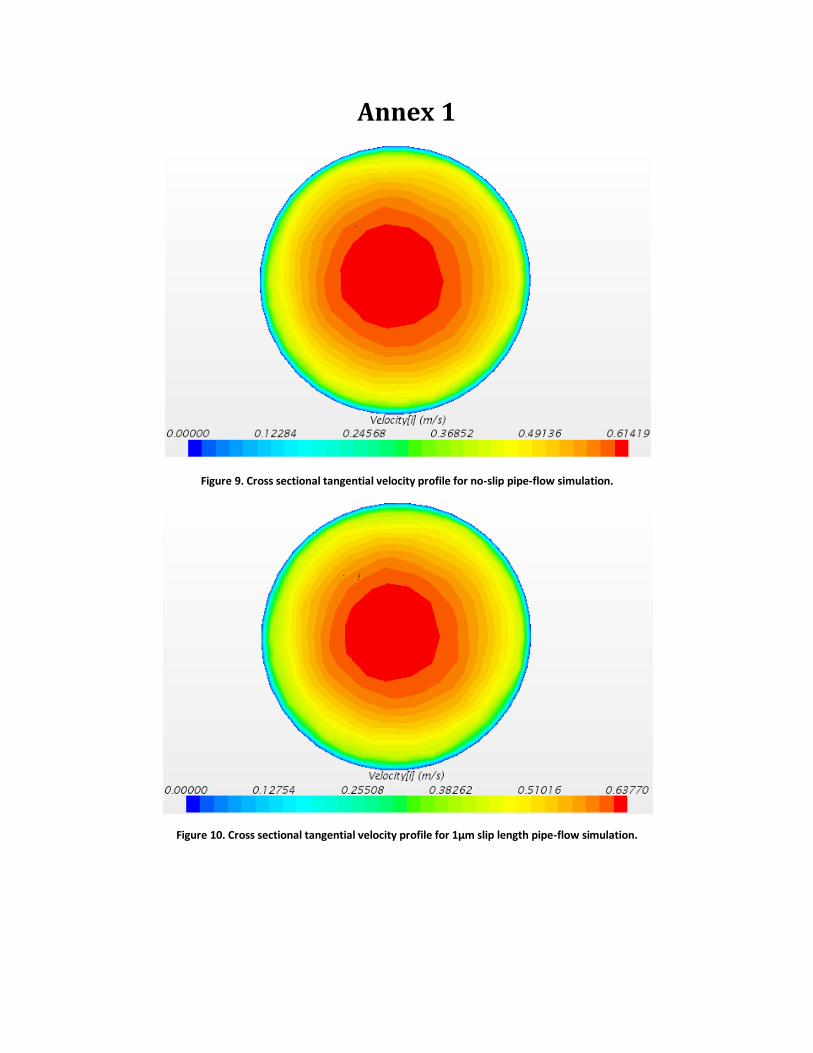
Two simple pipe flow simulations were done to
represent how this boundary condition works, one
of them with a conventional no-slip boundary
conditions and the other with a 1 µm slip. A velocity
inlet and pressure outlet boundary conditions were
chosen with a velocity of 0.5m/s at inlet. Velocity
profiles of the same cross sectional area were
obtained as it is seen on Figures 9-10 on Annex 1,
these figures shows the expected results because
the slip simulations shows higher velocity values on
its profiles, this is seen on the maximum value on
the color bar which represent the maximum
velocity value present on the profile. This is an
expected result due to the non-zero velocity of a
slip boundary condition which is seen on the
profiles. This situation can also be visualized on
Graph 1.
As it is seen, the slip boundary condition had an
expected effect on the simulation, therefore it could
be implemented on the hydrocyclone, however,
due to convergence problems present on the
multiphase simulation, the analysis was done on the
single phase simulation for the reasons that will be
explained on the next section. Although, multiphase
simulation results will still be shown as an
advancement for a future work.
3.4 Single Phase Analysis for the effect of
surface functionalization.
The main reason for the convergence problems
mentioned is that the table that contains the
information for the slip velocity in each cell must be
constantly updated with a new calculation of slip
velocity that uses the velocity on the wall of the
actual iteration, these updates are necessary in
ordered to maintain a proper value for the
boundary condition.
The update frequency of these boundary condition
is a key parameter for the convergence of the
simulation, low frequencies are needed at the
beginning of the simulation followed by higher
frequencies, if necessary, until the boundary
condition and solution converges together. Due to
the need of unsteady simulations for the multiphase
flow, convergence by managing these updates
becomes challenging since you have to update your
boundary condition in iterations and time steps
which forces the user to constantly modify the
number of iterations per time step and the update
frequency in order to maintain a proper and stable
solution. With the advance of iterations and time.
Due to this situation, it was decided to try running
the simulation in different trials using combinations
of iterations per time step and update frequencies.
On these trials, low and high numbers of inner
iterations were tried with high and low frequencies
in around 6 different trials. Low frequencies with
high number of inner iterations did not diverge but
its simulation time was enormously large. None of
the other trials converged, so it was not possible to
do a correct comparison using the multiphase
simulation.
Due to the lack of convergence on the modified
multiphase simulation, it was decided to implement
the surface functionalization on the single phase
simulation for its simplicity on convergence. In
order to maintain the aim of this work, pressure,
tangential velocity, and axial velocity distributions
were obtained for the functionalized and for the
conventional single phase hydrocyclone in order to
find important differences that could theoretically
influence the separation performance.
4. Problem Identification
4.1 Geometry
In this study a standard hydrocyclone design was
used, the geometry details of the design can be
seen on Figure 11 on annex 1. Which is the same
design used in (Sooran et al, 2009).
This is a vertical hydrocyclone but is on a horizontal
perspective so gravity acts from left to right, the
geometric diagram of the hydrocyclone can be seen
on Annex 1.
4.2 Boundary Conditions
Three types of boundaries were used for the
simulations
Inlet: A velocity-inlet boundary condition was used
for a flow rate of
(Sooran, Seyed, &
Hashemabadi, 2009).
For the multiphase simulation, oil enters with a
volume fraction of 5% and water with a fraction of
95%.
Outlet: 2 pressure-outlet boundary conditions were
used with 0Pa and 37 kPa on the overflow and
underflow respectively (Sooran, Seyed, &
Hashemabadi, 2009).
Wall: No slip condition is assumed on walls for the
conventional simulation; Implementation of the slip
model was done for the modified simulation (slip
length
The properties of both phases (oil and water) are
summarized on Table 3.
Table 3. Fluid Properties used in the simulation.
Component
Oil 850 0.00332 Water 998 0.001
4.3 Mesh Generation
For a marginal error reduction and for a mesh
independency test, 6 different meshes were
generated and studied for the single phase
simulation using water with the following
procedure:
First, two tetrahedral meshes were generated, one
with a base size of 0.004m (303448 cells) and
another one with 0.002m (462500 cells). Their
residuals were compared and their pressure profiles
were obtained and compared noting that they had
similar results but the finer mesh had much higher
residuals.
After this method, 2 polyhedral meshes were
generated with the following base sizes: 0.002 m
(123400 cells), 0.001 m (240700 cells). As it was
done for tetrahedral meshes, their residuals and
pressure profiles were compared noting that
tetrahedral meshes had a better result.
At last, taking into account that the best result was
on 0.004 m base size-tetrahedral mesh a
modification was done on this trial. A cylindrical
shape volumetric control mesh was generated on
the axis of the hydrocyclone were the profile
showed the low-pressure core (vortex). This was
done in order to refine the mesh in this area due to
the big gradients present in the vortex, this
refinement can be appreciate in Figure 12, Annex 1
which is a cross sectional area of the hydrocyclone.
This last generated mesh resulted on a similar result
so it was concluded that the final mesh will be the
conventional 0.004m base size tetrahedral mesh.
The final mesh can be seen on Figure 2, and residual
plot can be seen on Figure 13 in annex 1.
Experimental results were not used for the mesh
analysis because there was not experimental data
for the single phase hydrocyclone.
5. Monophasic simulations results,
analysis, and comparisons.
Taking into account that the purpose of this work is
to analyze the effect of the surface modification of a
deoiling hydrocyclone: at first, a monophasic
simulation (using water) was done to be sure that
the hydrodynamics on the hydrocyclone were as
they should; At last, due to the convergence
problems presented on the modified multiphase
simulation, the surface functionalization was done
on the monophasic simulation, so pressure,
tangential velocity, and axial velocity distributions
were obtained for the functionalized and for the
conventional single phase hydrocyclone in order to
analyze the flow behavior to be sure that the
hydrodynamics on the hydrocyclone were as they
should and to find important differences that could
theoretically influence the separation performance.
5.1 Convergence of the modified
simulation.
As it was expected, convergence on the single phase
simulation was much easier, although it was
necessary to run the unmodified simulation and
when the solution stabilized the new boundary
condition was implemented with an update
frequency of 1 update every 100 iterations until the
new boundary condition converged within the
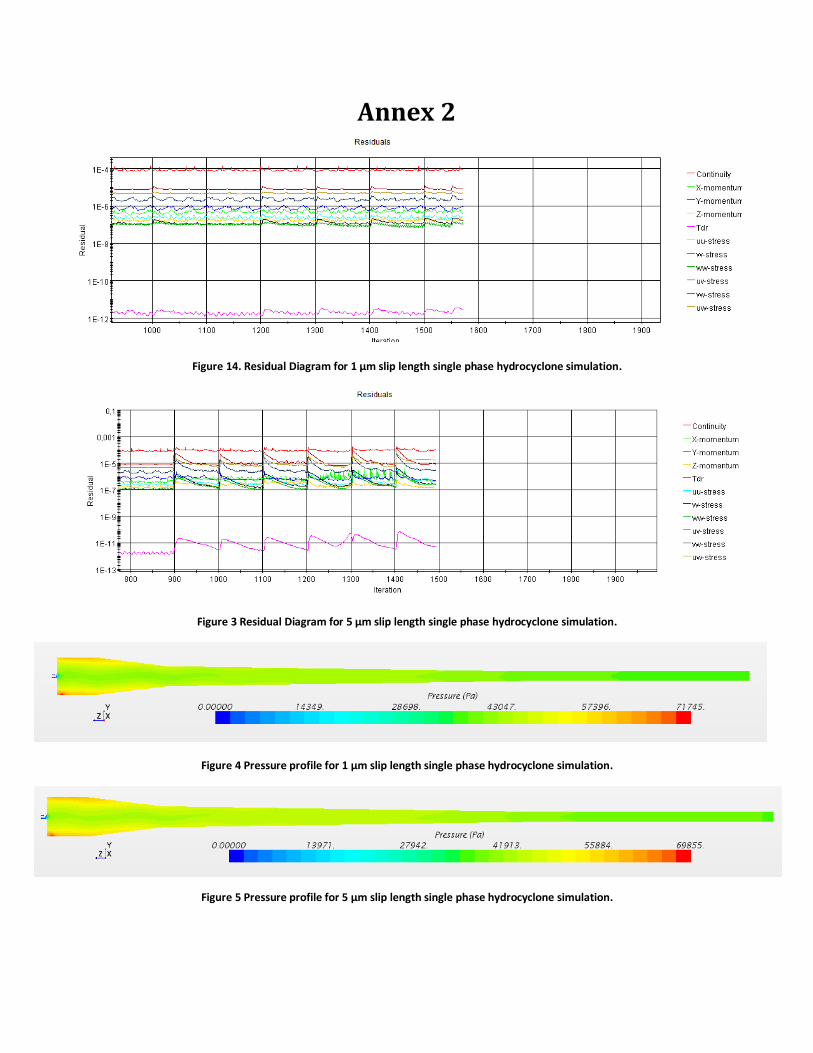
solution. Residuals diagrams of both modified
simulations can be seen on Annex 2 Figures 14-15.
5.2 Pressure Distribution
The distributions of pressure can be seen on Figure
4 and on Annex 2. At first, we can see that there
was no significant difference on the pressure
profiles presented in Figures 16-17 so focus will be
only on the unmodified simulation; there are
considerable pressure differences in radial and axial
directions, so the oil-water separation principle of
operation can be explained from here. The pressure
difference in
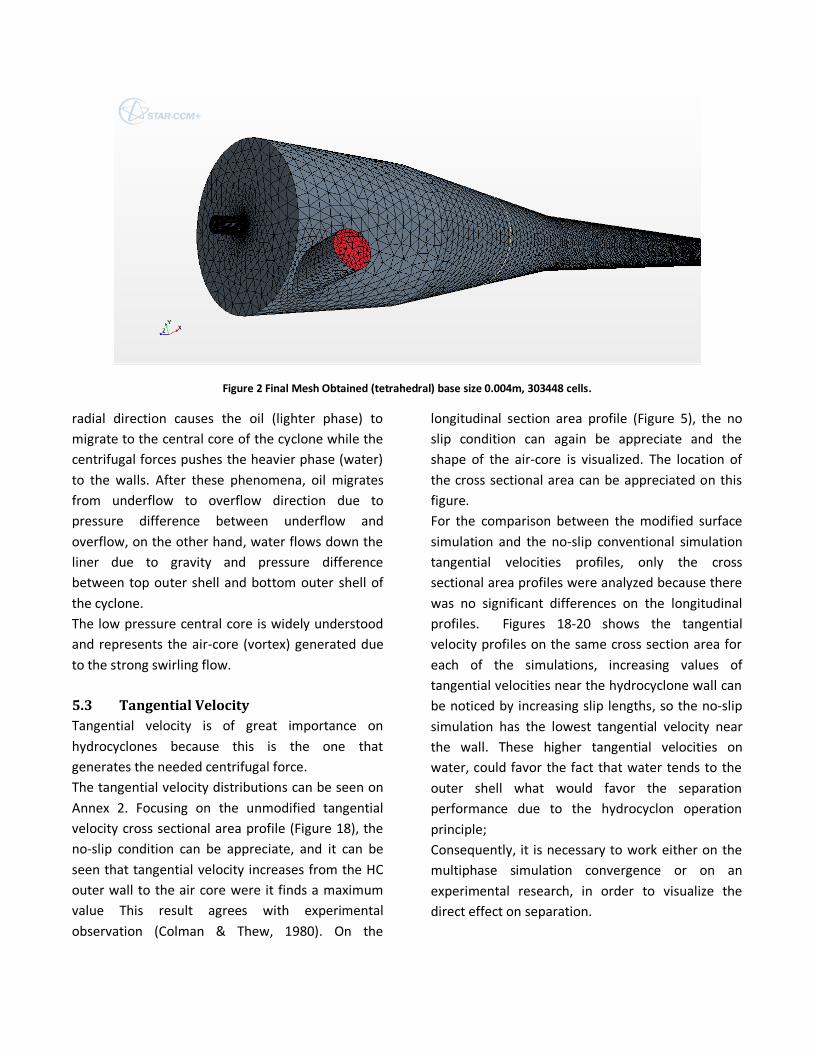
Figure 2 Final Mesh Obtained (tetrahedral) base size 0.004m, 303448 cells.
radial direction causes the oil (lighter phase) to
migrate to the central core of the cyclone while the
centrifugal forces pushes the heavier phase (water)
to the walls. After these phenomena, oil migrates
from underflow to overflow direction due to
pressure difference between underflow and
overflow, on the other hand, water flows down the
liner due to gravity and pressure difference
between top outer shell and bottom outer shell of
the cyclone.
The low pressure central core is widely understood
and represents the air-core (vortex) generated due
to the strong swirling flow.
5.3 Tangential Velocity
Tangential velocity is of great importance on
hydrocyclones because this is the one that
generates the needed centrifugal force.
The tangential velocity distributions can be seen on
Annex 2. Focusing on the unmodified tangential
velocity cross sectional area profile (Figure 18), the
no-slip condition can be appreciate, and it can be
seen that tangential velocity increases from the HC
outer wall to the air core were it finds a maximum
value This result agrees with experimental
observation (Colman & Thew, 1980). On the
longitudinal section area profile (Figure 5), the no
slip condition can again be appreciate and the
shape of the air-core is visualized. The location of
the cross sectional area can be appreciated on this
figure.
For the comparison between the modified surface
simulation and the no-slip conventional simulation
tangential velocities profiles, only the cross
sectional area profiles were analyzed because there
was no significant differences on the longitudinal
profiles. Figures 18-20 shows the tangential
velocity profiles on the same cross section area for
each of the simulations, increasing values of
tangential velocities near the hydrocyclone wall can
be noticed by increasing slip lengths, so the no-slip
simulation has the lowest tangential velocity near
the wall. These higher tangential velocities on
water, could favor the fact that water tends to the
outer shell what would favor the separation
performance due to the hydrocyclon operation
principle;
Consequently, it is necessary to work either on the
multiphase simulation convergence or on an
experimental research, in order to visualize the
direct effect on separation.
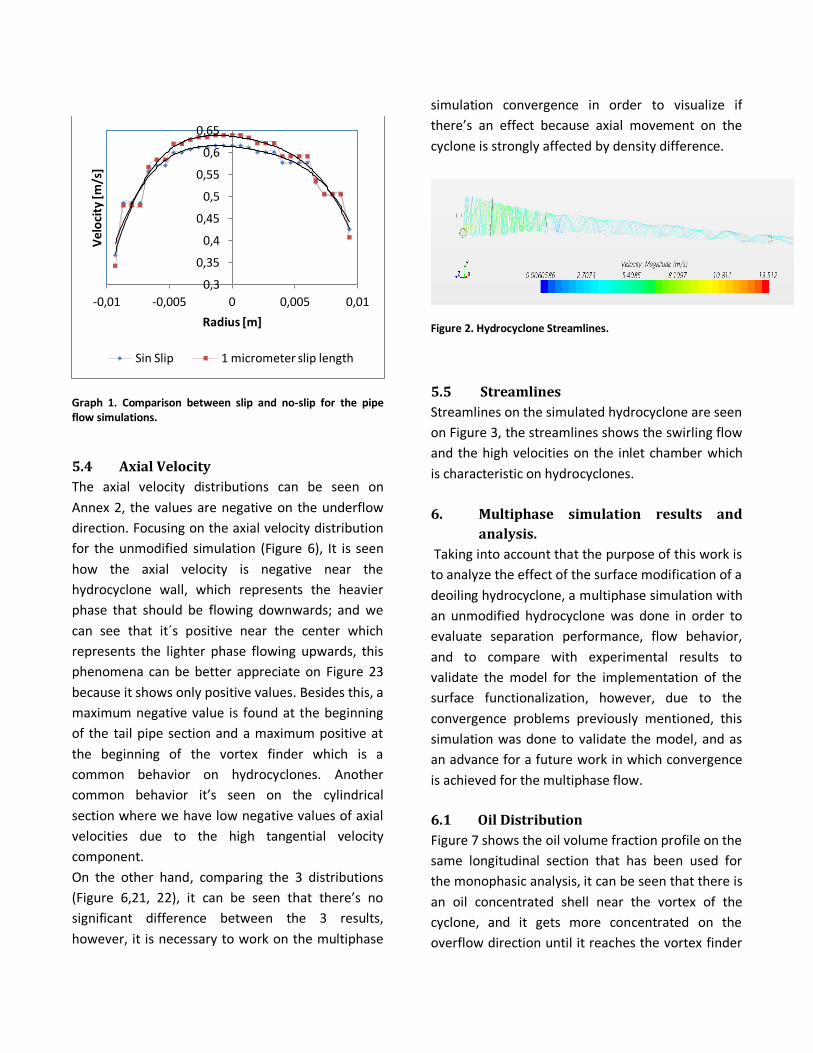
Graph 1. Comparison between slip and no-slip for the pipe flow simulations.
5.4 Axial Velocity
The axial velocity distributions can be seen on
Annex 2, the values are negative on the underflow
direction. Focusing on the axial velocity distribution
for the unmodified simulation (Figure 6), It is seen
how the axial velocity is negative near the
hydrocyclone wall, which represents the heavier
phase that should be flowing downwards; and we
can see that it´s positive near the center which
represents the lighter phase flowing upwards, this
phenomena can be better appreciate on Figure 23
because it shows only positive values. Besides this, a
maximum negative value is found at the beginning
of the tail pipe section and a maximum positive at
the beginning of the vortex finder which is a
common behavior on hydrocyclones. Another
common behavior it’s seen on the cylindrical
section where we have low negative values of axial
velocities due to the high tangential velocity
component.
On the other hand, comparing the 3 distributions
(Figure 6,21, 22), it can be seen that there’s no
significant difference between the 3 results,
however, it is necessary to work on the multiphase
simulation convergence in order to visualize if
there’s an effect because axial movement on the
cyclone is strongly affected by density difference.
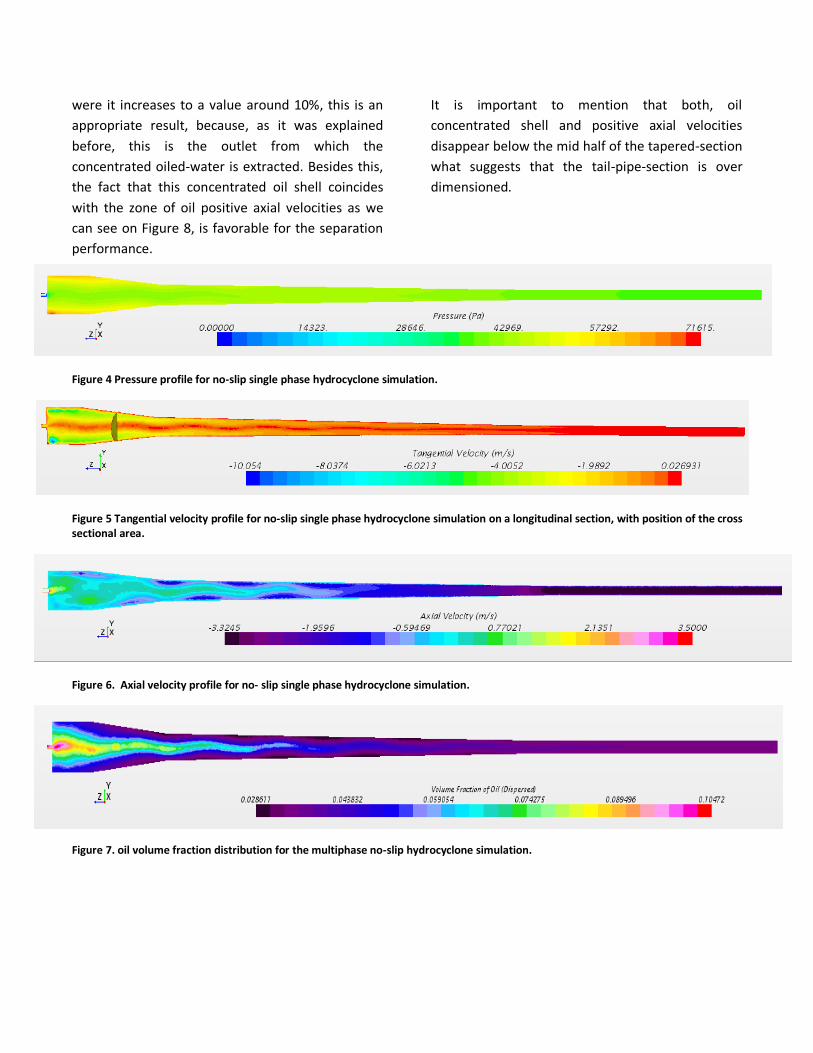
Figure 2. Hydrocyclone Streamlines.
5.5 Streamlines
Streamlines on the simulated hydrocyclone are seen
on Figure 3, the streamlines shows the swirling flow
and the high velocities on the inlet chamber which
is characteristic on hydrocyclones.
6. Multiphase simulation results and
analysis.
Taking into account that the purpose of this work is
to analyze the effect of the surface modification of a
deoiling hydrocyclone, a multiphase simulation with
an unmodified hydrocyclone was done in order to
evaluate separation performance, flow behavior,
and to compare with experimental results to
validate the model for the implementation of the
surface functionalization, however, due to the
convergence problems previously mentioned, this
simulation was done to validate the model, and as
an advance for a future work in which convergence
is achieved for the multiphase flow.
6.1 Oil Distribution
Figure 7 shows the oil volume fraction profile on the
same longitudinal section that has been used for
the monophasic analysis, it can be seen that there is
an oil concentrated shell near the vortex of the
cyclone, and it gets more concentrated on the
overflow direction until it reaches the vortex finder
0,3
0,35
0,4
0,45
0,5
0,55
0,6
0,65
-0,01 -0,005 0 0,005 0,01
Ve
loci
ty [
m/s
]
Radius [m]
Sin Slip 1 micrometer slip length
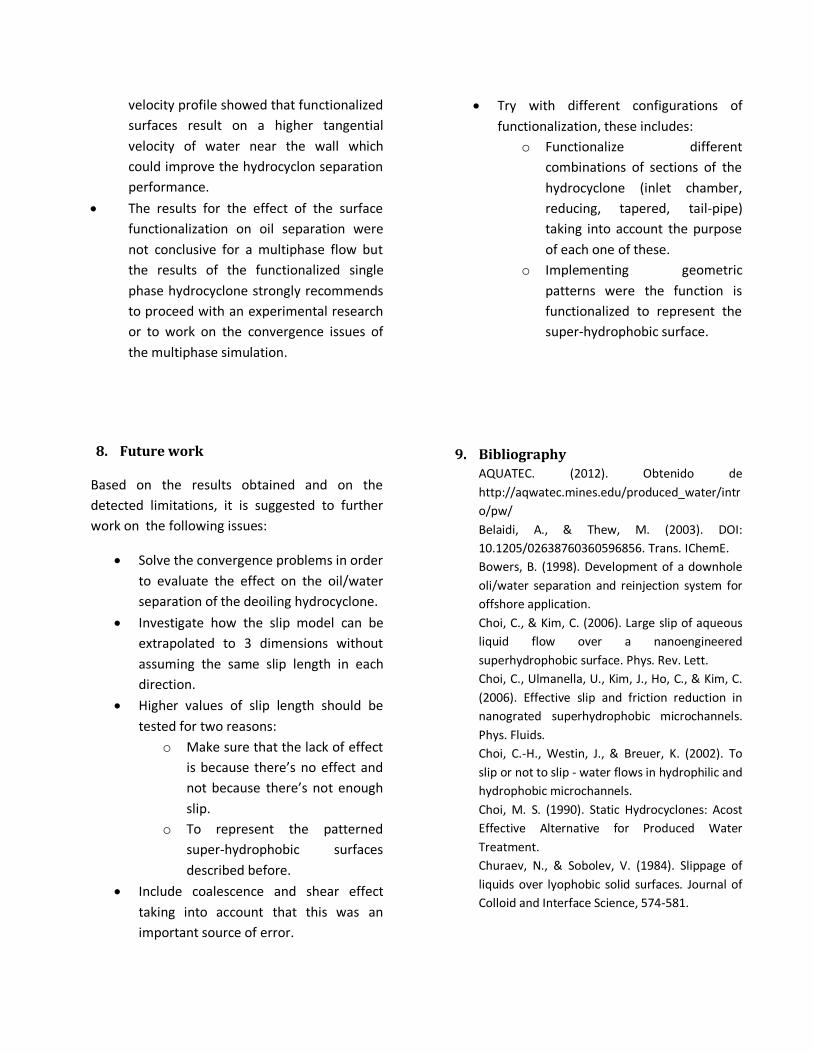
were it increases to a value around 10%, this is an
appropriate result, because, as it was explained
before, this is the outlet from which the
concentrated oiled-water is extracted. Besides this,
the fact that this concentrated oil shell coincides
with the zone of oil positive axial velocities as we
can see on Figure 8, is favorable for the separation
performance.
It is important to mention that both, oil
concentrated shell and positive axial velocities
disappear below the mid half of the tapered-section
what suggests that the tail-pipe-section is over
dimensioned.
Figure 4 Pressure profile for no-slip single phase hydrocyclone simulation.
Figure 5 Tangential velocity profile for no-slip single phase hydrocyclone simulation on a longitudinal section, with position of the cross sectional area.
Figure 6. Axial velocity profile for no- slip single phase hydrocyclone simulation.
Figure 7. oil volume fraction distribution for the multiphase no-slip hydrocyclone simulation.
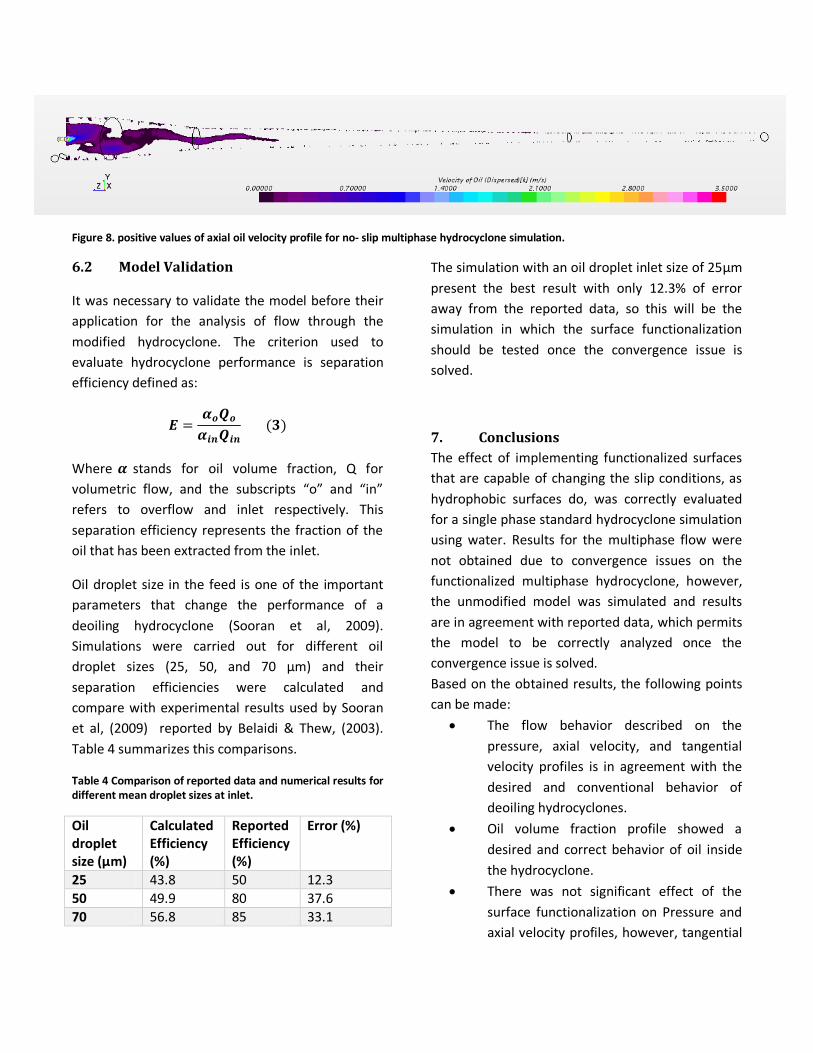
Figure 8. positive values of axial oil velocity profile for no- slip multiphase hydrocyclone simulation.
6.2 Model Validation
It was necessary to validate the model before their
application for the analysis of flow through the
modified hydrocyclone. The criterion used to
evaluate hydrocyclone performance is separation
efficiency defined as:
Where stands for oil volume fraction, Q for
volumetric flow, and the subscripts “o” and “in”
refers to overflow and inlet respectively. This
separation efficiency represents the fraction of the
oil that has been extracted from the inlet.
Oil droplet size in the feed is one of the important
parameters that change the performance of a
deoiling hydrocyclone (Sooran et al, 2009).
Simulations were carried out for different oil
droplet sizes (25, 50, and 70 µm) and their
separation efficiencies were calculated and
compare with experimental results used by Sooran
et al, (2009) reported by Belaidi & Thew, (2003).
Table 4 summarizes this comparisons.
Table 4 Comparison of reported data and numerical results for different mean droplet sizes at inlet.
Oil droplet size (µm)
Calculated Efficiency (%)
Reported Efficiency (%)
Error (%)
25 43.8 50 12.3
50 49.9 80 37.6
70 56.8 85 33.1
The simulation with an oil droplet inlet size of 25µm
present the best result with only 12.3% of error
away from the reported data, so this will be the
simulation in which the surface functionalization
should be tested once the convergence issue is
solved.
7. Conclusions
The effect of implementing functionalized surfaces
that are capable of changing the slip conditions, as
hydrophobic surfaces do, was correctly evaluated
for a single phase standard hydrocyclone simulation
using water. Results for the multiphase flow were
not obtained due to convergence issues on the
functionalized multiphase hydrocyclone, however,
the unmodified model was simulated and results
are in agreement with reported data, which permits
the model to be correctly analyzed once the
convergence issue is solved.
Based on the obtained results, the following points
can be made:
The flow behavior described on the
pressure, axial velocity, and tangential
velocity profiles is in agreement with the
desired and conventional behavior of
deoiling hydrocyclones.
Oil volume fraction profile showed a
desired and correct behavior of oil inside
the hydrocyclone.
There was not significant effect of the
surface functionalization on Pressure and
axial velocity profiles, however, tangential
velocity profile showed that functionalized
surfaces result on a higher tangential
velocity of water near the wall which
could improve the hydrocyclon separation
performance.
The results for the effect of the surface
functionalization on oil separation were
not conclusive for a multiphase flow but
the results of the functionalized single
phase hydrocyclone strongly recommends
to proceed with an experimental research
or to work on the convergence issues of
the multiphase simulation.
8. Future work
Based on the results obtained and on the
detected limitations, it is suggested to further
work on the following issues:
Solve the convergence problems in order
to evaluate the effect on the oil/water
separation of the deoiling hydrocyclone.
Investigate how the slip model can be
extrapolated to 3 dimensions without
assuming the same slip length in each
direction.
Higher values of slip length should be
tested for two reasons:
o Make sure that the lack of effect
is because there’s no effect and
not because there’s not enough
slip.
o To represent the patterned
super-hydrophobic surfaces
described before.
Include coalescence and shear effect
taking into account that this was an
important source of error.
Try with different configurations of
functionalization, these includes:
o Functionalize different
combinations of sections of the
hydrocyclone (inlet chamber,
reducing, tapered, tail-pipe)
taking into account the purpose
of each one of these.
o Implementing geometric
patterns were the function is
functionalized to represent the
super-hydrophobic surface.
9. Bibliography
AQUATEC. (2012). Obtenido de
http://aqwatec.mines.edu/produced_water/intr
o/pw/
Belaidi, A., & Thew, M. (2003). DOI:
10.1205/02638760360596856. Trans. IChemE.
Bowers, B. (1998). Development of a downhole
oli/water separation and reinjection system for
offshore application.
Choi, C., & Kim, C. (2006). Large slip of aqueous
liquid flow over a nanoengineered
superhydrophobic surface. Phys. Rev. Lett.
Choi, C., Ulmanella, U., Kim, J., Ho, C., & Kim, C.
(2006). Effective slip and friction reduction in
nanograted superhydrophobic microchannels.
Phys. Fluids.
Choi, C.-H., Westin, J., & Breuer, K. (2002). To
slip or not to slip - water flows in hydrophilic and
hydrophobic microchannels.
Choi, M. S. (1990). Static Hydrocyclones: Acost
Effective Alternative for Produced Water
Treatment.
Churaev, N., & Sobolev, V. (1984). Slippage of
liquids over lyophobic solid surfaces. Journal of
Colloid and Interface Science, 574-581.
Colman, D. (1981). The Hydrocyclone for
separating light dispersions. PhD. Thesis
Southampton University.
Colman, D., & Thew, M. (1980). Hydrocyclone to
give a highly concentrated sample of lighter
dispersed phase. 209-223.
Colman, D., & Thew, M. (1983). Correlation of
separation results from light dispersion
hydrocyclones. Chem. Eng. Res. DeS, 233-240.
Fang, X. (2006). Study of Wall Slip in Entangled
Polymer Melts using Stochastic Simulation`. En
X. Fang, Study of Wall Slip in Entangled Polymer
Melts using Stochastic Simulation` (pág. 32).
Hai-fei, L., Jing-yu, X., Jun, Z., Huan-qiang, S.,
Jian, Z., & Ying-xiang, W. (2012). Oil/water
separation in a liquid-Liquid Cylindrical Cyclone.
Journal of Hydrodynamics, 116-123.
Hsieh, R. (1991). Mathematical model of the
hydrocyclone separator based on physics of fluid
flow. AICHE Journal, 302-312.
Huang, S. (2005). Numerical simulation of oil-
water hydrocyclone using reynolds-stress model
for eulerian multiphase flows. the canadian
journal of chemichal engineering.
Jose A. Delgadillo, R. K. (2005). A comparative
study of three turbulence-closure models for the
hydrocyclone problem. Mineral Processing, 217-
230.
Kelsall, D. (1952). A study of the motion of solid
particles in a hydrocyclone. Transactions of the
institution on Chemichal Engineering, 87-104.
Kharoua, N., Khezzar, L., & Nemouchi, Z. (2009).
Computational fluid dynamics study of the
parameters affecting oil-water hydrocyclone
perfomance. Procces Mechanical Engineering.
Lee, C., Choi, C., & Kim, C. (2008). Structured
surfaces for a giant liquid slip. Phys Rev Lett.
Maddahian , R., Asadi , M., & Farhanieh, B.
(2012). Numerical investigation of the velocity
field and separation efficiency of deoling
hydrocyclones. Pet.Sci, 511-520.
Meldrum, N. (1987). Hydrocyclones: A solution
to Produced-Water Treatment.
Meldrum, N. (s.f.). Hydrociclones: A solution to
produced water treatment. SPE Production
engineering.
Ou, J., Perot, B., & Rothstein, J. (2004). Laminar
drag reduction in microchannels using
ultrahydrophobic surfaces. Phys. Fluids.
Rodes, N., Pericleous, K., & Drake, S. (1987). The
prediction of hydrocyclone perfomance with a
mathematichal model. Process International
Conference on Hydrocyclone, 113-117.
Rosales, C., Barron, M., Hilerio, I., & Medina, D.
(s.f.). Computer simulation of water-oil
separation in cylindrical and square
hydrocyclones. Departamento de Materiales,
Universidad Autonoma Metropolitana.
Ruckenstrein , E., & Rajora, P. (1983). On the no-
slip boundary condition of hydrodynamics.
Journal of Colloid and Interface Science, 488-
491.
RWL Water group. (s.f.). RWL Water group.
Obtenido de
http://www.rwlwater.com/estudio-de-caso-
campo-petrolifero-pacific-rubiales/?lang=es
Schnell, E. (1956). Slippage of water over
nonwettable surfaces. Journal of Applied
Physics, 1149-1152.
Schubert, M. (1992). Advancements in liquid
hydrocyclone separation system.
Slack, M., Del Porte, S., & Engelman, M. (2004).
Designing automated computational fluid
dynamics modelling tools for hydrocyclone
design. Minerals Engineering, 705-711.
Sooran, N., Seyed, H., & Hashemabadi. (2009).
CFD Simulation of inlet design effect on deoiling
hydrocyclone separation efficiency. Chem. Eng.
Technol., 1885-1893.
Thew, M. (1986). Hydrocyclone redesign for
liquid-liquid separation. The Vhem. Engineer,
17-23.
Tretheway, D., & Meinhart, C. (2002). Apparent
fluid slip at hydrophobic microchannel walls.
Physics of Fluids.
Universidad Estatal de Nuevo Mexico, Centro de
investigacion agricola Farmington. (2012).
Manejo de la produccion de agua: de residuo a
recurso.
Walther, J., Jaffet, R., Werder, T., Halicioglut, T.,
& Koumoutsakos, P. (2002). On the boundary
condition for water at a hydrophobic, dense
surface.
Woodruff, A. (1990). Cyclones sweep through
the north sea. PROSPECT, British Technology
Group.
Young, G. A., & Wakley, W. D. (1993). Oil-Water
separation using hydrocyclones: An
experimental search for optimum dimensions.
Zhi-shan Bai, H.-l. W. (2006). Numerical
simulation of the separating perfomance oh
hydrocyclones. Chem. Eng. Technol, 1161-1166.
Zhi-Shan, B., Hua-lin, W., & Shan-Tung, T. (2009).
Experimental study of flow patterns in deoiling
hydrocyclone. Minerals Engineering, 319-323.
Zhou, N., & Gao, Y. (2009). Investigation of
velocity field and oil distribution in an oil-water
hydrocycloneusing particle dynamics analyzer.
Chemichal Engineering Journal, 73-79.
Annex 1
Figure 9. Cross sectional tangential velocity profile for no-slip pipe-flow simulation.
Figure 10. Cross sectional tangential velocity profile for 1µm slip length pipe-flow simulation.
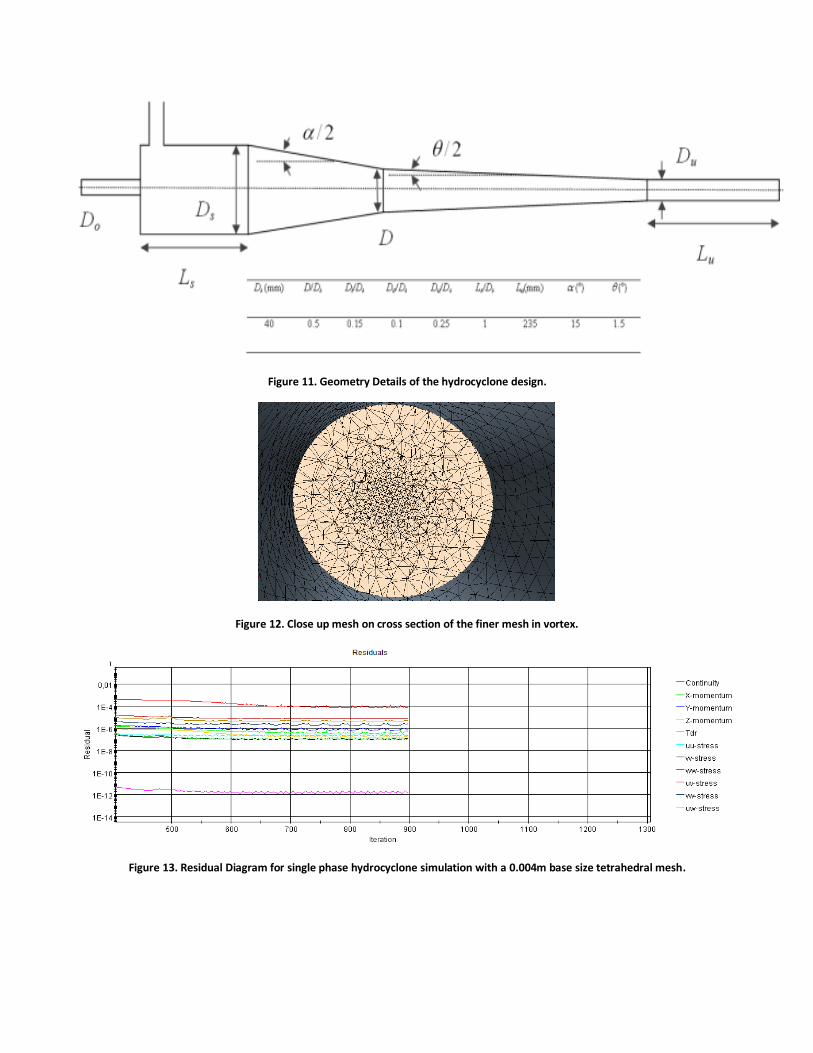
Figure 11. Geometry Details of the hydrocyclone design.
Figure 12. Close up mesh on cross section of the finer mesh in vortex.
Figure 13. Residual Diagram for single phase hydrocyclone simulation with a 0.004m base size tetrahedral mesh.
Annex 2
Figure 14. Residual Diagram for 1 µm slip length single phase hydrocyclone simulation.
Figure 3 Residual Diagram for 5 µm slip length single phase hydrocyclone simulation.
Figure 4 Pressure profile for 1 µm slip length single phase hydrocyclone simulation.
Figure 5 Pressure profile for 5 µm slip length single phase hydrocyclone simulation.
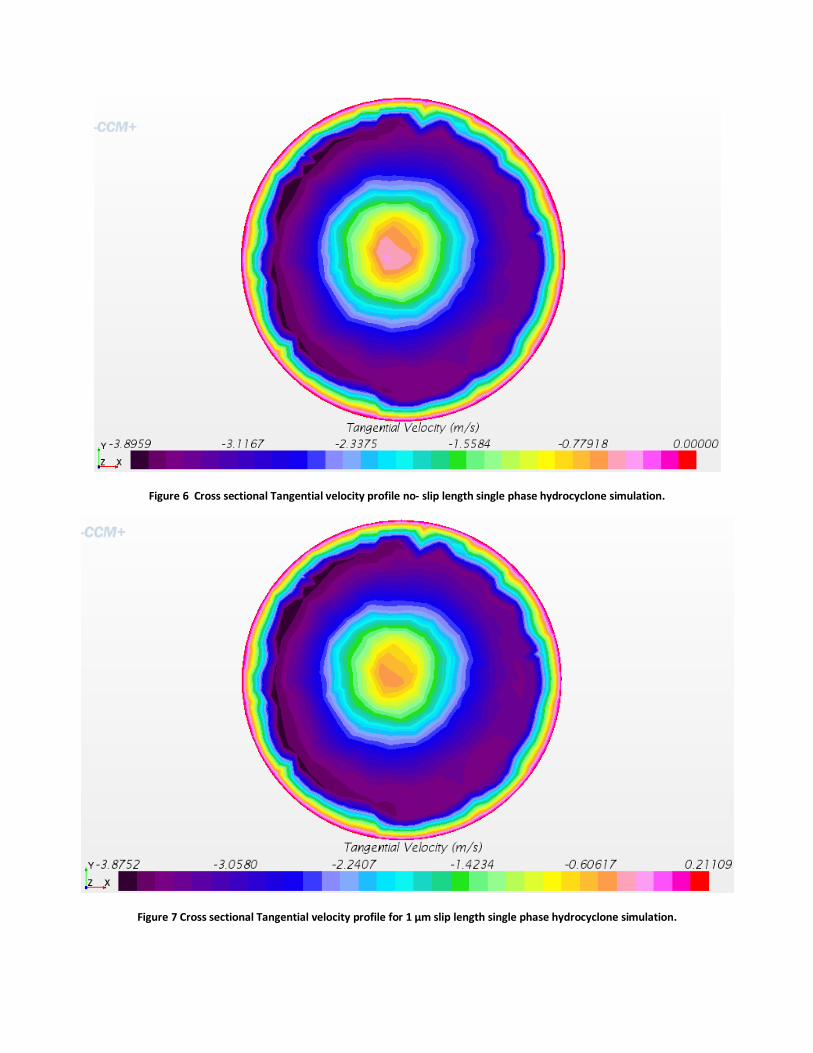
Figure 6 Cross sectional Tangential velocity profile no- slip length single phase hydrocyclone simulation.
Figure 7 Cross sectional Tangential velocity profile for 1 µm slip length single phase hydrocyclone simulation.
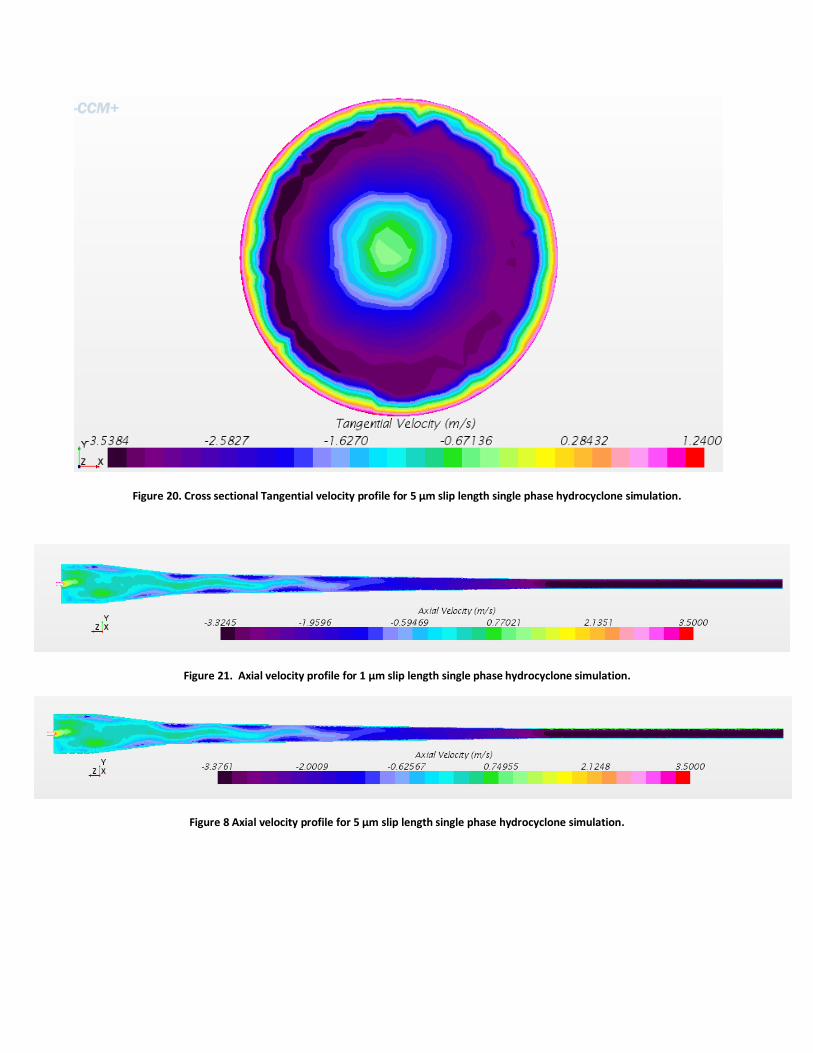
Figure 20. Cross sectional Tangential velocity profile for 5 µm slip length single phase hydrocyclone simulation.
Figure 21. Axial velocity profile for 1 µm slip length single phase hydrocyclone simulation.
Figure 8 Axial velocity profile for 5 µm slip length single phase hydrocyclone simulation.
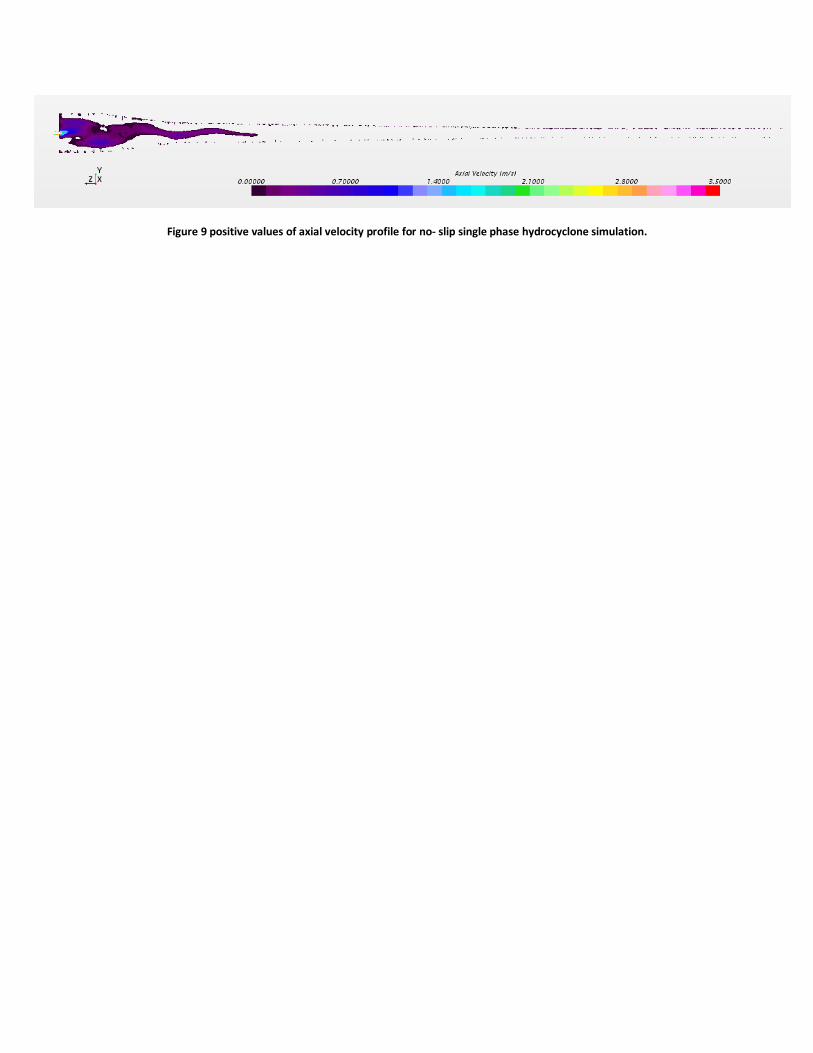
Figure 9 positive values of axial velocity profile for no- slip single phase hydrocyclone simulation.