Embed Size (px)
Citation preview
CFD Analysis of Resistance Characteristics of
High-Speed Displacement Hull Forms fitted
with Hull Vane®
by
Venkata Karthik Avala
Bachelor of TechnologyNaval Architecture and Ocean Engineering
Indian Maritime University, Visakhapatnam 2013
A thesissubmitted to the College of Engineering at
Florida Institute of Technologyin partial fulfillment of the requirements
for the degree of
Master of Sciencein
Ocean Engineering
Melbourne, FloridaMay 2017
COPYRIGHT
In presenting this thesis in partial fulfillment of the requirements for an ad-vanced degree at the Florida Institute of Technology, I agree that the libraryshall make it freely available for reference and study. I further agree that per-mission for copying of this thesis for scholarly purposes may be granted by theHead of my department or by his or her representatives. It is understood thatcopying or publication of this thesis for financial gain shall not be allowed with-out my written permission.
Venkata Karthik AvalaOcean Engineering and SciencesFlorida Institute of TechnologyMelbourne, Florida
May 2017
© Copyright 2017, Venkata Karthik AvalaAll Rights Reserved
Signature
We the undersigned committee hereby recommendthat the attached document be accepted as fulfilling in
part the requirements for the degree ofMaster of Science in Ocean Engineering.
“CFD Analysis of Resistance Characteristics of High-Speed Displacement HullForms fitted with Hull Vane® ”,
a thesis by Venkata Karthik Avala
Dr. Prasanta K. Sahoo, Ph.D.Associate Professor, Ocean Engineering and SciencesCommittee Chair
Dr. Stephen Wood, Ph.D.Department Head, Ocean Engineering and Sciences
Dr. Chelakara Subramanian, Ph.D.Professor and Chair, Mechanical and Aerospace Engineering
Dr. Ronnal Reichard, Ph.D.Professor, Ocean Engineering and Sciences
Abstract
TITLE: CFD Analysis of Resistance Characteristics of High-
Speed Displacement Hull Forms fitted with Hull Vane®
AUTHOR: Venkata Karthik Avala
MAJOR ADVISOR: Dr. Prasanta K. Sahoo, Ph.D.
Improving the performance and resistance of a high-speed monohull forms has
been of interest to Naval Architects for several decades. A considerable amount
of research has been carried out in this area by using stern flaps and other
appendages.
This research thesis investigates the resistance characteristics of high-speed
round bilge hull forms fitted with a Hull Vane® in the stern region of the vessel.
The Hull Vane® is a fixed foil located below the waterline at the aft of the stern
of the vessel. The Hull Vane® reduces the generation of waves at the aft and
improves the vessel's motions. This thesis investigates the drag reduction by
fitting a Hull Vane® in the stern region of a select few of Australian Maritime
Engineering Cooperative Research Center (AMECRC) systematic series hull
forms, originally developed as High-Speed Displacement Hull Forms (HSDHF)
series at MARIN, The Netherlands.
The aim of this research is to:
- Validate the total resistance of AMECRC series models #3, #4, #8, #11,
#13 for the Froude numbers 0.5, 0.6, 0.7 in CFD against the experimental
data available.
iii
- Attach a Hull Vane® of NACA 4412 profile at the aft region of the above
hull forms at the same Froude numbers and determine reduction in resis-
tance if any.
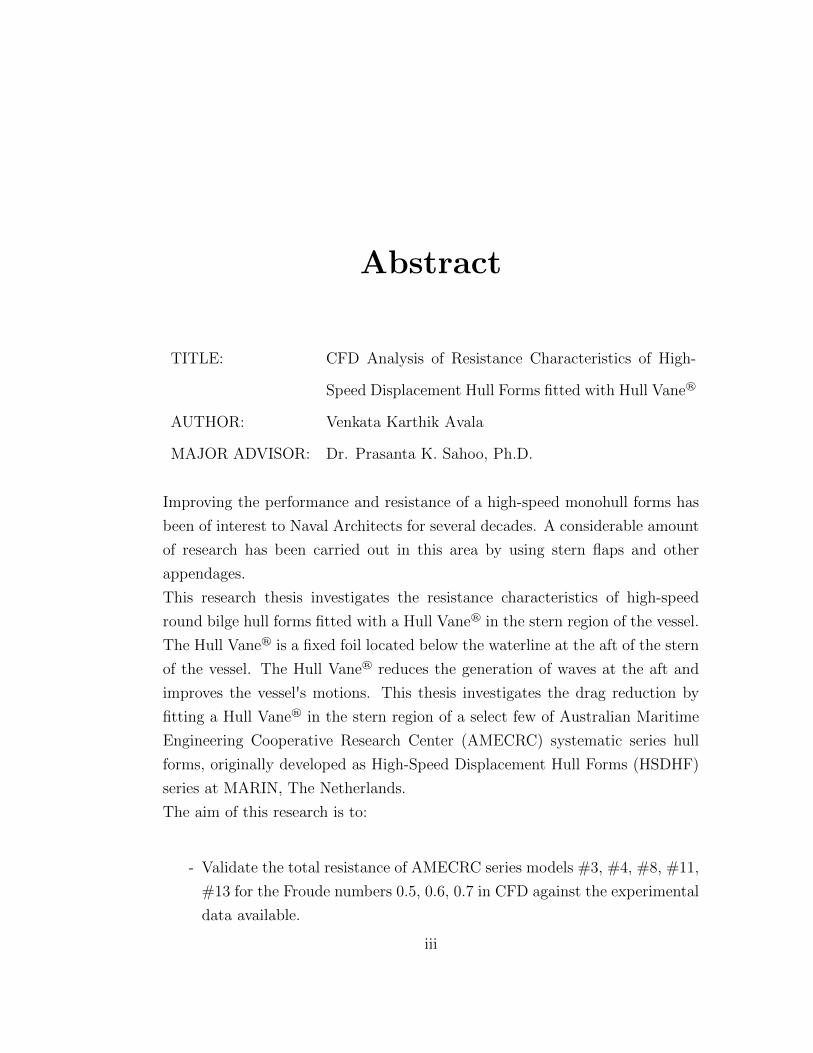
Hull Vane® used for this analysis has a profile similar to NACA 4412 and prin-
cipal dimensions such as span has been varied according to the breadth of the
models tested. The flap angle and chord length have been kept constant.
Figure 1: Hull-form fitted with Hull Vane® (with permission from businesspresentation)
The CFD research is carried out on STAR CCM+, a CFD package used to
simulate the drag characteristics. Models #8, #11 and #13 have shown a
significant reduction in the total resistance varying from 7% to 29% with an
average reduction of 17.3% when fitted with a Hull Vane® . Model #3 and
#4 did not show any significant improvement in the resistance. In fact, model
#4 has shown an increase in resistance when fitted with a Hull Vane® . It
is expected that the results of this research would hopefully lay the ground
work for further studies and comparative analysis. The conclusions would be
beneficial for anyone interested in the Hull Vane® research.
iv

Nomenclature
Acronyms
AMECRC Australian Maritime Engineering Cooperative Re-
search Center
CAD Computer Aided Drafting
CFD Computational Fluid Dynamics
HSDHF High-Speed Displacement Hull Forms
IGES Initial Graphics Exchange Specification
ITTC International Towing Tank Convention
JONSWAP Joint North Sea Wave Project
LCB Longitudinal center of buoyancy
MARIN Maritime Research Institute Netherlands
NACA National Advisory Committee for Aeronautics
NURBS Non-uniform rational B-spline
RANS Reynolds-averaged Navier Stokes
VOF Volume of Fluid
WSA Wetted surface area
v
Greek Symbols
α Hull Vane® inflow angle
β Hull Vane® angle
∆ Mass Displacement
λ Wave length
∇ Volume displacement
ρ Density
θ Trim angle
Latin Symbols
CD Drag coefficient
CL Lift coefficient
Fn Froude Number
L/∇1/3 Slenderness Ratio
A Area
B/T Breadth to Draft ratio
D Drag force
L Length
L/B Length to Breadth Ratio
S Wetted Surface Area
V Velocity
vi

Contents
Abstract iii
Nomenclature v
List of Figures ix
List of Tables xi
Acknowledgment xiii
Dedication xiv
1 Introduction 1
1.1 Motivation . . . . . . . . . . . . . . . . . . . . . . . . . . . . . . 1
1.2 Scope of Work . . . . . . . . . . . . . . . . . . . . . . . . . . . . 2
2 Background 3
2.1 Literature Survey . . . . . . . . . . . . . . . . . . . . . . . . . . 3
2.2 Theory . . . . . . . . . . . . . . . . . . . . . . . . . . . . . . . . 8
2.3 Components of Total Resistance . . . . . . . . . . . . . . . . . . 9
2.4 STAR CCM + . . . . . . . . . . . . . . . . . . . . . . . . . . . 11
3 AMECRC Series 13
4 Hull Vane® 20
4.1 Thrust force . . . . . . . . . . . . . . . . . . . . . . . . . . . . . 21
4.2 Trim correction . . . . . . . . . . . . . . . . . . . . . . . . . . . 23
4.3 Reduction of waves . . . . . . . . . . . . . . . . . . . . . . . . . 24
4.4 Reduction of motion in waves . . . . . . . . . . . . . . . . . . . 26
vii
4.5 Hull Vane® - Profile . . . . . . . . . . . . . . . . . . . . . . . . 27
5 Geometry 28
5.1 Geometry . . . . . . . . . . . . . . . . . . . . . . . . . . . . . . 28
5.2 Mesh Generation . . . . . . . . . . . . . . . . . . . . . . . . . . 30
5.3 Boundary Condition and Solution Setup . . . . . . . . . . . . . 31
6 Validation of CFD 33
6.1 Statement of Uncertainty . . . . . . . . . . . . . . . . . . . . . . 34
7 Results and Discussion 40
8 Conclusion 47
8.1 Future Work . . . . . . . . . . . . . . . . . . . . . . . . . . . . 49
Bibliography 50
A Sensitivity study 54
viii

List of Figures
1 Hull-form fitted with Hull Vane® (with permission from business
presentation) . . . . . . . . . . . . . . . . . . . . . . . . . . . . iv
2.1 Transom Wedge and Stern Flap Karafiath et al., (1999) . . . . . 4
2.2 Integrated Wedge-Flap Karafiath et al., 1999 . . . . . . . . . . . 5
2.3 Interceptor at the stern of the ship Karimi et al., (2013) . . . . 6
3.1 Lines Plan of the Parent Hull of the AMECRC Series . . . . . . 14
3.2 Body Plan of five selected models of the AMECRC Series . . . . 17
3.3 Change in Hull Shape of AMECRC Series [Sahoo and Doctors
(1999)] . . . . . . . . . . . . . . . . . . . . . . . . . . . . . . . . 18
3.4 AMECRC Systematic Series models #3, #4, #8, #11 and #13
Parameter Space . . . . . . . . . . . . . . . . . . . . . . . . . . 19
4.1 Schematic representation of the forces on the Hull Vane® Uithof
et al., (2014) . . . . . . . . . . . . . . . . . . . . . . . . . . . . . 21
4.2 Pictorial representation of Hull Vane® (with permission from
business presentation) . . . . . . . . . . . . . . . . . . . . . . . 23
4.3 Pictorial representation of trim correction at the Stern (with per-
mission from business presentation) . . . . . . . . . . . . . . . . 24
4.4 Wave pattern on a 55-metre supply vessel without Hull Vane®
(top) and with Hull Vane® (bottom) at 20 knots. From CFD
computations (blue portrays a wave trough and red a wave crest)
Uithof et al., (2014) . . . . . . . . . . . . . . . . . . . . . . . . . 25
ix
4.5 Comparison of the wave profile of the 55 metre supply vessel
without Hull Vane® (left) and with Hull Vane® (right) at 13
knots. As seen from the aft deck during sea trials Uithof et al.,
(2014) . . . . . . . . . . . . . . . . . . . . . . . . . . . . . . . . 25
4.6 Comparison of the motions of AMECRC series model #13 fitted
with and without Hull Vane® . . . . . . . . . . . . . . . . . . . 26
5.1 Geometry of Model 11 with Hull Vane® in Star CCM+ . . . . . 29
5.2 Volumetric mesh of Model 11 fitted with Hull Vane® . . . . . . 31
6.1 CFD and Experimental data for bare hull [Model 3] . . . . . . . 35
6.2 CFD and Experimental data for bare hull [Model 4] . . . . . . . 36
6.3 CFD and Experimental data for bare hull [Model 8] . . . . . . . 37
6.4 CFD and Experimental data for bare hull [Model 11] . . . . . . 38
6.5 CFD and Experimental data for bare hull [Model 13] . . . . . . 39
7.1 Resistance data for the Model 3 with and without Hull Vane®
using CFD . . . . . . . . . . . . . . . . . . . . . . . . . . . . . . 42
7.2 Resistance data for the Model 4 with and without Hull Vane®
using CFD . . . . . . . . . . . . . . . . . . . . . . . . . . . . . . 43
7.3 Resistance data for the Model 8 with and without Hull Vane®
using CFD . . . . . . . . . . . . . . . . . . . . . . . . . . . . . . 44
7.4 Resistance data for the Model 11 with and without Hull Vane®using
CFD . . . . . . . . . . . . . . . . . . . . . . . . . . . . . . . . . 45
7.5 Resistance data for the Model 13 with and without Hull Vane®
using CFD . . . . . . . . . . . . . . . . . . . . . . . . . . . . . . 46
A.1 Resistance data for model 13 at different Hull Vane® positions
in x-axis . . . . . . . . . . . . . . . . . . . . . . . . . . . . . . . 55
x
List of Tables
3.1 Parameter range of the models Sahoo and Doctors (1999) . . . 15
3.2 Parameters of the five models used for this analysis, Sahoo and
Doctors (1999) . . . . . . . . . . . . . . . . . . . . . . . . . . . 15
3.3 Parameters which are constant for the models, Sahoo and Doctors
(1999) . . . . . . . . . . . . . . . . . . . . . . . . . . . . . . . . 16
5.1 Fluid properties of fresh water . . . . . . . . . . . . . . . . . . . 31
5.2 Boundary condition and solution method . . . . . . . . . . . . . 32
6.1 Resistance data Validation [Model 3] . . . . . . . . . . . . . . . 35
6.2 Resistance data Validation [Model 4] . . . . . . . . . . . . . . . 36
6.3 Resistance data Validation [Model 8] . . . . . . . . . . . . . . . 37
6.4 Resistance data Validation [Model 11] . . . . . . . . . . . . . . . 38
6.5 Resistance data Validation [Model 13] . . . . . . . . . . . . . . . 39
7.1 Resistance data of Model 3 with and without Hull Vane® using
CFD . . . . . . . . . . . . . . . . . . . . . . . . . . . . . . . . . 42
7.2 Resistance data of Model 4 with and without Hull Vane® using
CFD . . . . . . . . . . . . . . . . . . . . . . . . . . . . . . . . . 43
7.3 Resistance data of Model 8 with and without Hull Vane® using
CFD . . . . . . . . . . . . . . . . . . . . . . . . . . . . . . . . . 44
7.4 Resistance data of Model 11 with and without Hull Vane® using
CFD . . . . . . . . . . . . . . . . . . . . . . . . . . . . . . . . . 45
7.5 Resistance data of Model 13 with and without Hull Vane® using
CFD . . . . . . . . . . . . . . . . . . . . . . . . . . . . . . . . . 46
xi

A.1 Sensitivity study of AMECRC model #13 fitted with Hull Vane®
for Fn 0.6 . . . . . . . . . . . . . . . . . . . . . . . . . . . . . . 54
xii

Acknowledgement
I would like to express my deepest appreciation to Dr. Prasanta Sahoo who
read my numerous revisions and critiqued patiently. Without his guidance and
persistent help, this would not have been possible. He has been so generous
and patient during this research. I would also like to thank Dr. Wood, Dr.
Subramanian and Dr. Reichard for their valuable time.
I would like to extend my sincere thanks to my Naval Architecture laboratory
fellow mates for being with me and helping me out with this research.
I would like to thank Van Oossanen Naval Architects for their encouragement
and support.
I would also like to express my deepest gratitude to my family and friends for
their love, affection and for being my source of inspiration and support.
xiii

Dedication
To my late Father, my Mother and my Sister.
xiv

Chapter 1
Introduction
1.1 Motivation
The idea of high-speed ships emerged in 1870 when naval forces began using
torpedo boats, development of which followed as a result of the invention of the
torpedo in 1860 by Giovanni Luppis of Austria-Hungary, DeJong (2011). The
naval forces started using torpedo boats because they are relatively cheaper and
faster than the heavily armoured battleships of the time which could easily be
outrun and outmaneuvered. In the late 19th and the early 20th century, ships
began to move at higher speeds due to the invention of steam turbine and in-
ternal combustion engines.
The drag force on the hull is an important factor to deal with in the process
of ship design. Researchers around the world have developed various devices
designed to improve drag reduction and also generate lift. Some of these are
directed to the stern of the ship such as stern wedges, stern flaps, trim tabs and
vanes . Experimental model testing involves extensive cost and time but gives
1

reliable results in the preliminary design stage. As computer simulation tech-
niques have improved over the years, many stages of design could be simulated
with a reasonable accuracy, thus enabling the testing of improved designs with
lesser cost and time.
The evolution of the stern devices can be challenging to track as their design is
often specific for a given stern type and vessel characteristics. Hull Vane® is a
stern device known for reduction of total resistance and suitable for round bilge
hull forms.
1.2 Scope of Work
This research primarily focuses on resistance prediction of high-speed round
bilge hull forms by fitting them with a Hull Vane® .
This research would comprise of the following steps:This research would com-
prise of the following steps:
A. Hull forms were developed from NURBS curves for models #3, #4, #8,
#11 and #13 of AMECRC series.
B. CFD analysis was performed for resistance of the bare hull models at
Froude numbers 0.5, 0.6, 0.7 and validated against the model tank test
data.
C. Hull Vane® location both in longitudinal and vertical direction was varied
but angle of attack was kept constant during simulation when attached to
the bare hull models at Froude numbers of 0.5, 0.6 and 0.7.
D. Results were obtained, analyzed and discussed.
2

Chapter 2
Background
2.1 Literature Survey
The dynamics of high-speed vessels is an important parameter in the design pro-
cess. Inadequate attention to this aspect will impact unavoidable penalty during
the vessel's life. One aspect of this endeavor is the reduction of drag. Naval Ar-
chitects have over the years developed different appendages to reduce the drag
component by creating a lift component. A study conducted by Karafiath and
Fisher (1987) on stern wedges mentions that the concept of the stern wedges is
not new and quotes a notable reference to German, Italian and the US Navies,
where the appendage has proven to reduce the resistance of the ship up to 6%
at maximum speed. It was also shown that a reduction of running trim (trim
observed when the vessel is in motion) of up to 2.0 degrees could result in 2%
of saving in fuel consumption.
3
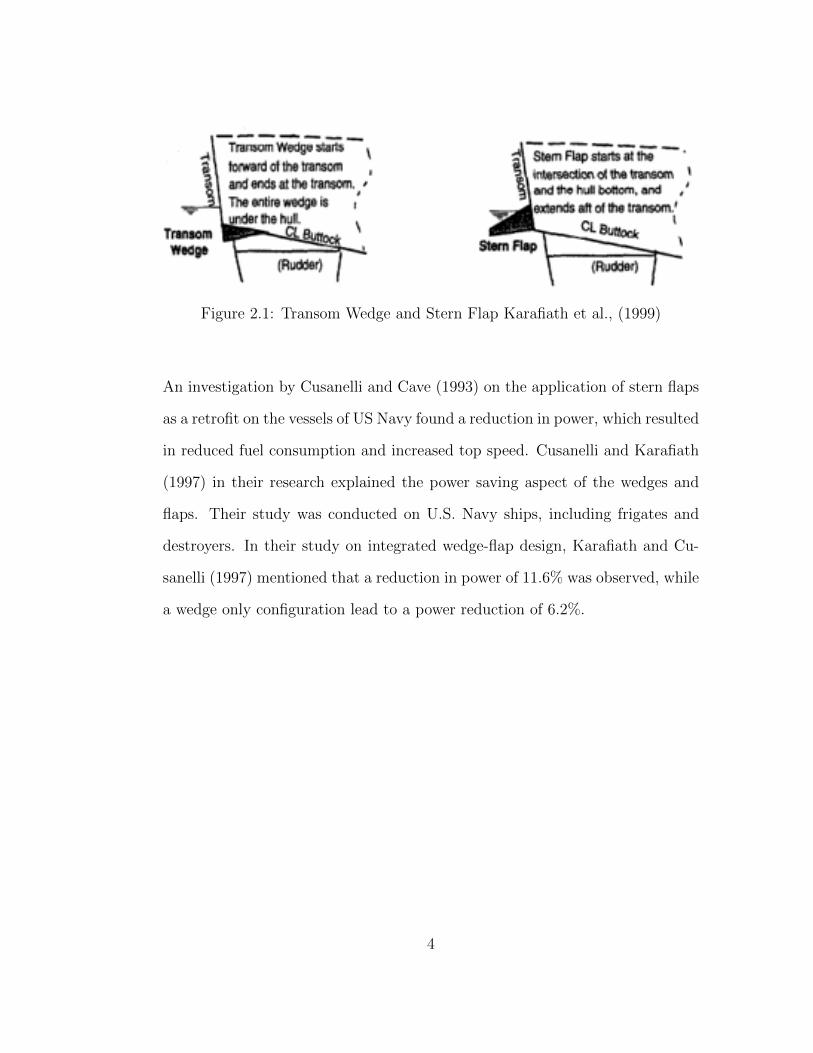
Figure 2.1: Transom Wedge and Stern Flap Karafiath et al., (1999)
An investigation by Cusanelli and Cave (1993) on the application of stern flaps
as a retrofit on the vessels of US Navy found a reduction in power, which resulted
in reduced fuel consumption and increased top speed. Cusanelli and Karafiath
(1997) in their research explained the power saving aspect of the wedges and
flaps. Their study was conducted on U.S. Navy ships, including frigates and
destroyers. In their study on integrated wedge-flap design, Karafiath and Cu-
sanelli (1997) mentioned that a reduction in power of 11.6% was observed, while
a wedge only configuration lead to a power reduction of 6.2%.
4
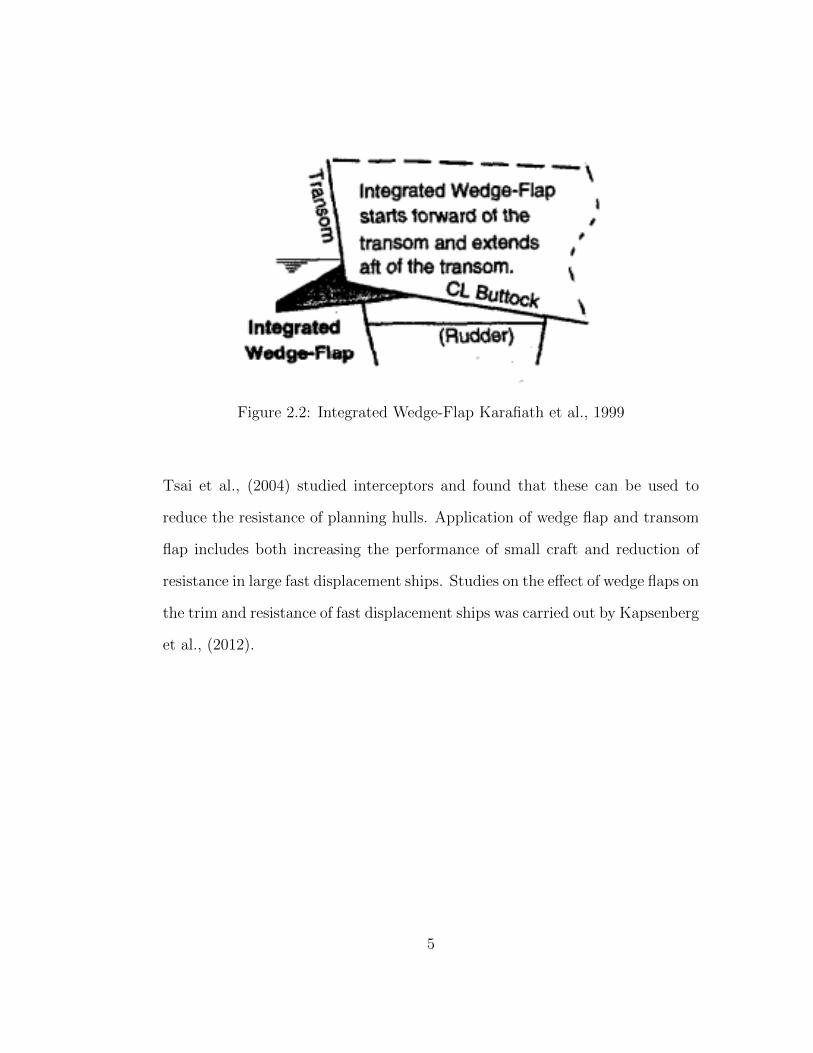
Figure 2.2: Integrated Wedge-Flap Karafiath et al., 1999
Tsai et al., (2004) studied interceptors and found that these can be used to
reduce the resistance of planning hulls. Application of wedge flap and transom
flap includes both increasing the performance of small craft and reduction of
resistance in large fast displacement ships. Studies on the effect of wedge flaps on
the trim and resistance of fast displacement ships was carried out by Kapsenberg
et al., (2012).
5
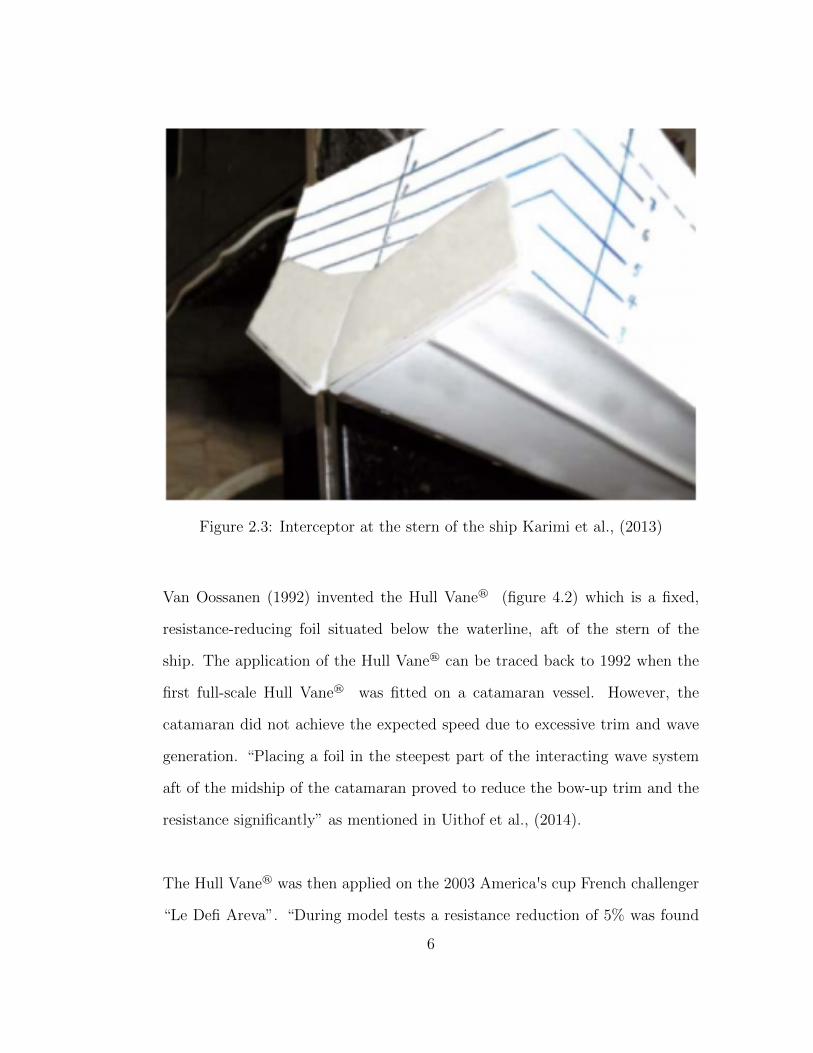
Figure 2.3: Interceptor at the stern of the ship Karimi et al., (2013)
Van Oossanen (1992) invented the Hull Vane® (figure 4.2) which is a fixed,
resistance-reducing foil situated below the waterline, aft of the stern of the
ship. The application of the Hull Vane® can be traced back to 1992 when the
first full-scale Hull Vane® was fitted on a catamaran vessel. However, the
catamaran did not achieve the expected speed due to excessive trim and wave
generation. “Placing a foil in the steepest part of the interacting wave system
aft of the midship of the catamaran proved to reduce the bow-up trim and the
resistance significantly” as mentioned in Uithof et al., (2014).
The Hull Vane® was then applied on the 2003 America's cup French challenger
“Le Defi Areva”. “During model tests a resistance reduction of 5% was found
6
at model scale for a full-scale speed of 10 knots” as mentioned in Uithof et al.,
(2014).
In addition to the above, research focused on the working principles of the Hull
Vane®, and a number of applications were tested, mostly by computational
analysis using CFD. Further tests have been conducted on models ranging from
sailing yachts and motor yachts to more commercial vessels, such as supply ves-
sels, containerships, cruise ships and Ro-Ro vessels and the influence of the Hull
Vane® on total resistance was found to have varied between -26.5% and +9.5%,
exhibiting that the fuel saving device is not suitable for all cases as mentioned
in Uithof et al., (2014).
In 2014, two ships equipped with Hull Vane® were launched. The first one is a
55-metre supply vessel Karina, which had its required engine power reduced by
15% during sea trials after a Hull Vane® was retrofitted to the transom. The
second vessel was a 42-metre displacement yacht for which the Hull Vane® was
incorporated during the design phase, which showed a resistance reduction of
up to 23% as mentioned in Uithof et al., (2014). Uithof et al., (2014) concluded
that extensive research has been carried out by employing CFD computations,
numerous model tests and sea trials were conducted, and the reduction in resis-
tance was found to be up to 26.5% on ships running at Froude numbers between
0.2 and 0.7 which is effective Froude number range for the Hull Vane® .
7
2.2 Theory
Predicting the resistance characteristics of a ship has always been a difficult
task as it is associated with three prominent factors namely accuracy, time and
application cost. There are two basic ways of predicting the wave resistance
followed by the Naval Architects.
Towing tank test: This method is considered to be the most reliable method
which yields accurate resistance results by using geometrically similar models
for testing. The objectives of measurement in towing tank resistance tests are
to obtain the relationship between residuary resistance coefficient and Froude
number of a ship model and if required, the form factor. The direct measure-
ment of the tests is the total resistance as well as the running attitudes of a ship
model at each speed.
CFD method: This is a numerical simulation of the model which behaves just
like a numerical towing tank and predicts the resistance data. The time pe-
riod for completing a simulation is based on the parameters of the model, other
attributes, and conditions which would be given as input by the user. This
method may seem economically feasible when compared to the towing tank test
but is not as accurate.
The prediction of resistance characteristics of hull forms can be done in several
ways:
- Extrapolation from geometrically similar models
8

- Dedicated model tests
- Series data based on systematic model tests
- Regression based procedures and
- Computational fluid dynamics.
Resistance is the driving force which is responsible for the uniform rectilinear
motion of the ship with a constant speed in a calm sea. The total resistance
is divided into two components namely viscous resistance which is associated
with the friction experienced by the body with respect to the fluid medium, and
the other is wave making resistance which causes the generation of waves. The
wave making resistance is the resultant force created by the pressure changes
due to the atmosphere on the free surface, which results in waves on the sur-
face. As the speed and form of the ship has a profound effect on wave making
resistance that eventually increases the total resistance experienced by the ship,
it is essential to find out ways of reducing it so that better drag characteristics
could be achieved. To accomplish this, high values of slenderness ratio (L/1/3)
or increasing the dynamic lift of the hull are required. Wave making resistance
is also influenced because of the interference between the separate hull wakes in
multihull forms like catamarans and trimarans.
2.3 Components of Total Resistance
The ITTC-78 method suggested the total resistance components of mono-hull
should be expressed by equation:
9
CT = (1 + k)CF + CR + CA + CAA (2.1)
Where (1+k) is the form factor determined from resistance tests. CF is the fric-
tional resistance coefficient, which is always calculated according to the ITTC-57
ship model correlation line and is given by:
CF =0.075
(log10Rn − 2)2(2.2)
CR is the residuary resistance coefficient and is expressed by the equation:
CR = CT − (1 + k)CF (2.3)
CA is the correlation allowance given by:
CA = (5.68− 0.6 logRe)× 10−3 (2.4)
CAA is the air resistance coefficient given by:
CAA =AV T
1000S(2.5)
where AV T is the projected face area of the ship above waterline
CT is the total resistance coefficient and is calculated by the formula:
CT =RT
12ρSV2
(2.6)
CW is the wave resistance coefficient and is calculated by the formula:
10
CW =RW
12ρSV2
(2.7)
whereas in CFD the total drag is measured as a direct physical measurement of
resistance components and is given by equation:
CT = CV + CP (2.8)
Where CV is viscous resistance coefficient and CP is pressure resistance coeffi-
cient.
The total resistance coefficient can also be expressed as:
CT = (1 + k)CFITTC + CWexp (2.9)
where the wave resistance coefficient is obtained by experimental data. The
frictional resistance coefficient is calculated by using the form factor and ITTC-
57 correlation line.
2.4 STAR CCM +
STAR CCM+, a CFD tool a user friendly software when compared to other CFD
packages. It is a Multidisciplinary, timely and affordable simulation tool backed
by experts as mentioned in http://mdx.plm.automation.siemens.com/star-ccm-
plus. Estimating Hull Performance (EHP), an add-on of STAR CCM+ used
for these simulations, provides naval architects with a streamlines graphic user
interface driven process for estimating the hull performance in calm water.
“EHP has been tailored for analyses of unappended displacement hulls. With
11

its automatic set-up and intuitive, user-friendly GUI, EHP can be used by
all naval architects, including those with very little CAD or CFD experience.
EHP guides users from CAD import, through solution of single or multiple
speeds in a single session, to automatic PowerPoint generation with images
and reports of the results. You can even use your own company template.
After model setup, EHP gives optional direct access to the sim file, which
can easily be adapted to more complex geometries and/or specific conditions,
thereby allowing more experienced users to harness the full power of STAR-
CCM+ to deliver high-quality predictions for various scenarios”, as mentioned in
http://mdx2.plm.automation.siemens.com/brochure/estimating-hull-performance-
brochure-ehp.
One user from www.cfd-online.com mentions that, “There are benefits for both
ANSYS and Star-CCM+. Sophisticated geometry and meshing is not a problem
for either software package. One of the primary distinctions is the performance
and accuracy of the flow solver. At present, industry folks prefer the reliability
and robustness of the ANSYS fluid dynamics solvers over Star-CCM+.”
Another user from www.reddit.com quotes that, “I feel like Star-CCM+ is
slightly faster and converges a little better, mainly due to the higher qual-
ity prism + polyhedral elements mentioned elsewhere. It's not something I've
bothered to benchmark though.”
12
Chapter 3
AMECRC Series
Australian Maritime Engineering Co-operative Research Center (AMECRC) se-
ries is based on High speed displacement hull form (HSDHF) series. The HSDHF
series project was started in 1979 at the Marine Research Institute Netherlands
(MARIN) to improve the performance of high-speed displacement vessels, es-
pecially their seakeeping qualities. The 14 models depicted by the AMECRC
have been illustrated in the article by Sahoo and Doctors (1999).
These models were tested in the Ship Hydrodynamics Center at Australian Mar-
itime College. All the models were of length 1.6 m. The CB of 0.396 to 0.5,
L/B ratios of the models were in the range of 4.0 to 8.0 and B/T ratios were
between 2.5 to 4.0. Calm water tests were conducted at speeds in the range
of 0.4 to 4.0 m/s with respect to Froude numbers 0.1 to 1.0. The models were
free to sink and trim. Figure 3.1 shows the lines plan of the parent hull of the
AMECRC series. Figure 3.3 represents the change in Hull shape of AMECRC
series. Figure 3.4 represents the parameter space of the selected AMECRC se-
13
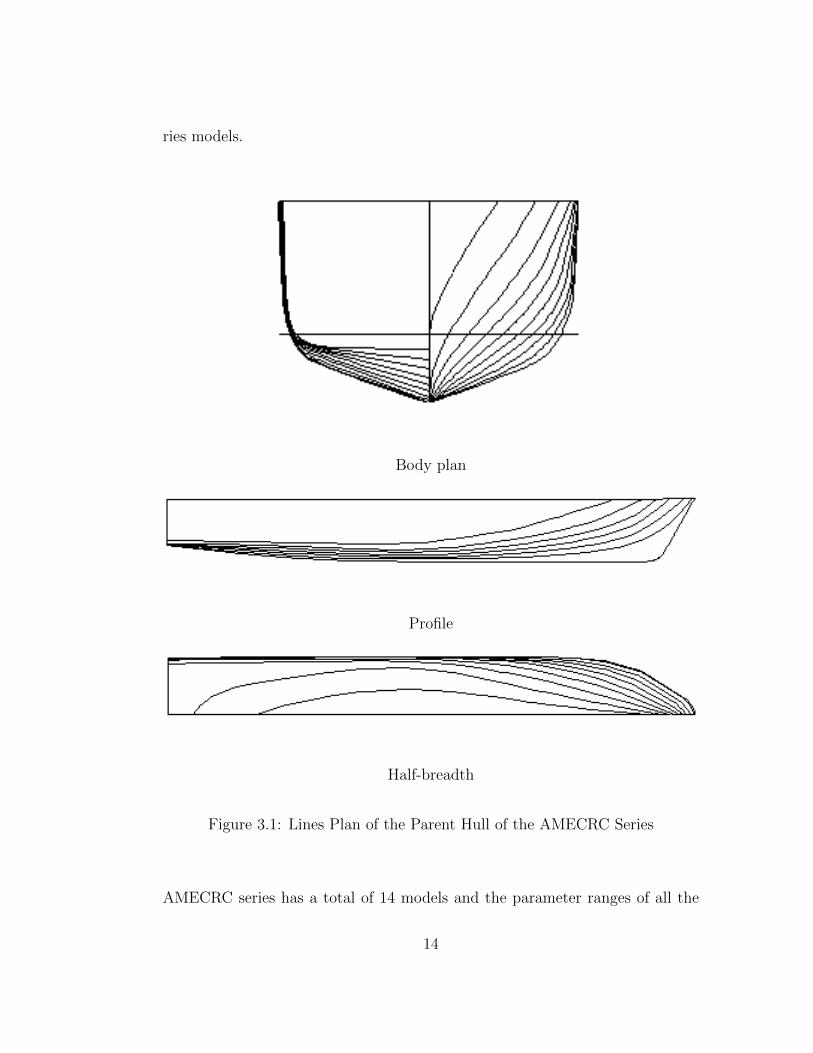
ries models.
Body plan
Profile
Half-breadth
Figure 3.1: Lines Plan of the Parent Hull of the AMECRC Series
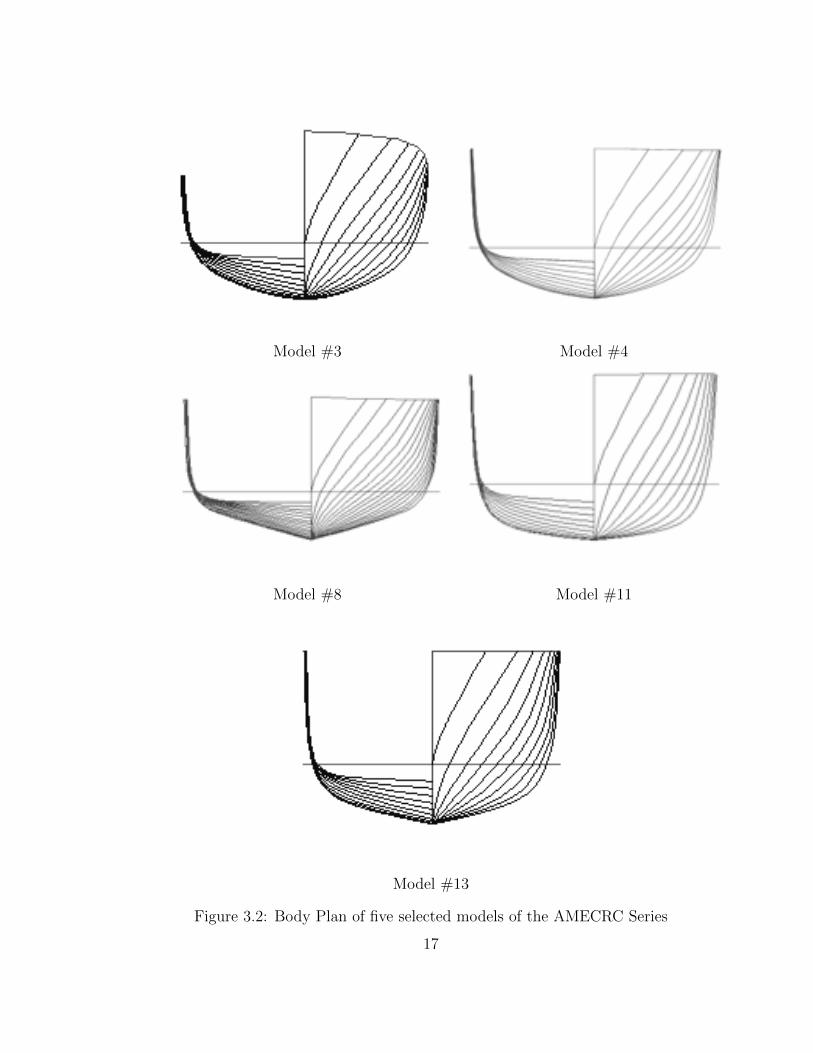
AMECRC series has a total of 14 models and the parameter ranges of all the
14
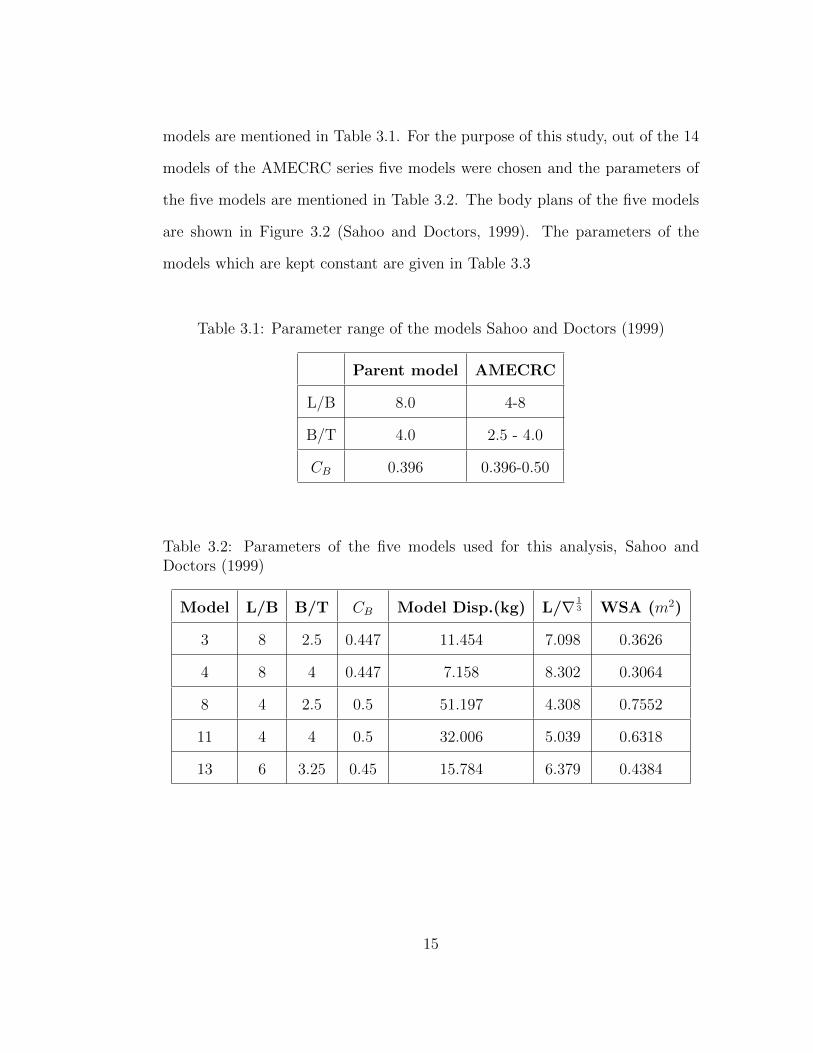
models are mentioned in Table 3.1. For the purpose of this study, out of the 14
models of the AMECRC series five models were chosen and the parameters of
the five models are mentioned in Table 3.2. The body plans of the five models
are shown in Figure 3.2 (Sahoo and Doctors, 1999). The parameters of the
models which are kept constant are given in Table 3.3
Table 3.1: Parameter range of the models Sahoo and Doctors (1999)
Parent model AMECRC
L/B 8.0 4-8
B/T 4.0 2.5 - 4.0
CB 0.396 0.396-0.50
Table 3.2: Parameters of the five models used for this analysis, Sahoo andDoctors (1999)
Model L/B B/T CB Model Disp.(kg) L/∇ 13 WSA (m2)
3 8 2.5 0.447 11.454 7.098 0.3626
4 8 4 0.447 7.158 8.302 0.3064
8 4 2.5 0.5 51.197 4.308 0.7552
11 4 4 0.5 32.006 5.039 0.6318
13 6 3.25 0.45 15.784 6.379 0.4384
15

Table 3.3: Parameters which are constant for the models, Sahoo and Doctors(1999)
CP 0.626
CWP 0.796
AT/AX 0.296
BT/BX 0.964
CM CP × CB
LCB 44.6% LPP from transom
The models selected for the resistance characteristics study when fitted with
Hull Vane® are models #3, #4, #8, #11 and #13. These models were selected
as they represent the overall parameter space of the AMECRC series models.
Their body plans are given in figure 3.2
16
Model #3 Model #4
Model #8 Model #11
Model #13
Figure 3.2: Body Plan of five selected models of the AMECRC Series
17
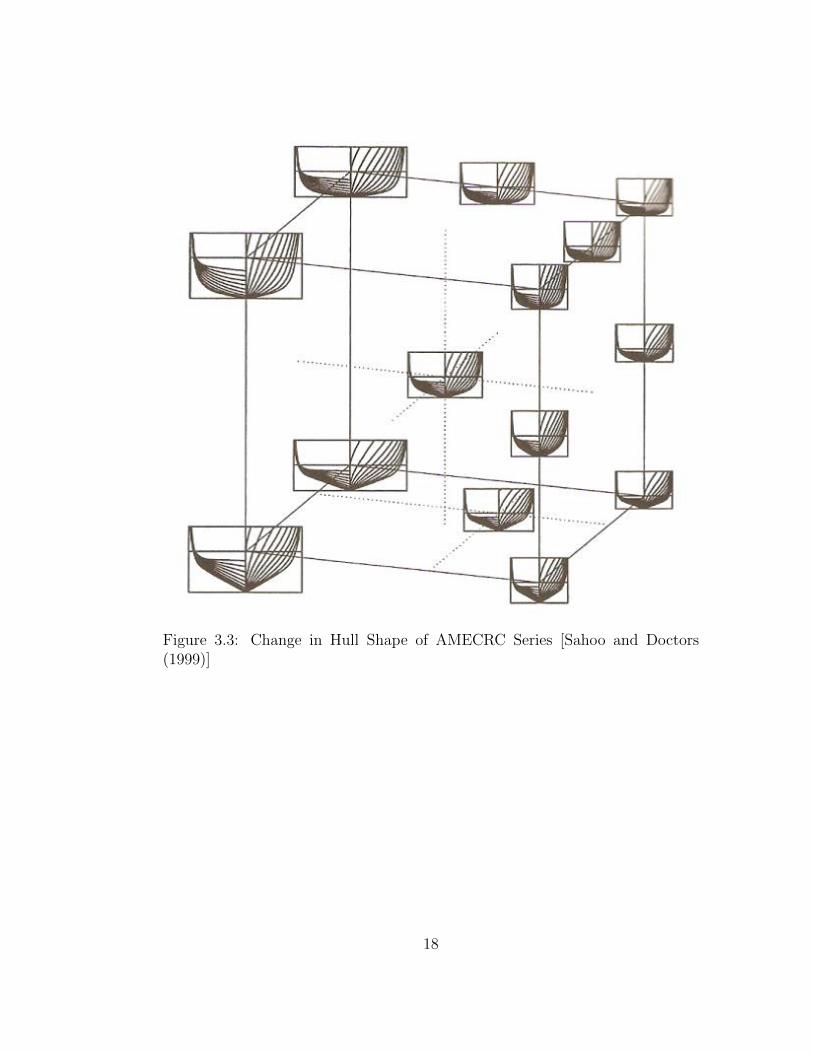
Figure 3.3: Change in Hull Shape of AMECRC Series [Sahoo and Doctors(1999)]
18
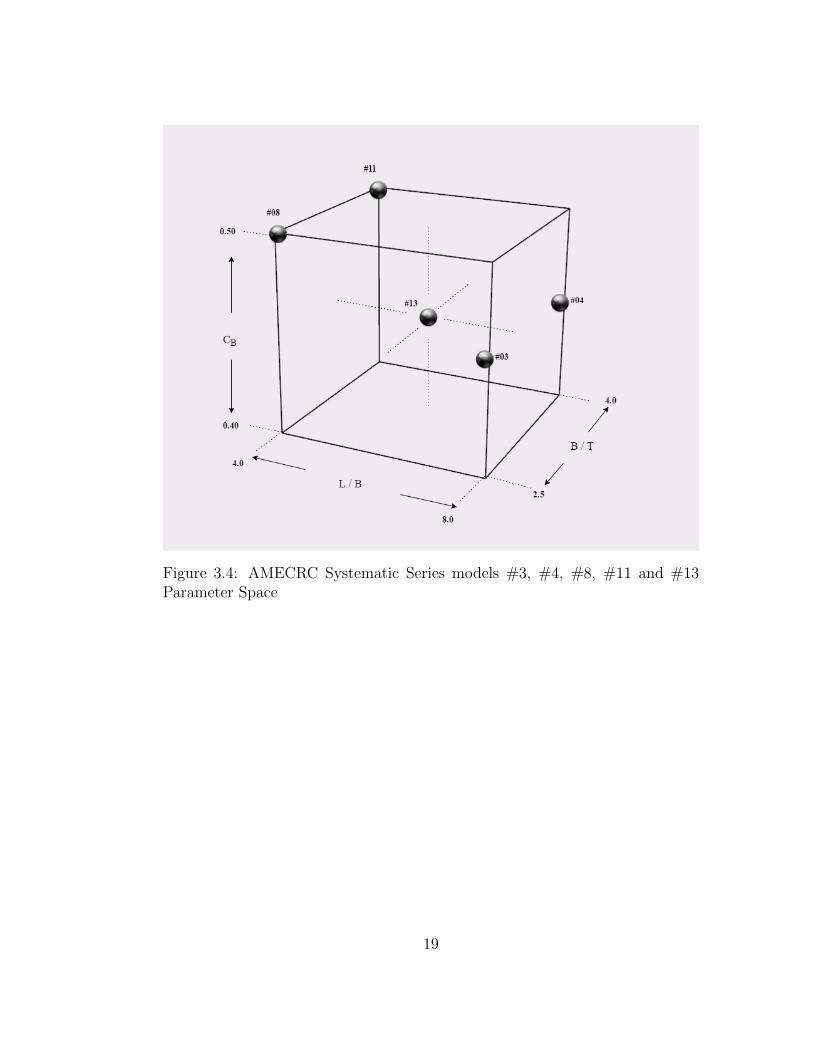
Figure 3.4: AMECRC Systematic Series models #3, #4, #8, #11 and #13Parameter Space
19
Chapter 4
Hull Vane®
A Hull Vane® is a wing-shaped fixed-foil structure, horizontally placed below
the waterline near the stern of the vessel. When the stern wave flows over the
Hull Vane® , a hydrodynamic lift is created. The lift generated by the Hull
Vane® can be broken down into two forces, one in the x-direction and one in
the z-direction. Hull Vane® has four distinct effects on vessels namely, a thrust
force, a trim correction, the reduction of waves, and the reduction of motions in
waves (Uithof et al., 2014). The effect of a Hull Vane® on thrust force can be
explained by basic foil theory and Figure 4.1 shows the schematic representation
of the forces on the Hull Vane® .
20

Figure 4.1: Schematic representation of the forces on the Hull Vane® Uithof etal., (2014)
4.1 Thrust force
Figure 4.1 shows a schematic representation of the transom stern of a vessel at
zero trim fitted with a Hull Vane® (aft). In this Figure 4.1, represents the angle
between the inflow and the chord line of the Hull Vane® ; represents the angle
between the chord line and the body-fixed x-axis of the Hull Vane® . When the
stern flow meets the Hull Vane® , it creates two vectors, the lift force vector,
LHV and the drag force vector DHV . The sum of these vectors can be broken
down into an x-component and a z-component.
~LHV + ~DHV = ~FHV = ~Fx,HV + ~Fz,HV (4.1)
21
A thrust force will be generated if the x-component of the drag vector is smaller
than the x-component of the lift vector. The lift and drag forces are given by
the following equations:
LHV = CL ∗1
2ρV 2A (4.2)
DHV = CD ∗1
2ρV 2A (4.3)
The value of CL and CD depends on on factors like shape of the Hull Vane®
and the proximity of the free surface. If represents the trim angle, then the
thrust force generated in the x direction can be derived by the following equation
(Uithof et al., 2014):
Fx,HV = sin(α + β + θ) ∗ LHV − cos(α + β + θ) ∗DHV (4.4)
22
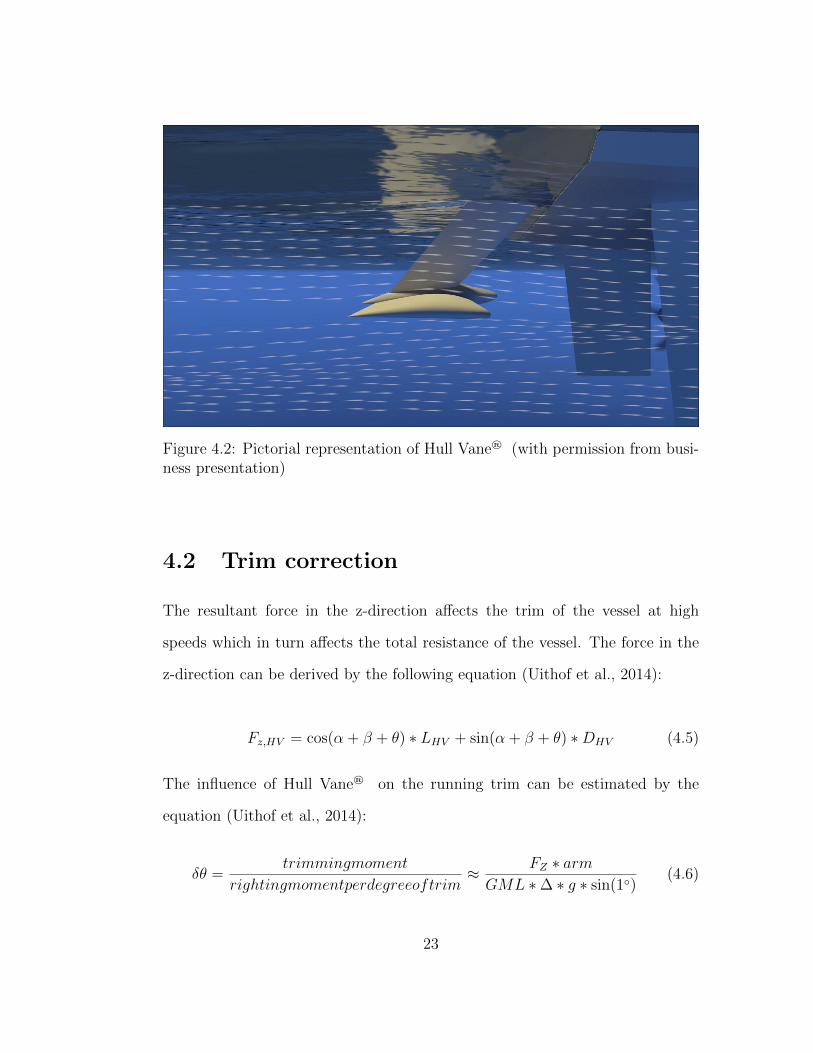
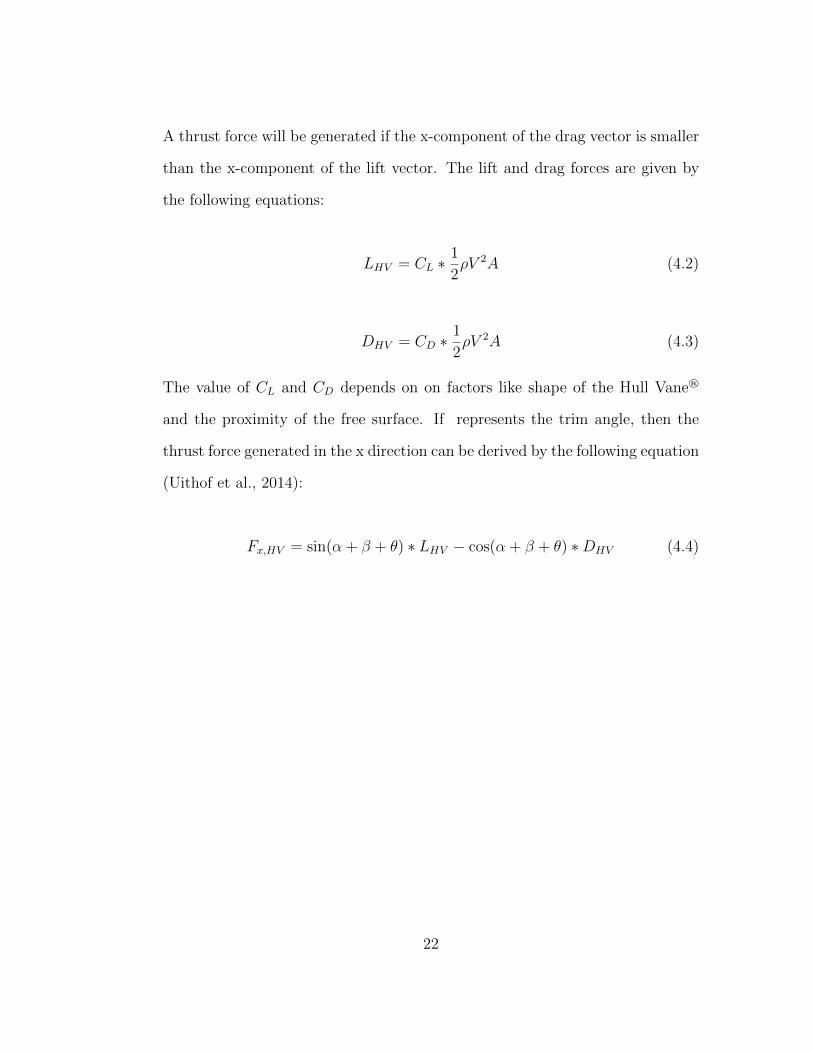
Figure 4.2: Pictorial representation of Hull Vane® (with permission from busi-ness presentation)
4.2 Trim correction
The resultant force in the z-direction affects the trim of the vessel at high
speeds which in turn affects the total resistance of the vessel. The force in the
z-direction can be derived by the following equation (Uithof et al., 2014):
Fz,HV = cos(α + β + θ) ∗ LHV + sin(α + β + θ) ∗DHV (4.5)
The influence of Hull Vane® on the running trim can be estimated by the
equation (Uithof et al., 2014):
δθ =trimmingmoment
rightingmomentperdegreeoftrim≈ FZ ∗ armGML ∗∆ ∗ g ∗ sin(1◦)
(4.6)
23
The trim affects the angle of attack of the flow on the Hull Vane® and is shown
to have an influence on the thrust force generated by the Hull Vane® .
Figure 4.3: Pictorial representation of trim correction at the Stern (with per-mission from business presentation)
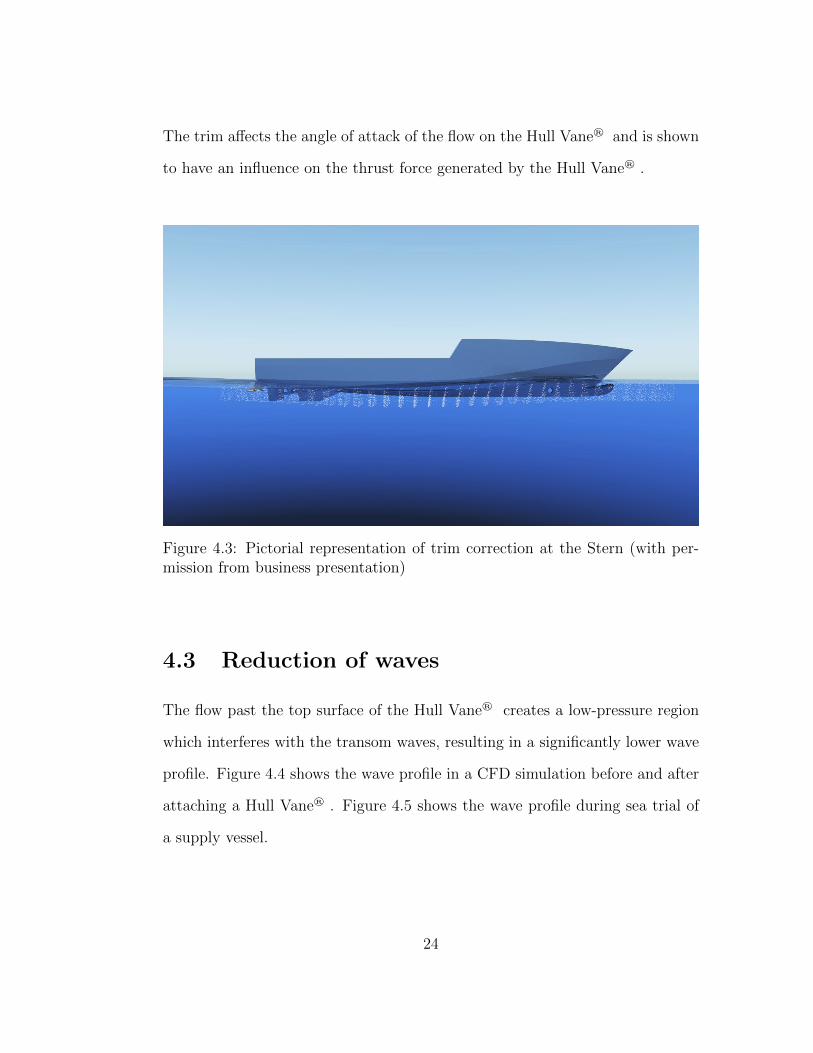
4.3 Reduction of waves
The flow past the top surface of the Hull Vane® creates a low-pressure region
which interferes with the transom waves, resulting in a significantly lower wave
profile. Figure 4.4 shows the wave profile in a CFD simulation before and after
attaching a Hull Vane® . Figure 4.5 shows the wave profile during sea trial of
a supply vessel.
24
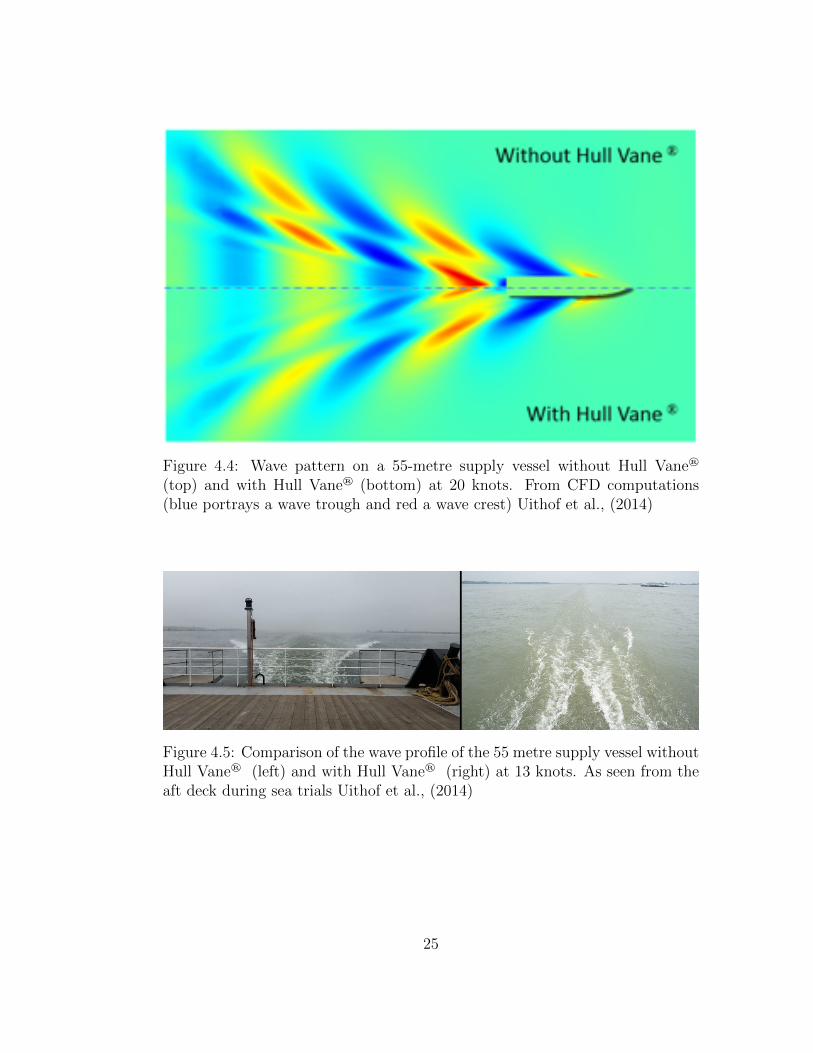
Figure 4.4: Wave pattern on a 55-metre supply vessel without Hull Vane®
(top) and with Hull Vane® (bottom) at 20 knots. From CFD computations(blue portrays a wave trough and red a wave crest) Uithof et al., (2014)
Figure 4.5: Comparison of the wave profile of the 55 metre supply vessel withoutHull Vane® (left) and with Hull Vane® (right) at 13 knots. As seen from theaft deck during sea trials Uithof et al., (2014)
25
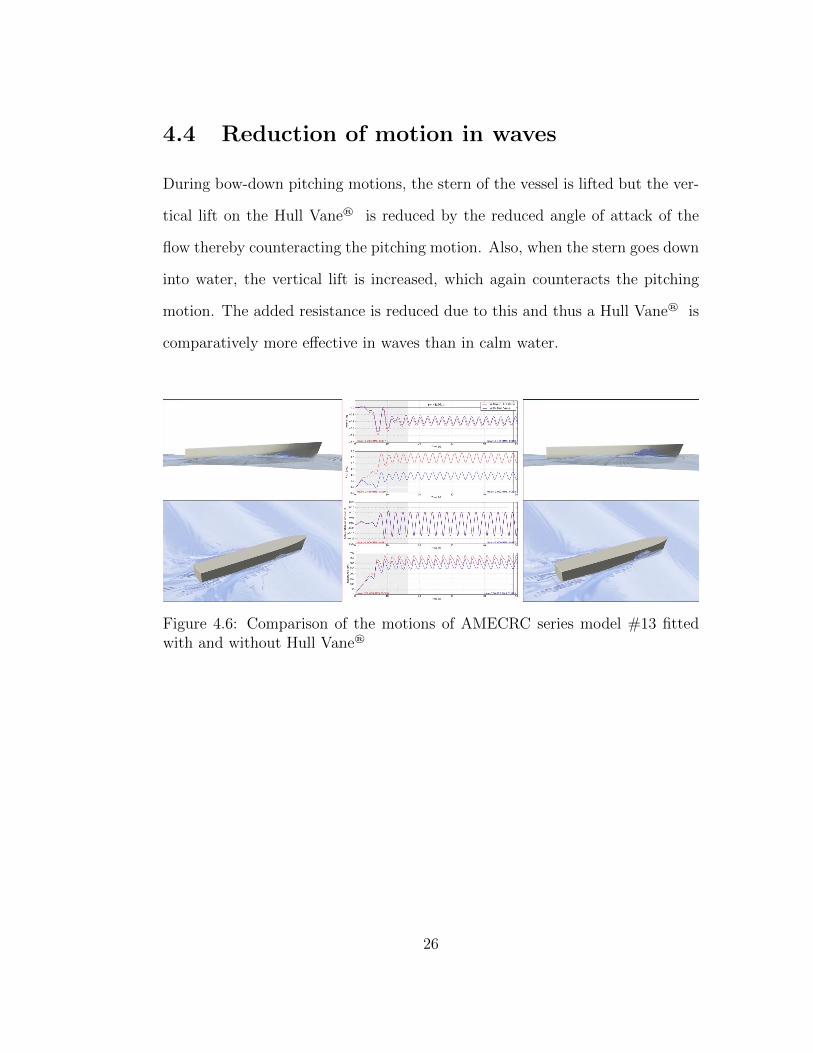
4.4 Reduction of motion in waves
During bow-down pitching motions, the stern of the vessel is lifted but the ver-
tical lift on the Hull Vane® is reduced by the reduced angle of attack of the
flow thereby counteracting the pitching motion. Also, when the stern goes down
into water, the vertical lift is increased, which again counteracts the pitching
motion. The added resistance is reduced due to this and thus a Hull Vane® is
comparatively more effective in waves than in calm water.
Figure 4.6: Comparison of the motions of AMECRC series model #13 fittedwith and without Hull Vane®
26
4.5 Hull Vane® - Profile
The Hull Vane® profile selected for this research was similar to NACA 4412.
This was suggested by the Van Oossanen Naval Architects to be an efficient
foil for use as a Hull Vane at the aft of the transom stern below the waterline.
Particulars of Hull Vane® selected are:
• Profile NACA 4412
• Chord length of 1m
• Max. camber: 0.04 m (4% of 1m)
• Location of max camber: (40% of chord length from leading edge) i.e. 0.4
m aft of leading edge (0.4 x 1m)
• Max thickness: 0.12m (12% of 1m)
• Located at -1m from the stern in x-direction and -4.5m from the waterline
in z-direction
27

Chapter 5
Geometry
5.1 Geometry
Generating an extensive CFD solution is a must when the results are used to
interpret the actual solution for a problem. So, significant attention is required
in the setup process and the subsequent analysis. CFD analysis of any prob-
lem consists three main steps namely pre-processing, analysis of the problem
and post-processing (Mahmood, 2011). Pre-processing involves creating and
importing the model geometry, domain creation, precise model meshing and
setting up the required boundary conditions. The analysis was carried out by
the CFD program based on the inputs from the user. Post processing is the
visualization and analysis of the data produced.
The AMECRC models were initially created as NURBS curves using Maxsurf
modeler. Then the models have been converted into 3DM file format, to import
them into a 3D modeling software. Using Rhinoceros 3D modeler, surfaces have
28
been created and joined to create a closed poly surface, a representation of the
solid body.
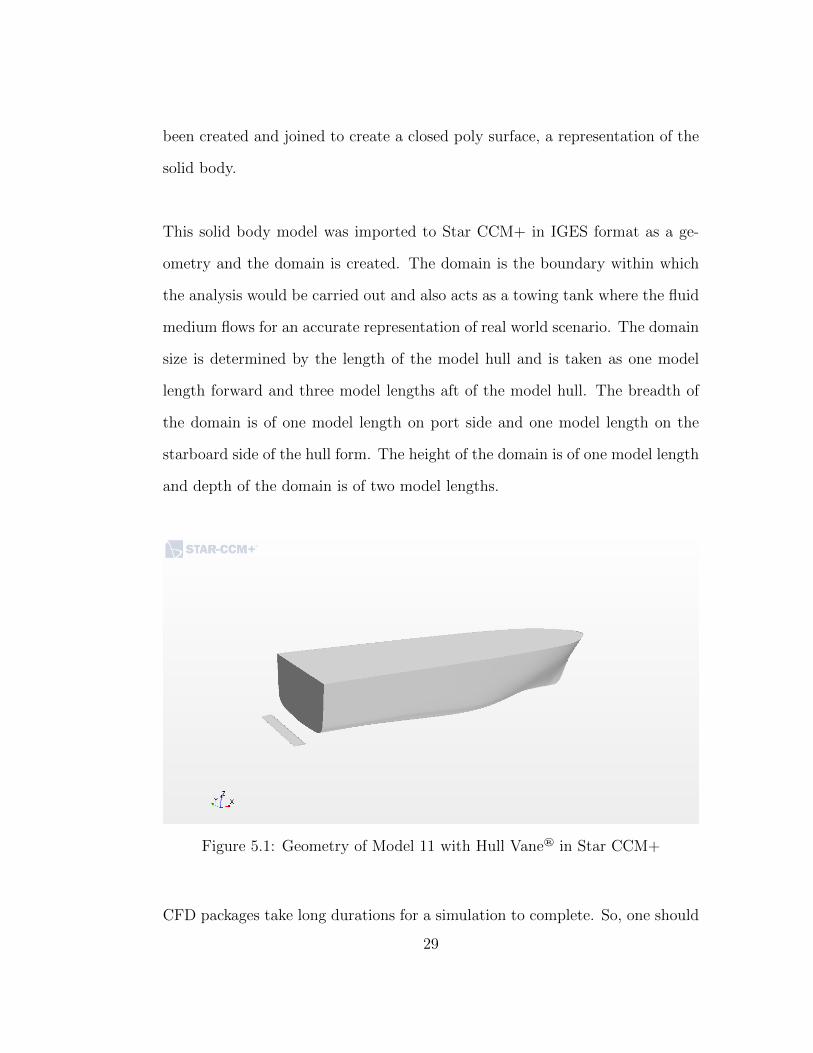
This solid body model was imported to Star CCM+ in IGES format as a ge-
ometry and the domain is created. The domain is the boundary within which
the analysis would be carried out and also acts as a towing tank where the fluid
medium flows for an accurate representation of real world scenario. The domain
size is determined by the length of the model hull and is taken as one model
length forward and three model lengths aft of the model hull. The breadth of
the domain is of one model length on port side and one model length on the
starboard side of the hull form. The height of the domain is of one model length
and depth of the domain is of two model lengths.
Figure 5.1: Geometry of Model 11 with Hull Vane® in Star CCM+
CFD packages take long durations for a simulation to complete. So, one should
29

have an insight into the methods available for reduction of computational time.
Since the models are symmetric in nature, they could be modeled as a half-
domain along the central longitudinal axis to save the computational time.
The domain was divided into zones which were defined as inlet, outlet, symme-
try, top, bottom and side. Inlet was specified at the front side of the domain
where there is an inflow of the fluid and outlet was named at the rear of the
domain where there is an outflow.
5.2 Mesh Generation
After the domain is created, a Boolean operation was performed to subtract
the model from the domain which represents the whole domain as a single body
rather than two different parts. The next step was to generate a fine meshing
over the created half of the domain. For a detailed mesh, the trimmed cell
meshing method was used. It provides a greater mesh quality and delivers a
superior solution as suggested by STAR CCM+.
30

Figure 5.2: Volumetric mesh of Model 11 fitted with Hull Vane®
5.3 Boundary Condition and Solution Setup
In this research, the flow simulation of the model was conducted with the
commercial software STAR CCM+. The system was considered as a three-
dimensional implicit unsteady, incompressible, multi-phase, viscous and turbu-
lent flow. The fluid properties of water are given in Table 5.1.
Table 5.1: Fluid properties of fresh water
Kinematic Viscosity, υ 1.004 x 10⁻⁶m2/s
Dynamic Viscosity, µ 0.001 pa-s
Density, ρ 998.46 kg/m3
The motion of the free surface is driven by the gravitational force so the gravity
effects should be taken into consideration in the boundary conditions. VOF
31
formulation is applied in CFD to solve multiphase free surface flows, consider-
ing the volume of fluid (VOF) method suitable for modeling free surface flow
such as ship motion through the open water, filling the tank and sloshing (Jones
and Clarke, 2010). For the computation of turbulence flows, there are differ-
ent turbulence models by default in the CFD package such as Standard and
Realizable k- models. The turbulence model of realizable k- two-layer method
has been applied for computation since it is expected to provide superior per-
formance compared with the standard k- two-layer model for flows involving
the boundary layer and it accurately predicts the spreading rate of planar jet.
For a realistic scenario, multi-phases are chosen for the fluid condition, which
is defined as air and water.
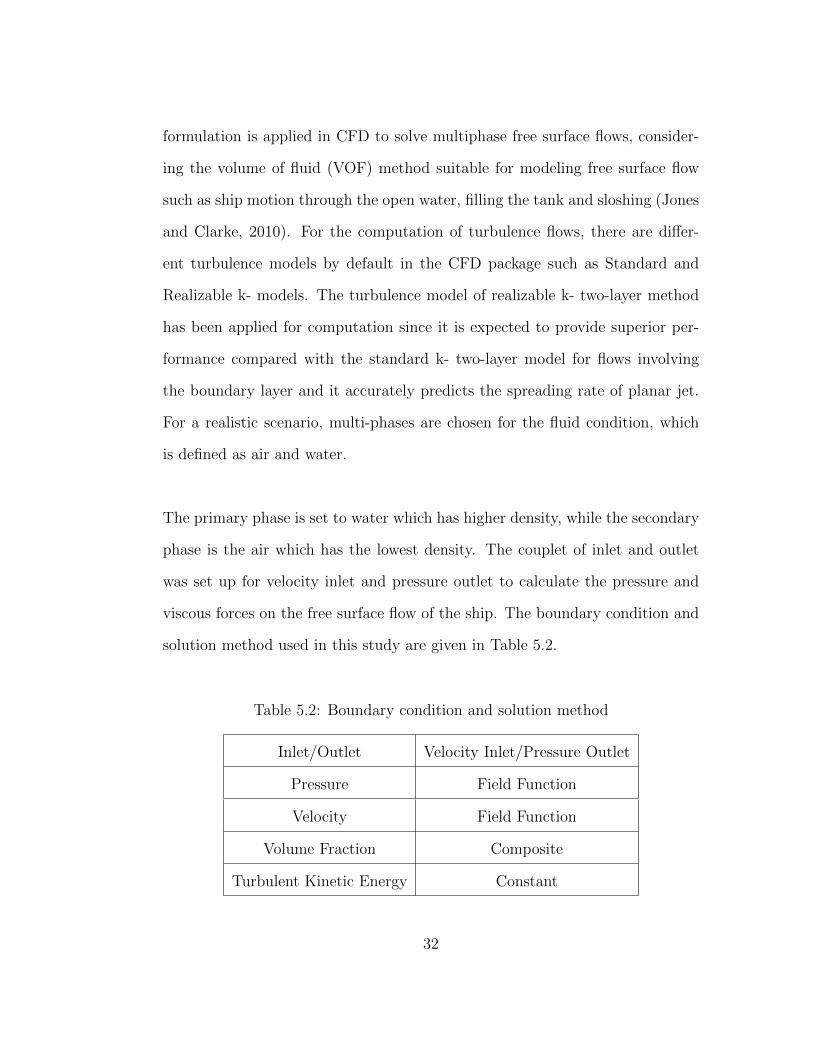
The primary phase is set to water which has higher density, while the secondary
phase is the air which has the lowest density. The couplet of inlet and outlet
was set up for velocity inlet and pressure outlet to calculate the pressure and
viscous forces on the free surface flow of the ship. The boundary condition and
solution method used in this study are given in Table 5.2.
Table 5.2: Boundary condition and solution method
Inlet/Outlet Velocity Inlet/Pressure Outlet
Pressure Field Function
Velocity Field Function
Volume Fraction Composite
Turbulent Kinetic Energy Constant
32

Chapter 6
Validation of CFD
Power prediction of high speed displacement hull forms has always been a chal-
lenge due to lack of data since it involves varying hull form parameters. The
results from the CFD analysis should be validated against the experimental
data to determine if the model is an accurate representation of the actual ves-
sel. It has to also be validated to justify the comparison of the bare hull model
and Hull Vane® fitted model. 5 of the AMECRC series hull forms have been
selected and the CFD analysis was carried out for 3 different Froude numbers.
The validation was carried out by performing resistance analysis on the round
bilge displacement hull form models #3, #4, #8, #11 and #13 for the Froude
numbers 0.5, 0.6 and 0.7. The results were compared against the available ex-
perimental data of the AMECRC models. The total resistance compared from
CFD and experimental data for round bilge hull forms are given in Table 6.1,
6.2, 6.3, 6.4 and 6.5.
33
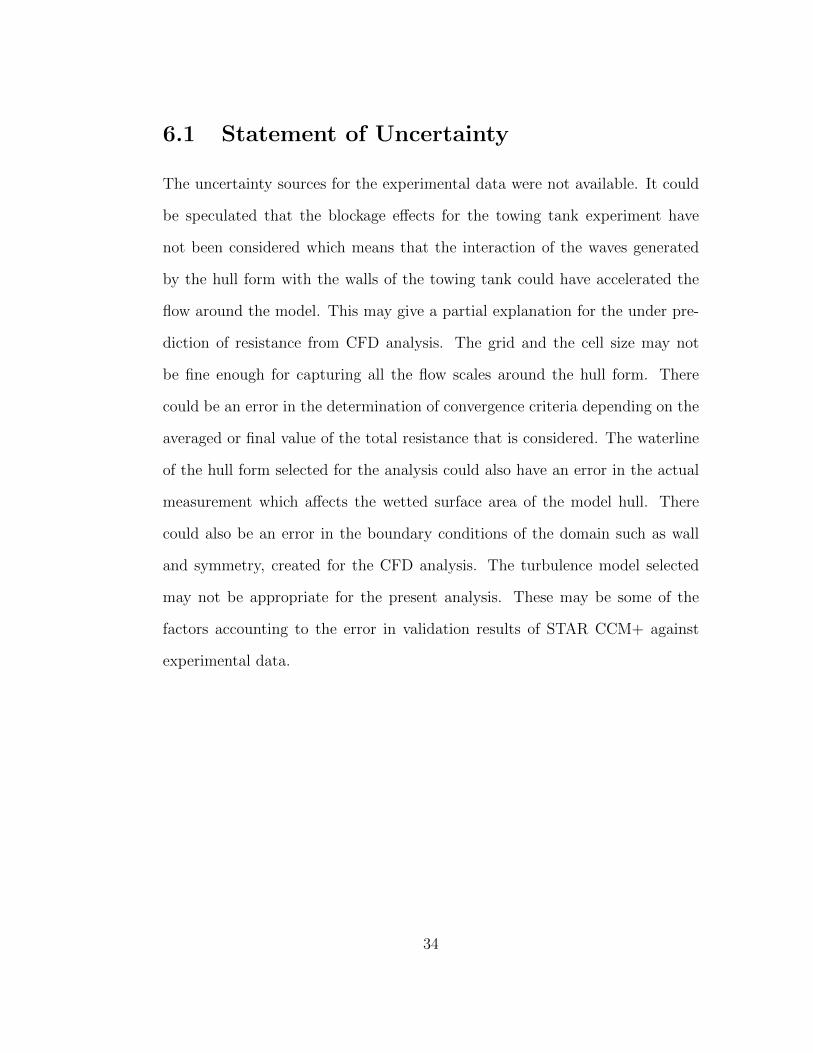
6.1 Statement of Uncertainty
The uncertainty sources for the experimental data were not available. It could
be speculated that the blockage effects for the towing tank experiment have
not been considered which means that the interaction of the waves generated
by the hull form with the walls of the towing tank could have accelerated the
flow around the model. This may give a partial explanation for the under pre-
diction of resistance from CFD analysis. The grid and the cell size may not
be fine enough for capturing all the flow scales around the hull form. There
could be an error in the determination of convergence criteria depending on the
averaged or final value of the total resistance that is considered. The waterline
of the hull form selected for the analysis could also have an error in the actual
measurement which affects the wetted surface area of the model hull. There
could also be an error in the boundary conditions of the domain such as wall
and symmetry, created for the CFD analysis. The turbulence model selected
may not be appropriate for the present analysis. These may be some of the
factors accounting to the error in validation results of STAR CCM+ against
experimental data.
34

Table 6.1: Resistance data Validation [Model 3]
Fn 103RT/∆(Experiment) 103RT/∆(CFD) Error%
0.5 58.0 51.7 11%
0.6 78.2 59.6 24%
0.7 94.7 80.3 15%
Figure 6.1: CFD and Experimental data for bare hull [Model 3]
35
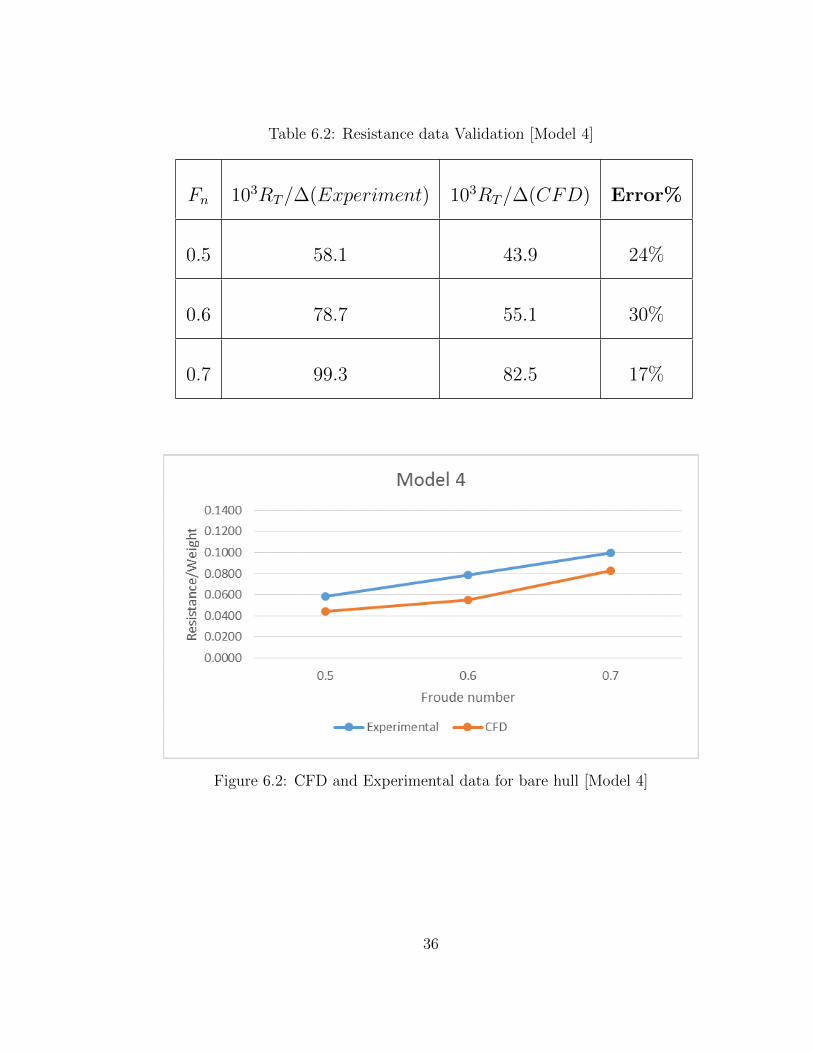
Table 6.2: Resistance data Validation [Model 4]
Fn 103RT/∆(Experiment) 103RT/∆(CFD) Error%
0.5 58.1 43.9 24%
0.6 78.7 55.1 30%
0.7 99.3 82.5 17%
Figure 6.2: CFD and Experimental data for bare hull [Model 4]
36
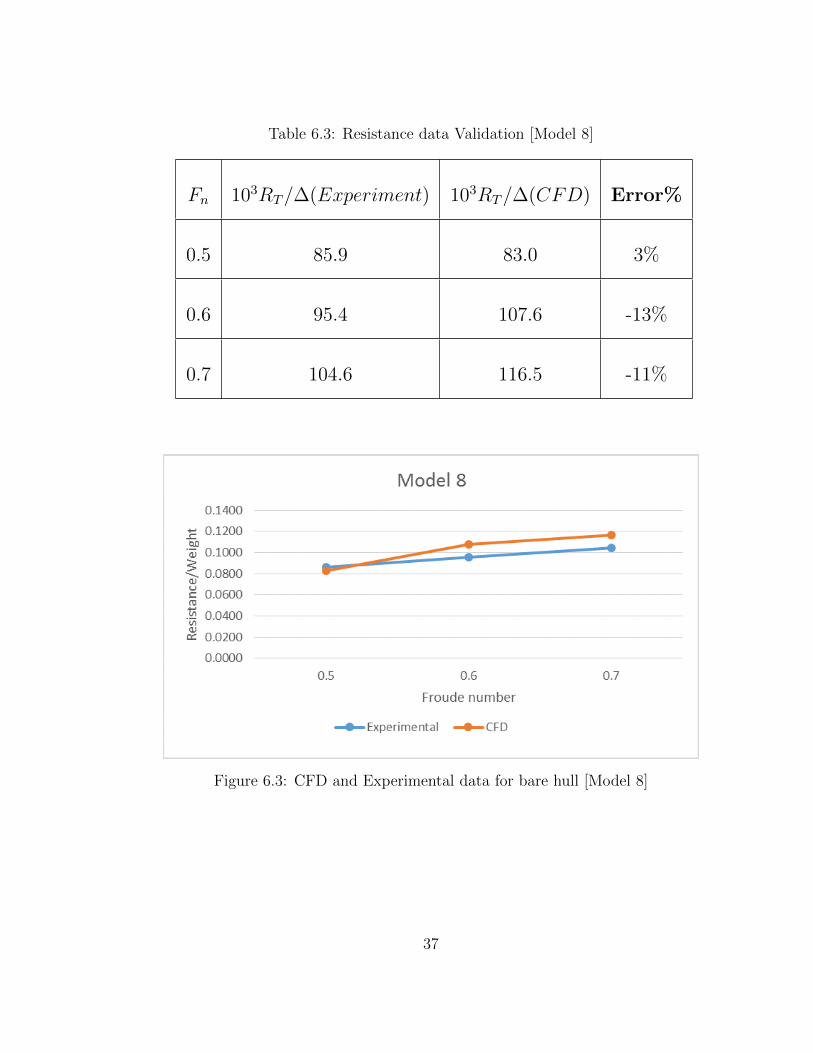
Table 6.3: Resistance data Validation [Model 8]
Fn 103RT/∆(Experiment) 103RT/∆(CFD) Error%
0.5 85.9 83.0 3%
0.6 95.4 107.6 -13%
0.7 104.6 116.5 -11%
Figure 6.3: CFD and Experimental data for bare hull [Model 8]
37
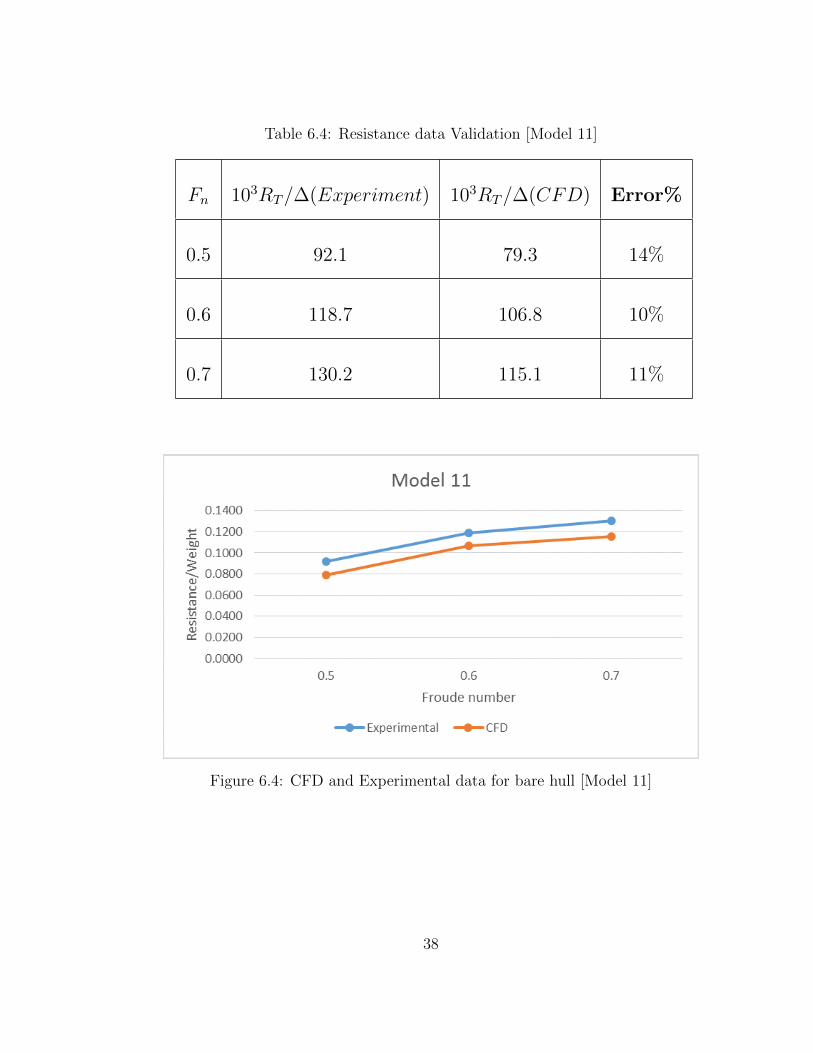
Table 6.4: Resistance data Validation [Model 11]
Fn 103RT/∆(Experiment) 103RT/∆(CFD) Error%
0.5 92.1 79.3 14%
0.6 118.7 106.8 10%
0.7 130.2 115.1 11%
Figure 6.4: CFD and Experimental data for bare hull [Model 11]
38
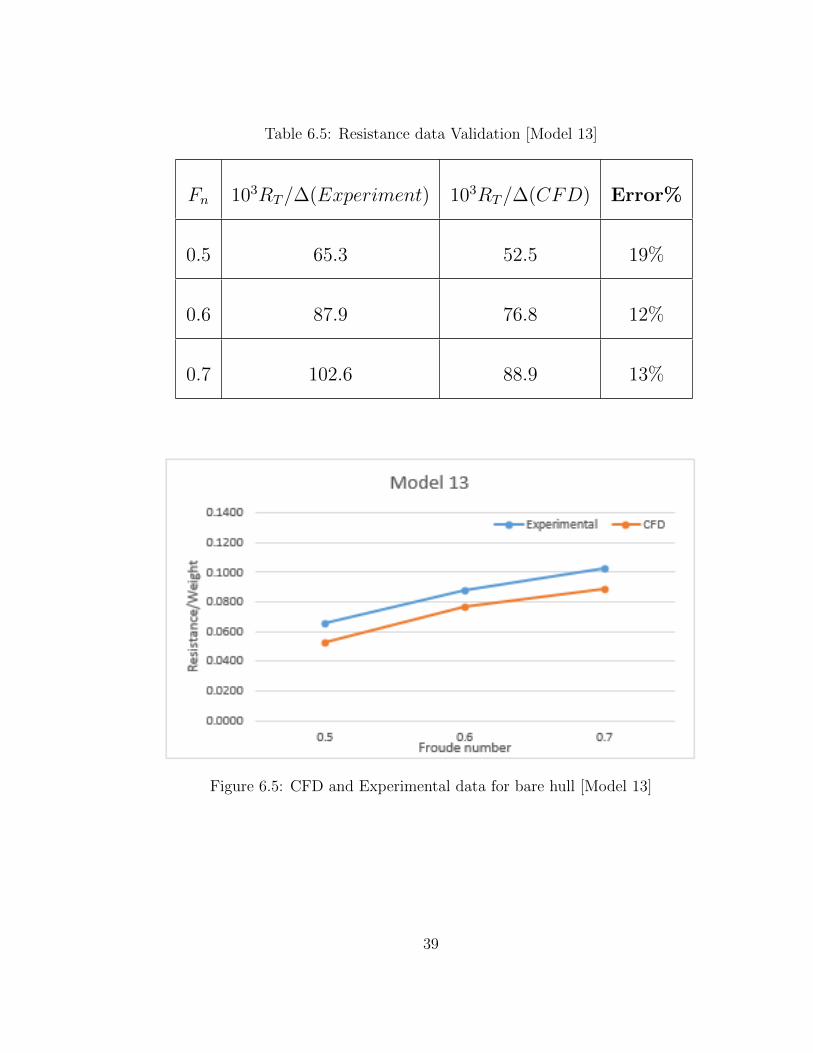
Table 6.5: Resistance data Validation [Model 13]
Fn 103RT/∆(Experiment) 103RT/∆(CFD) Error%
0.5 65.3 52.5 19%
0.6 87.9 76.8 12%
0.7 102.6 88.9 13%
Figure 6.5: CFD and Experimental data for bare hull [Model 13]
39
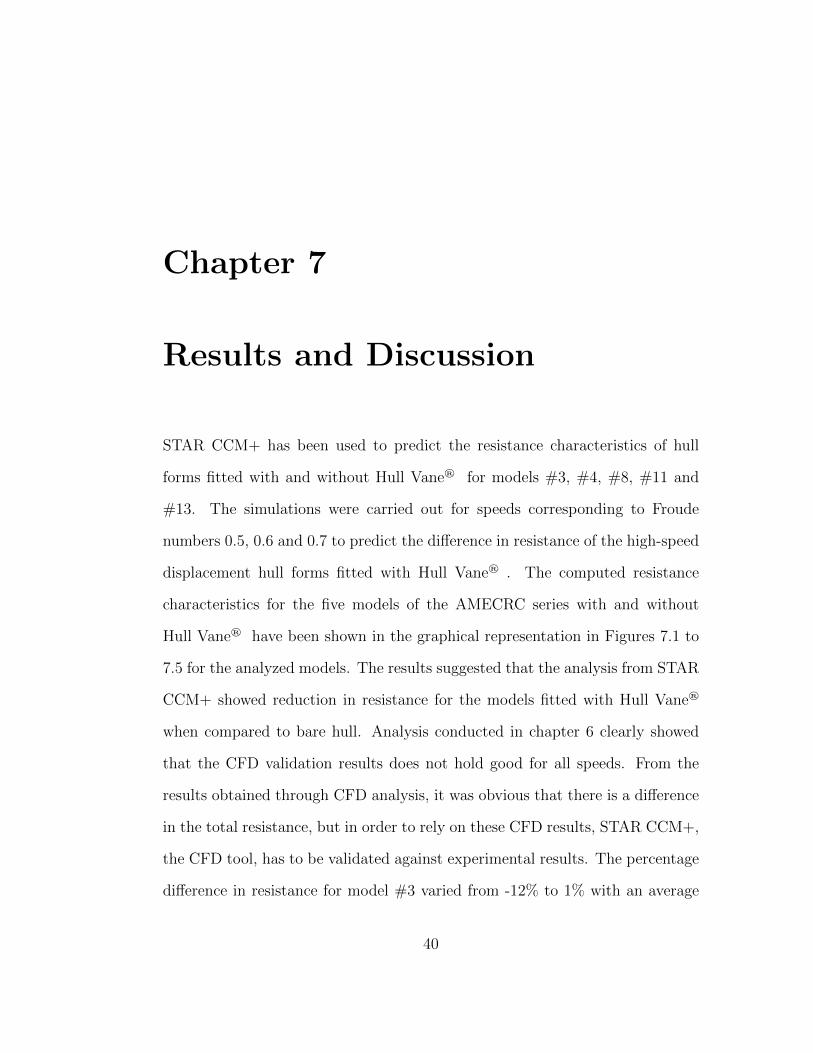
Chapter 7
Results and Discussion
STAR CCM+ has been used to predict the resistance characteristics of hull
forms fitted with and without Hull Vane® for models #3, #4, #8, #11 and
#13. The simulations were carried out for speeds corresponding to Froude
numbers 0.5, 0.6 and 0.7 to predict the difference in resistance of the high-speed
displacement hull forms fitted with Hull Vane® . The computed resistance
characteristics for the five models of the AMECRC series with and without
Hull Vane® have been shown in the graphical representation in Figures 7.1 to
7.5 for the analyzed models. The results suggested that the analysis from STAR
CCM+ showed reduction in resistance for the models fitted with Hull Vane®
when compared to bare hull. Analysis conducted in chapter 6 clearly showed
that the CFD validation results does not hold good for all speeds. From the
results obtained through CFD analysis, it was obvious that there is a difference
in the total resistance, but in order to rely on these CFD results, STAR CCM+,
the CFD tool, has to be validated against experimental results. The percentage
difference in resistance for model #3 varied from -12% to 1% with an average
40
of 4% reduction in resistance. The percentage difference in resistance for model
#4 varied from -4% to 26% with an average of 10% increase in resistance which
was not desired. The percentage difference in resistance for model #8 varied
from -26% to -7% with an average of 18.3% reduction in resistance. The per-
centage difference in resistance for model #11 varied from -29% to -16% with
an average of 21.3% reduction in resistance when fitted with Hull Vane® . The
percentage difference in resistance for model #13 varied from -17% to -8% with
an average of 12.3% reduction in resistance.
41
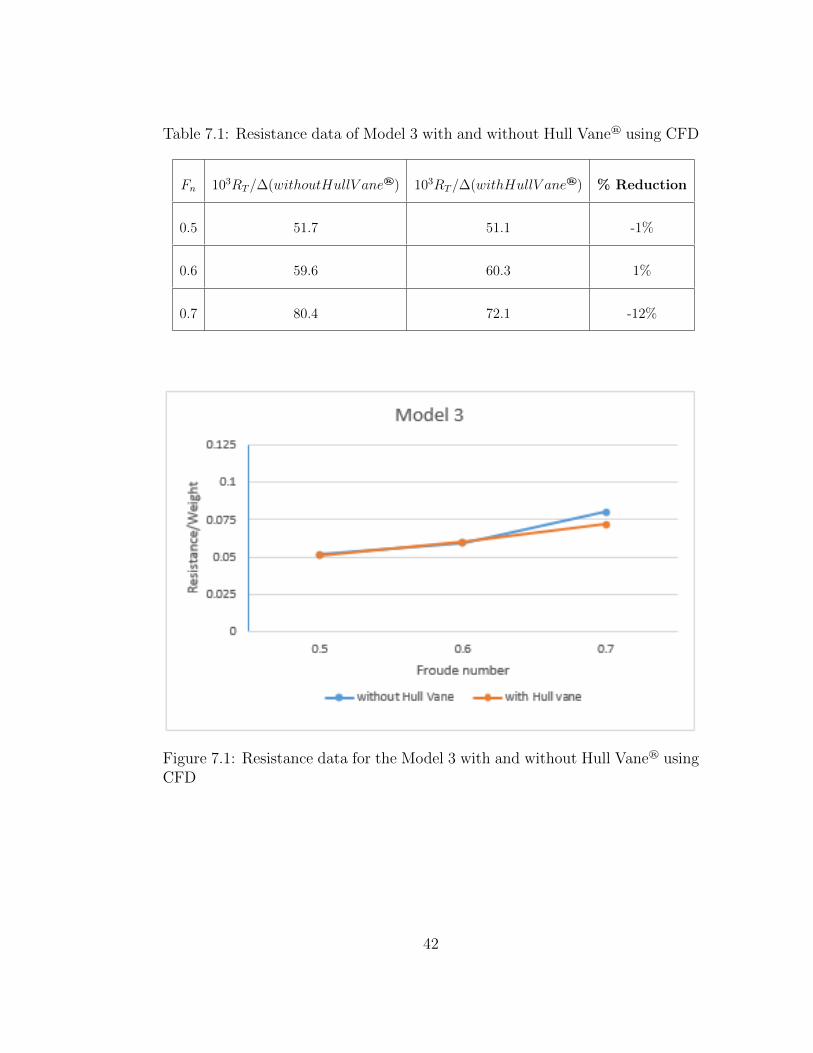
Table 7.1: Resistance data of Model 3 with and without Hull Vane® using CFD
Fn 103RT/∆(withoutHullV ane®) 103RT/∆(withHullV ane®) % Reduction
0.5 51.7 51.1 -1%
0.6 59.6 60.3 1%
0.7 80.4 72.1 -12%
Figure 7.1: Resistance data for the Model 3 with and without Hull Vane® usingCFD
42
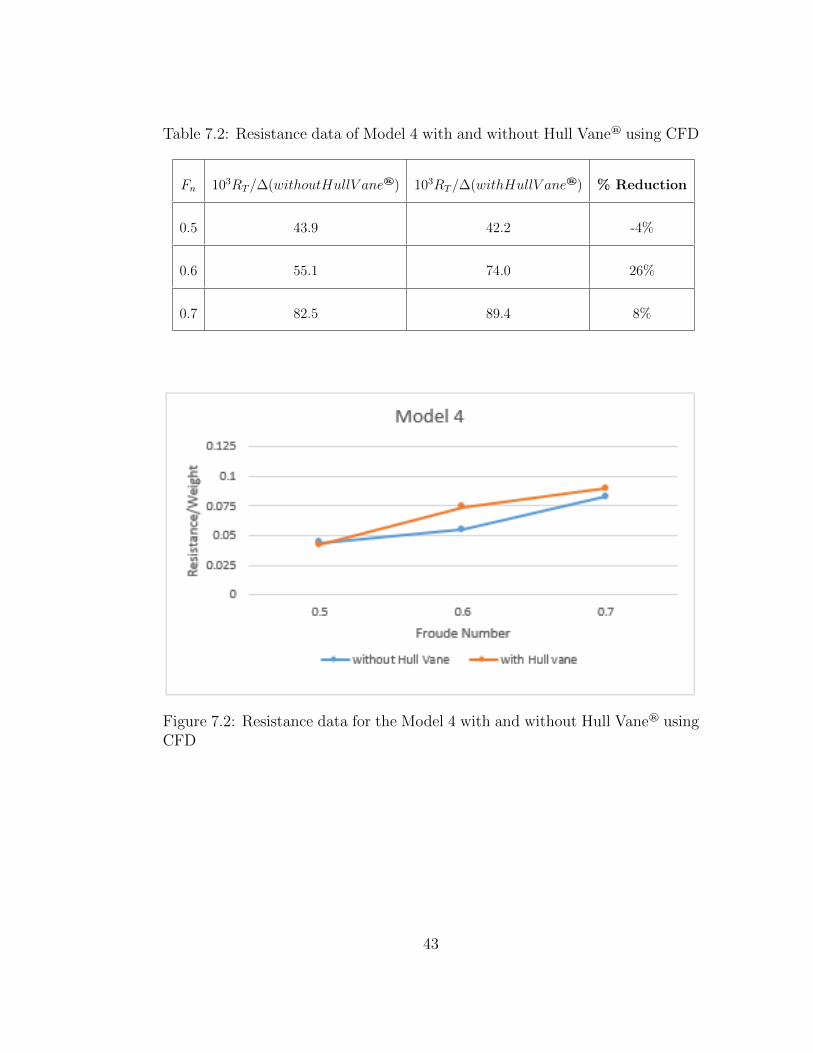
Table 7.2: Resistance data of Model 4 with and without Hull Vane® using CFD
Fn 103RT/∆(withoutHullV ane®) 103RT/∆(withHullV ane®) % Reduction
0.5 43.9 42.2 -4%
0.6 55.1 74.0 26%
0.7 82.5 89.4 8%
Figure 7.2: Resistance data for the Model 4 with and without Hull Vane® usingCFD
43
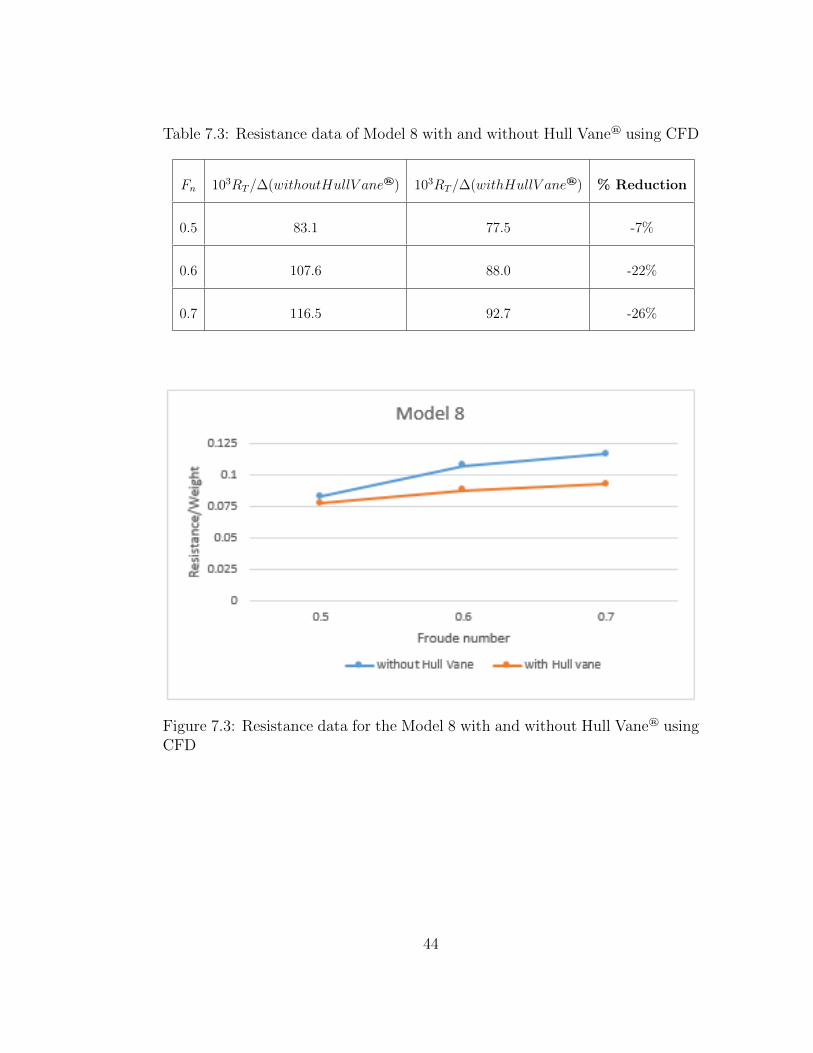
Table 7.3: Resistance data of Model 8 with and without Hull Vane® using CFD
Fn 103RT/∆(withoutHullV ane®) 103RT/∆(withHullV ane®) % Reduction
0.5 83.1 77.5 -7%
0.6 107.6 88.0 -22%
0.7 116.5 92.7 -26%
Figure 7.3: Resistance data for the Model 8 with and without Hull Vane® usingCFD
44
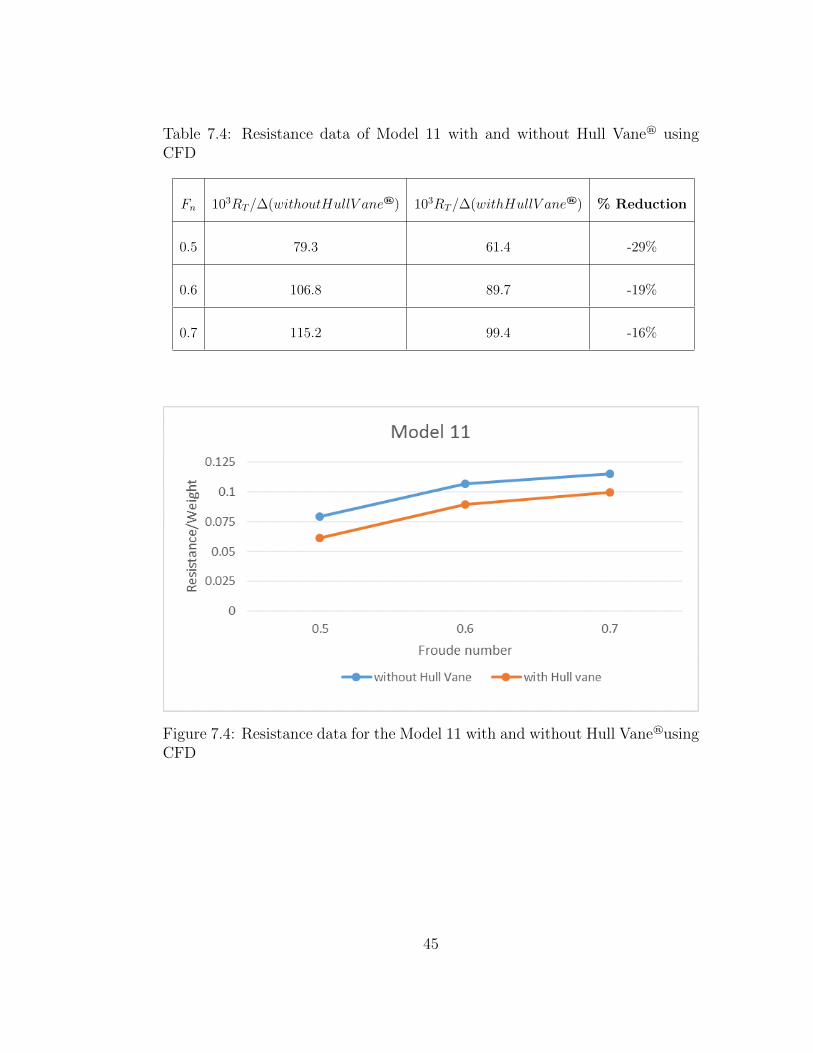
Table 7.4: Resistance data of Model 11 with and without Hull Vane® usingCFD
Fn 103RT/∆(withoutHullV ane®) 103RT/∆(withHullV ane®) % Reduction
0.5 79.3 61.4 -29%
0.6 106.8 89.7 -19%
0.7 115.2 99.4 -16%
Figure 7.4: Resistance data for the Model 11 with and without Hull Vane®usingCFD
45
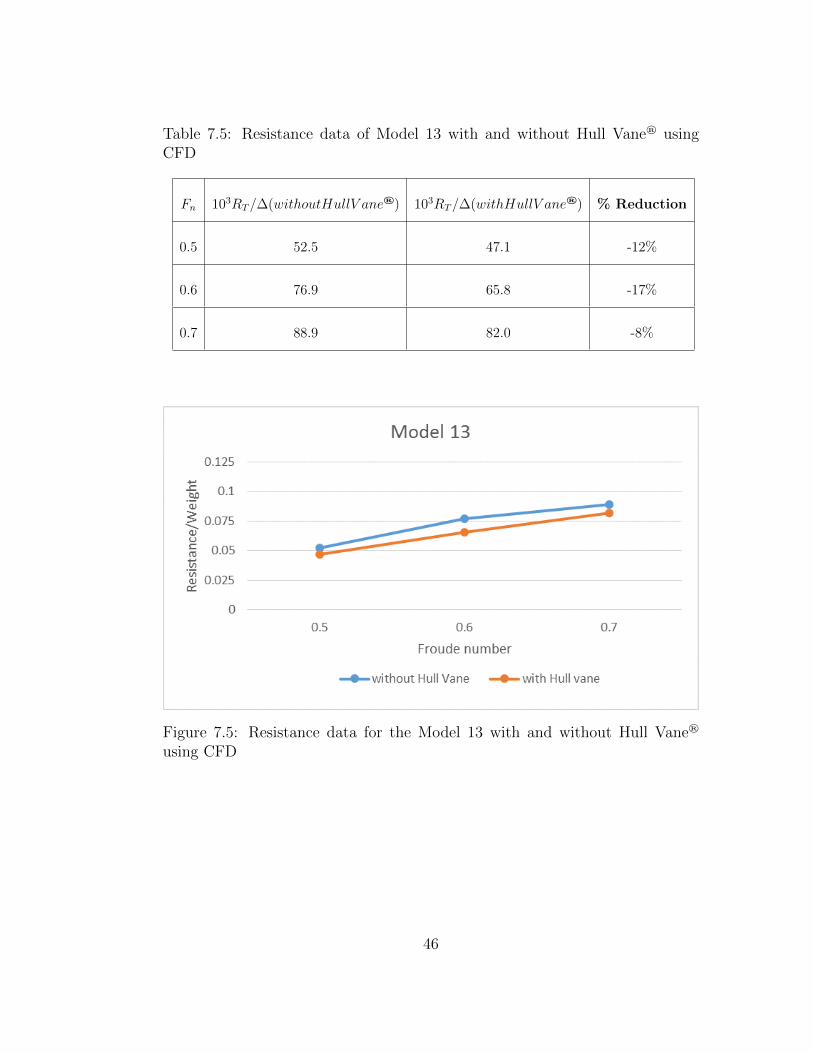
Table 7.5: Resistance data of Model 13 with and without Hull Vane® usingCFD
Fn 103RT/∆(withoutHullV ane®) 103RT/∆(withHullV ane®) % Reduction
0.5 52.5 47.1 -12%
0.6 76.9 65.8 -17%
0.7 88.9 82.0 -8%
Figure 7.5: Resistance data for the Model 13 with and without Hull Vane®
using CFD
46

Chapter 8
Conclusion
The objective of this research is to predict any favorable reduction in the re-
sistance characteristics of high-speed displacement hull forms when fitted with
Hull Vane® . 5 models of the AMECRC systematic series hull-forms based on
the HSDHF series have been chosen for CFD simulations as a part of this study.
MAXSURF has been used to generate the required curved surfaces (NURBS) of
AMECRC hull forms and Rhinoceros 3D has been used to convert the required
curved surfaces (NURBS) into a solid body. Hull Vane® was generated using
Rhinoceros and then the geometry has been imported into STAR CCM+, a
CFD tool. The objective of this thesis could be fulfilled with the existing CFD
tool, but the results obtained cannot be relied upon. In order to have complete
confidence in the CFD results, it is necessary to validate the CFD tool. For this
purpose, the CFD tool was used for the resistance prediction of bare hull and
the results were compared against the experimental data that had already been
established for the respective models of the AMECRC series. STAR CCM+, a
CFD tool has been used for the analysis purpose. We can conclude from this
47
work that:
• CFD results obtained were not accurate when compared to the experimen-
tal results but the curves show a similar trend as the experimental data,
thus providing encouragement that CFD tool could be used for resistance
prediction. The validation of results for the models showed a similar curve
trend between the experimental results and the resistance predicted using
STAR CCM+ except for model #3 and #8.
• The results obtained for models #8, #11 and #13 showed a significant
reduction in resistance of the hull forms fitted with Hull Vane® . There
was no considerable reduction in resistance for model #3, and an increase
in resistance for model #4 was observed when fitted with Hull Vane® .
• This could be the result of poor Hull Vane® optimization.
• It can be concluded that the results obtained from STAR CCM+ needed
more validation.
• Sensitivity analysis of AMECRC model #13 (Table A.1) shows that chang-
ing of the Hull Vane® position in x-direction does not account to a con-
siderable resistance reduction.
• Optimization of the Hull Vane® for different models and Froude numbers
would improve the resistance reduction. This research is intended to serve
as a foundation for future studies on Hull Vane® .
48

8.1 Future Work
• The research work carried out as a part of this thesis is limited to the
investigation of only 5 models of the AMECRC series hull forms. The
investigation can further be expanded to all the models of the AMECRC
series.
• The analysis could also be carried out with other systematic series of high
speed hull forms such as NPL series, Series 64 etc.
• Different NACA profiles could be selected for the Hull Vane® and rigor-
ous optimization (Longitudinal and vertical position of the Hull Vane® ,
wingspan) could be carried out for better results.
• In this study, only the calm water resistance has been considered. The
investigation could also be extended to the resistance in waves.
• STAR CCM+ was used for the resistance prediction. These results could
also be validated by conducting towing tank experiments or using other
CFD tools.
• Furthermore, the present study investigated only three Froude numbers
i.e. 0.5, 0.6, and 0.7. The analysis could be carried out for a wider range
of Froude numbers.
49

Bibliography
Andrews, I, Avala, V.K, Sahoo, P.K, and Ramakrishnan, S. (2015). Resistance
characteristics for high-speed hull forms with vanes. Washington D.C. 13th
International Conference on Fast Sea Transportation (FAST).
Cusanelli, D.S. and Cave, W.L (1993). Effect of stern flaps on powering perfor-
mance of the FFG7 Class. pages 39–50. Marine Technology 30/1.
Cusanelli, D.S. and Karafiath, G. (1997). Integrated wedge flap for enhanced
powering performance. pages 751–764, Sydney. 4th International Conference
on Fast Sea Transportation (FAST).
Cusanelli, D.S. and Karafiath, G (2001). Advances in stern flap design and
application. Southampton. 6th International Conference on Fast Sea Trans-
portation (FAST).
EHP Brochure (2013). http://mdx2.plm.automation.siemens.com/brochure/estimating-
hull-performance-brochure-ehp.
Havelock, T. H. (1951). Wave Resistance Theory and Its Applications to Ship
Problems. volume 59, pages 13–24. SNAME Transactions.
ITTC (2011). ITTC Recommended Process, Resistance Test. Technical report.
50
Jin, P., Su, B., and Tan, Z. (1980). A Parametric study on High-Speed Round
Bilge Displacement Hulls. High-Speed Surface Craft.
Jones, D. A. and Clark, D. B. (2010). Fluent Code of Flow around Naval Hull:
The DTMB 5415. Defense Science and Technology Organization, DSTO TR-
2465.
Kapsenberg, G.K (2012). The MARIN Systematic Series - Fast Displacement
Hulls. In Proceedings of the 22nd International HISWA Symposium on Yacht
Design and Yacht Construction - HISWA (2012), Amsterdam, The Nether-
lands.
Karafiath, G, Cusanelli, D.S., and Lin, C.W. (1999). Stern Wedges and Stern
Flaps for Improved Powering - U.S. Navy Experience. volume 107, pages
67–99. SNAME Transactions.
Karafiath, G and Fisher, S.C. (1987). The effect of stern wedges on ship pow-
ering performance. Naval Engineers Journal, pages 27–38.
Karimi, M. H., Seif, M. S., and Abbaspoor, M. (2013). An experimental study of
interceptors effectiveness on hydrodynamic performance of high-speed planing
crafts. Polish Maritime Research, 20(2):21–29.
Mahmood, S. and Huang, D. b. (2011). Resistance Calculations of Trimaran
Hull Form Using Computational Fluid Dynamics. In Proceedings of the 2011
Fourth International Joint Conference on Computational Sciences and Op-
timization, CSO ’11, pages 81–85, Washington, DC, USA. IEEE Computer
Society.
51
Marwood, W. J and Bailey, D. (1969). Design Data for High-speed Displacement
Hulls of Round-bilge Form. National Physical Laboratory, Ship Division.
Michell, J. H. (1898). The Wave Resistance of a Ship. Philosophical Magazine,
5(45):106–123.
Molland, A. F., Turnock, S. R., and Hudson, D. A. (2011). Ship resistance and
propulsion: practical estimation of propulsive power. Cambridge university
press.
Sahoo, P. K., Doctors, L. J., and Renilson, M. R. (1999). Theoretical and ex-
perimental investigation of resistance of high-speed round-bilge hull forms. In
5th International Conference Fast Sea Transportation (FAST), Seattle, pages
803–814.
Salas, M., Rosas, J., and Luco, R. (2004). Hydrodynamic analysis of the per-
formance of stern flaps in a semi-displacement hull. Latin American applied
research, 34(4):275–284.
Seo Kwang-Cheol, Gopakumar N., and Atlar M. (2013). Experimental inves-
tigation of dynamic trim control devices in fast speed vessel. Journal of
Navigation and Port Research, 37(2):137–142.
STAR CCM+ 11.06.010 (2017). STAR CCM+ User Guide.
Tsai, J. and Hwang, J.K. (2003). Study on the effect of interceptor on high
speed craft. Journal Society of Naval Architects and Marine Engineering,
22(2):95–101.
52
Tsai, J.F., Hwang, J.L., and Chou, S.K. (2004). Study on the Compound
Effects of Interceptor with Stern Flap for two mono-hulls with Transom Stern.
MTTS/IEEE Techno-Ocean 2, pages 1023–1028.
Uithof, K., Oossanen, P. van, Moerke, N., Oossanen, P. van, and Zaaijer, K.S.
(2014). An update on the development of the Hull vane. pages 211–221,
Athens. 9th International Conference on High-Performance Marine Vehicles
(HIPER).
Wang, C. T. (1980). Wedge Effect on Planing Hulls. Journal of Hydronautics,
14(4):122–124.
53

Appendix A
Sensitivity study
Table A.1: Sensitivity study of AMECRC model #13 fitted with Hull Vane®
for Fn 0.6
Fn 0.6 No Hull Vane® Hull Vane® at 0m
(x-axis)
Hull Vane® at -1m
(x-axis)
Hull Vane® at -2m
(x-axis)
103RT/∆ 76.9 66.1 65.8 64.7%
% Difference -16% -17% -19%
54
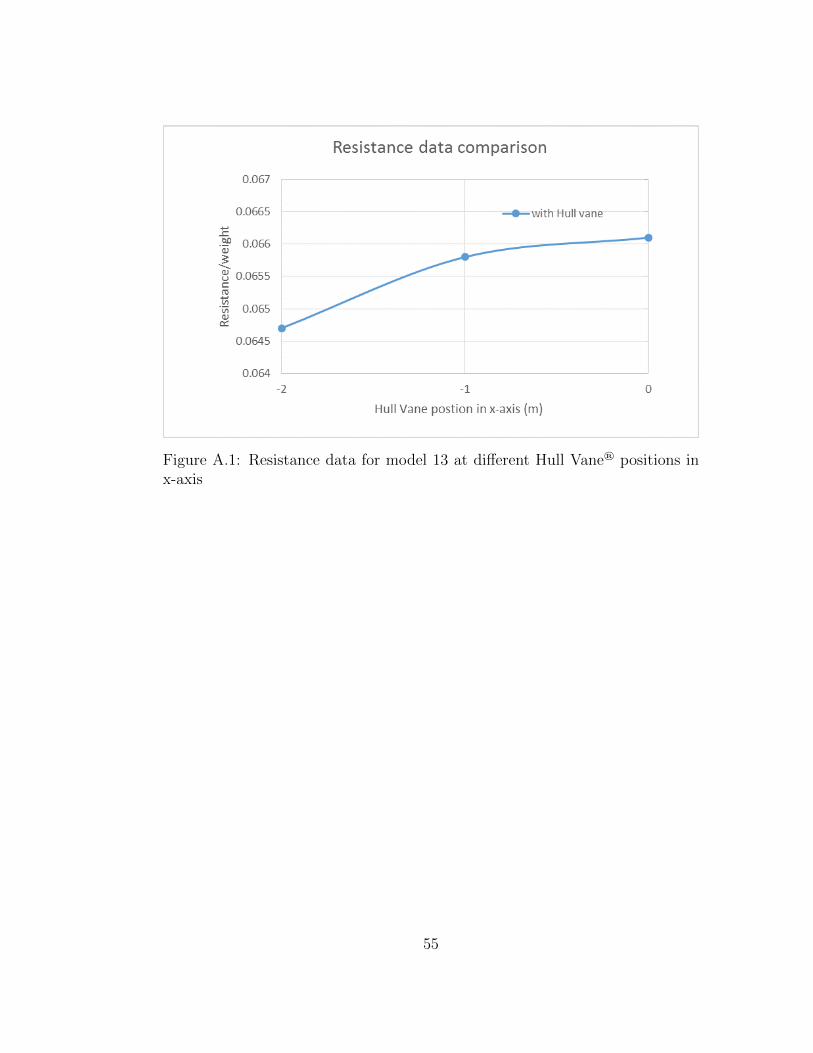
Figure A.1: Resistance data for model 13 at different Hull Vane® positions inx-axis
55