Embed Size (px)
Citation preview

CFA Institute Research Challenge Hosted by
Local Challenge CFA Society, Bahrain Bahrain Polytechnic

1
0.15
0.16
0.17
0.18
0.19
0.2
0.21
Zain Bahrain B.S.C. Stock Price Movements Key Highlights
We issued a Hold recommendation on Zain Bahrain B.S.C (Closed) based on the target price of BD 0.178, which could imply a -1.1% expected rate of return from its closing price of BD 0.180 as of December 31, 2015. Zain BH is one of the leading telecommunication operators in the Kingdom of Bahrain. It has an average daily trading volume of 20,000 shares. The recommendation is driven by the following factors:
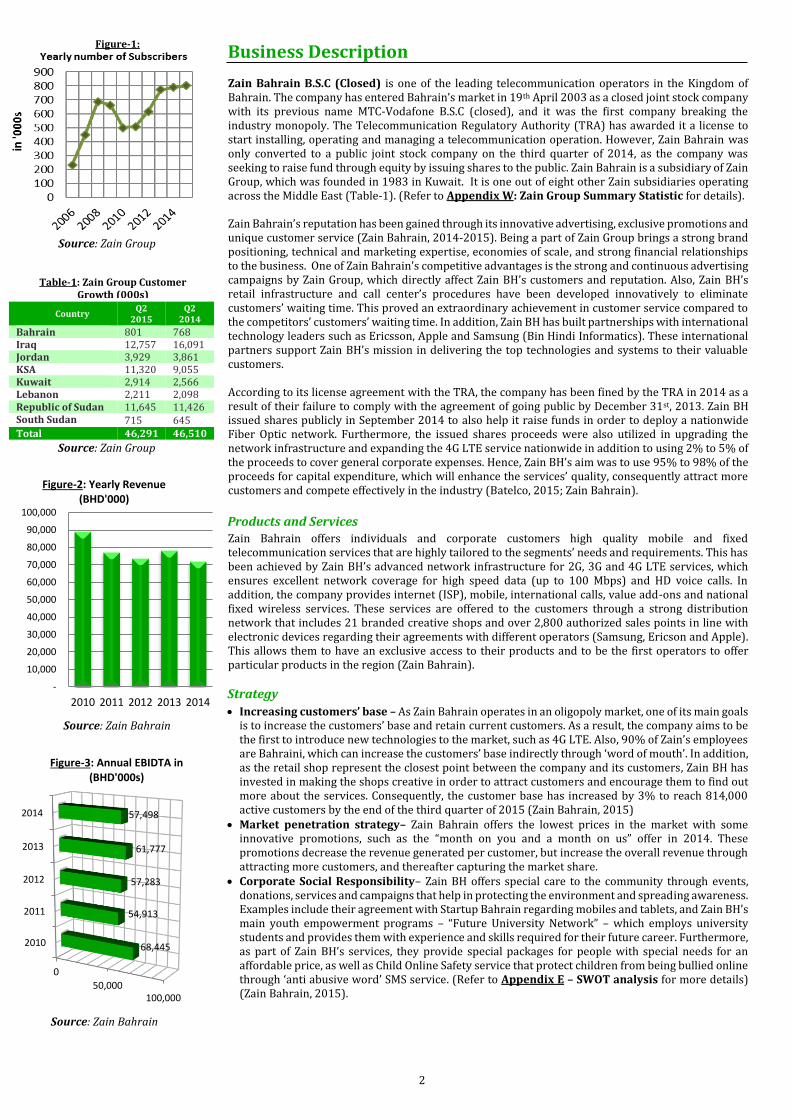
Negative Growth Drivers: Zain BH has been seeing fluctuations in revenues since 2009. Many
factors have contributed to the change in the company’s performance, mainly economic factors surrounding the Bahraini and the regional economy which has led revenues to drop from BD 93 million in 2009 to BD 71 million in 2015, showing a -5% growth in revenues.
Deteriorating financial performance and positioning: The financial performance analysis of Zain BH highlights lower potential for growth in a penetrated market, with a weak economic outlook and a heavily competitive market. These difficulties are incorporated in declining return on assets and return on capital employed.
Valuation results: An absolute valuation model – discounted cash flow analysis – and relative valuation model using the comparable company multiples approach have been used to estimate the target price of Zain BH. Using a forecast of future financial statements for the next 5 years, the target price for Zain BH is estimated to be at BD 0.178.
Main risk issues to Zain BH: Zain BH is facing multiple risk factors such as control on strategic decisions from MTC group, unfavorable global macro indicators, and a strong competition in a saturated market.
Recent Press Release
Zain Bahrain Announces Rise in Profits By 16.7% During Q3 2015 (19/10/2015) – Zain BH has
announced a 16.7% increase in profits for the nine-month period ended 30 September 2015 to reach BD 3.412 million ($9.026 million) compared to BD 2.924 million ($7.735 million) for the corresponding period in 2014. In addition, Zain BH have recorded a 7.6% decrease in revenues as of September 2015 for the same period from the previous year of 2014 as a result of the defaulted payment by customers.
Zain Bahrain Reflects on Year-end Achievements (05/01/2016) - Zain Bahrain has been rewarded with the ISO 27001:2013 Certification which makes them the first operator in the Middle East to be rewarded with that certificate for their performance in 2015. They have also been awarded with the ‘Middle East Customer Experience Program’ of the year 2015.
Telecommunication Sector, Service Industry
Bahrain Bourse Date: 31/12/2015 Current Price: BD 0.180 at (31/12/15) Recommendation: Hold Ticker - BB: ZAINBH USD 1.00: BD 0.377 Target Price: BD 0.178
Market Profile – Dec 2015
Closing Price BD 0.180
Annual Dividends BD 0.005
52-Week High/Low BD 0.185 – BD 0.162
YTD Change % 2.94%
Average Daily Volume 20,000
Shares Outstanding 368 M
Market Cap 62.560 M
EPS 0.013
EV / EBITDA 15.88x
EV / Sales 0.83x
Source: Bahrain Bourse
Valuation Method
Price Weight
DCF BD 0.175 50%
Multiples BD 0.182 50%
Target Price 0.178
Source: Team Estimates
Key Financials & Ratios 2013 2014 2015 2016E 2017E 2018E 2019E 2020E
Total Revenue (in BD’000) 73,533 78,081 71,804 72,050 70,033 68,072 66,166 64,313 Net Profit 13,047 6,409 5,403 4,142 4,581 3,856 3,408 2,355 Gross profit margin 79% 80% 84% 78% 80% 81% 83% 83% Net Profit margin 7% 6% 6% 6% 5% 4% 3% 2% Return on Capital Employed 9% 6% 6% 5% 4% 2% 1% 0%
ARPU (in BD) 0.101 0.091 0.088 0.085 0.080 0.078 0.076 0.073
Current Ratio 0.72 0.71 0.79 0.65 0.70 0.62 0.62 0.70 Total Asset Turnover 0.78 0.65 0.65 0.63 0.60 0.54 0.50 0.47 Account Receivable Turnover 3.85 3.43 3.35 3.20 3.10 2.99 2.88 2.77 Interest Coverage Ratio 17.83 6.28 7.15 5.91 5.10 3.68 2.88 2.03 Net Debt/EBITDA 1.74 1.83 1.59 1.81 1.85 2.19 2.20 2.30 Debt to Equity 1.02 0.88 0.84 0.78 0.76 0.91 0.89 0.88 Dividend Payout Ratio 1.18 1.37 0.80 0.29 0.31 0.42 0.54 0.88
Source: Team Estimates
Key Ratios Dec
2015
Dividend per share BD 0.005
Price to book value 1.23x
Price to earnings ratio 15.38x
Dividend Payout ratio 44.42%
Dividend Yield 2.50%
Return on Equity 6.95%
Return on Assets 3.70%
Equity to total assets 53.20%
Liabilities to total equity
0.88x
Source: Bahrain Bourse
This report is published for educational purposes only by
students competing in The CFA Institute Research
Challenge
BD
Source: Bahrain Bourse
Target Price = BD 0.178
2
Business Description Zain Bahrain B.S.C (Closed) is one of the leading telecommunication operators in the Kingdom of Bahrain. The company has entered Bahrain’s market in 19th April 2003 as a closed joint stock company with its previous name MTC-Vodafone B.S.C (closed), and it was the first company breaking the industry monopoly. The Telecommunication Regulatory Authority (TRA) has awarded it a license to start installing, operating and managing a telecommunication operation. However, Zain Bahrain was only converted to a public joint stock company on the third quarter of 2014, as the company was seeking to raise fund through equity by issuing shares to the public. Zain Bahrain is a subsidiary of Zain Group, which was founded in 1983 in Kuwait. It is one out of eight other Zain subsidiaries operating across the Middle East (Table-1). (Refer to Appendix W: Zain Group Summary Statistic for details). Zain Bahrain’s reputation has been gained through its innovative advertising, exclusive promotions and unique customer service (Zain Bahrain, 2014-2015). Being a part of Zain Group brings a strong brand positioning, technical and marketing expertise, economies of scale, and strong financial relationships to the business. One of Zain Bahrain’s competitive advantages is the strong and continuous advertising campaigns by Zain Group, which directly affect Zain BH’s customers and reputation. Also, Zain BH’s retail infrastructure and call center’s procedures have been developed innovatively to eliminate customers’ waiting time. This proved an extraordinary achievement in customer service compared to the competitors’ customers’ waiting time. In addition, Zain BH has built partnerships with international technology leaders such as Ericsson, Apple and Samsung (Bin Hindi Informatics). These international partners support Zain BH’s mission in delivering the top technologies and systems to their valuable customers. According to its license agreement with the TRA, the company has been fined by the TRA in 2014 as a result of their failure to comply with the agreement of going public by December 31st, 2013. Zain BH issued shares publicly in September 2014 to also help it raise funds in order to deploy a nationwide Fiber Optic network. Furthermore, the issued shares proceeds were also utilized in upgrading the network infrastructure and expanding the 4G LTE service nationwide in addition to using 2% to 5% of the proceeds to cover general corporate expenses. Hence, Zain BH’s aim was to use 95% to 98% of the proceeds for capital expenditure, which will enhance the services’ quality, consequently attract more customers and compete effectively in the industry (Batelco, 2015; Zain Bahrain).
Products and Services Zain Bahrain offers individuals and corporate customers high quality mobile and fixed telecommunication services that are highly tailored to the segments’ needs and requirements. This has been achieved by Zain BH’s advanced network infrastructure for 2G, 3G and 4G LTE services, which ensures excellent network coverage for high speed data (up to 100 Mbps) and HD voice calls. In addition, the company provides internet (ISP), mobile, international calls, value add-ons and national fixed wireless services. These services are offered to the customers through a strong distribution network that includes 21 branded creative shops and over 2,800 authorized sales points in line with electronic devices regarding their agreements with different operators (Samsung, Ericson and Apple). This allows them to have an exclusive access to their products and to be the first operators to offer particular products in the region (Zain Bahrain).
Strategy
Increasing customers’ base – As Zain Bahrain operates in an oligopoly market, one of its main goals is to increase the customers’ base and retain current customers. As a result, the company aims to be the first to introduce new technologies to the market, such as 4G LTE. Also, 90% of Zain’s employees are Bahraini, which can increase the customers’ base indirectly through ‘word of mouth’. In addition, as the retail shop represent the closest point between the company and its customers, Zain BH has invested in making the shops creative in order to attract customers and encourage them to find out more about the services. Consequently, the customer base has increased by 3% to reach 814,000 active customers by the end of the third quarter of 2015 (Zain Bahrain, 2015)
Market penetration strategy– Zain Bahrain offers the lowest prices in the market with some innovative promotions, such as the “month on you and a month on us” offer in 2014. These promotions decrease the revenue generated per customer, but increase the overall revenue through attracting more customers, and thereafter capturing the market share.
Corporate Social Responsibility– Zain BH offers special care to the community through events, donations, services and campaigns that help in protecting the environment and spreading awareness. Examples include their agreement with Startup Bahrain regarding mobiles and tablets, and Zain BH’s main youth empowerment programs – “Future University Network” – which employs university students and provides them with experience and skills required for their future career. Furthermore, as part of Zain BH’s services, they provide special packages for people with special needs for an affordable price, as well as Child Online Safety service that protect children from being bullied online through ‘anti abusive word’ SMS service. (Refer to Appendix E – SWOT analysis for more details) (Zain Bahrain, 2015).
Country Q2
2015 Q2
2014
Bahrain 801 768 Iraq 12,757 16,091 Jordan 3,929 3,861 KSA 11,320 9,055 Kuwait 2,914 2,566 Lebanon 2,211 2,098 Republic of Sudan 11,645 11,426 South Sudan 715 645 Total 46,291 46,510
Source: Zain Group
-
10,000
20,000
30,000
40,000
50,000
60,000
70,000
80,000
90,000
100,000
2010 2011 2012 2013 2014
Figure-2: Yearly Revenue (BHD'000)
Source: Zain Bahrain
0
50,000100,000
2010
2011
2012
2013
2014
68,445
54,913
57,283
61,777
57,498
Figure-3: Annual EBIDTA in (BHD'000s)
Source: Zain Bahrain
Table-1: Zain Group Customer Growth (000s)
Source: Zain Group
Figure-1:
3
Management and Governance
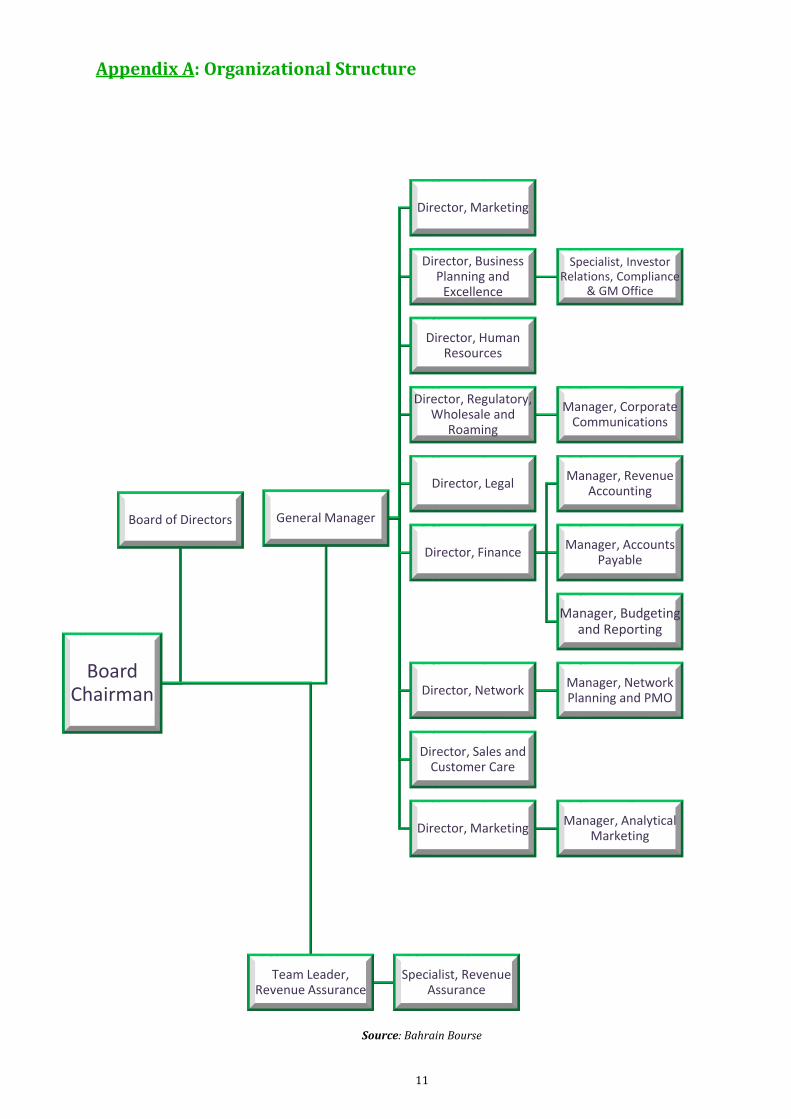
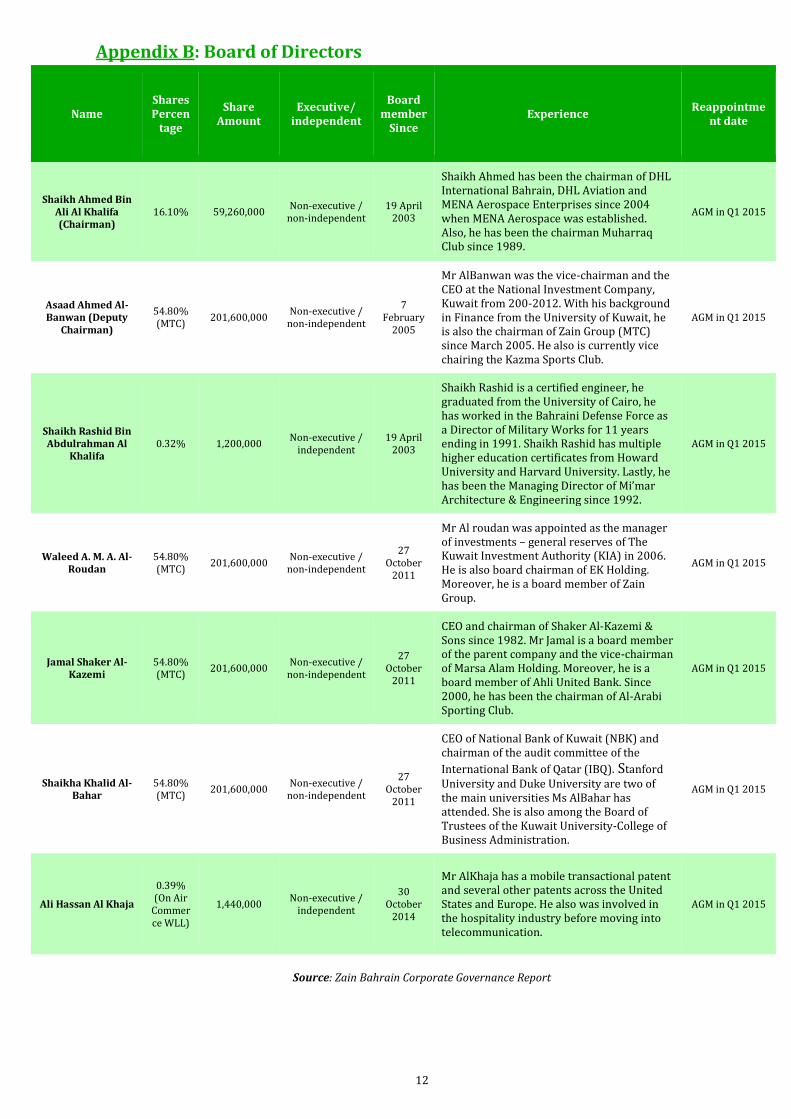
Organizational Management and Board Structure The company’s executive management and board of directors come from various sectors and industries bringing together multiple skills that are extremely beneficial to the company especially with the complexity of the telecommunication industry (Figure-4). All board members are expecting re-elections in the Annual General Meeting of 2015 (Refer to Appendix B – Board of Directors for more details). The company has a total of seven board members, which comprises of the Chairman (non-independent), two independent non-executives and four non-independent members that represent the parent company. In addition, the company has established levels of management where the organizational structure encourages accountability and transparency throughout their operations and projects. (Refer to Appendix A – Organizational Structure for more details).
Corporate Governance Zain BH has reported its compliance with the Bahraini Corporate Governance Code and the Central Bank of Bahrain Module regulation on corporate governance especially with the following measures: Company Code of Ethics and Directors’ Code of Ethics: The code of ethics ensures best practice
policies and removal of conflict of interest and is monitored by the parent company. Establishment of Committees: Upon being a public company listed on Bahrain Bourse, the
company has established two committees: Board Audit Committee and Nomination and Remuneration Committees (Refer to Appendix D- Board committees for more details) and has drafted charters for both committees that voted approval in the 2015 Annual General Meeting.
Reporting: Zain BH reports to its shareholders quarterly, semiannually and annually. The annual reports are audited by an independent external auditing firm approved and announced by the company.
Whistle-blowing and termination of BOD: Zain BH applies an open whistle-blowing policy that allows transparency and rightful accountability of fraud. (Refer to Appendix C – Board Termination Process for more details).
Industry Overview and Competitive Positioning Bahrain Economic Performance Overview
Negative Economic Growth Prospects Bahrain’s economy is declining due to major drop in oil prices, which according to the telegraph is expected to drop to $10 a barrel. Major banks including Standards Chartered has downgraded their oil outlook to $10 to join Goldman Sachs, RBS & Morgan Stanley in their calls (The Telegraph, 2016). Bahrain’s debt rating has been downgraded on June 5th 2015 by Fitch from BBB to BBB- as a reflection of the decrease in oil prices and its effect on the economy (Reuters, 2015). The Ministry of Industry and Commerce stated a reduction in a number of governmental subsidies in order to compensate the negative outlook and help reduce the current budget deficit. Fitch added that revenues will be boosted by the other non-hydrocarbon subdivision growth of 4.4% in 2015 and around 3.5% in 2016-2017 which is mainly from manufacturing, construction, tourism, social and personal services (Writer, 2015). This change directly affects the stock prices since they are affected by the fluctuation of the market (Refer to Appendix E - SWOT Analysis for further details).
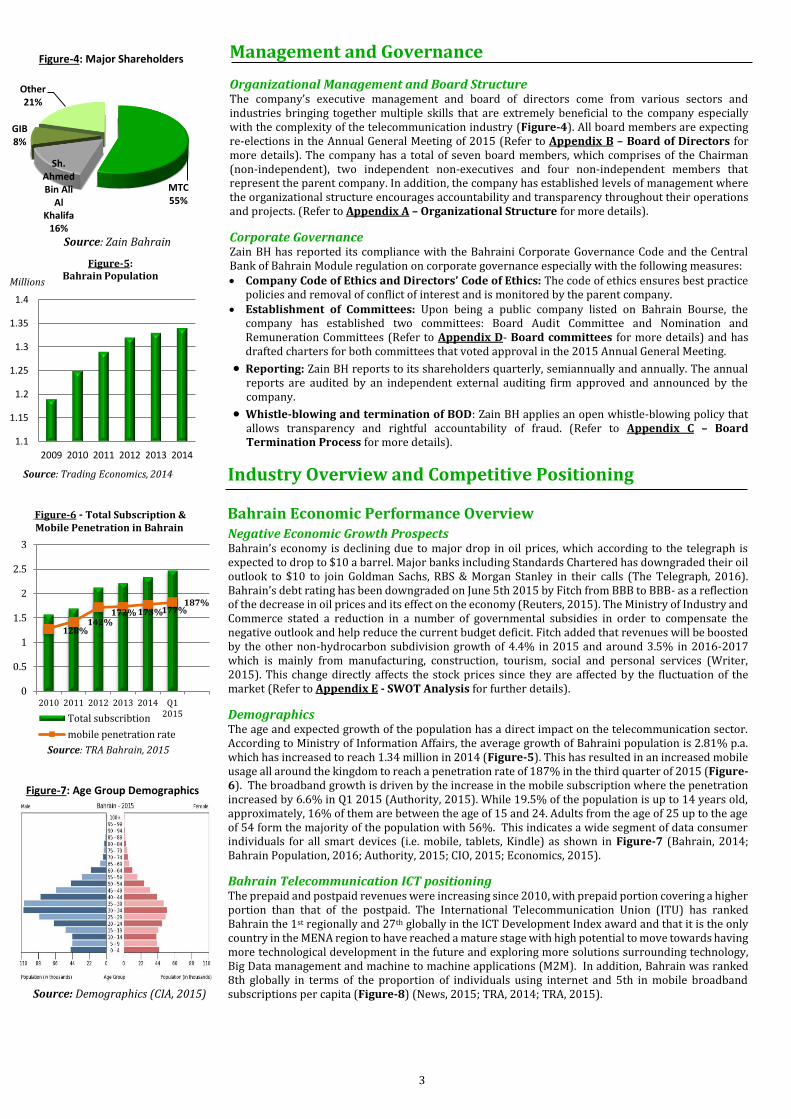
Demographics The age and expected growth of the population has a direct impact on the telecommunication sector. According to Ministry of Information Affairs, the average growth of Bahraini population is 2.81% p.a. which has increased to reach 1.34 million in 2014 (Figure-5). This has resulted in an increased mobile usage all around the kingdom to reach a penetration rate of 187% in the third quarter of 2015 (Figure-6). The broadband growth is driven by the increase in the mobile subscription where the penetration increased by 6.6% in Q1 2015 (Authority, 2015). While 19.5% of the population is up to 14 years old, approximately, 16% of them are between the age of 15 and 24. Adults from the age of 25 up to the age of 54 form the majority of the population with 56%. This indicates a wide segment of data consumer individuals for all smart devices (i.e. mobile, tablets, Kindle) as shown in Figure-7 (Bahrain, 2014; Bahrain Population, 2016; Authority, 2015; CIO, 2015; Economics, 2015).
Bahrain Telecommunication ICT positioning The prepaid and postpaid revenues were increasing since 2010, with prepaid portion covering a higher portion than that of the postpaid. The International Telecommunication Union (ITU) has ranked Bahrain the 1st regionally and 27th globally in the ICT Development Index award and that it is the only country in the MENA region to have reached a mature stage with high potential to move towards having more technological development in the future and exploring more solutions surrounding technology, Big Data management and machine to machine applications (M2M). In addition, Bahrain was ranked 8th globally in terms of the proportion of individuals using internet and 5th in mobile broadband subscriptions per capita (Figure-8) (News, 2015; TRA, 2014; TRA, 2015).
MTC 55%
Sh. Ahmed Bin Ali
Al Khalifa
16%
GIB 8%
Other 21%
Figure-4: Major Shareholders
Source: Zain Bahrain
Source: Demographics (CIA, 2015)
Figure-7: Age Group Demographics
Source: TRA Bahrain, 2015
128%142%
172% 173%177%187%
0
0.5
1
1.5
2
2.5
3
2010 2011 2012 2013 2014 Q12015Total subscribtion
mobile penetration rate
Figure-6 - Total Subscription & Mobile Penetration in Bahrain
1.1
1.15
1.2
1.25
1.3
1.35
1.4
2009 2010 2011 2012 2013 2014
Figure-5:Bahrain Population
Millions
Source: Trading Economics, 2014
4
External Influencers Affecting the Telecommunication Market There are several external factors that could have significant effects on the telecommunication market which includes the following: Political Issues: The Bahraini market faces occasional political unrest that increases the data
consumption due to increased news exchange and communication. Subsidy Cuts: The reduction of governmental subsidies and increase in fuel prices by 60% could
decrease consumer spending and lead to lower demand on telecommunication services. Regulatory Considerations: The TRA regulations enforce price reduction in certain telecom
services that may cost the companies a partial loss of their revenues in the short run. Companies will also have to invest in more environment-friendly devices while regulating the radiations level. Despite the short-term cost, those regulations are found to have long-term benefits for the company and assist in retaining their clients.
Consumer Preferences: The recent TRA report shows that customers’ are shifting their preference to postpaid services over prepaid service and this may require Zain BH to promote fixed-amount installments-based packages that suite with the clients’ needs. Prepaid packages are used currently by Zain BH, VIVA and Batelco. The cost is BD 1 per week. (Refer to Table-M1 in Appendix M – Market analysis and Appendix F - PESTEL Analysis for a more detailed analysis.)
Competitive Positioning
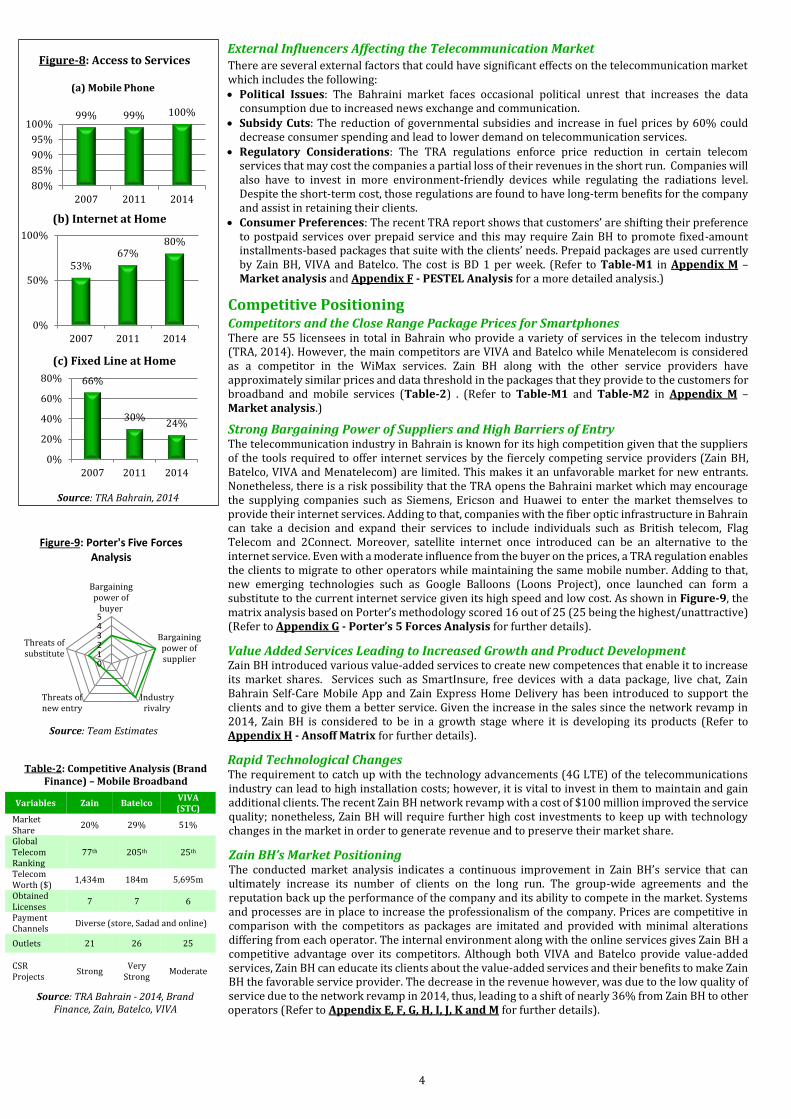
Competitors and the Close Range Package Prices for Smartphones There are 55 licensees in total in Bahrain who provide a variety of services in the telecom industry (TRA, 2014). However, the main competitors are VIVA and Batelco while Menatelecom is considered as a competitor in the WiMax services. Zain BH along with the other service providers have approximately similar prices and data threshold in the packages that they provide to the customers for broadband and mobile services (Table-2) . (Refer to Table-M1 and Table-M2 in Appendix M – Market analysis.)
Strong Bargaining Power of Suppliers and High Barriers of Entry The telecommunication industry in Bahrain is known for its high competition given that the suppliers of the tools required to offer internet services by the fiercely competing service providers (Zain BH, Batelco, VIVA and Menatelecom) are limited. This makes it an unfavorable market for new entrants. Nonetheless, there is a risk possibility that the TRA opens the Bahraini market which may encourage the supplying companies such as Siemens, Ericson and Huawei to enter the market themselves to provide their internet services. Adding to that, companies with the fiber optic infrastructure in Bahrain can take a decision and expand their services to include individuals such as British telecom, Flag Telecom and 2Connect. Moreover, satellite internet once introduced can be an alternative to the internet service. Even with a moderate influence from the buyer on the prices, a TRA regulation enables the clients to migrate to other operators while maintaining the same mobile number. Adding to that, new emerging technologies such as Google Balloons (Loons Project), once launched can form a substitute to the current internet service given its high speed and low cost. As shown in Figure-9, the matrix analysis based on Porter’s methodology scored 16 out of 25 (25 being the highest/unattractive) (Refer to Appendix G - Porter’s 5 Forces Analysis for further details).
Value Added Services Leading to Increased Growth and Product Development Zain BH introduced various value-added services to create new competences that enable it to increase its market shares. Services such as SmartInsure, free devices with a data package, live chat, Zain Bahrain Self-Care Mobile App and Zain Express Home Delivery has been introduced to support the clients and to give them a better service. Given the increase in the sales since the network revamp in 2014, Zain BH is considered to be in a growth stage where it is developing its products (Refer to Appendix H - Ansoff Matrix for further details).
Rapid Technological Changes The requirement to catch up with the technology advancements (4G LTE) of the telecommunications industry can lead to high installation costs; however, it is vital to invest in them to maintain and gain additional clients. The recent Zain BH network revamp with a cost of $100 million improved the service quality; nonetheless, Zain BH will require further high cost investments to keep up with technology changes in the market in order to generate revenue and to preserve their market share.
Zain BH’s Market Positioning The conducted market analysis indicates a continuous improvement in Zain BH’s service that can ultimately increase its number of clients on the long run. The group-wide agreements and the reputation back up the performance of the company and its ability to compete in the market. Systems and processes are in place to increase the professionalism of the company. Prices are competitive in comparison with the competitors as packages are imitated and provided with minimal alterations differing from each operator. The internal environment along with the online services gives Zain BH a competitive advantage over its competitors. Although both VIVA and Batelco provide value-added services, Zain BH can educate its clients about the value-added services and their benefits to make Zain BH the favorable service provider. The decrease in the revenue however, was due to the low quality of service due to the network revamp in 2014, thus, leading to a shift of nearly 36% from Zain BH to other operators (Refer to Appendix E, F, G, H, I, J, K and M for further details).
Variables Zain Batelco VIVA (STC)
Market Share
20% 29% 51%
Global Telecom Ranking
77th 205th 25th
Telecom Worth ($)
1,434m 184m 5,695m
Obtained Licenses
7 7 6
Payment Channels
Diverse (store, Sadad and online)
Outlets 21 26 25
CSR Projects
Strong Very
Strong Moderate
Table-2: Competitive Analysis (Brand Finance) – Mobile Broadband
Source: TRA Bahrain - 2014, Brand Finance, Zain, Batelco, VIVA
012345
Bargainingpower of
buyer
Bargainingpower ofsupplier
Industryrivalry
Threats ofnew entry
Threats ofsubstitute
Figure-9: Porter's Five Forces Analysis
Source: Team Estimates
Source: TRA Bahrain, 2014
99% 99% 100%
80%
85%
90%
95%
100%
2007 2011 2014
(a) Mobile Phone
53%67%
80%
0%
50%
100%
2007 2011 2014
(b) Internet at Home
66%
30%24%
0%
20%
40%
60%
80%
2007 2011 2014
(c) Fixed Line at Home
Figure-8: Access to Services

5
Investment Summary For Zain BH, we issue a Hold recommendation as the target price of BD 0.178 is only slightly lower than the market price of BD 0.180 as of December 2015 (Appendix V – Target Prices and Stock Recommendations). This implies a -1.1% expected rate of return from its closing price, which in absolute terms is not materially large. This recommendation is supported by the information mentioned herein.
Valuation Methods The target price is derived by combining two methods, namely the discounted cash flow model (DCF) and the multiples approach using comparable. For the DCF analysis, cash flows has been forecasted and discounted to arrive at a target price of BD 0.175. For the multiples approach, several multiples using regional peer group in the telecommunication industry with comparable attributes has been selected to arrive at a target price of BD 0.182. Calculating an average of the two methods implies a target price of BD 0.178. Equal weights have been applied to each method as there is no reason as to why a specific treatment should be giving to any of the two methods (Table-3).
Weakening Economic Outlook The 2015 developments in the Bahraini market and the regional changes due to the severe decrease in oil prices has affected Zain BH and its competitors. Consumer spending is expected to decrease due to inflation of necessity prices, especially octane fuel price which has increased in early 2016. Government reforms and budget cuts in government spending, salaries and economic development show less confidence in investing in the Bahraini market, especially for 2016. The oil prices are expected to decrease further to $10 per barrel which will continuously affect the Bahraini economy and Zain BH. The Bahraini decision of following the US interest rates hike will also impose negative possibilities on the market and the economic future (Figure-10).
Highly Penetrated Market Zain BH is competing with several communication companies with a 187% penetration rate of the Bahraini telecommunication sector, reducing the ability of Zain BH to acquire market share easily. They should thus increase their focus on quality of services provided rather than the existence of the service. With customers shifting away from Zain BH and the fluctuation in customer base since 2009 with slow growth due to poor quality and assumed higher prices, it has become difficult for Zain BH to generate more profits. As a telecommunication operator, it is extremely difficult to operate within a highly penetrated market especially that Zain BH is operating in a relatively small populated country. The company should thus strive for developments in technology to advance over competitors.
Lack of Growth Potential Zain BH is a subsidiary of a parent company, Zain Group. This imposes great limitations on growth across borders and growth to other services. Zain BH is one of the smallest and least profit generating subsidiary contributing to the parent company, as its customer base is only 814,000 customers out of 46 million total customers of all subsidiaries of the group. The company has not been showing significant growth in customer base, in fact, it has been reported by TRA that many customer only shift to Zain BH to acquire smart phone devices, then leaving the company for its competitors.
Decline in Voice Revenues Although data revenues are expected to increase, the massive decrease in voice revenues will not be compensated; as more and more users are shifting towards internet and Voice-over-Internet-Protocol (VoIP) for calls or texting, the sales generated from voice and SMS will see a dramatic decrease. The forecasted revenue decline in 2016-2020 is affected by the decline in voice. Despite that Zain BH’s has showed great efforts in campaigns for its data services, the data growth remains stable and insignificant to overcome issues arising from loss in voice revenue.
Bahraini Market Competitive Advantage The competition is high in the market between the internet service providers in Bahrain. The prices offered by the service providers (Batelco, VIVA and Zain BH) are relatively close to each other. More customers are recently preferring prepaid services as they favor having a fixed payment rather than an open bill at the end of the month. The customers choose the provider based on the service quality and thus high speed internet and value added services determine which provider to choose. Zain BH only holds 20% of the market which is relatively low in comparison to 29% for Batelco and 51% for VIVA (Figure-12). Given the similar packages that are provided with the same price, it is unlikely that the customers will favor Zain BH over the other telecom providers especially that Zain BH had a reputation of not delivering high speed internet to the clients, and thus, it is hard to attract more clients in the short-run.
Zain BH Share Prices and Stock Analysis Zain BH’s stocks were being sold at around BD 0.200 when they initially went public in 2014. The shares then increased slightly after being publicly offered to reach a cap of BD 0.204. However, market events
Valuation Method
Price Weight
DCF BD 0.175 50%
Multiples BD 0.182 50%
Target Price 0.178
Source: Team Estimates
20%
29%
51%
Figure-12: Market Share
Zain BH Batelco VIVA
Source: Team Estimates
0 100 200
2013
2014
2015
2016E
2017E
2018E
2019E
2020E
Figure-11: Average Revenue Per User
Source: Zain BH, Team Estimates
Source: TRA Bahrain, 2014
Table-3: Estimation of Target Price
5
4.5
54
5
3.5
012345
Technological Changes
Governmental Taxes
MarketPrices
NetworkOverload
FierceCompetition
TRARegulations
Figure-10: SWOT Analysis -Threats
6
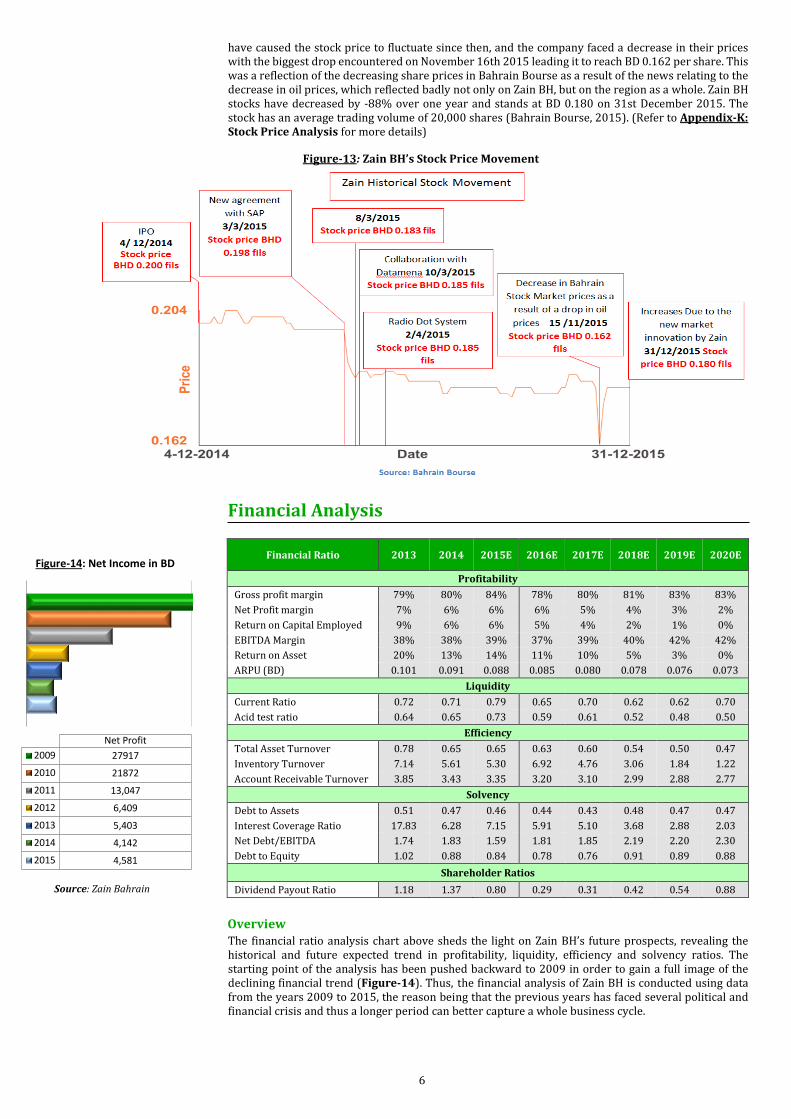
have caused the stock price to fluctuate since then, and the company faced a decrease in their prices with the biggest drop encountered on November 16th 2015 leading it to reach BD 0.162 per share. This was a reflection of the decreasing share prices in Bahrain Bourse as a result of the news relating to the decrease in oil prices, which reflected badly not only on Zain BH, but on the region as a whole. Zain BH stocks have decreased by -88% over one year and stands at BD 0.180 on 31st December 2015. The stock has an average trading volume of 20,000 shares (Bahrain Bourse, 2015). (Refer to Appendix-K: Stock Price Analysis for more details)
Financial Analysis
Overview The financial ratio analysis chart above sheds the light on Zain BH’s future prospects, revealing the historical and future expected trend in profitability, liquidity, efficiency and solvency ratios. The starting point of the analysis has been pushed backward to 2009 in order to gain a full image of the declining financial trend (Figure-14). Thus, the financial analysis of Zain BH is conducted using data from the years 2009 to 2015, the reason being that the previous years has faced several political and financial crisis and thus a longer period can better capture a whole business cycle.
Financial Ratio 2013 2014 2015E 2016E 2017E 2018E 2019E 2020E
Profitability
Gross profit margin 79% 80% 84% 78% 80% 81% 83% 83%
Net Profit margin 7% 6% 6% 6% 5% 4% 3% 2%
Return on Capital Employed 9% 6% 6% 5% 4% 2% 1% 0%
EBITDA Margin 38% 38% 39% 37% 39% 40% 42% 42%
Return on Asset 20% 13% 14% 11% 10% 5% 3% 0%
ARPU (BD) 0.101 0.091 0.088 0.085 0.080 0.078 0.076 0.073
Liquidity
Current Ratio 0.72 0.71 0.79 0.65 0.70 0.62 0.62 0.70
Acid test ratio 0.64 0.65 0.73 0.59 0.61 0.52 0.48 0.50
Efficiency
Total Asset Turnover 0.78 0.65 0.65 0.63 0.60 0.54 0.50 0.47
Inventory Turnover 7.14 5.61 5.30 6.92 4.76 3.06 1.84 1.22
Account Receivable Turnover 3.85 3.43 3.35 3.20 3.10 2.99 2.88 2.77
Solvency
Debt to Assets 0.51 0.47 0.46 0.44 0.43 0.48 0.47 0.47
Interest Coverage Ratio 17.83 6.28 7.15 5.91 5.10 3.68 2.88 2.03
Net Debt/EBITDA 1.74 1.83 1.59 1.81 1.85 2.19 2.20 2.30
Debt to Equity 1.02 0.88 0.84 0.78 0.76 0.91 0.89 0.88
Shareholder Ratios
Dividend Payout Ratio 1.18 1.37 0.80 0.29 0.31 0.42 0.54 0.88 Source: Zain Bahrain
Figure-13: Zain BH’s Stock Price Movement
Net Profit
2009 27917
2010 21872
2011 13,047
2012 6,409
2013 5,403
2014 4,142
2015 4,581
Figure-14: Net Income in BD

7
Unfavorable Oil Prices and Declining Government Spending Weakens Sales Revenue The fall in oil prices in the global market affects Bahrain’s economy negatively. In addition, the uplifting of a number of governmental subsidies and the decrease in GDP has led to fluctuations in goods’ prices since July 2015. In particular, the new government’s announcement of removing subsidies on meat led to its increase of 125.8% since October 2015. This results in a decrease in customers spending and is considered to directly affect the revenue of Zain BH. Hence, gradual decrease in revenues is built into the forecasts for the next five years, as well as the decrease in Zain BH’s profitability ratios. The fall in subscriber base is also assumed to be due to the reduction in the purchasing power of customers. This fall of revenues are estimated in the forecasted year of 2016 at BD 71 million down by 10% to reach BD 62 million in 2020 (Trading Economics, 2015; The National Business, 2015).
Hiking Interest Rate Limits Financing Options Flexibility The continuous increase in interest rate is expected to affect Zain BH’s ability and opportunity to finance its operations and upgrade its services through debt. In the forecasted period of 2018, Zain BH is expected to take a loan of BD 20 million (See Appendix U – Financial Forecast of Working Loans) for expanding and upgrading its network towers to keep up with the latest technology and be competitive in the market. However, the high interest rate will result in increased cost of debt, which will affect management’s future decision when examining investment opportunities and negatively impact the NOI of the company. Moreover, this might push Zain BH to seek additional funding through equity, as a more secured option. However, due to high amount of overdraft that Zain BH is utilizing, it is estimated that the debt to equity ratio for the forecasted years of 2016-2020 will rise from 0.78 in 2016 to 0.88 in 2020 as per the forecasted financial statements.
Penetrated Market Forces Zain BH to Upgrade Business Products The Bahrain telecommunication market is very competitive, resulting in a penetration rate of 187% as of Q3 2015. Considering the aggressive nature of this industry, Zain BH needs to focus on increasing its customers’ base and thus, like other industry players, Zain BH will have to retain its customers and increase their market share via attracting customers from the other operators through attractive offers and the diversification of their services. An example of that is Zain BH’s current involvement in the new agreement of the Radio Dot system which aims at providing improved voice clarity. Thus, rather than relying on mobile phone as the main revenue source, Zain BH is expected to get involved in several new agreements in the future. Consequently, an upgrade to network service and SAP service in 2020 has been considered in the preparation of the forecast (Bahrain Bourse, 2015).
DuPont Analysis – ROE Decomposition By analyzing the historical data of Zain BH, it is observed that the company has exhibited a declining trend in its return on equity (ROE) which stood at 35% in 2010 to reach 7.61% by 2015. This gradual decline in ROE is directly related to the gradual decline in the net profit margin throughout the period of 2009-2015. For the forecasted period, the ROE falls down to reach 1% as of 2020. Similar to the historical period, the main driver behind this decline is the fall in the net profit margin. Several macroeconomic factors such as decreasing oil prices, increasing competition and reduction in customer purchasing power is expected to lead to a fall in revenues. Without a similar reduction in costs, the company’s forecasted net profit falls year-on-year. Hence, Zain BH is assumed to be able to generate less profit for every unit of revenue. The second driver appears to be the equity multiplier or financial leverage, which is the ratio of total assets to total equity. Thus the forecasted increase in equity without a subsequent increase in the total assets impacts the ROE negatively.
Cash Generating Capabilities During the historical period from 2011-2015, it can be observed that Zain BH had the highest CFO in 2013 (BD 33.5m) after a constant yearly growth of around 16.5% from 2011, which highlights the economy’s recovery from the political instability effect and the well-organized investment strategies by Zain BH. In particular, Zain BH encountered a huge ending cash flow decline of 271% in 2012, resulting in a net cash outflow and forcing it to take loans worth BD 20m in the following year, where the funds were invested in upgrading PPE and intangible assets to recover the CFO by 36% compared to 2011 (Figure-18). In addition, the CFO decreased by 30% in 2014 due to the TRA law that allowed customers to shift the service provider without changing the SIM number, thus affecting Zain BH’s negatively. On the other hand, it was assumed that from 2015, Zain BH will start paying back its debt resulting in cash outflow to 2020. Furthermore, although the economic crisis started in 2015, Zain BH will be mostly affected in 2017 by a 25% reduction in CFO. Yet, the NCF has increased in this period due to management decisions of being less reliant on cash, control investments spending and postpone some investments to the following year. Additionally, the CFO will only increase from BD 4.825 million to BD 5.722 million in 2020, due to low investments that may affect its position in the competitive market.
DuPont Analysis 2013 2014 2015E 2016E 2017E 2018E 2019E 2020E
Net Profit margin 7% 6% 6% 6% 5% 4% 3% 2%
Total Asset Turnover 73% 64% 65% 62% 59% 52% 49% 47%
Equity Multiplier 202% 188% 184% 178% 176% 191% 189% 188%
ROE 10% 7% 8% 6% 5% 4% 3% 1%
Source: Zain Bahrain, Team Estimates
Source: Zain Bahrain, Team Estimates
34% 41%51% 47% 46% 44%
66% 59%49% 53% 54% 56%
0%
20%
40%
60%
80%
100%
2010 2011 2012 2013 2014 2015
Figure-16: Debt/Equity
Equity
Debt
DEBT to Equity
Figure-17: DuPont Analysis
Source: Zain Bahrain, Team Estimates
(25,000)
(15,000)
(5,000)
5,000
15,000
25,000
35,000
20
11
20
12
20
13
20
14
20
15
20
16
20
17
20
18
20
19
20
20
Figure-18: Cash Flow Trend
Net Cash flows
Cash flow from Financing Activities
Cash flow from Investing Activities
Cash flow from Operation Activities
6400
5280
1840
10501050 997 947 900
-
0.2
0.4
0.6
0.8
1.0
1.2
1.4
1.6
0
1,000
2,000
3,000
4,000
5,000
6,000
7,000Figure-15: Dividends Payout
8
Valuation
In determining a target price for Zain BH’s equity, different valuation methodologies were used including absolute valuation models – discounted cash flow analysis – and relative valuation models using the comparable company multiples approach.
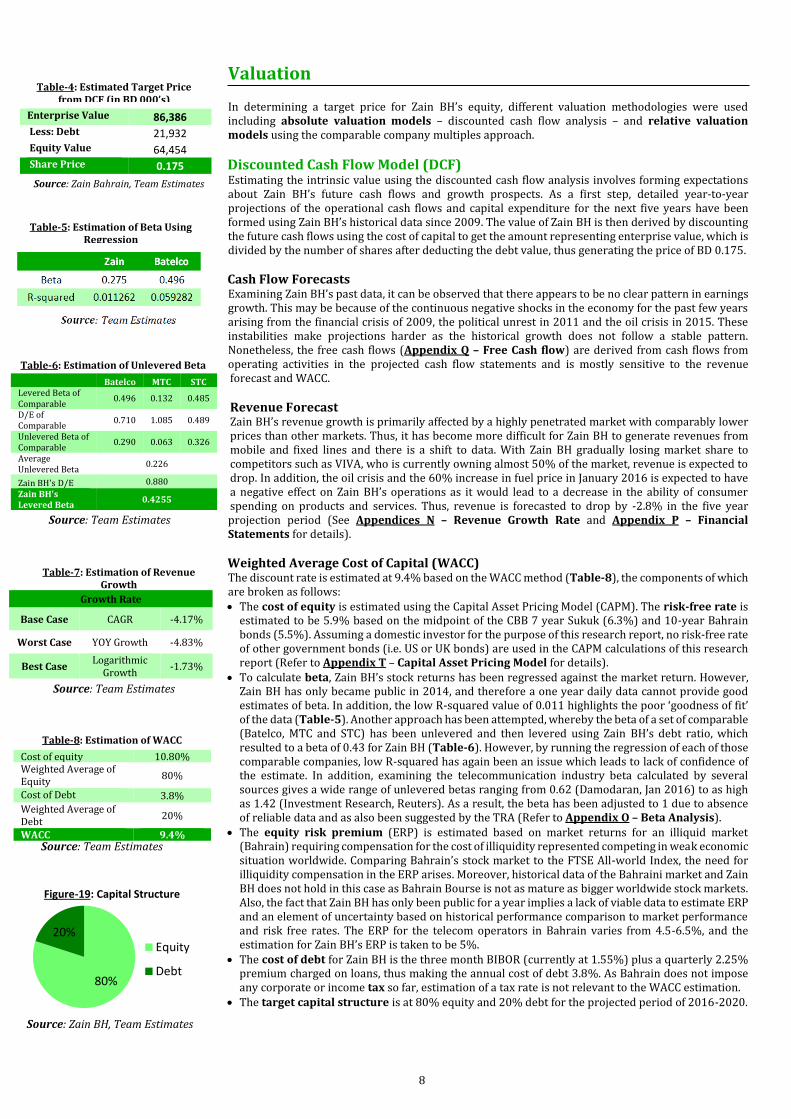
Discounted Cash Flow Model (DCF) Estimating the intrinsic value using the discounted cash flow analysis involves forming expectations about Zain BH’s future cash flows and growth prospects. As a first step, detailed year-to-year projections of the operational cash flows and capital expenditure for the next five years have been formed using Zain BH’s historical data since 2009. The value of Zain BH is then derived by discounting the future cash flows using the cost of capital to get the amount representing enterprise value, which is divided by the number of shares after deducting the debt value, thus generating the price of BD 0.175.
Cash Flow Forecasts Examining Zain BH’s past data, it can be observed that there appears to be no clear pattern in earnings growth. This may be because of the continuous negative shocks in the economy for the past few years arising from the financial crisis of 2009, the political unrest in 2011 and the oil crisis in 2015. These instabilities make projections harder as the historical growth does not follow a stable pattern. Nonetheless, the free cash flows (Appendix Q – Free Cash flow) are derived from cash flows from operating activities in the projected cash flow statements and is mostly sensitive to the revenue forecast and WACC.
Revenue Forecast Zain BH’s revenue growth is primarily affected by a highly penetrated market with comparably lower prices than other markets. Thus, it has become more difficult for Zain BH to generate revenues from mobile and fixed lines and there is a shift to data. With Zain BH gradually losing market share to competitors such as VIVA, who is currently owning almost 50% of the market, revenue is expected to drop. In addition, the oil crisis and the 60% increase in fuel price in January 2016 is expected to have a negative effect on Zain BH’s operations as it would lead to a decrease in the ability of consumer spending on products and services. Thus, revenue is forecasted to drop by -2.8% in the five year projection period (See Appendices N – Revenue Growth Rate and Appendix P – Financial Statements for details).
Weighted Average Cost of Capital (WACC) The discount rate is estimated at 9.4% based on the WACC method (Table-8), the components of which are broken as follows: The cost of equity is estimated using the Capital Asset Pricing Model (CAPM). The risk-free rate is
estimated to be 5.9% based on the midpoint of the CBB 7 year Sukuk (6.3%) and 10-year Bahrain bonds (5.5%). Assuming a domestic investor for the purpose of this research report, no risk-free rate of other government bonds (i.e. US or UK bonds) are used in the CAPM calculations of this research report (Refer to Appendix T – Capital Asset Pricing Model for details).
To calculate beta, Zain BH’s stock returns has been regressed against the market return. However, Zain BH has only became public in 2014, and therefore a one year daily data cannot provide good estimates of beta. In addition, the low R-squared value of 0.011 highlights the poor ‘goodness of fit’ of the data (Table-5). Another approach has been attempted, whereby the beta of a set of comparable (Batelco, MTC and STC) has been unlevered and then levered using Zain BH’s debt ratio, which resulted to a beta of 0.43 for Zain BH (Table-6). However, by running the regression of each of those comparable companies, low R-squared has again been an issue which leads to lack of confidence of the estimate. In addition, examining the telecommunication industry beta calculated by several sources gives a wide range of unlevered betas ranging from 0.62 (Damodaran, Jan 2016) to as high as 1.42 (Investment Research, Reuters). As a result, the beta has been adjusted to 1 due to absence of reliable data and as also been suggested by the TRA (Refer to Appendix O – Beta Analysis).
The equity risk premium (ERP) is estimated based on market returns for an illiquid market (Bahrain) requiring compensation for the cost of illiquidity represented competing in weak economic situation worldwide. Comparing Bahrain’s stock market to the FTSE All-world Index, the need for illiquidity compensation in the ERP arises. Moreover, historical data of the Bahraini market and Zain BH does not hold in this case as Bahrain Bourse is not as mature as bigger worldwide stock markets. Also, the fact that Zain BH has only been public for a year implies a lack of viable data to estimate ERP and an element of uncertainty based on historical performance comparison to market performance and risk free rates. The ERP for the telecom operators in Bahrain varies from 4.5-6.5%, and the estimation for Zain BH’s ERP is taken to be 5%.
The cost of debt for Zain BH is the three month BIBOR (currently at 1.55%) plus a quarterly 2.25% premium charged on loans, thus making the annual cost of debt 3.8%. As Bahrain does not impose any corporate or income tax so far, estimation of a tax rate is not relevant to the WACC estimation.
The target capital structure is at 80% equity and 20% debt for the projected period of 2016-2020.
Enterprise Value 86,386 Less: Debt 21,932 Equity Value 64,454 Share Price 0.175
Batelco MTC STC Levered Beta of Comparable
0.496 0.132 0.485
D/E of Comparable
0.710 1.085 0.489
Unlevered Beta of Comparable
0.290 0.063 0.326
Average Unlevered Beta
0.226
Zain BH's D/E 0.880
Zain BH's Levered Beta
0.4255
Growth Rate
Base Case CAGR -4.17%
Worst Case YOY Growth -4.83%
Best Case Logarithmic
Growth -1.73%
Cost of equity 10.80% Weighted Average of Equity
80%
Cost of Debt 3.8%
Weighted Average of Debt
20%
WACC 9.4%
Table-4: Estimated Target Price from DCF (in BD 000’s)
Table-8: Estimation of WACC
80%
20%
Figure-19: Capital Structure
Equity
Debt
Table-5: Estimation of Beta Using Regression
Table-6: Estimation of Unlevered Beta
Table-7: Estimation of Revenue Growth
Source: Zain BH, Team Estimates
Source: Team Estimates
Source: Team Estimates
Source: Zain Bahrain, Team Estimates
Source: Team Estimates
9
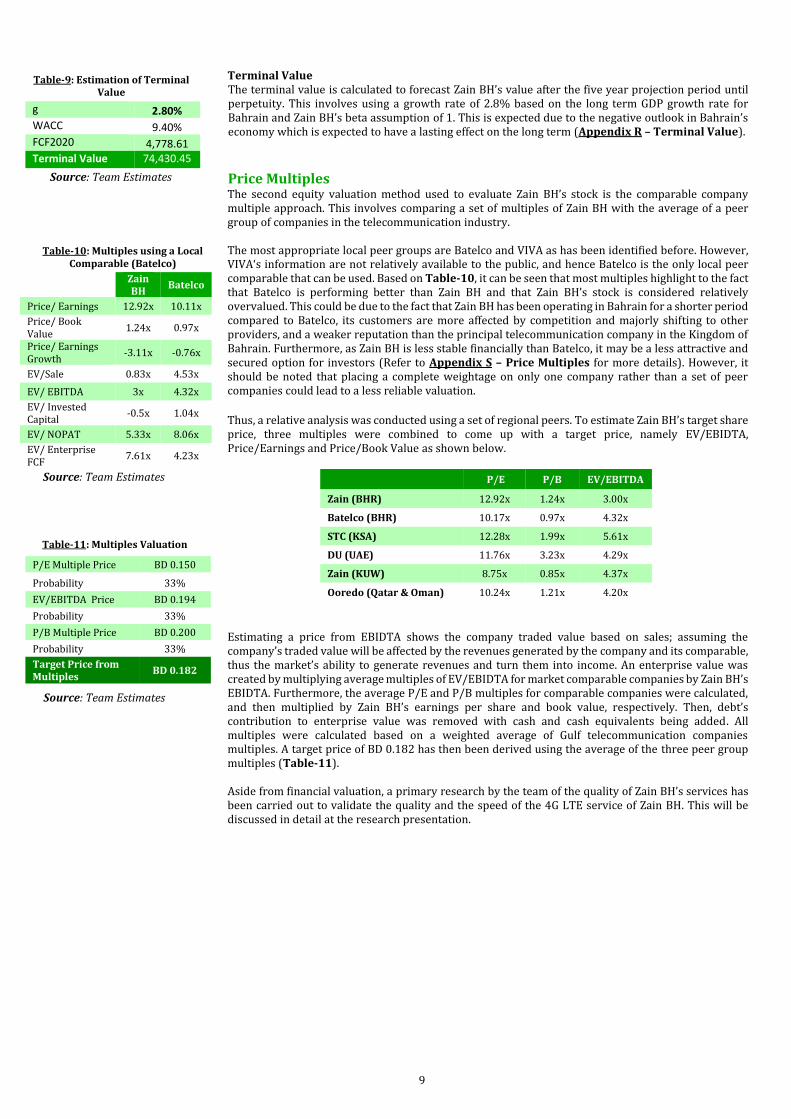
Terminal Value The terminal value is calculated to forecast Zain BH’s value after the five year projection period until perpetuity. This involves using a growth rate of 2.8% based on the long term GDP growth rate for Bahrain and Zain BH’s beta assumption of 1. This is expected due to the negative outlook in Bahrain’s economy which is expected to have a lasting effect on the long term (Appendix R – Terminal Value).
Price Multiples The second equity valuation method used to evaluate Zain BH’s stock is the comparable company multiple approach. This involves comparing a set of multiples of Zain BH with the average of a peer group of companies in the telecommunication industry. The most appropriate local peer groups are Batelco and VIVA as has been identified before. However, VIVA‘s information are not relatively available to the public, and hence Batelco is the only local peer comparable that can be used. Based on Table-10, it can be seen that most multiples highlight to the fact that Batelco is performing better than Zain BH and that Zain BH’s stock is considered relatively overvalued. This could be due to the fact that Zain BH has been operating in Bahrain for a shorter period compared to Batelco, its customers are more affected by competition and majorly shifting to other providers, and a weaker reputation than the principal telecommunication company in the Kingdom of Bahrain. Furthermore, as Zain BH is less stable financially than Batelco, it may be a less attractive and secured option for investors (Refer to Appendix S – Price Multiples for more details). However, it should be noted that placing a complete weightage on only one company rather than a set of peer companies could lead to a less reliable valuation.
Thus, a relative analysis was conducted using a set of regional peers. To estimate Zain BH’s target share price, three multiples were combined to come up with a target price, namely EV/EBIDTA, Price/Earnings and Price/Book Value as shown below.
P/E P/B EV/EBITDA
Zain (BHR) 12.92x 1.24x 3.00x
Batelco (BHR) 10.17x 0.97x 4.32x
STC (KSA) 12.28x 1.99x 5.61x
DU (UAE) 11.76x 3.23x 4.29x
Zain (KUW) 8.75x 0.85x 4.37x
Ooredo (Qatar & Oman) 10.24x 1.21x 4.20x
Estimating a price from EBIDTA shows the company traded value based on sales; assuming the company’s traded value will be affected by the revenues generated by the company and its comparable, thus the market’s ability to generate revenues and turn them into income. An enterprise value was created by multiplying average multiples of EV/EBIDTA for market comparable companies by Zain BH’s EBIDTA. Furthermore, the average P/E and P/B multiples for comparable companies were calculated, and then multiplied by Zain BH’s earnings per share and book value, respectively. Then, debt’s contribution to enterprise value was removed with cash and cash equivalents being added. All multiples were calculated based on a weighted average of Gulf telecommunication companies multiples. A target price of BD 0.182 has then been derived using the average of the three peer group multiples (Table-11). Aside from financial valuation, a primary research by the team of the quality of Zain BH’s services has been carried out to validate the quality and the speed of the 4G LTE service of Zain BH. This will be discussed in detail at the research presentation.
g 2.80% WACC 9.40% FCF2020 4,778.61 Terminal Value 74,430.45
Zain BH
Batelco
Price/ Earnings 12.92x 10.11x
Price/ Book Value
1.24x 0.97x
Price/ Earnings Growth
-3.11x -0.76x
EV/Sale 0.83x 4.53x
EV/ EBITDA 3x 4.32x
EV/ Invested Capital
-0.5x 1.04x
EV/ NOPAT 5.33x 8.06x
EV/ Enterprise FCF
7.61x 4.23x
P/E Multiple Price BD 0.150
Probability 33%
EV/EBITDA Price BD 0.194
Probability 33%
P/B Multiple Price BD 0.200
Probability 33%
Target Price from Multiples
BD 0.182
Table-9: Estimation of Terminal Value
Source: Team Estimates
Table-11: Multiples Valuation
Source: Team Estimates
Table-10: Multiples using a Local Comparable (Batelco)
Source: Team Estimates

10
Investment Risks Regulatory Risk Compliance with TRA’s WACC covenant (RR) In order to comply with the Telecommunication Regulatory Authority, Zain BH needs to control its WACC at 9.5% and use 100% equity financing as imposed by the authority. Zain BH currently fails to comply as it announced that its WACC stands between 11-12% and that it is using debt financing. This will lead to Zain BH facing sanctions, penalties or license issues with the regulator. Zain BH also faces regulatory risks due from price reduction enforcements and other imposed regulations which may for example require it to invest in more environment-friendly devices.
Market Risk Competition in a highly saturated market and interest rate hike (MR) Zain BH’s growth in a very saturated market has become very difficult, with its subscriber growth decreasing from 25% in 2013 to 1.6% in 2015-Q2. The Bahraini telecommunication market penetration rate stands at 187% with only 2.6 million subscribers. Thus, further expansion and growth will be very difficult especially that Zain BH’s 6-year CAGR is at -4%. Expected growth in data consumption will be faced with decrease in voice revenues which comprise 42% of total telecommunication sector revenues
(TRA) especially with expected decrease in consumer spending due to governmental budget cuts. Moreover, Bahrain is facing an upcoming increase in CBB’s interest rates, following the Fed’s interest rate increase, as the Bahraini Dinar is pegged to the US Dollar; this puts Zain BH and the country at risk of high inflation rates.
Economic Risk Unfavorable Global Macro Indicators (ER) The oil price decrease from $115 in August 2014 to $38 in November 2015 can affect Zain BH in multiple ways as the government has started budget cuts, decrease in spending, and inflation in prices of basic necessities which could lead to a decrease in consumer spending on telecommunications and other services thus decreasing demand on the company’s service line. Furthermore, many petrochemical companies have shut down operations which will lead to loss in fixed lines and business services also loss of expat’s demand on mobile services as they will be leaving the country. This also puts Zain BH at risk of probable taxes or fees imposed by the government to cover budget deficits. If oil prices remain decreasing, it could lead to a potential stock market loss/crash.
Liquidity Risk A highly costly sector (LR) Zain BH reported spending $100million on LTE infrastructure and licensing in 2014, and decreasing current and quick ratios over the past five years. This means that the company is lacking cash on hand which can affect its shareholder’s return and dividend payment and it ability to meet immediate funding needs. With continuous development and licensing in daily operations, Zain BH will compromise its WACC structure and ratio.
Operational Risk Information Security in the telecommunication industry (OR) Providing safety for consumer data in a highly developed technological era is essential to maintain subscriber base. Zain BH lacks public information security data communicated with subscribers regularly to maintain safety. Moreover, any breach in security of subscriber’s information will compromise the entire subscriber base especially in a very social media affected society that has become mainly dependent on data and is uneducated regarding safety measures.
Other Risk Independence of board and Relationship with Parent Company (TR) Zain Bahrain’s Board of Directors has only 2 independent members out of a total of 7 members. Out of which, 4 are representatives of Zain Group based on a management agreement signed between both companies. This means the company lacks shareholder control in strategic decisions as most strategic verdicts are decided by the parent company. Furthermore, Zain BH only compromises 1.7% of the total group subscribers, which means that the group’s risk tolerance towards Zain BH can differ from shareholder’s risk culture thus creating a conflict of interest and decisions within the company board.
Value-at-Risk Historical and Linear VaR Based on historical prices and returns, the VaR value shows that, at a 99% confidence level, the maximum loss for a 1-day holding period is BD 0.004. This figure is not insignificant considering that the stock price was originally priced at BD 0.200. This means that the worst expected loss from a 1-day holding period is 2%. VaR was calculated based on daily prices for 2014 (Table-12).
Average 0.0001
Standard Deviation
0.0010
Alpha 0.0500
Z-Square (99%) (2.3300)
Linear VaR (99%)
(0.004)
Figure-20: Risk Matrix
Source: Team Estimates
Figure-21: Oil Prices 2015
Source: Infome.com
Source: Team Estimates
Table-12: Value-At-Risk
11
Appendix A: Organizational Structure
Board Chairman
General Manager
Director, Marketing
Director, Business Planning and
Excellence
Specialist, Investor Relations, Compliance
& GM Office
Director, Human Resources
Director, Regulatory, Wholesale and
Roaming
Manager, Corporate Communications
Director, Legal
Director, Finance
Manager, Revenue Accounting
Manager, Accounts Payable
Manager, Budgeting and Reporting
Director, NetworkManager, Network Planning and PMO
Director, Sales and Customer Care
Director, MarketingManager, Analytical
Marketing
Team Leader, Revenue Assurance
Specialist, Revenue Assurance
Board of Directors
Source: Bahrain Bourse
12
Appendix B: Board of Directors
Name Shares Percen
tage
Share Amount
Executive/ independent
Board member
Since Experience
Reappointment date
Shaikh Ahmed Bin Ali Al Khalifa (Chairman)
16.10% 59,260,000 Non-executive / non-independent
19 April 2003
Shaikh Ahmed has been the chairman of DHL International Bahrain, DHL Aviation and MENA Aerospace Enterprises since 2004 when MENA Aerospace was established. Also, he has been the chairman Muharraq Club since 1989.
AGM in Q1 2015
Asaad Ahmed Al-Banwan (Deputy
Chairman) 54.80% (MTC) 201,600,000 Non-executive /
non-independent 7
February 2005
Mr AlBanwan was the vice-chairman and the CEO at the National Investment Company, Kuwait from 200-2012. With his background in Finance from the University of Kuwait, he is also the chairman of Zain Group (MTC) since March 2005. He also is currently vice chairing the Kazma Sports Club.
AGM in Q1 2015
Shaikh Rashid Bin Abdulrahman Al
Khalifa 0.32% 1,200,000 Non-executive /
independent 19 April
2003
Shaikh Rashid is a certified engineer, he graduated from the University of Cairo, he has worked in the Bahraini Defense Force as a Director of Military Works for 11 years ending in 1991. Shaikh Rashid has multiple higher education certificates from Howard University and Harvard University. Lastly, he has been the Managing Director of Mi’mar Architecture & Engineering since 1992.
AGM in Q1 2015
Waleed A. M. A. Al-Roudan
54.80% (MTC) 201,600,000 Non-executive /
non-independent 27
October 2011
Mr Al roudan was appointed as the manager of investments – general reserves of The Kuwait Investment Authority (KIA) in 2006. He is also board chairman of EK Holding. Moreover, he is a board member of Zain Group.
AGM in Q1 2015
Jamal Shaker Al-Kazemi
54.80% (MTC) 201,600,000 Non-executive /
non-independent 27
October 2011
CEO and chairman of Shaker Al-Kazemi & Sons since 1982. Mr Jamal is a board member of the parent company and the vice-chairman of Marsa Alam Holding. Moreover, he is a board member of Ahli United Bank. Since 2000, he has been the chairman of Al-Arabi Sporting Club.
AGM in Q1 2015
Shaikha Khalid Al-Bahar
54.80% (MTC) 201,600,000 Non-executive /
non-independent 27
October 2011
CEO of National Bank of Kuwait (NBK) and chairman of the audit committee of the
International Bank of Qatar (IBQ). Stanford University and Duke University are two of the main universities Ms AlBahar has attended. She is also among the Board of Trustees of the Kuwait University-College of Business Administration.
AGM in Q1 2015
Ali Hassan Al Khaja 0.39% (On Air
Commerce WLL)
1,440,000 Non-executive / independent
30 October
2014
Mr AlKhaja has a mobile transactional patent and several other patents across the United States and Europe. He also was involved in the hospitality industry before moving into telecommunication.
AGM in Q1 2015
Source: Zain Bahrain Corporate Governance Report

13
Appendix C: Board Termination Process
Appendix D: Board Committees
Committee Responsibilities Yearly Meetings
Board Audit Committee (BAC)
Reviewing accounting and finance policies and internal control procedures.
Appointing external auditors and supervising the financial statements reviewing and audit process externally and internally.
Review company law and regulations compliance. Review the control systems of information and telecom
technology.
At least four times a year.
Nomination and Remuneration
Committees NRC
Recommending potential board members to the current board.
Recommending potential candidates for board committees. Review and monitor compliance of board members with the
code of conduct and overseeing remuneration issues. Review and evaluate performance of board members and
successful committees.
At least twice a year.
Source: Zain Bahrain Corporate Governance Report
Board Termination process
Termination of directorship can take effect in the cases set out below:
•”If a Director does not have the appropriate legal qualifications or has been sentenced for an act, a fraud or a crime affecting
his honor or integrity;
• If a Director is appointed or elected in a manner contrary to the provisions of the law;
• If a Director abuses his membership to carry on a competitive business to the Company or causes damages to the Company;
or
• If the Shareholder appointing the member removes him.
• Termination of a member of the Board or indeed the whole Board can also be effected by a General Assembly in accordance
with Article 178 of the Commercial Companies Law of Bahrain.”
Source: Zain Bahrain Corporate Governance Report
14
Appendix E: SWOT Analysis
STRENGTHS:
1. Partnership and suppliers: Zain BH partnered with companies from diversified industries to provide a variety of telecom services that not only deliver tangible benefits but intangible ones too. Zain BH continues to add unique blend of services in order
to increasing the data consumption, loyalty, retention of their current and potential customers through partnership with unexpected companies. With every partnership, Zain BH delivers a message that touch on an emotional aspect and a personal need of a specific target market from its target market pool. Although the partnerships are unexpected, they are in line with their vision and slogan “A Wonderful World”. For instance, the very recent Zain group-wide gaming partnership with Zeptolab (the developer of “Cut the Rope” game) gives Zain BH access to over 750 million game downloaders where the game will display Zain BH brand in all of the countries that Zain Group operates in, and according to Zain, this agreement “offers their customers the latest and most exciting products and services as it transforms to become a digital lifestyle provider” (Zain Bahrain, n.d.). In the same context, Zain BH has partnered with Polytechnic's Annual ICT Exhibition as their CSR’s strategic approach focuses on education and empowering youth. Thus, this partnership intends to “nurture the young talents and to develop the next generation of talents”. Adding to that, Zain BH has supported the start-up boot camp since its first edition. Start-up Bahrain is the kingdom’s first independent digital publication for the start-ups corporation and entrepreneurs, by this partnership, Zain BH will provide them with products and services that are tailored to fit the needs of entrepreneurs with mobiles, broadband and enterprise services with the aim to empower youth and foster innovation and entrepreneurship in the Kingdom. On another level, Zain BH partnered with Uber which is a modern transporting company that is evolving the way the world moves. From this group-wide agreement, Uber platform users who use Zain BH will receive a discounted and a preferential service. Moreover, the Uber driver partners will receive a superior network quality and will enable a mobile payment for the Uber service too. This partnership also includes but is not limited to having Wifi in vehicles for Zain customers in the future in addition to having discounted services for the transportation services provided by Uber. Those benefits would encourage not only Zain BH users to try Uber service, but for Uber users to switch to Zain BH if they are aware of such services. Touching on the needs of the diversified and multi-cultural community that Bahrain has through an agreement with an exchange company (NAFEX), where people transferring money will be able to benefit from special telecom services provided by Zain BH (for Zain users), a set of innovative services that enable the expatriate customers to effectively communicate with their friends and family. Another agreement was with Apple and Samsung Bin Hindi informatics in order to have a complete support with regards to the new devices that are released in the market. This agreement ensures no shortage in the new devices for Zain BH customers as most of the shifted customers from Zain BH to other operators have stated that the reason behind that shifting is that they have purchased a phone from Zain BH. This means that the operator succeeded in securing the devices for those customers due to this agreement that they have. They are authorized also to give prices offers for their customers and limited packages in order to have a competitive edge. Zain Bahrain was the first to launch the iPhone 6 and iPhone 6 plus and the leading operator in the GCC to launch Samsung integrated mobility “IM ZONE” in their headquarters store at Seef mall department where a variety of Samsung products are available for sale. Tie-up with local corporation who are looking to play a dynamic role in strengthen the country economics such as Fakhro Electronics via strengthening the business and giving them the advantage of maintaining and providing high security, cost effective internal network with the best quality service from world class brands that are known for their communication solutions such as AVAYA and CISCO. In 2015, Zain BH renewed its main sponsorship of the Capital Club event program and to be the telecoms partner. This is in line with Zain’ s strategy in reaching out to a wider range of corporate decision making partners in providing strong and powerful services for them and technological advantages for the corporations around Bahrain. A partnership with Bahrain Bay took place with Zain BH to provide advanced voice and data services that is delivered to each commercial unit via a fiber optic network making this contract a mixed-use development with cutting-edge ICT solutions for all commercial, retail and residential communities. Easy access for topping up credit and bills payment through mobile applications, Zain’ s website and 650 Sadad kiosks that are available in major supermarkets, 15 of those kiosks are available at Zain BH branches.
15
In early 2015, Zain BH expanded its existing partner market agreement with Vodafone to deliver machine-to-machine services to enterprise and government sectors across the region. This group-wide agreement shall enhance the service as the waiting time will be limited. Adding to that, the cost of having many customer service officers can be avoided once it is automated and it operating effectively.
2. Advanced Network Infrastructure: Over $100 Million invested to revamp in the current network towers to enhance the quality of the 4G / LTE service provided. The focus is to enhance the capacity for providing the best customer experience against tremendously increasing data usage and thus, drawing more individuals to switch to Zain BH’s network.
3. Complaints Management System:
In 2014 Zain BH launched a new program called Astellia. This program helps them to study their customer’s satisfaction regardless of the mobile type, the data package, the location and the timing of the use in order to enhance their performance. This lead to a 50% decrease in the number of complaints, a 30% increase in positive feedback and the increase in the percentage of conflict resolution by 10%. Data is collected through Transactional-Net Promoter Score (T-NPS) which ensures its objectivity (Zain Bahrain, 2014).
4. Licenses and diversified portfolio:
They have made Bahrain the leading in technological sector regionally and globally by being the first to initiate the 3G, 3.5G and the WIMAX coverage in line with the radio coverage expansion up to 30% in the kingdom (Zain Bahrain, 2014). In addition, Zain BH has 7 different licenses from the telecommunication Regulatory Authority which means that they have a wide variety of services.
5. Prospectus Competitive Strengths: According to Zain BH IPO prospectus, Zain BH has a strong brand positioning and recognition in addition to the strong relationship that Zain BH has with its parent company. This means that Zain BH can benefit from the experience of its management team. Adding to that, Zain BH has a strong distribution network and a Culture of New Innovative Products and Services.
WEAKNESS:
1. Directed Awareness from customer service employees: Zain BH advertisements usually feature the theme of the campaign rather than certain information that would attract the users to purchase the packages. General statements such as “Addicted to Data” in the Big Gigs Family does not feature the fact that the network is now upgraded or that the service now is much better than it used to be in the past. Random poster with a new character would not indicate that there are packages that are tailored to the needs of each of the family members. It is true that the website and application include more details about the packages, nonetheless, if such details were not addressed and executed efficiently in posters or in online landing pages, most people would not bother to look at it and thus, no sales will take place. Application use is limited due to low level of awareness about its availability. Employees at the point of sell (customer service) do not inform to the current or the new customers about a mobile application as it will be an easy way to change packages, top up their credit, access their information and packages without the need of standing in long queues either in branches or waiting for a longtime to be served on the mobile phone.
2. Network Coverage: In 2014, the TRA report stated that the 4G/LTE coverage based on governmental location of Zain BH is only 96.2 % compared to that of its competitor VIVA 99.7%. Batelco’s percentage was behind 91%. Many locations as demonstrated in the report are IN coverage but many of them are NOK in comparison with VIVA’s diagram which shows IN coverage and OK for the 4G services. 3. Service quality and Prices: Given the close variance in prices, the customers judge the provider based on the provided services and its quality. Nonetheless, when customers do not put into account the fact that the network has been revamped, and that the quality is now enhanced, they will chose another service provider and thus, Zain BH will lose a customer. Adding to that, when the perception is already negative towards the service and a client with a negative experience exploits something negative about the service after the revamp, other potential customers will be hesitant to try the service.

16
OPPORTUNITIES:
1. Customers Satisfaction: Having Astellia as enables Zain BH to have a better understanding of their customers’ needs and thus, address it appropriately. Since time of use and location can be identified, Zain BH has the opportunity to alter the strength of its network depending on the density of the population in that particular area or even based on the data consumption. This would give Zain BH more credibility as they will tackle the issues and reduce it by far more than 20% if implemented correctly and efficiently (Zain Bahrain, 2014). This service can also be promoted as an efficient tool to solve connection issues in order to attract more customers towards Zain services even though this system is also implemented in Batelco, which is a Zain’ s competitor (Batelco Bahrain, 2014; Zain Bahrain, 2014).
2. Market Expansion: Given the recent revamp in the network towers, Zain BH can utilize its valuable partnerships with various sectors to retain customers and to gain more customers from the other telecommunication providers. The benefits and the discounts that they can enjoy only if they are Zain BH customers. These benefits can be combined in a marketing campaign and spread in the community as people’s nature goes towards getting more services for less prices.
3. Internet speed: Preparation to promote and provide 5G services and fiber optic high speed internet services before the other operators in the form of cost efficient packages to entice the users.
4. Digital Presence: Zain BH is transforming itself to become a digital lifestyle services provider. This means
that the company is flexible with the modern style of life and is capable of adapting with the needs of the market while providing high speed internet service that suites the modern lifestyle of the community communications habits.
5. Service quality and price: If Zain BH managed to maintain a high service quality, it will be able to retain
and gain more clients from the market especially that the prices are approximately the same.
6. CSSR: Zain BH can utilize their CSSR programs to increase the sales and focus of the CSSR’s that can make their reputation even better and bring in more customers and thus, revenue to the company.
THREATS:
1. Technological Changes: Continuous need for rapid upgrades that cost time and money. Revamping the towers costs were over $100 million and were 17% of the revenues. Drastic technology changes require significant CAPEX needs while revenues are not matching to proceed with such investments.
2. Governmental Taxes: Governments view telecom revenue as a key source of revenue which makes them impose additional taxes on telecom operators and consumers. This reduces the revenue of the operator that also limits their ability to technology upgrades.
3. Market Prices: Competing rivals are reducing the profit margin to increase their market share of the customers. This is forces the companies into an unhealthy competition that affects the ability of all of the involved companies. The user however will be the only beneficiary from such a competition.
4. Network Overload: Increasing demand on broadband services causes occasional congestion in peak times especially in high populated areas where businesses operate. This reduces the efficiency of the provided service and thus, leads to customers altering the service provider.
5. Fierce Competitors: Menatelecom is considered as a major competitor for Zain BH since it is the only
operators alongside with Zain BH in the market to have access to WiMAX. Zain BH’s WiMAX awareness amongst its users is 77% while the users are only 4% in comparison to 88% of awareness in Menatelecom with 6% users. Another reason is that Menatelecom is promoting the availability of iPhone 6S which indicates a possible entrance in the mobile internet services (Zain Bahrain, 2015; Mena telecom, 2015).
6. TRA Regulations: The ability to shift from one operator to another by paying a BD 5 fees while carrying the same number from one operator to another is a threat and an opportunity in the same time as Zain BH can obtain more customers from other operators. This however can be eliminated by addressing the needs of the clients and working proactively to reduce the change of them leaving to other operators. Satisfied customers stay loyal and refer friends to the business too
17
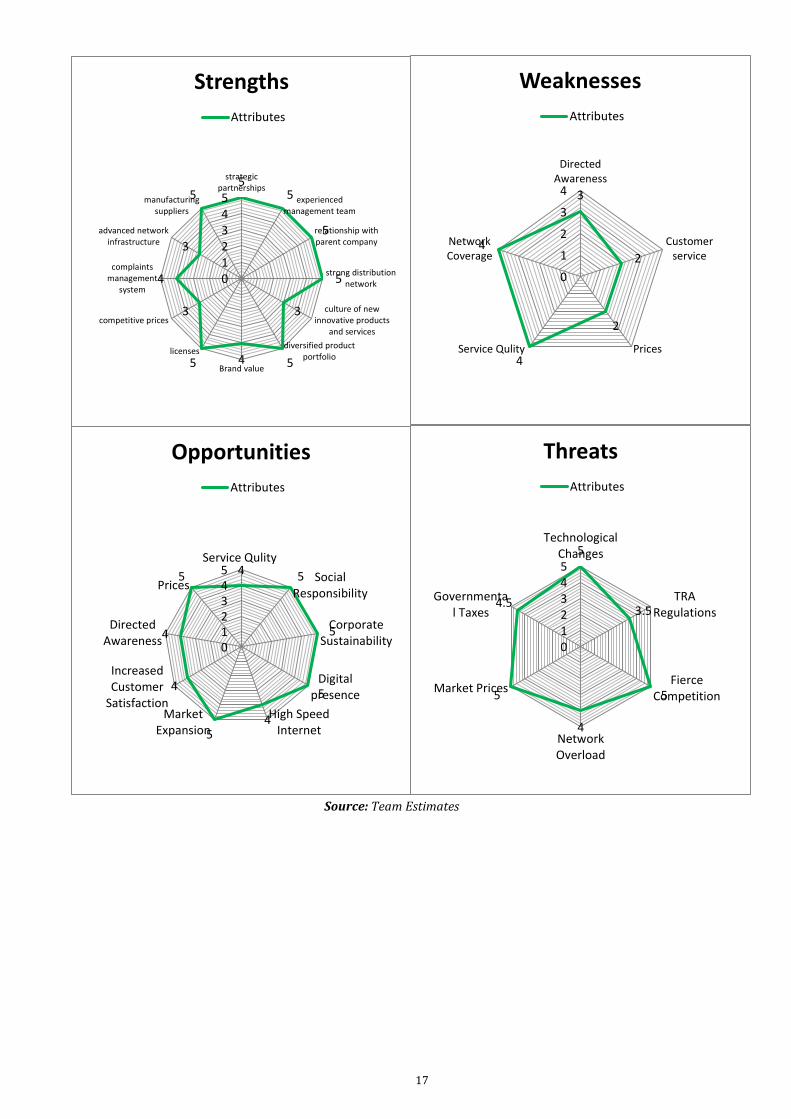
55
3
4
3
5 4 5
3
5
5
5
012345
strategicpartnerships
manufacturingsuppliers
advanced networkinfrastructure
complaintsmanagement
system
competitive prices
licenses
Brand value
diversified productportfolio
culture of newinnovative products
and services
strong distributionnetwork
relationship withparent company
experiencedmanagement team
Strengths
Attributes
3
4
4
2
2
0
1
2
3
4
DirectedAwareness
NetworkCoverage
Service Qulity Prices
Customerservice
Weaknesses
Attributes
45
4
4
54
5
5
5
012345
Service Qulity
Prices
DirectedAwareness
IncreasedCustomer
SatisfactionMarket
ExpansionHigh Speed
Internet
Digitalpresence
CorporateSustainability
SocialResponsibility
Opportunities
Attributes
5
4.5
5
4
5
3.5
012345
TechnologicalChanges
Governmental Taxes
Market Prices
NetworkOverload
FierceCompetition
TRARegulations
Threats
Attributes
Source: Team Estimates

18
Appendix F: PESTEL Analysis
Factors Analysis
Po
liti
cal
& L
eg
al
Low tax environment
with no income taxes.
Occasional Political unrests
TRA regulations
Customers have high purchasing power and thus, the willingness to spend is also high. Nonetheless, the spending is mainly found in VIVA as it’s dominating 51% of the market followed by Batelco 29% and finally Zain BH with 20% only from the market share. This indicates other possible problems (quality of service/ prices “money value”). The TRA regulates the operations of the telecom companies and ensure that the companies are acting legally, ethically and professionally in all telecom and business aspects such as the price range and the speed. A 2011 regulation enabled users to switch operators while keeping the same number. This lead to a switch between operators. A 2014 TRA survey indicated that the reason behind the switch was attractive promotions, good prices, and service satisfaction. Adding to that, the TRA has stated that effective April 2016, roaming prices in the GCC will be lowered for voice, SMS and mobile data. This can encourage more users to use data roaming; nonetheless, this also means a reduced profit margin for the telecom companies.
Eco
no
mic
al
Fitch downgrading
Bahrain to “BBB-“ Governmental subsidies Connection purchasing
habits
Oil Prices
Bahrain’s economy has been downgraded which explains the governmental reduction in spending and the elimination of subsidies on various goods/services in the year 2015 and more in the year 2016 as the oil prices are in continuous decline. More than half of the Bahraini population is foreigners who will incur additional living costs that may lead them to decrease their spending on new mobile phones which may reduce sales. Promotions however and better packages on devices installments may stabilize the purchasing habit. In 2014, 65% of Zain BH’s customer’s connection purchasing habit was for postpaid whereas in Bahrain, the postpaid connection forms 73% of the connection type purchases in 2014. Furthermore, the agency recorded that the rent of the office prices in 2014 has declined to 6% in accordance to their analysis of the diplomatic and financial harbor area and stabilized in 2015 and there were no decreases in the prices so far as for 20th December, 2015. In case of the retail sector it is growing especially due to the Saudi tourists in the weekends to benefit from the expending in the retail Sector in Bahrain.
So
cia
l a
nd
Te
chn
olo
gic
al
High speed data is a must
to engage with the modern community activities.
Free communication
provided by the telecom operator encourages others (friends/ family) to switch to the same operator.
It is a trend driven market that requires constant update in the technology that will provide high quality and speed internet with reduced prices. Thus, Zain BH is revamping the network towers to adhere to the wants of the customers. Nonetheless, the costs of the upgrades are relatively high in comparison to the revenue. The internet usage is high and the coverage is 100% from all of the operators. Nonetheless, Zain BH does not acquire a large share from the telecom market as it only acquires 20% of the connection market. Zain’s 3G coverage according to the 2014 survey is “IN coverage and OK”, however, for the 4G service; the map shows many areas where the coverage is “IN coverage but NOK”. This means that the 4G users are not receiving the 4G service in those locations. Now that the towers upgrade is complete, an enhanced quality and performance is possible and can draw more customers towards Zain BH. Zain BH won the E-government Excellence award in 2014 for the best Application for smart devices (Zain Bahrain & Zain Self Care App).
En
vir
on
me
nta
l
Towers radiation Environmental
Monitoring directorate (EMD)
Inspections
TRA has an extended rules document that shed light on various environmental and health aspects of the telecom industry. It is found that radiations from devices are supposed to be limited according to certain regulations depending on the device that is being used. Another thing is the registration of any device emitting electromagnetic field with the EMD within maximum one year. Adding to that, there are regular inspections for the installation and the performance of the devices to ensure that the environment and the wildlife are not harmed and that the operations of the telecom companies are in compliance with the law.
Source: Team Estimates

19
Appendix G: Porter’s Five Forces Analysis: A. Supplier Power (bargaining power of suppliers) (High - 5): The power of suppliers over Zain BH is high for the
following reasons: The smartphones in Bahrain that are promoted heavily and are prominent amongst the public are Apple and
Samsung. The suppliers of the smartphones are two; Apple Inc. for Apple products (mainly iPhones and iPads) while Bin
Hindi Informatics is the authorized distributer for Samsung in Bahrain. Suppliers grant Zain BH a limited margin to provide some offers in order to sell the smartphones.
Ericsson providing its latest LTE technology to revamp the available towers and qualify them to deliver 4G service to Zain BH clients with over $100m.
These facts indicate that there is limited number of suppliers. Thus, suppliers can change the prices without any power to Zain BH since the suppliers are either the manufacturer (Apple & Ericsson) or the authorized distributor (Bin Hindi).
B. Buyer Power (bargaining power of buyer) (Moderate - 3): The buyers power was set as moderate as the
customers have a choice of altering the service provider based on what they deem suitable with their requirements. Thus, this gives them some power with regards to the prices that are offered by the service provider. Customers would pay more for higher quality service and speed; nonetheless, with the availability of high competition between the telecommunication services providers, the company will be forced to lower the prices to retain its customers or to attract clients of other service operators, yet, within the range that is admissible by the TRA. Henceforth, the buyer power is considered to be moderate.
C. Competitive Rivalry (High – 4.5): Zain BH has different competitors in different services and thus, it was set as High.
WiMAX service is provided by both Zain BH and Menatelecom. In the case that Zain BH’s service is not to the customers’ expectations, they can switch to the other service provider. In addition, the public’s awareness level on Menatelecoms’ WiMAX service is higher than that of Zain BH.
A possibility that Menatelecom expands to provide mobile services as they’ve announced the availability of iPhone 6s.
The telecommunications market is saturated and the market is packed already with the current providers (VIVA, Batelco) who deliver similar services as Zain BH and within the same prices range.
Many other stores sell the devices without data which makes it harder for telecom providers to compete, especially that these stores have discounts and offers on the devices. After the purchase from the store, the individual might take a prepaid service from the telecom provider and a much cheaper data.
Companies with the fiber optic infrastructure such as 2Connect, British Telecom) can enter the market and all what they will require is to obtain the license from the TRA to provide the service to individuals.
D. Threats of Substitution (Low – 2.5): Since there are not many substitutes that a client can go for, this category was
set as Low. - There isn’t a substitute to the internet service that is provided by the telecommunications company as customers can
purchase other lower in cost devices (HTC, LG, Huawei, and Sony) and then add a 3G or LTE service to it from one of the Telco’s.
- Satellite internet can be a substitute to the current internet service; nonetheless, it is high in cost as is not implemented in the market.
- Google Balloon (Loon project) can be a cost effective substitute in the market, with high speed internet, nonetheless, it is currently in the testing stage and Google did not announce the launch of this global project.
E. Threats of New Entry (Low - 1): There is no confirmed information about a new entry
in Bahrain telecommunications market. Orange once studied entering the Bahraini market, nonetheless, after VIVA’s entry, no updates happened.
Profit margins are thin due to the vicious competition between the telecom companies in the market.
Cost of operating requires over $100 million worth of investment and to break-even from all operating costs with a thin profit margin is something unfavorable to companies especially if the break-even requires a long period of time.
In addition to being a saturated market, the market size is small with high competition (Firms, n,d; Authority, 2015).
0
2
4
6
Bargainingpower of
buyer
Bargainingpower ofsupplier
Industryrivalry
Threats ofnew entry
Threats ofsubstitute
Porter's Five Forces Analysis
Source: Team Estimates

20
Appendix H: Ansoff Matrix of Growth
Given the fact that Zain BH provides a number of new products (latest devices and network services) in an existing Market (Bahrain), this means that Zain BH is in the “Product Development” stage of the growth strategy which is to acquire an additional market share. The organizations following this strategy ought to have new competences or at least a development in the existing products. Since Zain BH is providing smart devices that are available in the market, they are not capable of altering the product itself. However, Zain BH has a different approach in enhancing the service through providing additional services as follows:
Insurance on the smart devices from accidental damage (SmartInsure)
Free devices (contractual based device packages) where the payment of the device is considered as a rental for the contract period with 3 months of free 4G LTE.
Live chat which consists of online customer service employees who are available at all times through Zain
BH’s website.
Zain BH self-Care Mobile App. This application provides various benefits to the users starting from transferring credit to prepaid users without SMS. Topping up using the credit card, checking the balance, monitor the bundling usage, viewing promotions and subscribing to services, anti-spam (eliminates unwanted SMS), view Zain BH shop locations and their working hours, control of the monthly bill and online payment.
Zain BH Express Home Delivery: This service enables Zain BH users to purchase the devices online without
the need to be in one of Zain BH branches and have that device delivered to their doorsteps (Zain Bahrain, n.d.).
Revamp in the network with $100m investment that resulted in 8% y-o-y increase in data revenues for the
first 6 months of the year 2015. Growth also witnessed 4% y-o-y increase due to network appeal and marketing initiatives.
On the other hand, the recent marketing campaigns wanted to demonstrate the strength of Zain BH’s network, nonetheless, the social impact of the messages used can be translated negatively especially that it was emphasizing on breaking the rules “prepaid rules” ‘It Should be illegal”. Adding to that, the most recent marketing campaigns “Addicted to Data” has a message that can be associated with negative addiction and drug dealing “#AddictdToData & Authorized data dealer” especially that the background of the campaign featured the streets “Graffiti”. Even though it drags attentions towards Zain BH promotions, it has a possible negative impact on the community’s youth if not on the sales of the company since it seems that they are promoting illegal services and it is ok. Finally the “gigs Family” may have a unique approach since it includes anime family members; nonetheless, the name is also featuring the streets since the name is considered as slang “gigs – also an abbreviation for Gigabytes”. The execution of the marketing campaigns has to be planned carefully to not have a negative impact on the sales.
Ansoff Matrix of Growth Current Product New Product
Cu
rren
t M
ark
et
Market Penetration Product
Development
New
Mar
ket
Market Development Diversification
21
Appendix I: Six P’s Analysis
1. Product:
Zain BH provides a variety of network services. The services provided are the latest in the market (4G LTE) that is usually bundled with smart devices as the service experience circle cannot be complete unless the device supports the service. The increasing demand on higher speed internet services along with urge to have the latest technology is what Zain BH uses in its campaigns to provide their services. Moreover, there are several services such as Zain BH self-Care Mobile App and Zain BH Express Home Delivery that has many benefits are also provided.
2. Prices: Although the prices are similar from one service provider to another, nonetheless, Zain BH has contracts with Apple & Bin Hindi who are the main providers of smartphones. Thus, they are the first operators to provide the devices to their clients. Adding to that, Zain BH offers the devices as a bundle with data in the form of installments that suite a wide range of their segment.
3. Promotion: Zain BH uses promotions and bundling to increase the number of their customers. These promotions vary from internet broadband packages, to mobile bundling (payment in installments), discounted prices, and seasonal offers. These promotions in addition to added value services such as smart devices insurance, Zain BH self-Care Mobile App and Zain BH Express Home Delivery that has many benefits are also provided by Zain BH.
4. Place: Zain BH only sells their products and services in their main branch or subsidiaries which is limiting their customers choices as if their have small sale points in every mall in Bahrain. Moreover, the access for the service through mobile application can also be an added feature and an access point for the clients.
5. People & Process: From observing Zain BH Customer services and visiting different branches it is noticeable that the staff is consistent in representing the brand through their appearance (unified uniform) and the process. Staff are trained and well informed about the new promotions and services that are available. On top of that, once a customer enters a branch, they will receive a number and have a seat till they are called by the customer service employee. There will be an employee assisting customers once they enter the branch. Standards to reply to customers are also available and are applied (phrases related to Zain).
6. Physical Evidence: Zain BH has a standardized physical environment of its branches despite certain difference in the shape of the location. Devices used by the employees are modern and the seating for the clients are available. Cleanliness is maintained at all times. The ambiance of the branches is standardized.
22
Appendix J: Six S’s Analysis
1. Strategy:
Zain Bahrain’s aims to create a wide partnership with leading corporations in the Kingdom in order to have wider range of choices and to have diversified businesses. This enables them to expand more and to have a wider range of such unique partnerships that brings added value benefits to their clients and enhances their experience.
2. Structure: Zain BH has a vertical organizational structure (functional) that could be a hindrance since it is a telecommunication organization that requires rapid decision making and continuous change to accommodate the needs of the market and to keep up with the technological changes. Henceforth, this is considered as a weakness and requires a shift towards a decentralized structure that will ensure an easy flow of information between frontline employees and the management. A recommended one is the modern Network Structure.
3. Systems: Zain Group uses a program called Astellia that is based in Bahrain. “The customer insight lab focuses on providing a holistic view of Zain customers’ real-time activities, i.e. who is using what content on what device, when and where”. This enables Zain to address the needs of their customers, resolve their problems and to give them an ultimate customer experience which is one of Zain’s strategic aims.
4. Staff & Skills: Zain Bahrain in 2014 have stated in their annual report that they have provided their employees with various courses and programs that helps them develop their skills and improve self-assessment. This showed a growth of 47% as the participation in the program reached 1,528. Adding to that, Zain employs a number of university students (700 students) under a CSR initiative “F.U.N – Future University Network” aiming to involve university students in the work place and to equip them with the needed leadership and managerial skills.
5. Style: Zain BH adopts a democratic leadership style where employees input are put into consideration. They encourage creativity and individuals are highly involved in the decision-making process even when the final decision is taken by the management. This leadership style motivates the members to be productive and have high job satisfaction. On the other hand, for critical and urgent matters, the management adopts an autocratic leadership style.
6. Shared Vales: Zain BH has three core values; Radiance, heart and belonging. Radiance is about bringing life and joy to the internal and external environment. Heart is living life with passion and engagement with the surrounding. Belonging is the inclusion of the community with all transcending cultural and geographic boundaries. These values reflect on the quality and aspiration of the operator and its customers who are progressive achievers.

23
Appendix K: Stock Price Analysis
The Statistical representation indicates stock prices change since the Initial Public Offer (IPO) on December 4th, 2014.
Bahrain Bourse prices for Zain BH stocks illustrate a steady fluctuation of 2 - 4 Fils in Zain BH stock prices which started at 0.200 Fils. on March 3rd 2015 it stated that Zain Bahrain have signed a contract with SAP in order to deliver Big Data and analysis solutions that will improve the experience of the users all over GCC by 2020 which result the share prices to be 0.198 fils. The expectation from this agreement is that it will lead to an increase in the growth of the smartphones connection from 33.3% in 2014 to reach roughly 70% in 2020 (Zain Bahrain, 2015). After that, the stock prices decrease to reach 0.183 fils on March 8th, 2015 as it recurred and increased to reach 0.185 on March 10th, 2015 due to the introduction of the Radio Dot System which is to enhance the voice quality for their customers in Bahrain as they first operator in the region to implement it (Bahrain Bourse, 2015). The share prices slightly increased before collapsing on November 15th 2015 to reach 0.162 fils which was due to the fact of the decrease in Bahrain Bourse Shares prices as a result of the news released of decreasing the oil prices has reflected the decrease in all share prices in all corporations in Bahrain.
Zain BH stock prices increased and remained stable with the rate of 0.180 fils starting November 26th, 2015 up to December 31th, 2015 as a result of the increase in the number of sales derived from the new innovations provided for their customers including different services and packages (Example: The Big Gigs family ) and agreements with different organizations which has led to an increase in their Net profit by 16.71% which is BD 44,936 million for the first three quarters as it have been released in the news and the Share Basic EPS increased to reach 4 Fills which is higher than that in 2014. This means that they are increasing their shareholders wealth. Adding to that, for the first three quarter 2015 of the customer base increased to 814,000 active customers equals of year on year increase of 3% (Bahrain Bourse, 2015).
The following tables illustrate Zain BH performance over the year on 2015 which indicates that the total share price movement was -10% and Batelco Shares as well to -3.03% due to the fact that Bahrain Economical situation wasn’t stable which led to the fluctuation in the prices of all the communication corporation and the total movement of Bahrain prices index of -14.77%. Especially, in November with the announcement of decreasing in oil prices it affected all the prices badly as it shown in the table (Zawya, 2015; Bahrain Bourse, 2015).
Bahrain Index Price Movement
Zain Stock Price Movement (Gain/Loss Tables)
Batelco Stock Price Movement
24
Appendix L: Financial Indicators Analysis
DuPont Analysis As per the historical analysis of historical data of Zain BH, the company showed a decline in the return of equity gradually (ROE 2012: 12%, ROE 2013:10.19%, ROE 2014:7.61%). This gradual decline is directly related to decline in the profit margin, which represents a high decrease throughout the period of 2012-2014. On the other hand, the equity multiplier has been fluctuating throughout those years but has not decline comparatively to the profit margin and Asset turnover. In the forecasted years, the DuPont analysis stays comparatively stable from year 2015 to 2017 and then falls down to 1 % by 2020. This decline is as a result of profit margin and asset turnover, which are caused due to decrease in revenue. The decrease is due to several factors such as decreasing oil prices, increasing competition in the market and the major reason of all is the reduction in customer base, which is considered to be the prime cause of low revenue.
Liquidity Analysis The liquidity of Zain BH has remained low throughout the last three historical year ( current ratio- 2012= 0.62, 2013= 0.72, 2014=0.71), which put doubt over whether Zain BH can pay its short term obligations effectively without defaulting. Moreover to better understand the liquidity position of the company's, Acid test ratios were calculated, which showed similar pattern (Acid test ratio- 2012=0.58, 2013=0.64, 2014=0.65). The liquidity ratios pose very huge threat to Zain BH for not being able to pay back its short term liabilities such as current portion of debt, accruals and payables. The forecasted years shows signs of decrease in the Current and quick ratio but was back to the historical figure , the fall was as a result of more estimated capital expenditure, however it remained low due to being on overdraft by the bank. (Current ratio- 2018=0.62, 2019=0.62, 2020=0.70). The quick ratio has remained stable as their current assets were increasing in a slower pace in respect to current liabilities due to bank overdraft that caused the current ratio to reduce. Moreover, the current assets were reduced due to reducing inventory as well as reducing accounts receivable.
Financing Structure Zain BH has been historically has financed by both the debt and equity in equal manner, however, Since 2012, the debt to equity ratio has risen dramatically from 70 % in 2012 to 102 % in 2013 and back down to 88 % in 2014. Being a service provider a high debt to Equity ratio is considered normal, however being excessively financing through debt, Zain BH is being pulled in the risk of not being able to generate enough revenue to pay back the debt and cover its obligations if the financing does not result profitable. Moreover, the forecasted Debt – Equity ratio shows a balanced ratio ranging from 78% in 2016 to 91 & 89 % in 2018 -2019, and to 88% in 2020. The rise in the ratio is due to the Zain BH borrowing to invest in infrastructure for 5g network in the country, being telecommunication company, the investment is a continues activity that are undertaken by the company to attract customers to increase their subscription base. In addition, higher investments are required to maintain a good competitive advantage in the market, by providing new and latest technology. Due to this trend of continuous investment, the company are likely to obtain more fund through debt as cost of borrowing is usually cheaper than cost of equity.
Solvency Ratios Debt Ratio: Zain Bahrain debt ratio was in its lowest levels before year 2011, due to the fact that the Bahraini economy was stable until the political conflicts in 2011 that affected the purchasing powers of the citizens, which resulted in less sales and more bad debts. However, in 2012, Viva dominance in the market has become more apparent and affecting the major industry players. As a result, Zain BH lost a part of its market share and sales to Viva, and it had to take loans in order to operate and cover its low cash in hand. Furthermore, in preparation to adapt the new 4G technology, Zain has taken BD 31 million from multiple banks in 2013, in which has led to major increase in the debt ratio. On the following years, the debt ratio is decreasing as the company seems to payback the principal, but Zain is expected to take another loan by year 2018 as a source of funding for adapting 5G technology. Interest coverage ratio: In 2010, Zain Bahrain profit before interest and tax was able to cover the year’s finance cost for 371 times, which shows that the company was generating very high profit from investors’ money, rather than debt. However, with the changes mentioned above, the ‘profit before interest and tax’ has decrease and finance costs has increased with the huge loans taken, as a result Zain became able to cover its interest cost through its profit for 32 times only in in 2012. Until year 2015, the ratio has decreased to 6 times only, which shows that Zain is in a critical situation. As a result, Zain might move toward taking further loans or seek for more funding from investors to cover the current interest. However, in 2016, Zain situation has improved although its profit is decreasing comparing to the previous years, because of the decreasing interest obligations in 2016 and following years. Net debt to EBITDA: Net debt/EBITDA ratio shows the company ability to cover its debt by its earnings before interest, tax, depreciation, and amortization. A ratio less than 1 represents a company that’s earnings can cover the

25
debt easily. The higher the ratio than 1, the more it shows that the company are in debt and unable to cover the debt through operations easily. In 2010, the company was in its best situations, with high profit and low debt, as a result its net debt/EBITDA ratio was 0.36 only. On the following year, the ratio reached 0.91 because of a decrease in cash and EBITDA. The ratio is increasing constantly as a result of the economy effect on Zain’s profit. Meanwhile, it has reached the highest levels in year 2019 (2.20) and 2020 (2.30), as a consequence of taking loans and the low profits in these two years.
Profitability ratios: The gross profit margin has been increasing continuously from 77% in 2010 to 84% in 2015, which shows that Zain BH is producing sales more efficiently over years. However, the ratio has decreased to 71% in 2011 that might be the consequence of suppliers changing prices or dealing with different suppliers during the political crisis in Bahrain. Also, the ratio will increase by 5% between the period between 2016 and 2020, which explains that Zain will follow a long term strategy for sales production throughout the period. Furthermore, the net profit margin has continuously decreased from 25% in 2010 to 2% in 2020, which shows that the company is spending a very big portion of its revenue on covering its expenses. Also, this highlights that Zain’s management are weak in organizing the operating expenses and planning to be sustainable. Additionally, the EBITDA margin is almost constant over the period from 2010 to 2018 and reached 42% in 2020, which shows that the operational expenses are fairly controlled against the revenue generated that might be a strategy by Zain BH. On the other hand, return on capital employed and return on assets ratios that shows the company effectiveness in utilizing the shareholders money and assets in producing profit. First, the return on assets ratio is continuously decreasing from 23% to 3 over a period of 9 years. This is because the continuous decrease in profit and the tremendous increase in assets value in order to keep up with the new technologies. However, this would show the company inability to convert the adapted new technologies into sales, which might be a reason for a low customer base. Second, return on capital employed is decreasing from 34% to 1% through the period as well. This explains that Zain BH is not utilizing the shareholders investments effectively, and although shareholders are investing in Zain Bahrain, its unable to generate better profit that the previous year.

26
Appendix M: Market Analysis
The conducted market analysis indicates a continuous improvement in the service that can ultimately increase the number of clients for Zain BH on the long run. The group-wide agreements and the reputation back up the performance of the company and its ability to compete in the market. Systems and processes are in place to increase the professionalism of the company. Prices are competitive in comparison with the competitors as packages are imitated and provided with minimal alterations differing from each operator. The internal environment along with the online services gives Zain BH a competitive advantage over its competitors. Although both VIVA and Batelco provide value added services, Zain BH can educate its clients about the value added services and their benefits to make Zain BH the favorable service provider. The decrease in the revenue however, was due to the low quality of service due to the network revamp in 2014, thus, nearly 36% had shifted from Zain BH to other operators.
VIVA as a major competitor in the telecom market
VIVA, the highest market share owner in the Bahraini telecom market acquiring 51% of the market. Viva a subsidiary of Saudi Telecom Company (STC) known for its fierce market penetration strategies that forces the other telecoms to reduce their profit margin to stay in competition. STC as a brand is ranked 25th most valuable global telecom worth $5,695m in 2015 by Brand Finance. STC however, is renamed in Bahrain to Viva (Brand Finance, 2015). Viva has 6 different licenses obtained from the TRA which indicates the diversification in the provided services (TRA, 2014). It has a comprehensive retails network, user-friendly web portal, 400 payment channels and over 3,400 distribution channels outlets. Viva has various CSR programs such as VIVA Jusoor & Fereej VIVA (VIVA, 2015).
Batelco as a major competitor in the telecom market
Batelco, the first telecom company in Bahrain and has a number of subsidiaries under (BATELCO GROUP) through which it operates across 14 different markets in the MENA region and internationally. Batelco as a brand is ranked 205th most valuable global telecom worth $184m in 2015 by Brand Finance (Brand Finance, 2015). Batelco has 7 different licenses obtained from the TRA and has a strong infrastructure (TRA, 2014). Batelco is currently promoting the fiber optic service across Bahrain even though the fiber optic network coverage is not yet complete. Batelco currently has 29% of the market share (TRA, 2014). Batelco has 26 retail outlets in addition to the website for payment and other services (Batelco, 2015). Batelco has been downgraded to BBB- by Fitch, yet, it is still keeping an adequate market share and position (Zawaya, 2015).
Zain BH’s Status in the Telecommunication Market Zain BH has various strengths as they have strategic partnerships and vital suppliers, advanced network infrastructure, complaints management system, competitive prices, licenses, brand value, diversified product portfolio, culture of new innovative products and services, strong distribution network and partner relationship, relationship with parent company and experienced management team. Zain BH has weaknesses of lack in directed awareness and network coverage. There opportunities however are increased customer satisfaction, market expansion, high speed internet, digital presence along with corporate sustainability and social responsibility (CSSR). Threats on the other side are technological changes, governmental taxes, market prices, network overload, aggressive competition and TRA regulations.
Table-M1
Table-M2
Source: Zain, Batelco, VIVA
Data packages
Local Calls Other Local Networks
International Calls (Free)*
Data SMS
Zain Unlimited to Zain 50 Min/week Available 2 GB/ Week N/A
Batelco Unlimited to Batelco 60 Min/week Available 2.5 GB/ Week
Unlimited
Viva Unlimited to Viva 50 Min/week Available 2 GB/ Week N/A
Source: TRA Bahrain - 2014, Brand Finance, Zain, Batelco, VIVA
iPhone 6s (16 GB)
12 months
Down payment
Minutes Fixed
Payment **
Data Usage**
* Total price
Zain BD 125 Unlimited* BD 20 3 GB BD 365
Batelco BD 115 Unlimited BD 20 3 GB BD 355
VIVA BD 129 Unlimited BD 20 3 GB BD 369
* Unlimited to the same network ** BD 20 fixed payment ***Fair usage policy applies
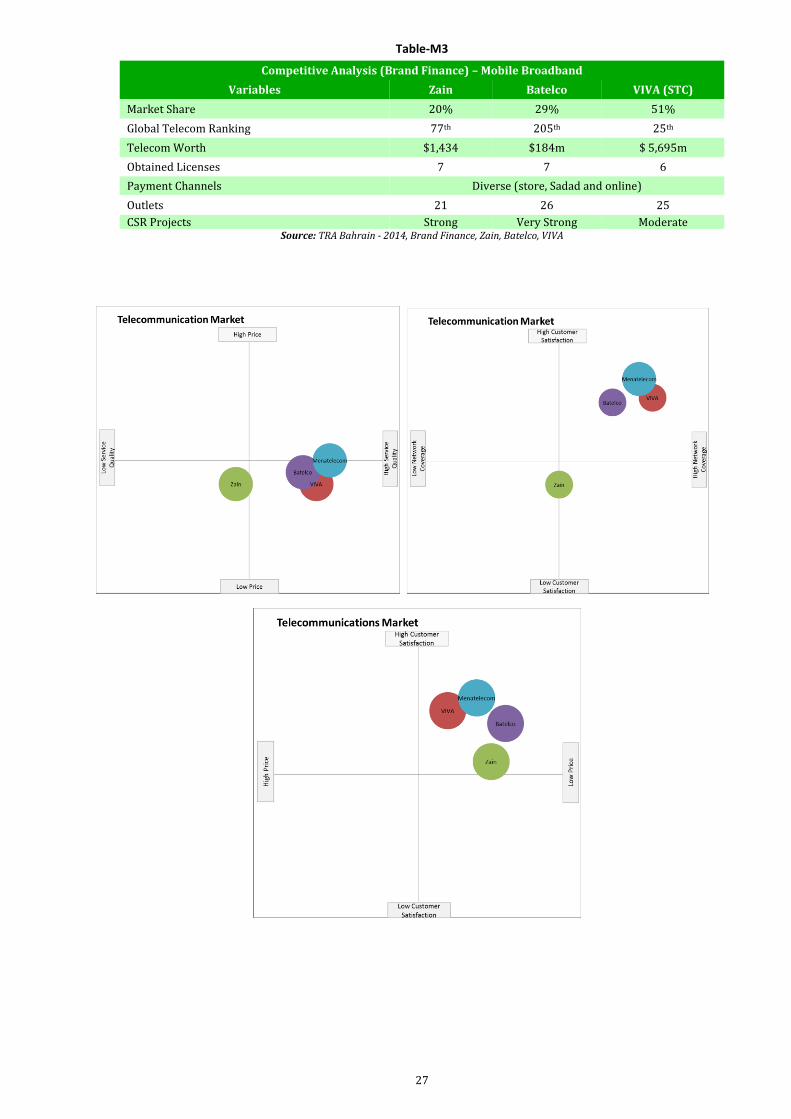
27
Table-M3
Competitive Analysis (Brand Finance) – Mobile Broadband
Variables Zain Batelco VIVA (STC)
Market Share 20% 29% 51%
Global Telecom Ranking 77th 205th 25th
Telecom Worth $1,434 $184m $ 5,695m
Obtained Licenses 7 7 6
Payment Channels Diverse (store, Sadad and online)
Outlets 21 26 25
CSR Projects Strong Very Strong Moderate Source: TRA Bahrain - 2014, Brand Finance, Zain, Batelco, VIVA
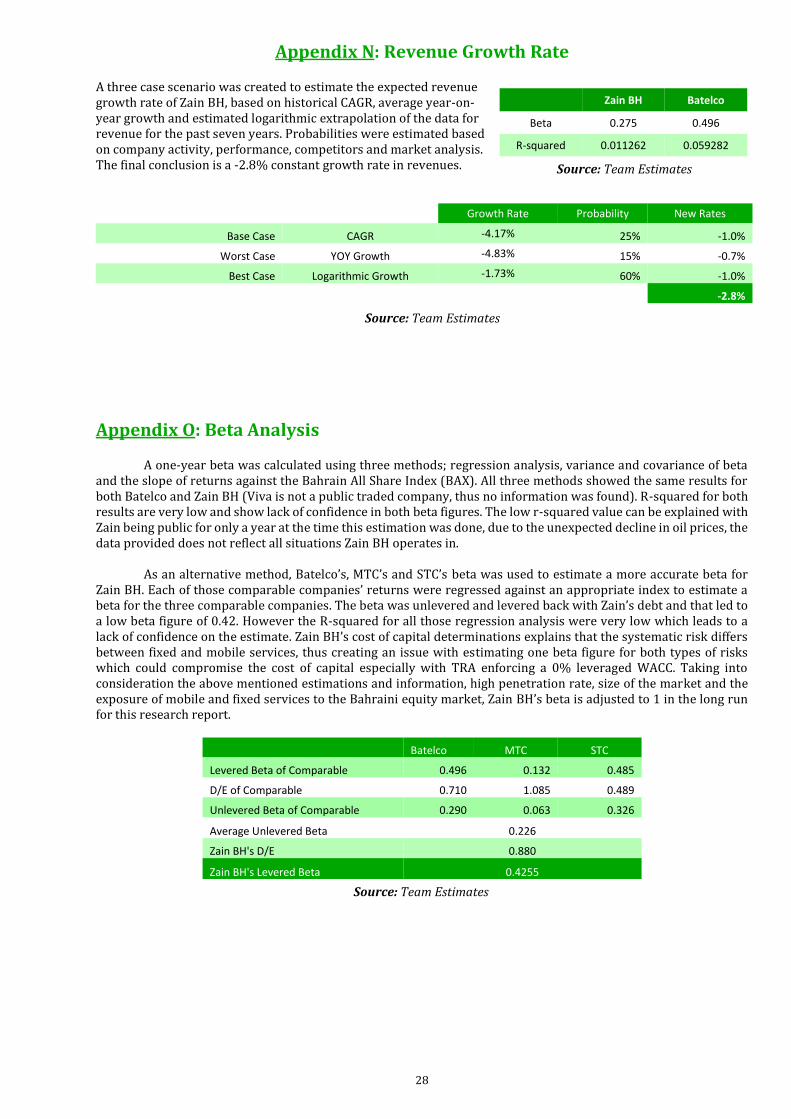
28
Appendix N: Revenue Growth Rate
A three case scenario was created to estimate the expected revenue growth rate of Zain BH, based on historical CAGR, average year-on-year growth and estimated logarithmic extrapolation of the data for revenue for the past seven years. Probabilities were estimated based on company activity, performance, competitors and market analysis. The final conclusion is a -2.8% constant growth rate in revenues.
Growth Rate Probability New Rates
Base Case CAGR -4.17% 25% -1.0%
Worst Case YOY Growth -4.83% 15% -0.7%
Best Case Logarithmic Growth -1.73% 60% -1.0%
-2.8%
Appendix O: Beta Analysis
A one-year beta was calculated using three methods; regression analysis, variance and covariance of beta and the slope of returns against the Bahrain All Share Index (BAX). All three methods showed the same results for both Batelco and Zain BH (Viva is not a public traded company, thus no information was found). R-squared for both results are very low and show lack of confidence in both beta figures. The low r-squared value can be explained with Zain being public for only a year at the time this estimation was done, due to the unexpected decline in oil prices, the data provided does not reflect all situations Zain BH operates in.
As an alternative method, Batelco’s, MTC’s and STC’s beta was used to estimate a more accurate beta for Zain BH. Each of those comparable companies’ returns were regressed against an appropriate index to estimate a beta for the three comparable companies. The beta was unlevered and levered back with Zain’s debt and that led to a low beta figure of 0.42. However the R-squared for all those regression analysis were very low which leads to a lack of confidence on the estimate. Zain BH’s cost of capital determinations explains that the systematic risk differs between fixed and mobile services, thus creating an issue with estimating one beta figure for both types of risks which could compromise the cost of capital especially with TRA enforcing a 0% leveraged WACC. Taking into consideration the above mentioned estimations and information, high penetration rate, size of the market and the exposure of mobile and fixed services to the Bahraini equity market, Zain BH’s beta is adjusted to 1 in the long run for this research report.
Batelco MTC STC
Levered Beta of Comparable 0.496 0.132 0.485
D/E of Comparable 0.710 1.085 0.489
Unlevered Beta of Comparable 0.290 0.063 0.326
Average Unlevered Beta 0.226
Zain BH's D/E 0.880
Zain BH's Levered Beta 0.4255
Zain BH Batelco
Beta 0.275 0.496
R-squared 0.011262 0.059282
Source: Team Estimates
Source: Team Estimates
Source: Team Estimates
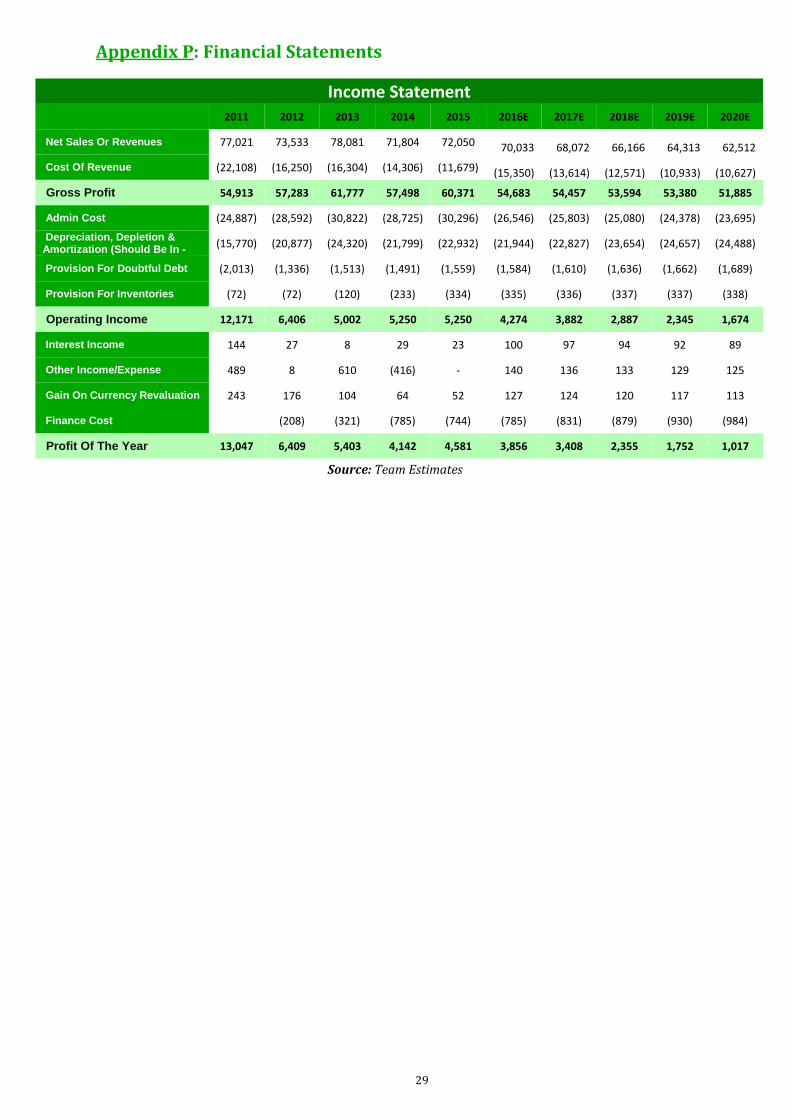
29
Appendix P: Financial Statements
Income Statement 2011 2012 2013 2014 2015 2016E 2017E 2018E 2019E 2020E
Net Sales Or Revenues 77,021 73,533 78,081 71,804 72,050 70,033 68,072 66,166 64,313 62,512
Cost Of Revenue (22,108) (16,250) (16,304) (14,306) (11,679) (15,350) (13,614) (12,571) (10,933) (10,627)
Gross Profit 54,913 57,283 61,777 57,498 60,371 54,683 54,457 53,594 53,380 51,885
Admin Cost (24,887) (28,592) (30,822) (28,725) (30,296) (26,546) (25,803) (25,080) (24,378) (23,695)
Depreciation, Depletion & Amortization (Should Be In -
(15,770) (20,877) (24,320) (21,799) (22,932) (21,944) (22,827) (23,654) (24,657) (24,488)
Provision For Doubtful Debt (2,013) (1,336) (1,513) (1,491) (1,559) (1,584) (1,610) (1,636) (1,662) (1,689)
Provision For Inventories (72) (72) (120) (233) (334) (335) (336) (337) (337) (338)
Operating Income 12,171 6,406 5,002 5,250 5,250 4,274 3,882 2,887 2,345 1,674
Interest Income 144 27 8 29 23 100 97 94 92 89
Other Income/Expense 489 8 610 (416) - 140 136 133 129 125
Gain On Currency Revaluation 243 176 104 64 52 127 124 120 117 113
Finance Cost (208) (321) (785) (744) (785) (831) (879) (930) (984)
Profit Of The Year 13,047 6,409 5,403 4,142 4,581 3,856 3,408 2,355 1,752 1,017
Source: Team Estimates

30
Balance Sheet 2011A 2012A 2013A 2014A 2015E 2016E 2017E 2018E 2019E 2020E
Assets
Current assets
Cash & Bank Balance (ST) 5,238 1,766 3,156 2,974 5,663 1,763 383 2,707 1,874 2,581
Receivables (Net) 21,554 19,930 20,644 21,238 21,789 21,917 22,045 22,239 22,434 22,697
Inventories - Total 2,601 1,595 2,971 2,128 2,276 2,163 3,557 4,649 7,235 10,233
Current Assets - Total 29,393 23,291 26,771 26,340 29,727 25,843 25,986 29,595 31,542 35,511
Non-Current assets
Property Plant & Equipment 49,848 53,310 61,367 69,806 69,003 73,463 75,961 84,851 85,841 87,160
Intangible Assets 10,155 15,412 19,166 15,940 12,356 13,242 13,515 13,281 12,546 11,225
Total Non-Current assets 60,003 68,722 80,533 85,746 81,359 86,705 89,476 98,132 98,387 98,385
Total Assets 89,396 92,013 107,304 112,086 111,086 112,548 115,461 127,727 129,929 133,896
Liabilities
Current liabilities
Bank Over Draft 893 9,271 0 0 0 0 575 4,060 10,617 14,626 Accounts Payable and accruals
25,466 23,684 29,166 25,669 25,757 31,005 29,484 31,753 29,831 27,433
Current Portion of term loans (LT)
0 0 3,286 6,961 7,786 4,934 3,209 8,240 6,844 5,422
Deffered revenue 3,950 4,749 4,769 4,529 4,202 3,983 3,778 3,465 3,218 2,894
Current Liabilities - Total 30,309 37,704 37,221 37,159 37,745 39,922 37,046 47,518 50,510 50,375
Non-Current liabilities Non-Current Liabilities of term loans
0 0 16,714 14,971 12,616 9,182 12,645 13,113 10,756 12,234
Provision of employees end of service benefit
260 273 330 323 191 159 128 95 66 35
Total Non-current Liabilities 260 273 17,044 15,294 12,807 9,341 12,773 13,208 10,822 12,269
Total Liabilities 30,569 37,977 54,265 52,453 50,552 49,263 49,819 60,726 61,331 62,644
Shareholders' Equity
Share Capital 32,000 32,000 32,000 36,800 36,800 36,800 36,800 36,800 36,800 36,800
Share Premium 100 100 100 3,032 3,032 3,032 3,032 3,032 3,032 3,032
Statutory Reserves 8,272 8,913 9,453 9,867 10,322 10,522 10,822 11,322 11,622 11,822
Retained Earnings 18,455 13,023 11,486 9,934 10,380 12,931 14,989 15,847 17,144 19,598
Total Shareholders’ Equity 58,827 54,036 53,039 59,633 60,534 63,285 65,643 67,001 68,598 71,252
Total Liabilities and S. Equity 89,396 92,013 107,304 112,086 111,086 112,548 115,462 127,727 129,929 133,896
Source: Team Estimates
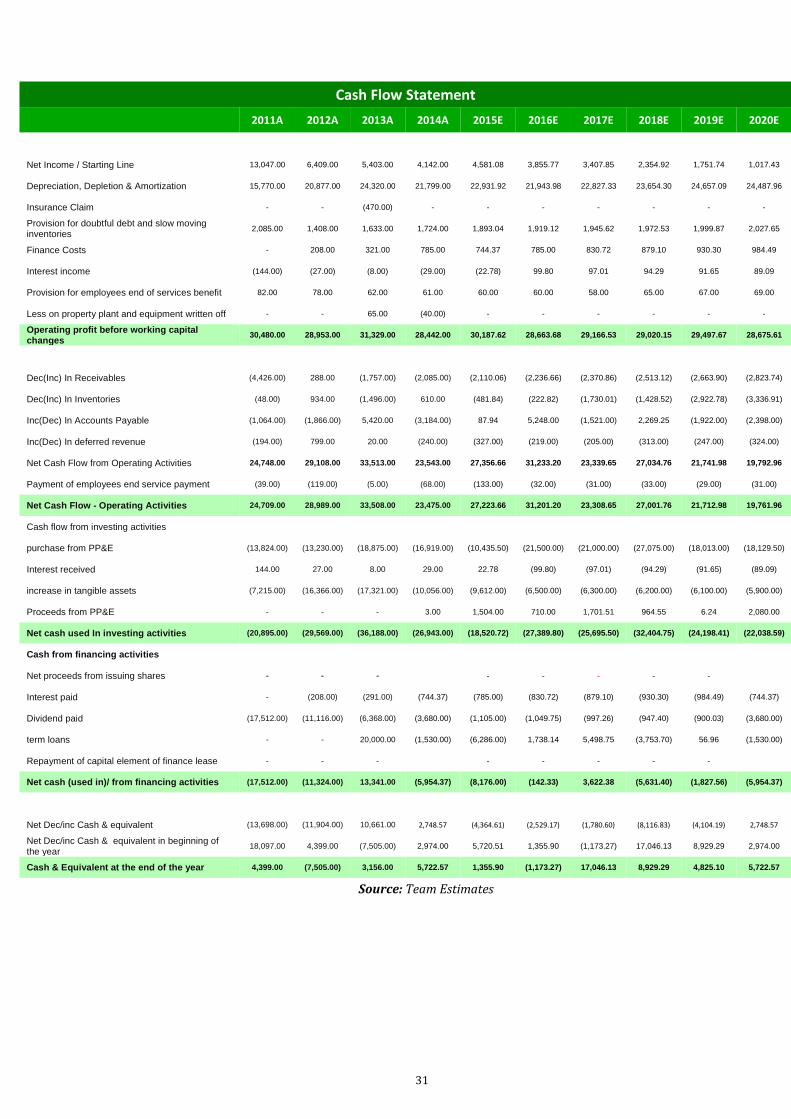
31
Cash Flow Statement
2011A 2012A 2013A 2014A 2015E 2016E 2017E 2018E 2019E 2020E
Net Income / Starting Line 13,047.00 6,409.00 5,403.00 4,142.00 4,581.08 3,855.77 3,407.85 2,354.92 1,751.74 1,017.43
Depreciation, Depletion & Amortization 15,770.00 20,877.00 24,320.00 21,799.00 22,931.92 21,943.98 22,827.33 23,654.30 24,657.09 24,487.96
Insurance Claim - - (470.00) - - - - - - -
Provision for doubtful debt and slow moving inventories
2,085.00 1,408.00 1,633.00 1,724.00 1,893.04 1,919.12 1,945.62 1,972.53 1,999.87 2,027.65
Finance Costs - 208.00 321.00 785.00 744.37 785.00 830.72 879.10 930.30 984.49
Interest income (144.00) (27.00) (8.00) (29.00) (22.78) 99.80 97.01 94.29 91.65 89.09
Provision for employees end of services benefit 82.00 78.00 62.00 61.00 60.00 60.00 58.00 65.00 67.00 69.00
Less on property plant and equipment written off - - 65.00 (40.00) - - - - - -
Operating profit before working capital changes
30,480.00 28,953.00 31,329.00 28,442.00 30,187.62 28,663.68 29,166.53 29,020.15 29,497.67 28,675.61
Dec(Inc) In Receivables (4,426.00) 288.00 (1,757.00) (2,085.00) (2,110.06) (2,236.66) (2,370.86) (2,513.12) (2,663.90) (2,823.74)
Dec(Inc) In Inventories (48.00) 934.00 (1,496.00) 610.00 (481.84) (222.82) (1,730.01) (1,428.52) (2,922.78) (3,336.91)
Inc(Dec) In Accounts Payable (1,064.00) (1,866.00) 5,420.00 (3,184.00) 87.94 5,248.00 (1,521.00) 2,269.25 (1,922.00) (2,398.00)
Inc(Dec) In deferred revenue (194.00) 799.00 20.00 (240.00) (327.00) (219.00) (205.00) (313.00) (247.00) (324.00)
Net Cash Flow from Operating Activities 24,748.00 29,108.00 33,513.00 23,543.00 27,356.66 31,233.20 23,339.65 27,034.76 21,741.98 19,792.96
Payment of employees end service payment (39.00) (119.00) (5.00) (68.00) (133.00) (32.00) (31.00) (33.00) (29.00) (31.00)
Net Cash Flow - Operating Activities 24,709.00 28,989.00 33,508.00 23,475.00 27,223.66 31,201.20 23,308.65 27,001.76 21,712.98 19,761.96
Cash flow from investing activities
purchase from PP&E (13,824.00) (13,230.00) (18,875.00) (16,919.00) (10,435.50) (21,500.00) (21,000.00) (27,075.00) (18,013.00) (18,129.50)
Interest received 144.00 27.00 8.00 29.00 22.78 (99.80) (97.01) (94.29) (91.65) (89.09)
increase in tangible assets (7,215.00) (16,366.00) (17,321.00) (10,056.00) (9,612.00) (6,500.00) (6,300.00) (6,200.00) (6,100.00) (5,900.00)
Proceeds from PP&E - - - 3.00 1,504.00 710.00 1,701.51 964.55 6.24 2,080.00
Net cash used In investing activities (20,895.00) (29,569.00) (36,188.00) (26,943.00) (18,520.72) (27,389.80) (25,695.50) (32,404.75) (24,198.41) (22,038.59)
Cash from financing activities
Net proceeds from issuing shares - - - - - - - -
Interest paid - (208.00) (291.00) (744.37) (785.00) (830.72) (879.10) (930.30) (984.49) (744.37)
Dividend paid (17,512.00) (11,116.00) (6,368.00) (3,680.00) (1,105.00) (1,049.75) (997.26) (947.40) (900.03) (3,680.00)
term loans - - 20,000.00 (1,530.00) (6,286.00) 1,738.14 5,498.75 (3,753.70) 56.96 (1,530.00)
Repayment of capital element of finance lease - - - - - - - -
Net cash (used in)/ from financing activities (17,512.00) (11,324.00) 13,341.00 (5,954.37) (8,176.00) (142.33) 3,622.38 (5,631.40) (1,827.56) (5,954.37)
Net Dec/inc Cash & equivalent (13,698.00) (11,904.00) 10,661.00 2,748.57 (4,364.61) (2,529.17) (1,780.60) (8,116.83) (4,104.19) 2,748.57
Net Dec/inc Cash & equivalent in beginning of the year
18,097.00 4,399.00 (7,505.00) 2,974.00 5,720.51 1,355.90 (1,173.27) 17,046.13 8,929.29 2,974.00
Cash & Equivalent at the end of the year 4,399.00 (7,505.00) 3,156.00 5,722.57 1,355.90 (1,173.27) 17,046.13 8,929.29 4,825.10 5,722.57
Source: Team Estimates
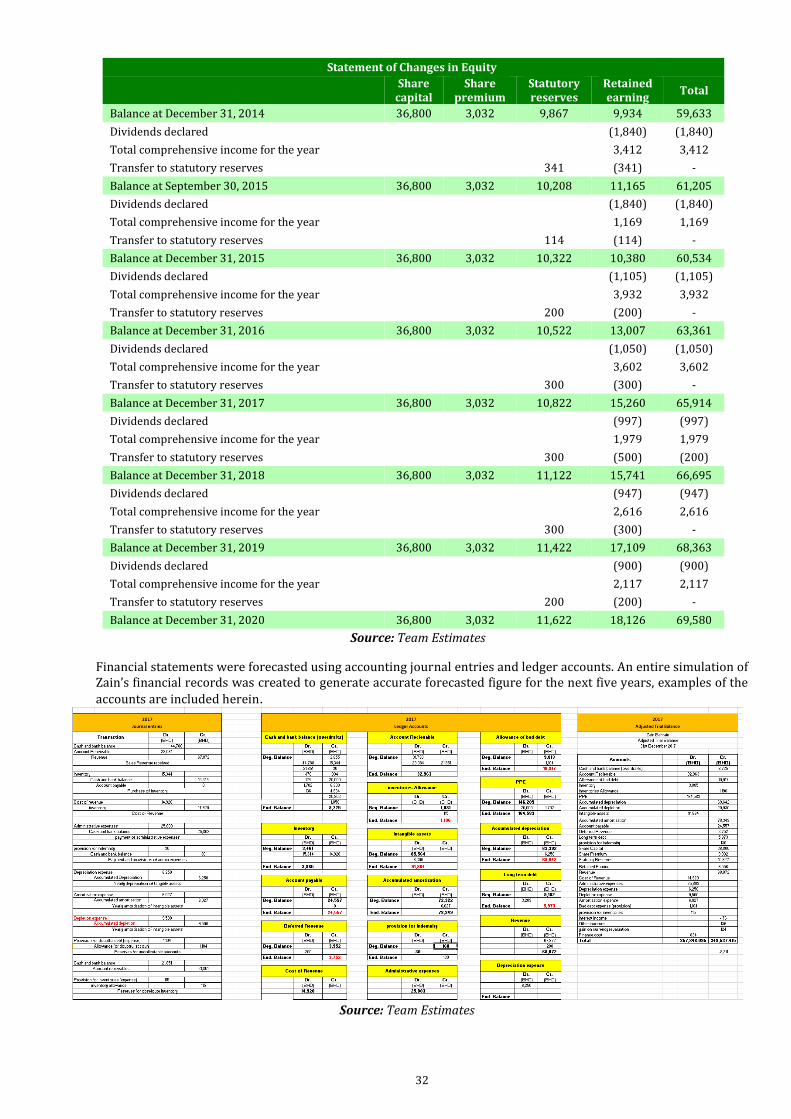
32
Statement of Changes in Equity
Share
capital Share
premium Statutory reserves
Retained earning
Total
Balance at December 31, 2014 36,800 3,032 9,867 9,934 59,633
Dividends declared (1,840) (1,840)
Total comprehensive income for the year 3,412 3,412
Transfer to statutory reserves 341 (341) -
Balance at September 30, 2015 36,800 3,032 10,208 11,165 61,205
Dividends declared (1,840) (1,840)
Total comprehensive income for the year 1,169 1,169
Transfer to statutory reserves 114 (114) -
Balance at December 31, 2015 36,800 3,032 10,322 10,380 60,534
Dividends declared (1,105) (1,105)
Total comprehensive income for the year 3,932 3,932
Transfer to statutory reserves 200 (200) -
Balance at December 31, 2016 36,800 3,032 10,522 13,007 63,361
Dividends declared (1,050) (1,050)
Total comprehensive income for the year 3,602 3,602
Transfer to statutory reserves 300 (300) -
Balance at December 31, 2017 36,800 3,032 10,822 15,260 65,914
Dividends declared (997) (997)
Total comprehensive income for the year 1,979 1,979
Transfer to statutory reserves 300 (500) (200)
Balance at December 31, 2018 36,800 3,032 11,122 15,741 66,695
Dividends declared (947) (947)
Total comprehensive income for the year 2,616 2,616
Transfer to statutory reserves 300 (300) -
Balance at December 31, 2019 36,800 3,032 11,422 17,109 68,363
Dividends declared (900) (900)
Total comprehensive income for the year 2,117 2,117
Transfer to statutory reserves 200 (200) -
Balance at December 31, 2020 36,800 3,032 11,622 18,126 69,580
Financial statements were forecasted using accounting journal entries and ledger accounts. An entire simulation of Zain’s financial records was created to generate accurate forecasted figure for the next five years, examples of the
accounts are included herein.
Source: Team Estimates
Source: Team Estimates
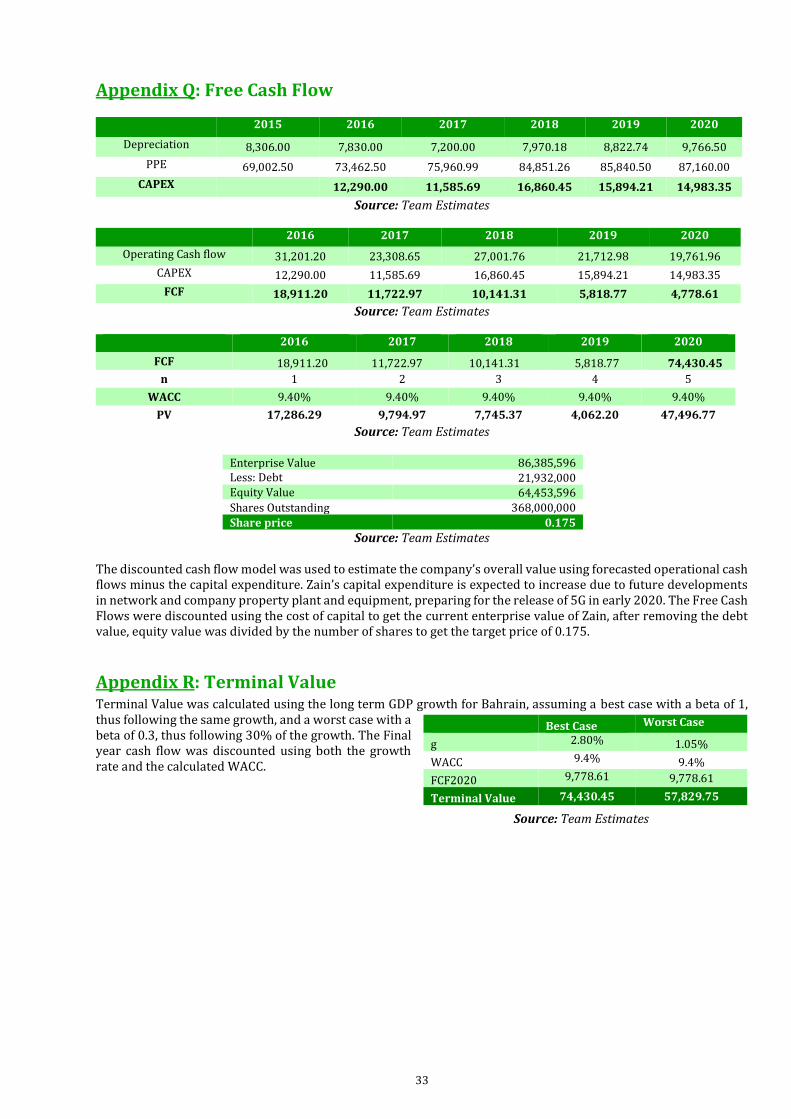
33
Appendix Q: Free Cash Flow
2015 2016 2017 2018 2019 2020
Depreciation 8,306.00 7,830.00 7,200.00 7,970.18 8,822.74 9,766.50
PPE 69,002.50 73,462.50 75,960.99 84,851.26 85,840.50 87,160.00
CAPEX 12,290.00 11,585.69 16,860.45 15,894.21 14,983.35
Source: Team Estimates
2016 2017 2018 2019 2020
Operating Cash flow 31,201.20 23,308.65 27,001.76 21,712.98 19,761.96
CAPEX 12,290.00 11,585.69 16,860.45 15,894.21 14,983.35
FCF 18,911.20 11,722.97 10,141.31 5,818.77 4,778.61
Source: Team Estimates
2016 2017 2018 2019 2020
FCF 18,911.20 11,722.97 10,141.31 5,818.77 74,430.45
n 1 2 3 4 5
WACC 9.40% 9.40% 9.40% 9.40% 9.40%
PV 17,286.29 9,794.97 7,745.37 4,062.20 47,496.77
Source: Team Estimates
Enterprise Value 86,385,596 Less: Debt 21,932,000 Equity Value 64,453,596
Shares Outstanding 368,000,000
Share price 0.175
Source: Team Estimates
The discounted cash flow model was used to estimate the company’s overall value using forecasted operational cash flows minus the capital expenditure. Zain’s capital expenditure is expected to increase due to future developments in network and company property plant and equipment, preparing for the release of 5G in early 2020. The Free Cash Flows were discounted using the cost of capital to get the current enterprise value of Zain, after removing the debt value, equity value was divided by the number of shares to get the target price of 0.175.
Appendix R: Terminal Value Terminal Value was calculated using the long term GDP growth for Bahrain, assuming a best case with a beta of 1, thus following the same growth, and a worst case with a beta of 0.3, thus following 30% of the growth. The Final year cash flow was discounted using both the growth rate and the calculated WACC.
Best Case Worst Case
g 2.80% 1.05%
WACC 9.4% 9.4%
FCF2020 9,778.61 9,778.61
Terminal Value 74,430.45 57,829.75
Source: Team Estimates
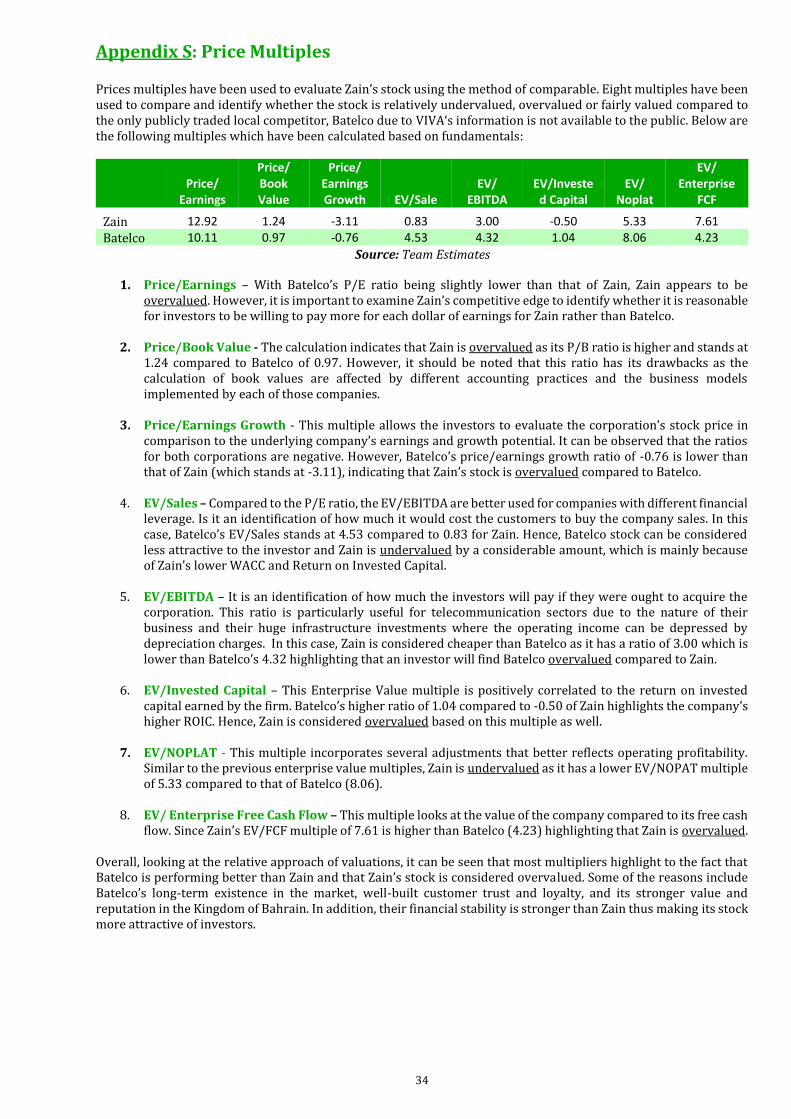
34
Appendix S: Price Multiples Prices multiples have been used to evaluate Zain’s stock using the method of comparable. Eight multiples have been used to compare and identify whether the stock is relatively undervalued, overvalued or fairly valued compared to the only publicly traded local competitor, Batelco due to VIVA‘s information is not available to the public. Below are the following multiples which have been calculated based on fundamentals:
Price/ Earnings
Price/ Book Value
Price/ Earnings Growth EV/Sale
EV/ EBITDA
EV/Invested Capital
EV/ Noplat
EV/ Enterprise
FCF
Zain 12.92 1.24 -3.11 0.83 3.00 -0.50 5.33 7.61
Batelco 10.11 0.97 -0.76 4.53 4.32 1.04 8.06 4.23
1. Price/Earnings – With Batelco’s P/E ratio being slightly lower than that of Zain, Zain appears to be overvalued. However, it is important to examine Zain’s competitive edge to identify whether it is reasonable for investors to be willing to pay more for each dollar of earnings for Zain rather than Batelco.
2. Price/Book Value - The calculation indicates that Zain is overvalued as its P/B ratio is higher and stands at 1.24 compared to Batelco of 0.97. However, it should be noted that this ratio has its drawbacks as the calculation of book values are affected by different accounting practices and the business models implemented by each of those companies.
3. Price/Earnings Growth - This multiple allows the investors to evaluate the corporation’s stock price in comparison to the underlying company’s earnings and growth potential. It can be observed that the ratios for both corporations are negative. However, Batelco’s price/earnings growth ratio of -0.76 is lower than that of Zain (which stands at -3.11), indicating that Zain’s stock is overvalued compared to Batelco.
4. EV/Sales – Compared to the P/E ratio, the EV/EBITDA are better used for companies with different financial leverage. Is it an identification of how much it would cost the customers to buy the company sales. In this case, Batelco’s EV/Sales stands at 4.53 compared to 0.83 for Zain. Hence, Batelco stock can be considered less attractive to the investor and Zain is undervalued by a considerable amount, which is mainly because of Zain’s lower WACC and Return on Invested Capital.
5. EV/EBITDA – It is an identification of how much the investors will pay if they were ought to acquire the corporation. This ratio is particularly useful for telecommunication sectors due to the nature of their business and their huge infrastructure investments where the operating income can be depressed by depreciation charges. In this case, Zain is considered cheaper than Batelco as it has a ratio of 3.00 which is lower than Batelco’s 4.32 highlighting that an investor will find Batelco overvalued compared to Zain.
6. EV/Invested Capital – This Enterprise Value multiple is positively correlated to the return on invested capital earned by the firm. Batelco’s higher ratio of 1.04 compared to -0.50 of Zain highlights the company’s higher ROIC. Hence, Zain is considered overvalued based on this multiple as well.
7. EV/NOPLAT - This multiple incorporates several adjustments that better reflects operating profitability. Similar to the previous enterprise value multiples, Zain is undervalued as it has a lower EV/NOPAT multiple of 5.33 compared to that of Batelco (8.06).
8. EV/ Enterprise Free Cash Flow – This multiple looks at the value of the company compared to its free cash flow. Since Zain’s EV/FCF multiple of 7.61 is higher than Batelco (4.23) highlighting that Zain is overvalued.
Overall, looking at the relative approach of valuations, it can be seen that most multipliers highlight to the fact that Batelco is performing better than Zain and that Zain’s stock is considered overvalued. Some of the reasons include Batelco’s long-term existence in the market, well-built customer trust and loyalty, and its stronger value and reputation in the Kingdom of Bahrain. In addition, their financial stability is stronger than Zain thus making its stock more attractive of investors.
Source: Team Estimates

35
Due to the sufficient lack of local market data, multiples from GCC countries were gathered and weighted to create market averages of Price/Earnings, Price/Book Value and Enterprise Value/EBITDA. The companies chosen represent the regional market which due to Bahrain’s size and relations, has great effect on local operations. The target price from multiples is BD0.182 based on an equal average of all three prices generated from the multiples approach.
Price/
Earning (1)
Price/ Book
(2)
EV/ EBITDA
(3) EBITDA
Market Cap in (BHD)
Weighted average
(4) P/E P/ B
EV/ EBIDTA
Zain (BHR) 12.92 1.24 3.00 13,995,000 61,824,000
Batelco (BHR) 10.17 0.97 4.32 144,900,000 502,286,400 3% 0.26 0.02 0.11
STC (KSA) 12.28 1.99 5.61 19,192,000,000 12,060,240,964 62% 7.59 1.23 3.47
DU (UAE) 11.76 3.23 4.29 5,095,000,000 2,435,553,274 12% 1.47 0.40 0.54
Zain (KUW) 8.75 0.85 4.37 490,000,000 1,661,728,395 9% 0.75 0.07 0.37
Ooredo (Qatar & Oman) 10.24 1.21 4.20 11,990,000,000 2,844,720,494 15% 1.49 0.18 0.61
Average 11.56 1.91 5.10
Zain EPS 0.013
P/E Multiple 11.56
Target Price 0.150
Weight 33%
Discount to Valuation -16%
Zain's book value 38,624,000.00
P/B Multiple 1.91
Target Price 0.200
Weight 33%
Discount to Valuation 11%
Zain's EBITDA BHD 13,995,000
EV/EBITDA 5.10
EV BHD 71,383,706.69
Target Price 0.194
Weight 33%
Discount to Valuation 8%
Source: Team Estimates

36
Appendix T: Capital Asset Pricing Model
Refer to Appendix-O: Beta Analysis for more details.
Appendix U: Financial Forecast of Working Loans
Month Month Beginning Balance
Semiannual Payment
Principal Interest Ending Balance
1 June BD 33,500,000 BD 4,176,638 BD 2,761,263 BD 1,415,375 BD 30,738,737
2 December BD 30,738,737 BD 4,176,638 BD 2,877,927 BD 1,409,927 BD 27,860,810
3 June BD 27,860,810 BD 4,176,638 BD 2,999,519 BD 1,404,248 BD 24,861,290
4 December BD 24,861,290 BD 4,176,638 BD 3,126,249 BD 1,398,330 BD 21,735,042
5 June BD 21,735,042 BD 4,176,638 BD 3,258,333 BD 1,392,162 BD 18,476,709
6 December BD 18,476,709 BD 4,176,638 BD 3,395,998 BD 1,385,733 BD 15,080,711
7 June BD 15,080,711 BD 4,176,638 BD 3,539,478 BD 1,379,032 BD 11,541,233
8 December BD 11,541,233 BD 4,176,638 BD 3,689,021 BD 1,372,049 BD 7,852,211
9 June BD 7,852,211 BD 4,176,638 BD 3,844,883 BD 1,364,770 BD 4,007,329
10 December BD 4,007,329 BD 4,176,638 BD 4,007,329 BD 1,357,184 BD 0
Risk-free Rate 4.66%
Equity Risk Premium 5.0%
Beta 1
Cost of equity 10.9%
Source: Team Estimates
Source: Team Estimates
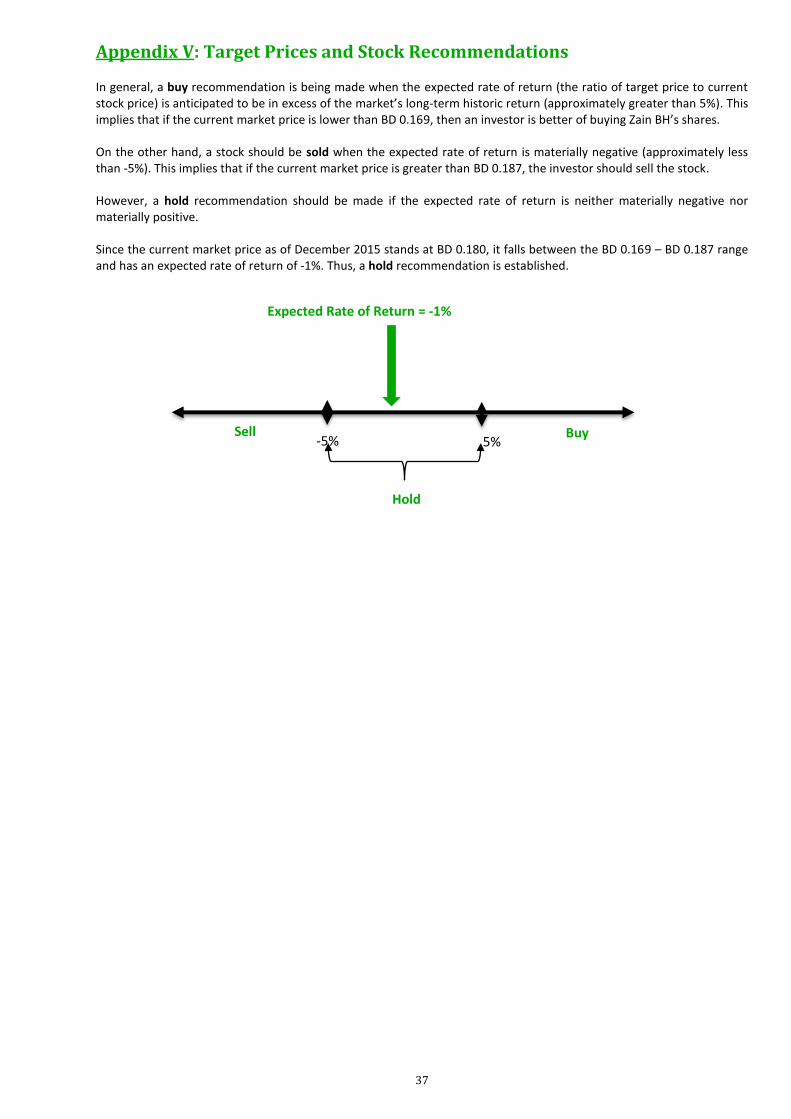
37
Appendix V: Target Prices and Stock Recommendations
In general, a buy recommendation is being made when the expected rate of return (the ratio of target price to current stock price) is anticipated to be in excess of the market’s long-term historic return (approximately greater than 5%). This implies that if the current market price is lower than BD 0.169, then an investor is better of buying Zain BH’s shares. On the other hand, a stock should be sold when the expected rate of return is materially negative (approximately less than -5%). This implies that if the current market price is greater than BD 0.187, the investor should sell the stock. However, a hold recommendation should be made if the expected rate of return is neither materially negative nor materially positive. Since the current market price as of December 2015 stands at BD 0.180, it falls between the BD 0.169 – BD 0.187 range and has an expected rate of return of -1%. Thus, a hold recommendation is established.
-5% 5%
Hold
Sell Buy
Expected Rate of Return = -1%
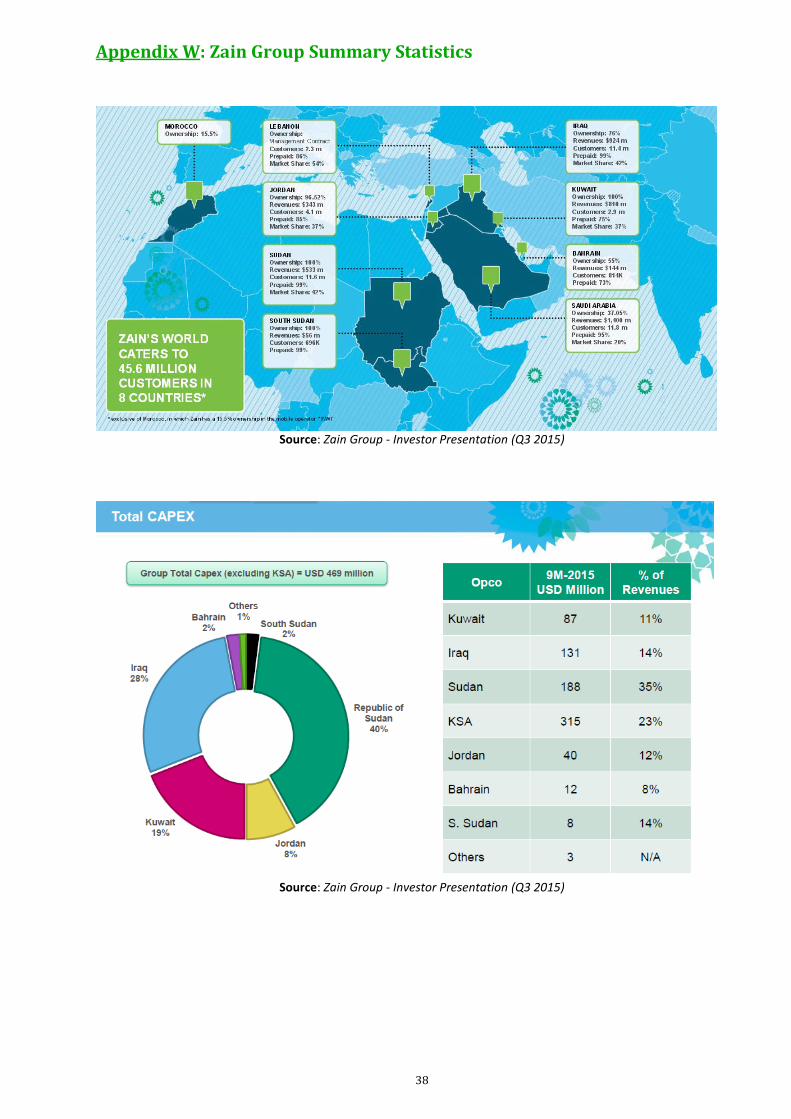
38
Appendix W: Zain Group Summary Statistics
Source: Zain Group - Investor Presentation (Q3 2015)
Source: Zain Group - Investor Presentation (Q3 2015)

39
Source: Zain Group - Investor Presentation (Q3 2015)
Source: Zain Group - Investor Presentation (Q3 2015)

40
Source: Zain Group - Investor Presentation (Q3 2015)
41
Disclosures:
Ownership and material conflicts of interest: The author(s), or a member of their household, of this report does not hold a financial interest in the securities of this company.
The author(s), or a member of their household, of this report does not know of the existence of any conflicts of interest that might bias the
content or publication of this report.
Receipt of compensation: Compensation of the author(s) of this report is not based on investment banking revenue.
Position as an officer or director: The author(s), or a member of their household, does not serve as an officer, director or advisory board member of the subject company.
Market making: The author(s) does not act as a market maker in the subject company’s securities.
Disclaimer: The information set forth herein has been obtained or derived from sources generally available to the public and believed by the author(s)
to be reliable, but the author(s) does not make any representation or warranty, express or implied, as to its accuracy or completeness. The
information is not intended to be used as the basis of any investment decisions by any person or entity. This information does not
constitute investment advice, nor is it an offer or a solicitation of an offer to buy or sell any security. This report should not be considered
to be a recommendation by any individual affiliated with CFA Society Bahrain, CFA Institute or the CFA Institute Research Challenge with
regard to this company’s stock.
CFA Institute Research Challenge