Embed Size (px)
Citation preview
CFA Institute Research Challenge
Hosted by
CFA Society of Minnesota University of Minnesota Duluth Team #2
The CFA Institute Research Challenge is a global competition that tests the equity research and valuation, investment report writing, and presentation skills of university students. The following report was submitted by a team of university students as part of this annual educational initiative and should not be considered a
professional report.
This report is published for educational purposes only 1
Date: 1/18/19
Ticker- NASDAQ: TECH
Sector: Healthcare
Industry: Life Sciences Tools
& Services
University of Minnesota Duluth Student Research January 18, 2019
University of Minnesota Duluth Student Research
Current Price: $161.95 (1/17/19)
Recommendation: SELL
Target Price: $120
Downside: -25%
Highlights
Recommendation
We initiate a Sell recommendation on Bio-Techne (“TECH”, “the Company”, “the Business”, or “the Firm”)
based on a one-year target price of $120 (Figure 2), implying a 25% over-valuation from current price levels.
Our sell recommendation is supported by the following catalysts:
Bio-Techne’s Heavy Reliance on a Growth by Acquisition Strategy Leads to Large Transactions with an
Extended Timeline Prior to Accretion towards TECH’s Business. Correspondingly, TECH’s Increasing
Debt Leverage Makes This Strategy Execution Increasingly More Difficult.
Bio-Techne’s heavy reliance on the ability to strategically acquire businesses that synchronize with the Firm’s
current product mix and supplements sales growth and margin expansion (Appendix XVI). We believe that the
acquisition strategy is strong, but the Company will not realize the harmonies of acquired targets in a timely
fashion. We believe investors have over-priced the synergies these acquisitions are set to create in the future,
and see little evidence of results added to the bottom line of the financials to the extent expected. Through our
financial analysis of the company, we believe the expected results of the acquisitions are not being transposed
to the company’s financial results, and will take several years to materially impact, versus the one-to-two year
timeline conveyed by management’s discussion regarding acquisitions. To note, Bio-Techne’s debt used to
fund its acquisitions is tied to a variable interest rate. Federal Reserve Chairman Jerome Powell plans the
continuation of interest rate hikes into 2019, which in turn will impair Tech’s ability to continue this growth
by acquisition strategy at the same pace we have seen in prior years.
Increasing Competition Amongst the Company’s High-Growth Product Pipeline Will Yield Lower
Growth in the Firm’s Financials Subsidized by Bio-Techne’s Inability to bring Premier Products to
Large Key-Growth Geographical Regions Due to Intellectual Property Risk.
Management expressed that the two most significant growth factors influencing Bio-Techne in the future will
be its innovative products, such as liquid biopsy, augmented by the Company’s strategy to grow in
expansionary regions including China, India, and Eastern Asia. Increased intellectual property theft in these
regions has resulted in TECH’s decision to keep Premier Products in safer markets, this is paired with
increased competition in TECH’s high growth potential products. These factors among the other catalysts will
substantially affect the company’s ability to continue to increase sales and maintain a strong bottom line.
Bio-Techne’s Inability to Consistently Attract, Manufacture, and Fulfill Customer OEM Orders
Dismisses the Ability to Continue Long-Term Revenue and Earnings Growth.
Management has attempted to subside the inconsistencies of the OEM revenue line which makes up 23% of
TECH’s revenue. The inability to accurately predict future orders paired with a lack-luster supply chain,
affects financial performance and long-term growth possibilities for Bio-Techne. Management has stressed the
possibility of an increase in OEM’s effect on revenue, yet has missed guidance in this segment in both FY2017
and FY2018, leading to our belief of instabilities existing in this segment of TECH’s business. The issues the
company has had with this revenue segment has been hidden by acquisitions to offset these consistent revenue
misses. Supply chain issues that we believe affect this segment may also spill into other segments of the
business which would result in the inability to meet investor expectations.
$-
$50
$100
$150
$200
$250
January-13 January-14 January-15 January-16 January-17 January-18 January-19 January-20
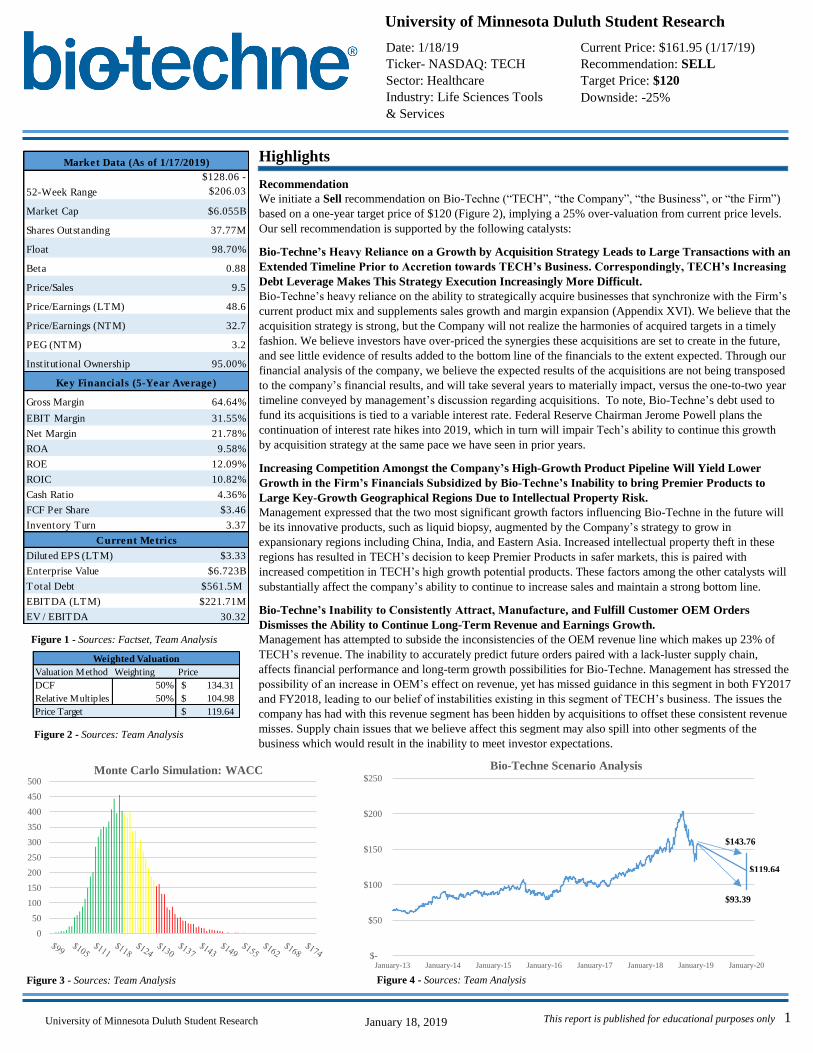
Bio-Techne Scenario Analysis
$143.76
$93.39
0
50
100
150
200
250
300
350
400
450
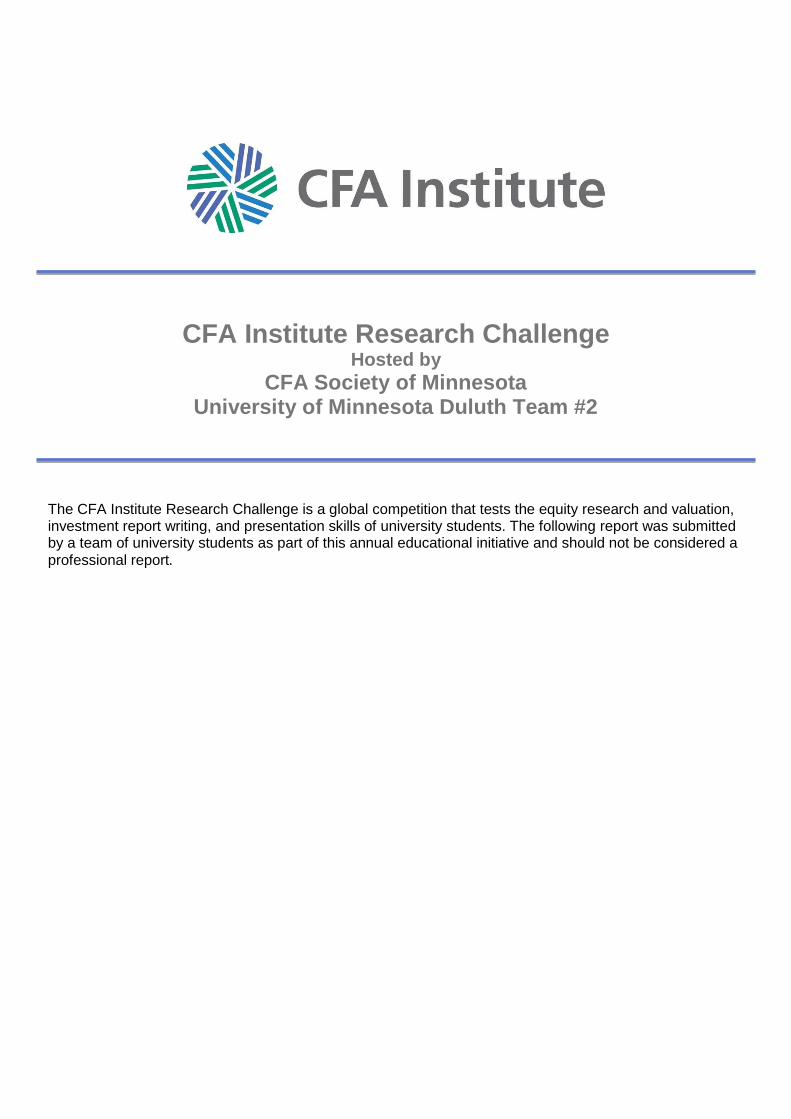
500Monte Carlo Simulation: WACC
Figure 1 - Sources: Factset, Team Analysis
Figure 2 - Sources: Team Analysis
Figure 3 - Sources: Team Analysis Figure 4 - Sources: Team Analysis
Weighted Valuation
Valuation Method Weighting Price
DCF 50% 134.31$
Relative Multiples 50% 104.98$
Price Target 119.64$
$119.64
Market Data (As of 1/17/2019)
52-Week Range
$128.06 -
$206.03
Market Cap $6.055B
Shares Outstanding 37.77M
Float 98.70%
Beta 0.88
Price/Sales 9.5
Price/Earnings (LTM) 48.6
Price/Earnings (NTM) 32.7
PEG (NTM) 3.2
Institutional Ownership 95.00%
Key Financials (5-Year Average)
Gross Margin 64.64%
EBIT Margin 31.55%
Net Margin 21.78%
ROA 9.58%
ROE 12.09%
ROIC 10.82%
Cash Ratio 4.36%
FCF Per Share $3.46
Inventory Turn 3.37
Current Metrics
Diluted EPS (LTM) $3.33
Enterprise Value $6.723B
Total Debt $561.5M
EBITDA (LTM) $221.71M
EV / EBITDA 30.32
This report is published for educational purposes only 2
University of Minnesota Duluth Student Research January 18, 2019
Business Description
Bio-Techne Corporation (NASDAQ: TECH) was originally founded as Techne Corporation in 1976 and
currently operates as a holding company for its Bio-Technology and Clinical Diagnostics brands. TECH is
headquartered in Minneapolis, MN employing 2,100 people worldwide through 35 locations. For the FY18,
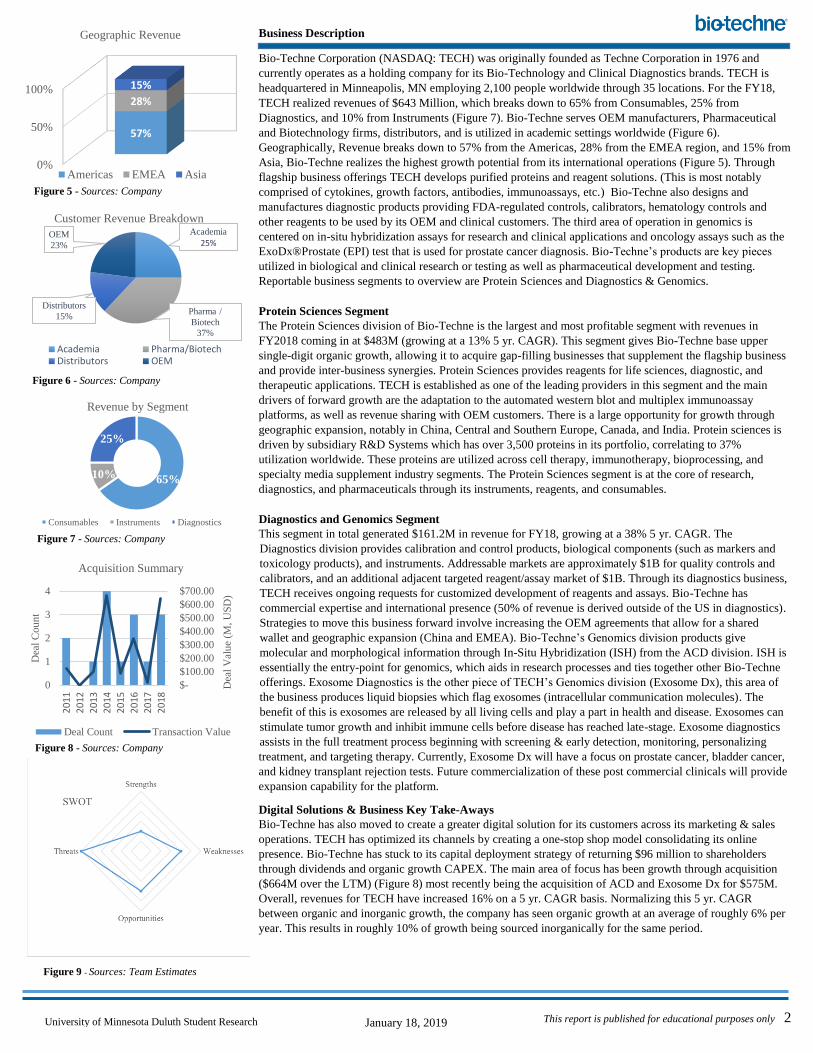
TECH realized revenues of $643 Million, which breaks down to 65% from Consumables, 25% from
Diagnostics, and 10% from Instruments (Figure 7). Bio-Techne serves OEM manufacturers, Pharmaceutical
and Biotechnology firms, distributors, and is utilized in academic settings worldwide (Figure 6).
Geographically, Revenue breaks down to 57% from the Americas, 28% from the EMEA region, and 15% from
Asia, Bio-Techne realizes the highest growth potential from its international operations (Figure 5). Through
flagship business offerings TECH develops purified proteins and reagent solutions. (This is most notably
comprised of cytokines, growth factors, antibodies, immunoassays, etc.) Bio-Techne also designs and
manufactures diagnostic products providing FDA-regulated controls, calibrators, hematology controls and
other reagents to be used by its OEM and clinical customers. The third area of operation in genomics is
centered on in-situ hybridization assays for research and clinical applications and oncology assays such as the
ExoDx®Prostate (EPI) test that is used for prostate cancer diagnosis. Bio-Techne’s products are key pieces
utilized in biological and clinical research or testing as well as pharmaceutical development and testing.
Reportable business segments to overview are Protein Sciences and Diagnostics & Genomics.
Protein Sciences Segment
The Protein Sciences division of Bio-Techne is the largest and most profitable segment with revenues in
FY2018 coming in at $483M (growing at a 13% 5 yr. CAGR). This segment gives Bio-Techne base upper
single-digit organic growth, allowing it to acquire gap-filling businesses that supplement the flagship business
and provide inter-business synergies. Protein Sciences provides reagents for life sciences, diagnostic, and
therapeutic applications. TECH is established as one of the leading providers in this segment and the main
drivers of forward growth are the adaptation to the automated western blot and multiplex immunoassay
platforms, as well as revenue sharing with OEM customers. There is a large opportunity for growth through
geographic expansion, notably in China, Central and Southern Europe, Canada, and India. Protein sciences is
driven by subsidiary R&D Systems which has over 3,500 proteins in its portfolio, correlating to 37%
utilization worldwide. These proteins are utilized across cell therapy, immunotherapy, bioprocessing, and
specialty media supplement industry segments. The Protein Sciences segment is at the core of research,
diagnostics, and pharmaceuticals through its instruments, reagents, and consumables.
Diagnostics and Genomics Segment
This segment in total generated $161.2M in revenue for FY18, growing at a 38% 5 yr. CAGR. The
Diagnostics division provides calibration and control products, biological components (such as markers and
toxicology products), and instruments. Addressable markets are approximately $1B for quality controls and
calibrators, and an additional adjacent targeted reagent/assay market of $1B. Through its diagnostics business,
TECH receives ongoing requests for customized development of reagents and assays. Bio-Techne has
commercial expertise and international presence (50% of revenue is derived outside of the US in diagnostics).
Strategies to move this business forward involve increasing the OEM agreements that allow for a shared
wallet and geographic expansion (China and EMEA). Bio-Techne’s Genomics division products give
molecular and morphological information through In-Situ Hybridization (ISH) from the ACD division. ISH is
essentially the entry-point for genomics, which aids in research processes and ties together other Bio-Techne
offerings. Exosome Diagnostics is the other piece of TECH’s Genomics division (Exosome Dx), this area of
the business produces liquid biopsies which flag exosomes (intracellular communication molecules). The
benefit of this is exosomes are released by all living cells and play a part in health and disease. Exosomes can
stimulate tumor growth and inhibit immune cells before disease has reached late-stage. Exosome diagnostics
assists in the full treatment process beginning with screening & early detection, monitoring, personalizing
treatment, and targeting therapy. Currently, Exosome Dx will have a focus on prostate cancer, bladder cancer,
and kidney transplant rejection tests. Future commercialization of these post commercial clinicals will provide
expansion capability for the platform.
Digital Solutions & Business Key Take-Aways
Bio-Techne has also moved to create a greater digital solution for its customers across its marketing & sales
operations. TECH has optimized its channels by creating a one-stop shop model consolidating its online
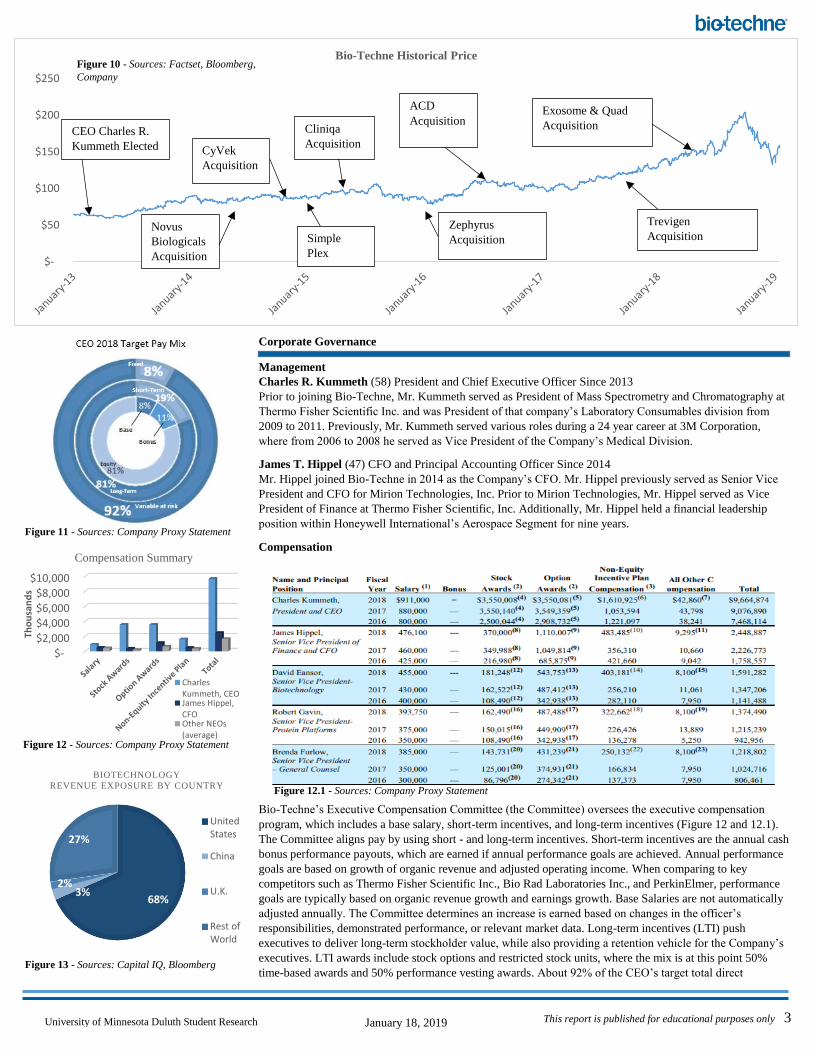
presence. Bio-Techne has stuck to its capital deployment strategy of returning $96 million to shareholders
through dividends and organic growth CAPEX. The main area of focus has been growth through acquisition
($664M over the LTM) (Figure 8) most recently being the acquisition of ACD and Exosome Dx for $575M.
Overall, revenues for TECH have increased 16% on a 5 yr. CAGR basis. Normalizing this 5 yr. CAGR
between organic and inorganic growth, the company has seen organic growth at an average of roughly 6% per
year. This results in roughly 10% of growth being sourced inorganically for the same period.
65%10%
25%
Revenue by Segment
Consumables Instruments Diagnostics
$-
$100.00
$200.00
$300.00
$400.00
$500.00
$600.00
$700.00
0
1
2
3
4
20
11
20
12
20
13
20
14
20
15
20
16
20
17
20
18
Dea
l V
alu
e (M
, U
SD
)
Dea
l C
ou
nt
Acquisition Summary
Deal Count Transaction Value
0%
50%
100%
57%
28%
15%
Geographic Revenue
Americas EMEA Asia
Academia
25%
Pharma /
Biotech
37%
Distributors
15%
OEM
23%
Customer Revenue Breakdown
Academia Pharma/BiotechDistributors OEM
Figure 5 - Sources: Company
Figure 6 - Sources: Company
Figure 9 - Sources: Team Estimates
Figure 8 - Sources: Company
Figure 7 - Sources: Company
This report is published for educational purposes only 3
University of Minnesota Duluth Student Research January 18, 2019
Corporate Governance
Management
Charles R. Kummeth (58) President and Chief Executive Officer Since 2013
Prior to joining Bio-Techne, Mr. Kummeth served as President of Mass Spectrometry and Chromatography at
Thermo Fisher Scientific Inc. and was President of that company’s Laboratory Consumables division from
2009 to 2011. Previously, Mr. Kummeth served various roles during a 24 year career at 3M Corporation,
where from 2006 to 2008 he served as Vice President of the Company’s Medical Division.
James T. Hippel (47) CFO and Principal Accounting Officer Since 2014
Mr. Hippel joined Bio-Techne in 2014 as the Company’s CFO. Mr. Hippel previously served as Senior Vice
President and CFO for Mirion Technologies, Inc. Prior to Mirion Technologies, Mr. Hippel served as Vice
President of Finance at Thermo Fisher Scientific, Inc. Additionally, Mr. Hippel held a financial leadership
position within Honeywell International’s Aerospace Segment for nine years.
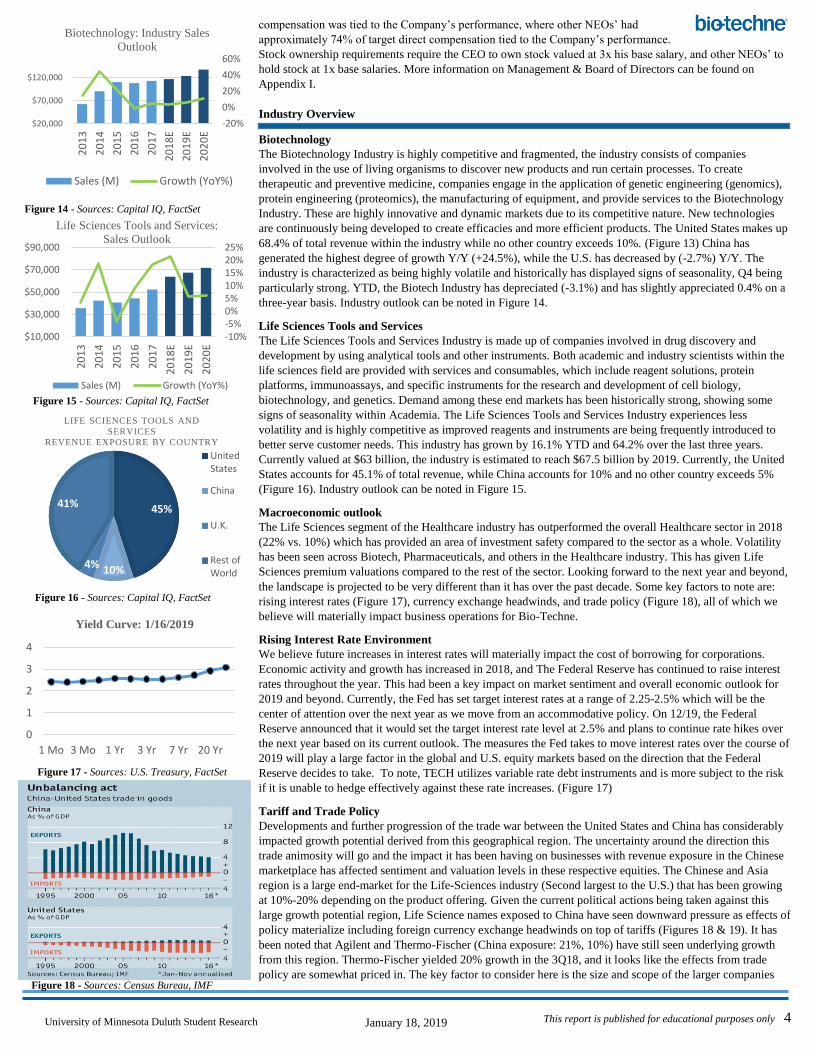
Compensation
Bio-Techne’s Executive Compensation Committee (the Committee) oversees the executive compensation
program, which includes a base salary, short-term incentives, and long-term incentives (Figure 12 and 12.1).
The Committee aligns pay by using short - and long-term incentives. Short-term incentives are the annual cash
bonus performance payouts, which are earned if annual performance goals are achieved. Annual performance
goals are based on growth of organic revenue and adjusted operating income. When comparing to key
competitors such as Thermo Fisher Scientific Inc., Bio Rad Laboratories Inc., and PerkinElmer, performance
goals are typically based on organic revenue growth and earnings growth. Base Salaries are not automatically
adjusted annually. The Committee determines an increase is earned based on changes in the officer’s
responsibilities, demonstrated performance, or relevant market data. Long-term incentives (LTI) push
executives to deliver long-term stockholder value, while also providing a retention vehicle for the Company’s
executives. LTI awards include stock options and restricted stock units, where the mix is at this point 50%
time-based awards and 50% performance vesting awards. About 92% of the CEO’s target total direct
$-
$50
$100
$150
$200
$250
Bio-Techne Historical Price
$-
$2,000
$4,000
$6,000
$8,000
$10,000
Thousands
Compensation Summary
CharlesKummeth, CEOJames Hippel,CFOOther NEOs(average)
ACD
Acquisition CEO Charles R.
Kummeth Elected
Simple
Plex
Launch
Zephyrus
Acquisition Novus
Biologicals
Acquisition
CyVek
Acquisition
Cliniqa
Acquisition
Trevigen
Acquisition
Exosome & Quad
Acquisition
68%3%
2%
27%
BIOTECHNOLOGY
REVENUE EXPOSURE BY COUNTRY
UnitedStates
China
U.K.
Rest ofWorld
Figure 10 - Sources: Factset, Bloomberg,
Company
Figure 11 - Sources: Company Proxy Statement
Figure 13 - Sources: Capital IQ, Bloomberg
Figure 12 - Sources: Company Proxy Statement
Figure 12.1 - Sources: Company Proxy Statement
This report is published for educational purposes only 4
University of Minnesota Duluth Student Research January 18, 2019
compensation was tied to the Company’s performance, where other NEOs’ had
approximately 74% of target direct compensation tied to the Company’s performance.
Stock ownership requirements require the CEO to own stock valued at 3x his base salary, and other NEOs’ to
hold stock at 1x base salaries. More information on Management & Board of Directors can be found on
Appendix I.
Industry Overview
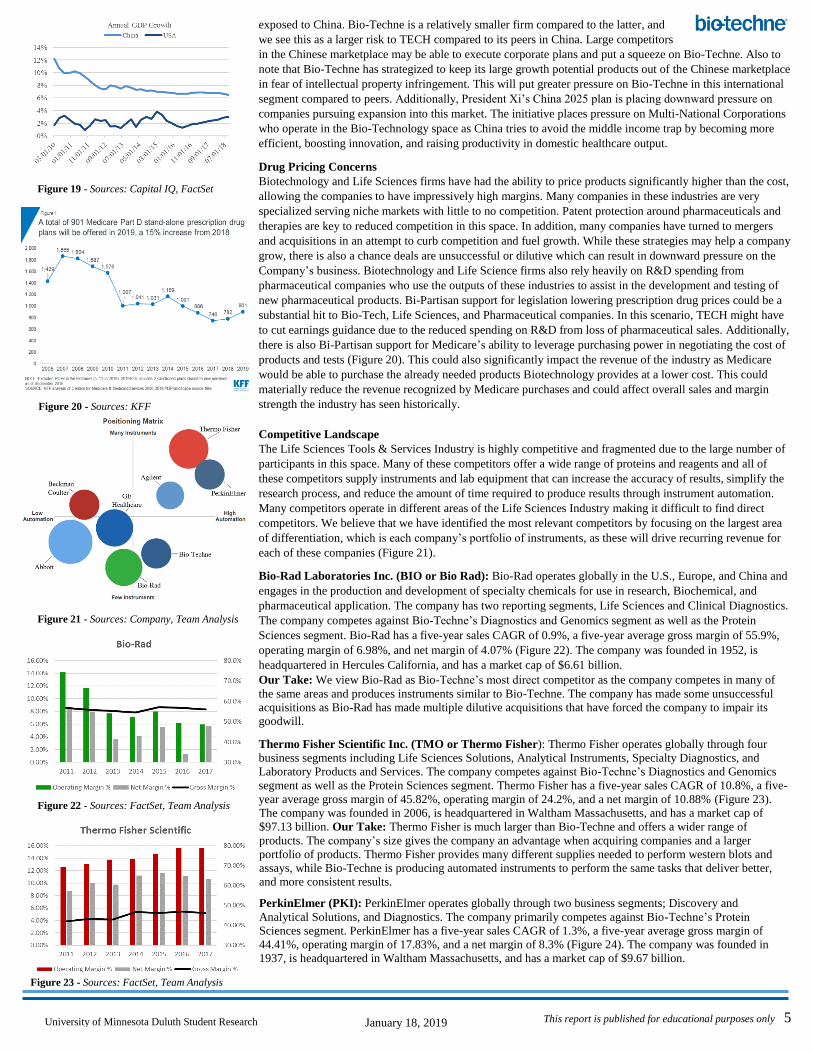
Biotechnology
The Biotechnology Industry is highly competitive and fragmented, the industry consists of companies
involved in the use of living organisms to discover new products and run certain processes. To create
therapeutic and preventive medicine, companies engage in the application of genetic engineering (genomics),
protein engineering (proteomics), the manufacturing of equipment, and provide services to the Biotechnology
Industry. These are highly innovative and dynamic markets due to its competitive nature. New technologies
are continuously being developed to create efficacies and more efficient products. The United States makes up
68.4% of total revenue within the industry while no other country exceeds 10%. (Figure 13) China has
generated the highest degree of growth Y/Y (+24.5%), while the U.S. has decreased by (-2.7%) Y/Y. The
industry is characterized as being highly volatile and historically has displayed signs of seasonality, Q4 being
particularly strong. YTD, the Biotech Industry has depreciated (-3.1%) and has slightly appreciated 0.4% on a
three-year basis. Industry outlook can be noted in Figure 14.
Life Sciences Tools and Services
The Life Sciences Tools and Services Industry is made up of companies involved in drug discovery and
development by using analytical tools and other instruments. Both academic and industry scientists within the
life sciences field are provided with services and consumables, which include reagent solutions, protein
platforms, immunoassays, and specific instruments for the research and development of cell biology,
biotechnology, and genetics. Demand among these end markets has been historically strong, showing some
signs of seasonality within Academia. The Life Sciences Tools and Services Industry experiences less
volatility and is highly competitive as improved reagents and instruments are being frequently introduced to
better serve customer needs. This industry has grown by 16.1% YTD and 64.2% over the last three years.
Currently valued at $63 billion, the industry is estimated to reach $67.5 billion by 2019. Currently, the United
States accounts for 45.1% of total revenue, while China accounts for 10% and no other country exceeds 5%
(Figure 16). Industry outlook can be noted in Figure 15.
Macroeconomic outlook
The Life Sciences segment of the Healthcare industry has outperformed the overall Healthcare sector in 2018
(22% vs. 10%) which has provided an area of investment safety compared to the sector as a whole. Volatility
has been seen across Biotech, Pharmaceuticals, and others in the Healthcare industry. This has given Life
Sciences premium valuations compared to the rest of the sector. Looking forward to the next year and beyond,
the landscape is projected to be very different than it has over the past decade. Some key factors to note are:
rising interest rates (Figure 17), currency exchange headwinds, and trade policy (Figure 18), all of which we
believe will materially impact business operations for Bio-Techne.
Rising Interest Rate Environment
We believe future increases in interest rates will materially impact the cost of borrowing for corporations.
Economic activity and growth has increased in 2018, and The Federal Reserve has continued to raise interest
rates throughout the year. This had been a key impact on market sentiment and overall economic outlook for
2019 and beyond. Currently, the Fed has set target interest rates at a range of 2.25-2.5% which will be the
center of attention over the next year as we move from an accommodative policy. On 12/19, the Federal
Reserve announced that it would set the target interest rate level at 2.5% and plans to continue rate hikes over
the next year based on its current outlook. The measures the Fed takes to move interest rates over the course of
2019 will play a large factor in the global and U.S. equity markets based on the direction that the Federal
Reserve decides to take. To note, TECH utilizes variable rate debt instruments and is more subject to the risk
if it is unable to hedge effectively against these rate increases. (Figure 17)
Tariff and Trade Policy
Developments and further progression of the trade war between the United States and China has considerably
impacted growth potential derived from this geographical region. The uncertainty around the direction this
trade animosity will go and the impact it has been having on businesses with revenue exposure in the Chinese
marketplace has affected sentiment and valuation levels in these respective equities. The Chinese and Asia
region is a large end-market for the Life-Sciences industry (Second largest to the U.S.) that has been growing
at 10%-20% depending on the product offering. Given the current political actions being taken against this
large growth potential region, Life Science names exposed to China have seen downward pressure as effects of
policy materialize including foreign currency exchange headwinds on top of tariffs (Figures 18 & 19). It has
been noted that Agilent and Thermo-Fischer (China exposure: 21%, 10%) have still seen underlying growth
from this region. Thermo-Fischer yielded 20% growth in the 3Q18, and it looks like the effects from trade
policy are somewhat priced in. The key factor to consider here is the size and scope of the larger companies
-10%-5%0%5%10%15%20%25%
$10,000
$30,000
$50,000
$70,000
$90,000
20
13
20
14
20
15
20
16
20
17
20
18
E
20
19
E
20
20
E
Life Sciences Tools and Services:
Sales Outlook
Sales (M) Growth (YoY%)
-20%
0%
20%
40%
60%
$20,000
$70,000
$120,0002
01
3
20
14
20
15
20
16
20
17
20
18
E
20
19
E
20
20
E
Biotechnology: Industry Sales
Outlook
Sales (M) Growth (YoY%)
45%
10%4%
41%
LIFE SCIENCES TOOLS AND
SERVICES
REVENUE EXPOSURE BY COUNTRY
UnitedStates
China
U.K.
Rest ofWorld
0
1
2
3
4
1 Mo 3 Mo 1 Yr 3 Yr 7 Yr 20 Yr
Yield Curve: 1/16/2019
Figure 14 - Sources: Capital IQ, FactSet
Figure 15 - Sources: Capital IQ, FactSet
Figure 16 - Sources: Capital IQ, FactSet
Figure 18 - Sources: Census Bureau, IMF
Figure 17 - Sources: U.S. Treasury, FactSet
This report is published for educational purposes only 5
University of Minnesota Duluth Student Research January 18, 2019
exposed to China. Bio-Techne is a relatively smaller firm compared to the latter, and
we see this as a larger risk to TECH compared to its peers in China. Large competitors
in the Chinese marketplace may be able to execute corporate plans and put a squeeze on Bio-Techne. Also to
note that Bio-Techne has strategized to keep its large growth potential products out of the Chinese marketplace
in fear of intellectual property infringement. This will put greater pressure on Bio-Techne in this international
segment compared to peers. Additionally, President Xi’s China 2025 plan is placing downward pressure on
companies pursuing expansion into this market. The initiative places pressure on Multi-National Corporations
who operate in the Bio-Technology space as China tries to avoid the middle income trap by becoming more
efficient, boosting innovation, and raising productivity in domestic healthcare output.
Drug Pricing Concerns
Biotechnology and Life Sciences firms have had the ability to price products significantly higher than the cost,
allowing the companies to have impressively high margins. Many companies in these industries are very
specialized serving niche markets with little to no competition. Patent protection around pharmaceuticals and
therapies are key to reduced competition in this space. In addition, many companies have turned to mergers
and acquisitions in an attempt to curb competition and fuel growth. While these strategies may help a company
grow, there is also a chance deals are unsuccessful or dilutive which can result in downward pressure on the
Company’s business. Biotechnology and Life Science firms also rely heavily on R&D spending from
pharmaceutical companies who use the outputs of these industries to assist in the development and testing of
new pharmaceutical products. Bi-Partisan support for legislation lowering prescription drug prices could be a
substantial hit to Bio-Tech, Life Sciences, and Pharmaceutical companies. In this scenario, TECH might have
to cut earnings guidance due to the reduced spending on R&D from loss of pharmaceutical sales. Additionally,
there is also Bi-Partisan support for Medicare’s ability to leverage purchasing power in negotiating the cost of
products and tests (Figure 20). This could also significantly impact the revenue of the industry as Medicare
would be able to purchase the already needed products Biotechnology provides at a lower cost. This could
materially reduce the revenue recognized by Medicare purchases and could affect overall sales and margin
strength the industry has seen historically.
Competitive Landscape
The Life Sciences Tools & Services Industry is highly competitive and fragmented due to the large number of
participants in this space. Many of these competitors offer a wide range of proteins and reagents and all of
these competitors supply instruments and lab equipment that can increase the accuracy of results, simplify the
research process, and reduce the amount of time required to produce results through instrument automation.
Many competitors operate in different areas of the Life Sciences Industry making it difficult to find direct
competitors. We believe that we have identified the most relevant competitors by focusing on the largest area
of differentiation, which is each company’s portfolio of instruments, as these will drive recurring revenue for
each of these companies (Figure 21).
Bio-Rad Laboratories Inc. (BIO or Bio Rad): Bio-Rad operates globally in the U.S., Europe, and China and
engages in the production and development of specialty chemicals for use in research, Biochemical, and
pharmaceutical application. The company has two reporting segments, Life Sciences and Clinical Diagnostics.
The company competes against Bio-Techne’s Diagnostics and Genomics segment as well as the Protein
Sciences segment. Bio-Rad has a five-year sales CAGR of 0.9%, a five-year average gross margin of 55.9%,
operating margin of 6.98%, and net margin of 4.07% (Figure 22). The company was founded in 1952, is
headquartered in Hercules California, and has a market cap of $6.61 billion.
Our Take: We view Bio-Rad as Bio-Techne’s most direct competitor as the company competes in many of
the same areas and produces instruments similar to Bio-Techne. The company has made some unsuccessful
acquisitions as Bio-Rad has made multiple dilutive acquisitions that have forced the company to impair its
goodwill.
Thermo Fisher Scientific Inc. (TMO or Thermo Fisher): Thermo Fisher operates globally through four
business segments including Life Sciences Solutions, Analytical Instruments, Specialty Diagnostics, and
Laboratory Products and Services. The company competes against Bio-Techne’s Diagnostics and Genomics
segment as well as the Protein Sciences segment. Thermo Fisher has a five-year sales CAGR of 10.8%, a five-
year average gross margin of 45.82%, operating margin of 24.2%, and a net margin of 10.88% (Figure 23).
The company was founded in 2006, is headquartered in Waltham Massachusetts, and has a market cap of
$97.13 billion. Our Take: Thermo Fisher is much larger than Bio-Techne and offers a wider range of
products. The company’s size gives the company an advantage when acquiring companies and a larger
portfolio of products. Thermo Fisher provides many different supplies needed to perform western blots and
assays, while Bio-Techne is producing automated instruments to perform the same tasks that deliver better,
and more consistent results.
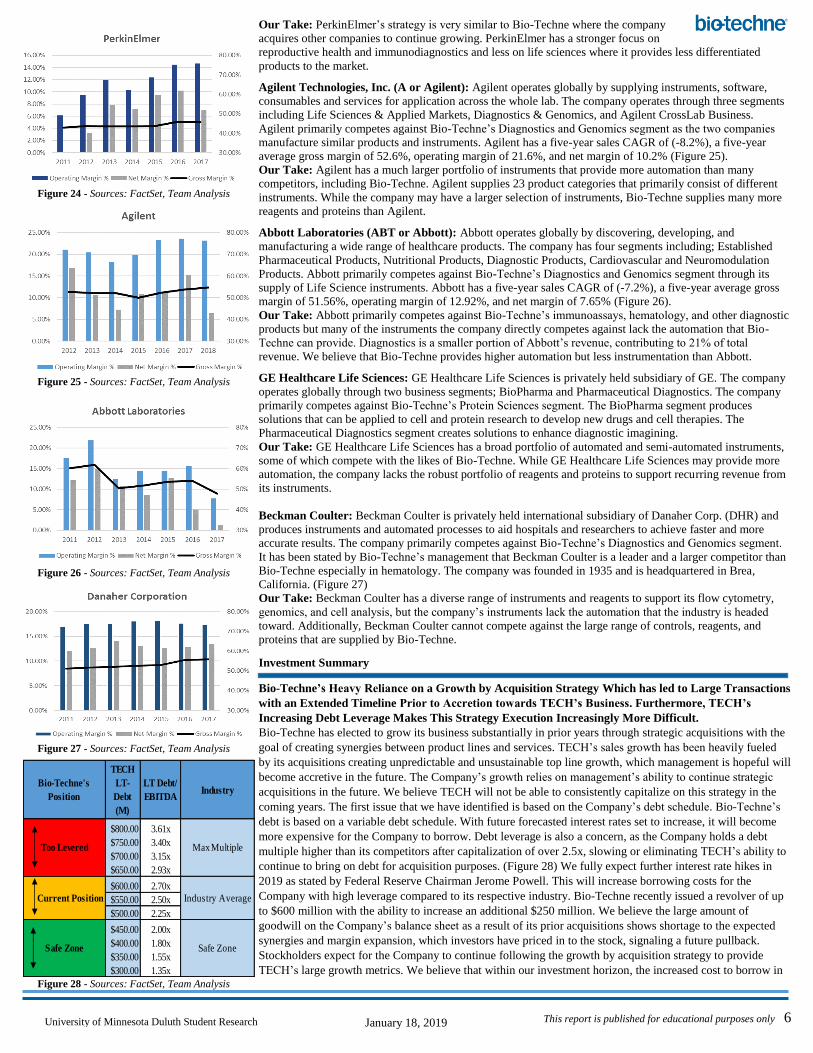
PerkinElmer (PKI): PerkinElmer operates globally through two business segments; Discovery and
Analytical Solutions, and Diagnostics. The company primarily competes against Bio-Techne’s Protein
Sciences segment. PerkinElmer has a five-year sales CAGR of 1.3%, a five-year average gross margin of
44.41%, operating margin of 17.83%, and a net margin of 8.3% (Figure 24). The company was founded in
1937, is headquartered in Waltham Massachusetts, and has a market cap of $9.67 billion.
Figure 20 - Sources: KFF
Figure 19 - Sources: Capital IQ, FactSet
Figure 21 - Sources: Company, Team Analysis
Figure 22 - Sources: FactSet, Team Analysis
Figure 23 - Sources: FactSet, Team Analysis
This report is published for educational purposes only 6
University of Minnesota Duluth Student Research January 18, 2019
Our Take: PerkinElmer’s strategy is very similar to Bio-Techne where the company
acquires other companies to continue growing. PerkinElmer has a stronger focus on
reproductive health and immunodiagnostics and less on life sciences where it provides less differentiated
products to the market.
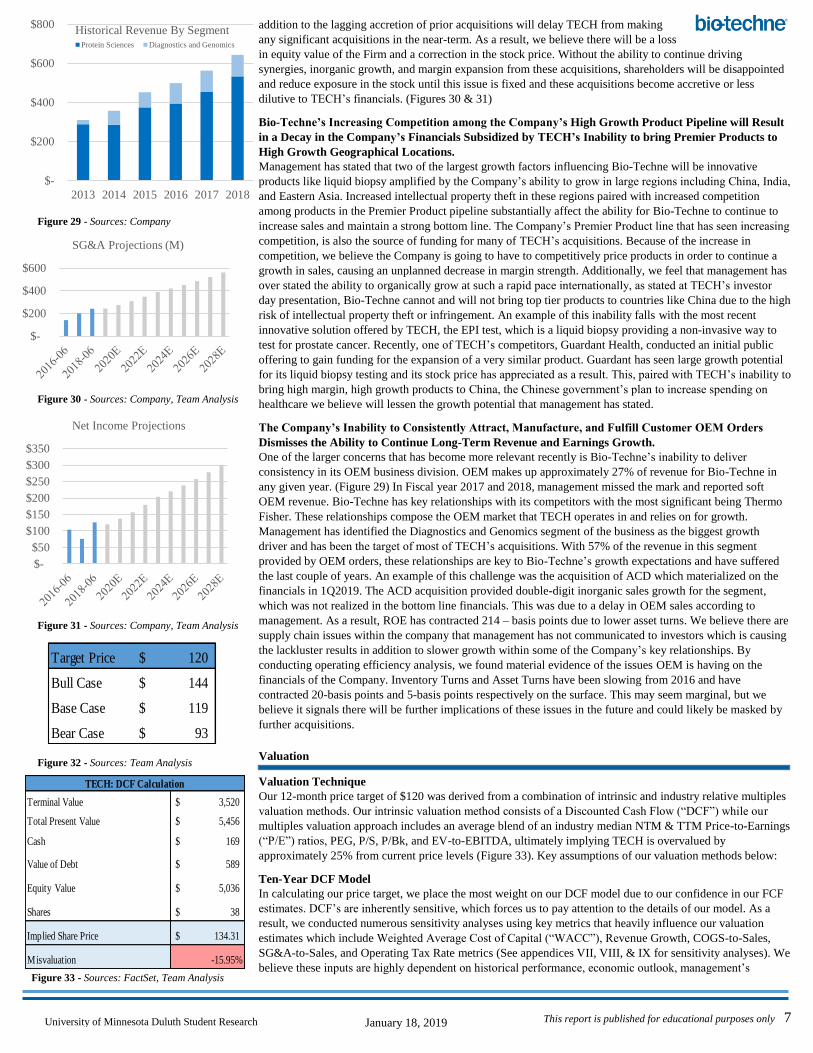
Agilent Technologies, Inc. (A or Agilent): Agilent operates globally by supplying instruments, software,
consumables and services for application across the whole lab. The company operates through three segments
including Life Sciences & Applied Markets, Diagnostics & Genomics, and Agilent CrossLab Business.
Agilent primarily competes against Bio-Techne’s Diagnostics and Genomics segment as the two companies
manufacture similar products and instruments. Agilent has a five-year sales CAGR of (-8.2%), a five-year
average gross margin of 52.6%, operating margin of 21.6%, and net margin of 10.2% (Figure 25).
Our Take: Agilent has a much larger portfolio of instruments that provide more automation than many
competitors, including Bio-Techne. Agilent supplies 23 product categories that primarily consist of different
instruments. While the company may have a larger selection of instruments, Bio-Techne supplies many more
reagents and proteins than Agilent.
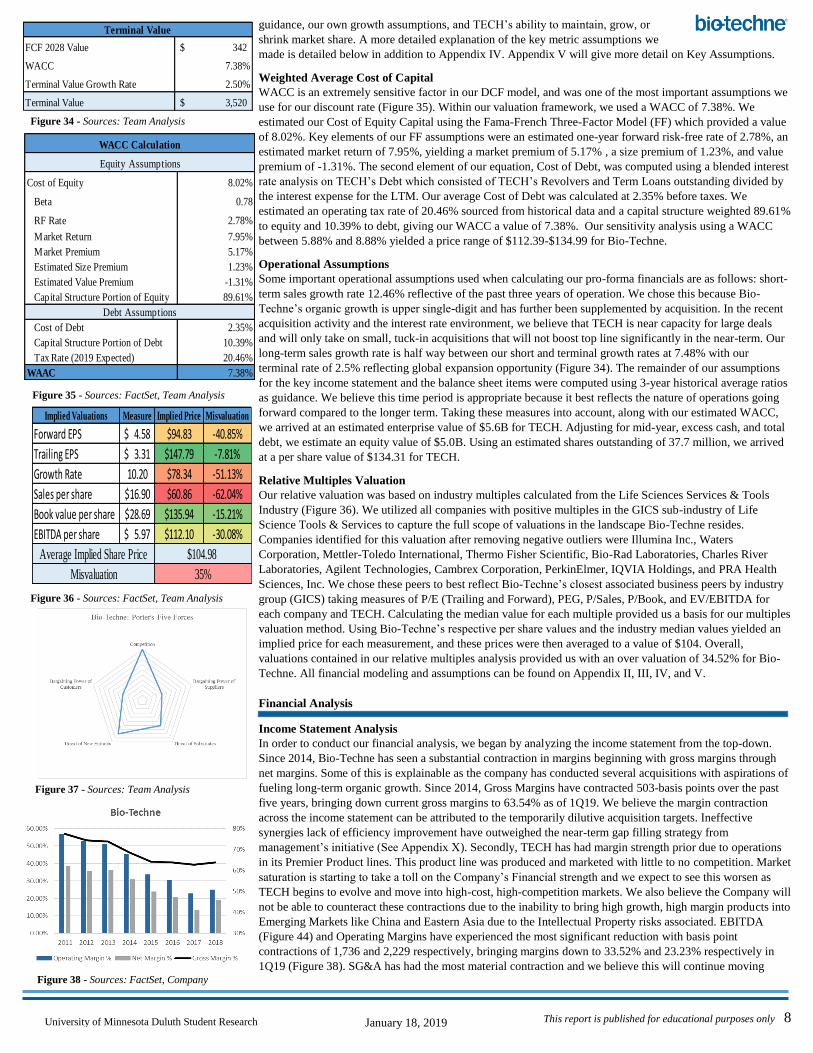
Abbott Laboratories (ABT or Abbott): Abbott operates globally by discovering, developing, and
manufacturing a wide range of healthcare products. The company has four segments including; Established
Pharmaceutical Products, Nutritional Products, Diagnostic Products, Cardiovascular and Neuromodulation
Products. Abbott primarily competes against Bio-Techne’s Diagnostics and Genomics segment through its
supply of Life Science instruments. Abbott has a five-year sales CAGR of (-7.2%), a five-year average gross
margin of 51.56%, operating margin of 12.92%, and net margin of 7.65% (Figure 26).
Our Take: Abbott primarily competes against Bio-Techne’s immunoassays, hematology, and other diagnostic
products but many of the instruments the company directly competes against lack the automation that Bio-
Techne can provide. Diagnostics is a smaller portion of Abbott’s revenue, contributing to 21% of total
revenue. We believe that Bio-Techne provides higher automation but less instrumentation than Abbott.
GE Healthcare Life Sciences: GE Healthcare Life Sciences is privately held subsidiary of GE. The company
operates globally through two business segments; BioPharma and Pharmaceutical Diagnostics. The company
primarily competes against Bio-Techne’s Protein Sciences segment. The BioPharma segment produces
solutions that can be applied to cell and protein research to develop new drugs and cell therapies. The
Pharmaceutical Diagnostics segment creates solutions to enhance diagnostic imagining.
Our Take: GE Healthcare Life Sciences has a broad portfolio of automated and semi-automated instruments,
some of which compete with the likes of Bio-Techne. While GE Healthcare Life Sciences may provide more
automation, the company lacks the robust portfolio of reagents and proteins to support recurring revenue from
its instruments.
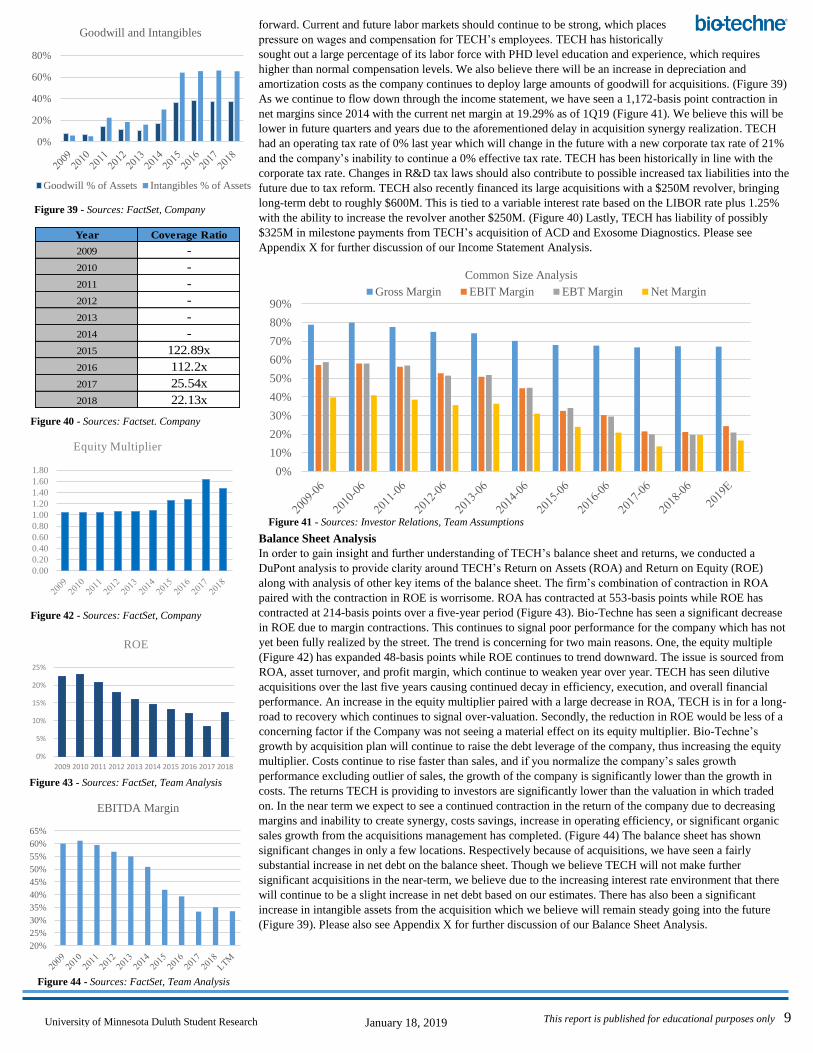
Beckman Coulter: Beckman Coulter is privately held international subsidiary of Danaher Corp. (DHR) and
produces instruments and automated processes to aid hospitals and researchers to achieve faster and more
accurate results. The company primarily competes against Bio-Techne’s Diagnostics and Genomics segment.
It has been stated by Bio-Techne’s management that Beckman Coulter is a leader and a larger competitor than
Bio-Techne especially in hematology. The company was founded in 1935 and is headquartered in Brea,
California. (Figure 27)
Our Take: Beckman Coulter has a diverse range of instruments and reagents to support its flow cytometry,
genomics, and cell analysis, but the company’s instruments lack the automation that the industry is headed
toward. Additionally, Beckman Coulter cannot compete against the large range of controls, reagents, and
proteins that are supplied by Bio-Techne.
Investment Summary
Bio-Techne’s Heavy Reliance on a Growth by Acquisition Strategy Which has led to Large Transactions
with an Extended Timeline Prior to Accretion towards TECH’s Business. Furthermore, TECH’s
Increasing Debt Leverage Makes This Strategy Execution Increasingly More Difficult.
Bio-Techne has elected to grow its business substantially in prior years through strategic acquisitions with the
goal of creating synergies between product lines and services. TECH’s sales growth has been heavily fueled
by its acquisitions creating unpredictable and unsustainable top line growth, which management is hopeful will
become accretive in the future. The Company’s growth relies on management’s ability to continue strategic
acquisitions in the future. We believe TECH will not be able to consistently capitalize on this strategy in the
coming years. The first issue that we have identified is based on the Company’s debt schedule. Bio-Techne’s
debt is based on a variable debt schedule. With future forecasted interest rates set to increase, it will become
more expensive for the Company to borrow. Debt leverage is also a concern, as the Company holds a debt
multiple higher than its competitors after capitalization of over 2.5x, slowing or eliminating TECH’s ability to
continue to bring on debt for acquisition purposes. (Figure 28) We fully expect further interest rate hikes in
2019 as stated by Federal Reserve Chairman Jerome Powell. This will increase borrowing costs for the
Company with high leverage compared to its respective industry. Bio-Techne recently issued a revolver of up
to $600 million with the ability to increase an additional $250 million. We believe the large amount of
goodwill on the Company’s balance sheet as a result of its prior acquisitions shows shortage to the expected
synergies and margin expansion, which investors have priced in to the stock, signaling a future pullback.
Stockholders expect for the Company to continue following the growth by acquisition strategy to provide
TECH’s large growth metrics. We believe that within our investment horizon, the increased cost to borrow in
Bio-Techne's
Position
TECH
LT-
Debt
(M)
LT Debt/
EBITDAIndustry
$800.00 3.61x
$750.00 3.40x
$700.00 3.15x
$650.00 2.93x
$600.00 2.70x
$550.00 2.50x
$500.00 2.25x
$450.00 2.00x
$400.00 1.80x
$350.00 1.55x
$300.00 1.35x
Too Levered
Current Position
Safe Zone Safe Zone
Industry Average
Max Multiple
Figure 24 - Sources: FactSet, Team Analysis
Figure 25 - Sources: FactSet, Team Analysis
Figure 26 - Sources: FactSet, Team Analysis
Figure 27 - Sources: FactSet, Team Analysis
Figure 28 - Sources: FactSet, Team Analysis
This report is published for educational purposes only 7
University of Minnesota Duluth Student Research January 18, 2019
addition to the lagging accretion of prior acquisitions will delay TECH from making
any significant acquisitions in the near-term. As a result, we believe there will be a loss
in equity value of the Firm and a correction in the stock price. Without the ability to continue driving
synergies, inorganic growth, and margin expansion from these acquisitions, shareholders will be disappointed
and reduce exposure in the stock until this issue is fixed and these acquisitions become accretive or less
dilutive to TECH’s financials. (Figures 30 & 31)
Bio-Techne’s Increasing Competition among the Company’s High Growth Product Pipeline will Result
in a Decay in the Company’s Financials Subsidized by TECH’s Inability to bring Premier Products to
High Growth Geographical Locations.
Management has stated that two of the largest growth factors influencing Bio-Techne will be innovative
products like liquid biopsy amplified by the Company’s ability to grow in large regions including China, India,
and Eastern Asia. Increased intellectual property theft in these regions paired with increased competition
among products in the Premier Product pipeline substantially affect the ability for Bio-Techne to continue to
increase sales and maintain a strong bottom line. The Company’s Premier Product line that has seen increasing
competition, is also the source of funding for many of TECH’s acquisitions. Because of the increase in
competition, we believe the Company is going to have to competitively price products in order to continue a
growth in sales, causing an unplanned decrease in margin strength. Additionally, we feel that management has
over stated the ability to organically grow at such a rapid pace internationally, as stated at TECH’s investor
day presentation, Bio-Techne cannot and will not bring top tier products to countries like China due to the high
risk of intellectual property theft or infringement. An example of this inability falls with the most recent
innovative solution offered by TECH, the EPI test, which is a liquid biopsy providing a non-invasive way to
test for prostate cancer. Recently, one of TECH’s competitors, Guardant Health, conducted an initial public
offering to gain funding for the expansion of a very similar product. Guardant has seen large growth potential
for its liquid biopsy testing and its stock price has appreciated as a result. This, paired with TECH’s inability to
bring high margin, high growth products to China, the Chinese government’s plan to increase spending on
healthcare we believe will lessen the growth potential that management has stated.
The Company’s Inability to Consistently Attract, Manufacture, and Fulfill Customer OEM Orders
Dismisses the Ability to Continue Long-Term Revenue and Earnings Growth.
One of the larger concerns that has become more relevant recently is Bio-Techne’s inability to deliver
consistency in its OEM business division. OEM makes up approximately 27% of revenue for Bio-Techne in
any given year. (Figure 29) In Fiscal year 2017 and 2018, management missed the mark and reported soft
OEM revenue. Bio-Techne has key relationships with its competitors with the most significant being Thermo
Fisher. These relationships compose the OEM market that TECH operates in and relies on for growth.
Management has identified the Diagnostics and Genomics segment of the business as the biggest growth
driver and has been the target of most of TECH’s acquisitions. With 57% of the revenue in this segment
provided by OEM orders, these relationships are key to Bio-Techne’s growth expectations and have suffered
the last couple of years. An example of this challenge was the acquisition of ACD which materialized on the
financials in 1Q2019. The ACD acquisition provided double-digit inorganic sales growth for the segment,
which was not realized in the bottom line financials. This was due to a delay in OEM sales according to
management. As a result, ROE has contracted 214 – basis points due to lower asset turns. We believe there are
supply chain issues within the company that management has not communicated to investors which is causing
the lackluster results in addition to slower growth within some of the Company’s key relationships. By
conducting operating efficiency analysis, we found material evidence of the issues OEM is having on the
financials of the Company. Inventory Turns and Asset Turns have been slowing from 2016 and have
contracted 20-basis points and 5-basis points respectively on the surface. This may seem marginal, but we
believe it signals there will be further implications of these issues in the future and could likely be masked by
further acquisitions.
Valuation
Valuation Technique
Our 12-month price target of $120 was derived from a combination of intrinsic and industry relative multiples
valuation methods. Our intrinsic valuation method consists of a Discounted Cash Flow (“DCF”) while our
multiples valuation approach includes an average blend of an industry median NTM & TTM Price-to-Earnings
(“P/E”) ratios, PEG, P/S, P/Bk, and EV-to-EBITDA, ultimately implying TECH is overvalued by
approximately 25% from current price levels (Figure 33). Key assumptions of our valuation methods below:
Ten-Year DCF Model
In calculating our price target, we place the most weight on our DCF model due to our confidence in our FCF
estimates. DCF’s are inherently sensitive, which forces us to pay attention to the details of our model. As a
result, we conducted numerous sensitivity analyses using key metrics that heavily influence our valuation
estimates which include Weighted Average Cost of Capital (“WACC”), Revenue Growth, COGS-to-Sales,
SG&A-to-Sales, and Operating Tax Rate metrics (See appendices VII, VIII, & IX for sensitivity analyses). We
believe these inputs are highly dependent on historical performance, economic outlook, management’s
$-
$200
$400
$600
SG&A Projections (M)
$-
$50
$100
$150
$200
$250
$300
$350
Net Income Projections
Target Price 120$
Bull Case 144$
Base Case 119$
Bear Case 93$
TECH: DCF Calculation
Terminal Value 3,520$
Total Present Value 5,456$
Cash 169$
Value of Debt 589$
Equity Value 5,036$
Shares 38$
Implied Share Price 134.31$
Misvaluation -15.95%
Figure 29 - Sources: Company
Figure 30 - Sources: Company, Team Analysis
Figure 31 - Sources: Company, Team Analysis
Figure 32 - Sources: Team Analysis
Figure 33 - Sources: FactSet, Team Analysis
$-
$200
$400
$600
$800
2013 2014 2015 2016 2017 2018
Historical Revenue By SegmentProtein Sciences Diagnostics and Genomics
This report is published for educational purposes only 8
University of Minnesota Duluth Student Research January 18, 2019
guidance, our own growth assumptions, and TECH’s ability to maintain, grow, or
shrink market share. A more detailed explanation of the key metric assumptions we
made is detailed below in addition to Appendix IV. Appendix V will give more detail on Key Assumptions.
Weighted Average Cost of Capital
WACC is an extremely sensitive factor in our DCF model, and was one of the most important assumptions we
use for our discount rate (Figure 35). Within our valuation framework, we used a WACC of 7.38%. We
estimated our Cost of Equity Capital using the Fama-French Three-Factor Model (FF) which provided a value
of 8.02%. Key elements of our FF assumptions were an estimated one-year forward risk-free rate of 2.78%, an
estimated market return of 7.95%, yielding a market premium of 5.17% , a size premium of 1.23%, and value
premium of -1.31%. The second element of our equation, Cost of Debt, was computed using a blended interest
rate analysis on TECH’s Debt which consisted of TECH’s Revolvers and Term Loans outstanding divided by
the interest expense for the LTM. Our average Cost of Debt was calculated at 2.35% before taxes. We
estimated an operating tax rate of 20.46% sourced from historical data and a capital structure weighted 89.61%
to equity and 10.39% to debt, giving our WACC a value of 7.38%. Our sensitivity analysis using a WACC
between 5.88% and 8.88% yielded a price range of $112.39-$134.99 for Bio-Techne.
Operational Assumptions
Some important operational assumptions used when calculating our pro-forma financials are as follows: short-
term sales growth rate 12.46% reflective of the past three years of operation. We chose this because Bio-
Techne’s organic growth is upper single-digit and has further been supplemented by acquisition. In the recent
acquisition activity and the interest rate environment, we believe that TECH is near capacity for large deals
and will only take on small, tuck-in acquisitions that will not boost top line significantly in the near-term. Our
long-term sales growth rate is half way between our short and terminal growth rates at 7.48% with our
terminal rate of 2.5% reflecting global expansion opportunity (Figure 34). The remainder of our assumptions
for the key income statement and the balance sheet items were computed using 3-year historical average ratios
as guidance. We believe this time period is appropriate because it best reflects the nature of operations going
forward compared to the longer term. Taking these measures into account, along with our estimated WACC,
we arrived at an estimated enterprise value of $5.6B for TECH. Adjusting for mid-year, excess cash, and total
debt, we estimate an equity value of $5.0B. Using an estimated shares outstanding of 37.7 million, we arrived
at a per share value of $134.31 for TECH.
Relative Multiples Valuation
Our relative valuation was based on industry multiples calculated from the Life Sciences Services & Tools
Industry (Figure 36). We utilized all companies with positive multiples in the GICS sub-industry of Life
Science Tools & Services to capture the full scope of valuations in the landscape Bio-Techne resides.
Companies identified for this valuation after removing negative outliers were Illumina Inc., Waters
Corporation, Mettler-Toledo International, Thermo Fisher Scientific, Bio-Rad Laboratories, Charles River
Laboratories, Agilent Technologies, Cambrex Corporation, PerkinElmer, IQVIA Holdings, and PRA Health
Sciences, Inc. We chose these peers to best reflect Bio-Techne’s closest associated business peers by industry
group (GICS) taking measures of P/E (Trailing and Forward), PEG, P/Sales, P/Book, and EV/EBITDA for
each company and TECH. Calculating the median value for each multiple provided us a basis for our multiples
valuation method. Using Bio-Techne’s respective per share values and the industry median values yielded an
implied price for each measurement, and these prices were then averaged to a value of $104. Overall,
valuations contained in our relative multiples analysis provided us with an over valuation of 34.52% for Bio-
Techne. All financial modeling and assumptions can be found on Appendix II, III, IV, and V.
Financial Analysis
Income Statement Analysis
In order to conduct our financial analysis, we began by analyzing the income statement from the top-down.
Since 2014, Bio-Techne has seen a substantial contraction in margins beginning with gross margins through
net margins. Some of this is explainable as the company has conducted several acquisitions with aspirations of
fueling long-term organic growth. Since 2014, Gross Margins have contracted 503-basis points over the past
five years, bringing down current gross margins to 63.54% as of 1Q19. We believe the margin contraction
across the income statement can be attributed to the temporarily dilutive acquisition targets. Ineffective
synergies lack of efficiency improvement have outweighed the near-term gap filling strategy from
management’s initiative (See Appendix X). Secondly, TECH has had margin strength prior due to operations
in its Premier Product lines. This product line was produced and marketed with little to no competition. Market
saturation is starting to take a toll on the Company’s Financial strength and we expect to see this worsen as
TECH begins to evolve and move into high-cost, high-competition markets. We also believe the Company will
not be able to counteract these contractions due to the inability to bring high growth, high margin products into
Emerging Markets like China and Eastern Asia due to the Intellectual Property risks associated. EBITDA
(Figure 44) and Operating Margins have experienced the most significant reduction with basis point
contractions of 1,736 and 2,229 respectively, bringing margins down to 33.52% and 23.23% respectively in
1Q19 (Figure 38). SG&A has had the most material contraction and we believe this will continue moving
Terminal Value Weighted Valuation
FCF 2028 Value 342$
WACC 7.38%
Terminal Value Growth Rate 2.50%
Terminal Value 3,520$
WACC Calculation
Equity Assumptions
Cost of Equity 8.02%
Beta 0.78
RF Rate 2.78%
Market Return 7.95%
Market Premium 5.17%
Estimated Size Premium 1.23%
Estimated Value Premium -1.31%
Capital Structure Portion of Equity 89.61%
Debt Assumptions
Cost of Debt 2.35%
Capital Structure Portion of Debt 10.39%
Tax Rate (2019 Expected) 20.46%
WAAC 7.38%
Implied Valuations Measure Implied Price Misvaluation
Forward EPS 4.58$ $94.83 -40.85%
Trailing EPS 3.31$ $147.79 -7.81%
Growth Rate 10.20 $78.34 -51.13%
Sales per share 16.90$ $60.86 -62.04%
Book value per share 28.69$ $135.94 -15.21%
EBITDA per share 5.97$ $112.10 -30.08%
Average Implied Share Price
Misvaluation
$104.98
35%
Figure 34 - Sources: Team Analysis
Figure 35 - Sources: FactSet, Team Analysis
Figure 36 - Sources: FactSet, Team Analysis
Figure 37 - Sources: Team Analysis
Figure 38 - Sources: FactSet, Company
This report is published for educational purposes only 9
University of Minnesota Duluth Student Research January 18, 2019
forward. Current and future labor markets should continue to be strong, which places
pressure on wages and compensation for TECH’s employees. TECH has historically
sought out a large percentage of its labor force with PHD level education and experience, which requires
higher than normal compensation levels. We also believe there will be an increase in depreciation and
amortization costs as the company continues to deploy large amounts of goodwill for acquisitions. (Figure 39)
As we continue to flow down through the income statement, we have seen a 1,172-basis point contraction in
net margins since 2014 with the current net margin at 19.29% as of 1Q19 (Figure 41). We believe this will be
lower in future quarters and years due to the aforementioned delay in acquisition synergy realization. TECH
had an operating tax rate of 0% last year which will change in the future with a new corporate tax rate of 21%
and the company’s inability to continue a 0% effective tax rate. TECH has been historically in line with the
corporate tax rate. Changes in R&D tax laws should also contribute to possible increased tax liabilities into the
future due to tax reform. TECH also recently financed its large acquisitions with a $250M revolver, bringing
long-term debt to roughly $600M. This is tied to a variable interest rate based on the LIBOR rate plus 1.25%
with the ability to increase the revolver another $250M. (Figure 40) Lastly, TECH has liability of possibly
$325M in milestone payments from TECH’s acquisition of ACD and Exosome Diagnostics. Please see
Appendix X for further discussion of our Income Statement Analysis.
Balance Sheet Analysis
In order to gain insight and further understanding of TECH’s balance sheet and returns, we conducted a
DuPont analysis to provide clarity around TECH’s Return on Assets (ROA) and Return on Equity (ROE)
along with analysis of other key items of the balance sheet. The firm’s combination of contraction in ROA
paired with the contraction in ROE is worrisome. ROA has contracted at 553-basis points while ROE has
contracted at 214-basis points over a five-year period (Figure 43). Bio-Techne has seen a significant decrease
in ROE due to margin contractions. This continues to signal poor performance for the company which has not
yet been fully realized by the street. The trend is concerning for two main reasons. One, the equity multiple
(Figure 42) has expanded 48-basis points while ROE continues to trend downward. The issue is sourced from
ROA, asset turnover, and profit margin, which continue to weaken year over year. TECH has seen dilutive
acquisitions over the last five years causing continued decay in efficiency, execution, and overall financial
performance. An increase in the equity multiplier paired with a large decrease in ROA, TECH is in for a long-
road to recovery which continues to signal over-valuation. Secondly, the reduction in ROE would be less of a
concerning factor if the Company was not seeing a material effect on its equity multiplier. Bio-Techne’s
growth by acquisition plan will continue to raise the debt leverage of the company, thus increasing the equity
multiplier. Costs continue to rise faster than sales, and if you normalize the company’s sales growth
performance excluding outlier of sales, the growth of the company is significantly lower than the growth in
costs. The returns TECH is providing to investors are significantly lower than the valuation in which traded
on. In the near term we expect to see a continued contraction in the return of the company due to decreasing
margins and inability to create synergy, costs savings, increase in operating efficiency, or significant organic
sales growth from the acquisitions management has completed. (Figure 44) The balance sheet has shown
significant changes in only a few locations. Respectively because of acquisitions, we have seen a fairly
substantial increase in net debt on the balance sheet. Though we believe TECH will not make further
significant acquisitions in the near-term, we believe due to the increasing interest rate environment that there
will continue to be a slight increase in net debt based on our estimates. There has also been a significant
increase in intangible assets from the acquisition which we believe will remain steady going into the future
(Figure 39). Please also see Appendix X for further discussion of our Balance Sheet Analysis.
0%
5%
10%
15%
20%
25%
2009 2010 2011 2012 2013 2014 2015 2016 2017 2018
ROE
0.00
0.20
0.40
0.60
0.80
1.00
1.20
1.40
1.60
1.80
Equity Multiplier
20%
25%
30%
35%
40%
45%
50%
55%
60%
65%
EBITDA Margin
0%
20%
40%
60%
80%
Goodwill and Intangibles
Goodwill % of Assets Intangibles % of Assets
Year Coverage Ratio
2009 -
2010 -
2011 -
2012 -
2013 -
2014 -
2015 122.89x
2016 112.2x
2017 25.54x
2018 22.13x
0%
10%
20%
30%
40%
50%
60%
70%
80%
90%
Common Size Analysis
Gross Margin EBIT Margin EBT Margin Net Margin
Figure 39 - Sources: FactSet, Company
Figure 40 - Sources: Factset. Company
Figure 42 - Sources: FactSet, Company
Figure 43 - Sources: FactSet, Team Analysis
Figure 44 - Sources: FactSet, Team Analysis
Figure 41 - Sources: Investor Relations, Team Assumptions
This report is published for educational purposes only 10
University of Minnesota Duluth Student Research January 18, 2019
Cash Flow Analysis
Bio-Techne has experienced a negative five-year CAGR in FCF of -12.39%. See
Appendix II for information regarding how FCF was calculated. More recently, from 2017 to 2018, we have
seen a decrease in FCF mainly due to a large increase in investment activity for acquisitions. Due to our
expectations of slowing acquisitions, we believe we will see growth in FCF as a whole in the coming years but
this could remain an issue with rising expenses for the company. We see issues in free cash flow margin,
which has experienced decay and we believe will continue moving forward. TECH has had increasing trouble
generating FCF compared to sales as a result of margin contractions which creates concern for TECH
financially. We believe the growth in net FCF will continue to deteriorate, as the firm did not pay income taxes
in 2018. The resumption of income tax in the years ahead should lower the amount of free cash flow the firm
is able to generate, providing further evidence suggesting an overvaluation of the company. Please see
Appendix II and X regarding how we calculated our ratio analysis and further discussion.
Risks
Acquisition Growth Strategy
Bio-Techne relies heavily on acquisitions to fuel growth as the company has completed fifteen acquisitions
over the last six years. The company has focused on bolt-on acquisitions in order to fill gaps and expand Bio-
Techne’s product portfolio. There is high competition among buyers and high valuations for many
biotechnology companies which can result in a high value of goodwill for the acquiring company with the
threat that the investment could be dilutive. This strategy is also becoming more expensive for Bio-Techne as
the company has $561.5 million in variable debt obligations and interest rates are at all-time highs and
increasing.
Competition
The Biotechnology industry is a highly competitive and fragmented industry with many players controlling
niche portions of the market. This means that Bio-Techne faces competition from start-ups to large
multinational companies that may have more resources than Bio-Techne. Many of these competitors are also
focusing on geographic expansion, especially in China. If Bio-Techne is unable to be competitive with the rest
of the industry, we could expect to see a loss of market share. Bio-Techne competes in markets that are
federally regulated and must comply with the current and ever-changing environmental, health and safety, and
food and drug regulations. Bio-Techne is also awaiting reimbursement coverage for clinical laboratory testing
for the company’s EPI test, a non-invasive urine test that can accurately predict prostate cancer. The schedule
for reimbursement is uncertain and reimbursements are subject to change if there is support to give Medicare
more pricing power concerning drug prices. Management was expecting to receive reimbursement by the end
of 2018 but we are yet to hear any word on when we can expect that to actually happen.
Margin Contraction
Bio-Techne’s margins have been contracting over the past eight years since the peak in 2010 with gross
margin down (-15.6%) from 79.4% to 63.8%, EBITDA margin down (-26%) from 61.1% to 35.1%, and net
margin down (-21.2%) from 40.8% to 19.6% all over the same period. This can be attributed to higher COGS
and the company’s M&A strategy. Since the year 2013, when Charles Kummeth took over as CEO, COGS has
grown at higher rates than sales growth except for 2018 where sales outpaced COGS by 3.4%. If the company
is not able to recover from this trend the company may have to impair goodwill as acquisitions are becoming
dilutive. Bio-Techne is also facing a tight job market, meaning it has to pay higher wages and use other
incentives in order to attract and maintain its employees, ultimately lowering margins.
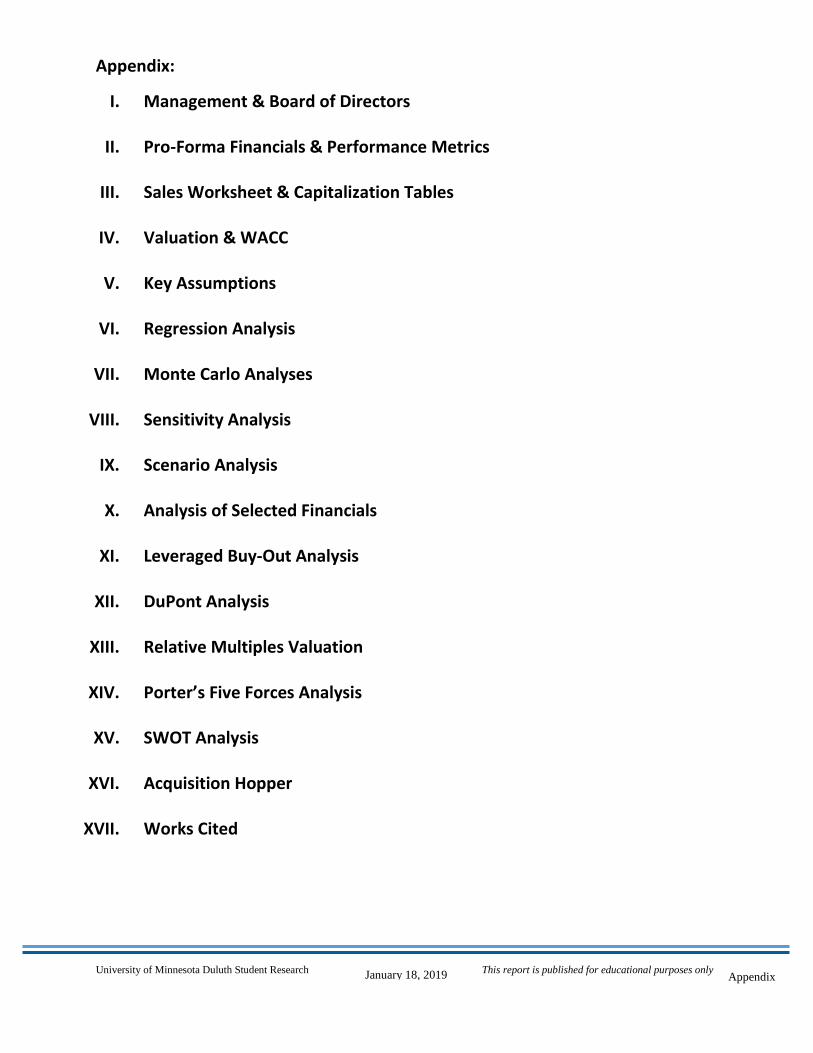
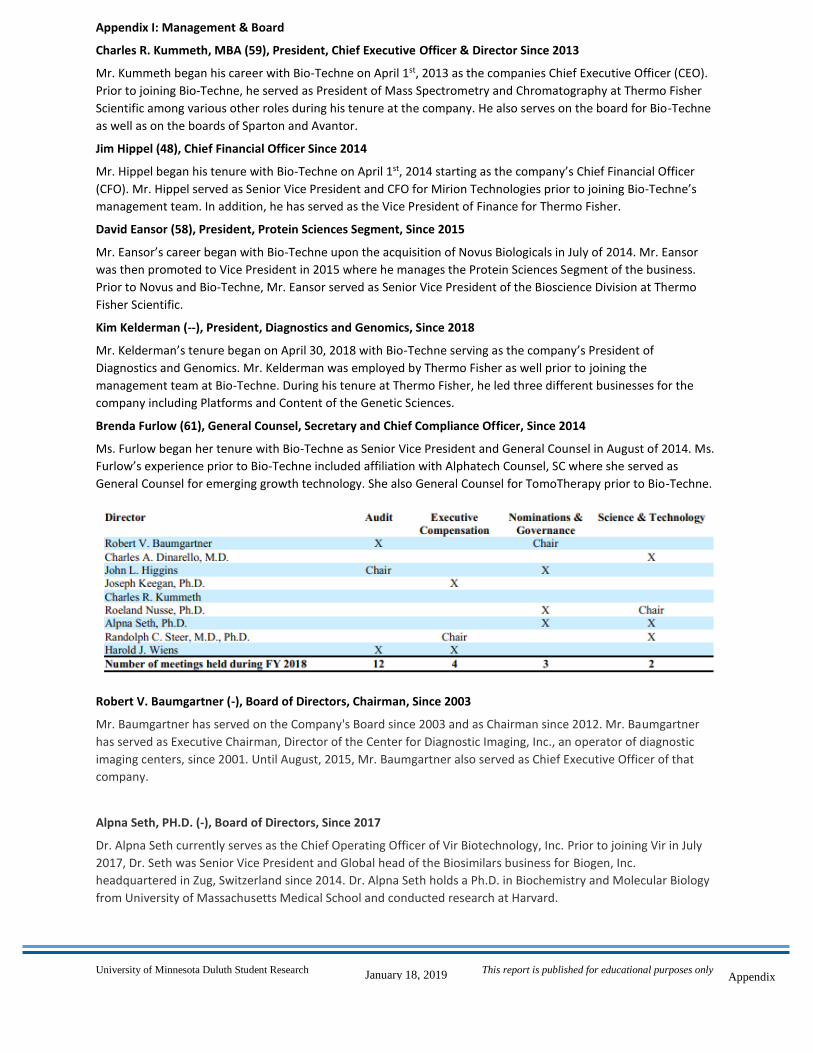
Employee Retention
Bio-Techne relies on the ability to acquire and retain highly knowledgeable and skilled employees. The
company’s employees and sales force is made up of experienced scientists and others with industry experience
in order to develop new solutions, deliver sales for the company and information for the customer (Figures 46
& 47). The current job market is very tight with unemployment around 3.7%. The tight job market could, in
turn, decrease margins as the company will need to pay higher wages and use other incentives to attract and
maintain employees. Because Bio-Techne is a serial acquirer, the company also faces the challenge of
retaining the employees that it acquires through M&A deals. Employees acquired in an acquisition are less
likely to stay with Bio-Techne because there is a new culture with different expectations and many choose to
part ways with the company.
Intellectual Property Risks
Bio-Techne’s management team revealed to us on our investor day that the company cannot and will not bring
its premier products into China due to the threat of IP theft or infringement. Bio-Techne has identified China
as a high growth market but will be unable to fully capitalize on the opportunity due to this threat. In addition,
competition in China is strong as many other biotechnology companies are also working to move into China in
an attempt to grow rapidly with the strong demand for healthcare. While the U.S. and other countries are
fighting the theft of intellectual property, hardly any progress has been made, in some cases it has gotten even
worse. Chinese violators are not being punished adequately and some operate with impunity so there is
virtually nothing stopping them from stealing and using trade secrets from foreign competition.
$0
$50
$100
$150
$200
$250
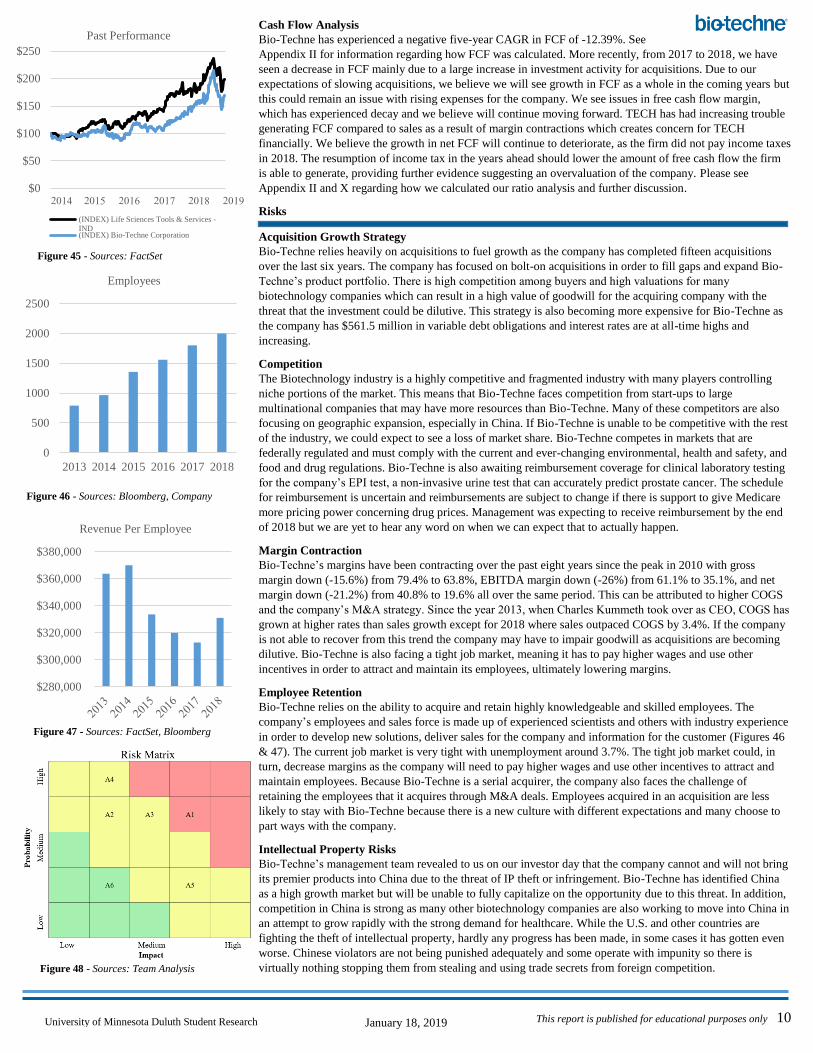
Past Performance
(INDEX) Life Sciences Tools & Services -
IND(INDEX) Bio-Techne Corporation
0
500
1000
1500
2000
2500
2013 2014 2015 2016 2017 2018
Employees
$280,000
$300,000
$320,000
$340,000
$360,000
$380,000
Revenue Per Employee
Figure 45 - Sources: FactSet
Figure 46 - Sources: Bloomberg, Company
Figure 47 - Sources: FactSet, Bloomberg
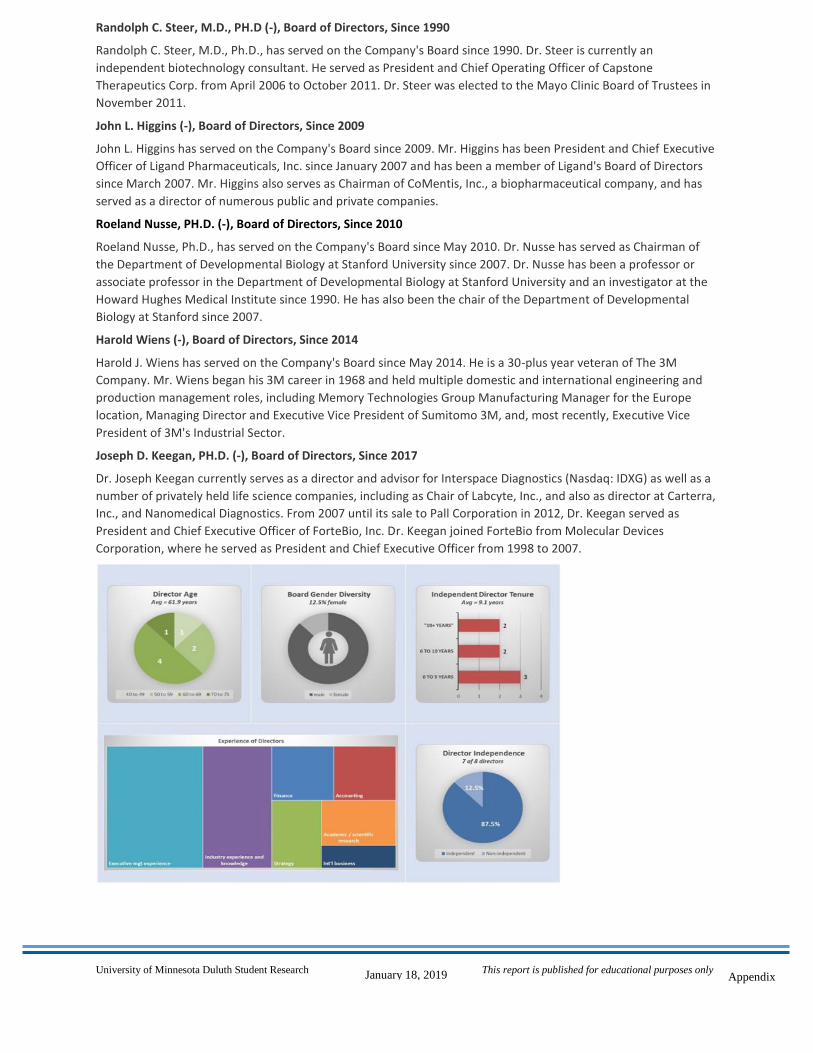
Figure 48 - Sources: Team Analysis
University of Minnesota Duluth Student Research This report is published for educational purposes only
January 18, 2019 Appendix
Appendix:
I. Management & Board of Directors
II. Pro-Forma Financials & Performance Metrics
III. Sales Worksheet & Capitalization Tables
IV. Valuation & WACC
V. Key Assumptions
VI. Regression Analysis
VII. Monte Carlo Analyses
VIII. Sensitivity Analysis
IX. Scenario Analysis
X. Analysis of Selected Financials
XI. Leveraged Buy-Out Analysis
XII. DuPont Analysis
XIII. Relative Multiples Valuation
XIV. Porter’s Five Forces Analysis
XV. SWOT Analysis
XVI. Acquisition Hopper
XVII. Works Cited
University of Minnesota Duluth Student Research This report is published for educational purposes only
January 18, 2019 Appendix
Appendix I: Management & Board
Charles R. Kummeth, MBA (59), President, Chief Executive Officer & Director Since 2013
Mr. Kummeth began his career with Bio-Techne on April 1st, 2013 as the companies Chief Executive Officer (CEO).
Prior to joining Bio-Techne, he served as President of Mass Spectrometry and Chromatography at Thermo Fisher
Scientific among various other roles during his tenure at the company. He also serves on the board for Bio-Techne
as well as on the boards of Sparton and Avantor.
Jim Hippel (48), Chief Financial Officer Since 2014
Mr. Hippel began his tenure with Bio-Techne on April 1st, 2014 starting as the company’s Chief Financial Officer
(CFO). Mr. Hippel served as Senior Vice President and CFO for Mirion Technologies prior to joining Bio-Techne’s
management team. In addition, he has served as the Vice President of Finance for Thermo Fisher.
David Eansor (58), President, Protein Sciences Segment, Since 2015
Mr. Eansor’s career began with Bio-Techne upon the acquisition of Novus Biologicals in July of 2014. Mr. Eansor
was then promoted to Vice President in 2015 where he manages the Protein Sciences Segment of the business.
Prior to Novus and Bio-Techne, Mr. Eansor served as Senior Vice President of the Bioscience Division at Thermo
Fisher Scientific.
Kim Kelderman (--), President, Diagnostics and Genomics, Since 2018
Mr. Kelderman’s tenure began on April 30, 2018 with Bio-Techne serving as the company’s President of
Diagnostics and Genomics. Mr. Kelderman was employed by Thermo Fisher as well prior to joining the
management team at Bio-Techne. During his tenure at Thermo Fisher, he led three different businesses for the
company including Platforms and Content of the Genetic Sciences.
Brenda Furlow (61), General Counsel, Secretary and Chief Compliance Officer, Since 2014
Ms. Furlow began her tenure with Bio-Techne as Senior Vice President and General Counsel in August of 2014. Ms.
Furlow’s experience prior to Bio-Techne included affiliation with Alphatech Counsel, SC where she served as
General Counsel for emerging growth technology. She also General Counsel for TomoTherapy prior to Bio-Techne.
Robert V. Baumgartner (-), Board of Directors, Chairman, Since 2003
Mr. Baumgartner has served on the Company's Board since 2003 and as Chairman since 2012. Mr. Baumgartner
has served as Executive Chairman, Director of the Center for Diagnostic Imaging, Inc., an operator of diagnostic
imaging centers, since 2001. Until August, 2015, Mr. Baumgartner also served as Chief Executive Officer of that
company.
Alpna Seth, PH.D. (-), Board of Directors, Since 2017
Dr. Alpna Seth currently serves as the Chief Operating Officer of Vir Biotechnology, Inc. Prior to joining Vir in July
2017, Dr. Seth was Senior Vice President and Global head of the Biosimilars business for Biogen, Inc.
headquartered in Zug, Switzerland since 2014. Dr. Alpna Seth holds a Ph.D. in Biochemistry and Molecular Biology
from University of Massachusetts Medical School and conducted research at Harvard.
University of Minnesota Duluth Student Research This report is published for educational purposes only
January 18, 2019 Appendix
Randolph C. Steer, M.D., PH.D (-), Board of Directors, Since 1990
Randolph C. Steer, M.D., Ph.D., has served on the Company's Board since 1990. Dr. Steer is currently an
independent biotechnology consultant. He served as President and Chief Operating Officer of Capstone
Therapeutics Corp. from April 2006 to October 2011. Dr. Steer was elected to the Mayo Clinic Board of Trustees in
November 2011.
John L. Higgins (-), Board of Directors, Since 2009
John L. Higgins has served on the Company's Board since 2009. Mr. Higgins has been President and Chief Executive
Officer of Ligand Pharmaceuticals, Inc. since January 2007 and has been a member of Ligand's Board of Directors
since March 2007. Mr. Higgins also serves as Chairman of CoMentis, Inc., a biopharmaceutical company, and has
served as a director of numerous public and private companies.
Roeland Nusse, PH.D. (-), Board of Directors, Since 2010
Roeland Nusse, Ph.D., has served on the Company's Board since May 2010. Dr. Nusse has served as Chairman of
the Department of Developmental Biology at Stanford University since 2007. Dr. Nusse has been a professor or
associate professor in the Department of Developmental Biology at Stanford University and an investigator at the
Howard Hughes Medical Institute since 1990. He has also been the chair of the Department of Developmental
Biology at Stanford since 2007.
Harold Wiens (-), Board of Directors, Since 2014
Harold J. Wiens has served on the Company's Board since May 2014. He is a 30-plus year veteran of The 3M
Company. Mr. Wiens began his 3M career in 1968 and held multiple domestic and international engineering and
production management roles, including Memory Technologies Group Manufacturing Manager for the Europe
location, Managing Director and Executive Vice President of Sumitomo 3M, and, most recently, Executive Vice
President of 3M's Industrial Sector.
Joseph D. Keegan, PH.D. (-), Board of Directors, Since 2017
Dr. Joseph Keegan currently serves as a director and advisor for Interspace Diagnostics (Nasdaq: IDXG) as well as a
number of privately held life science companies, including as Chair of Labcyte, Inc., and also as director at Carterra,
Inc., and Nanomedical Diagnostics. From 2007 until its sale to Pall Corporation in 2012, Dr. Keegan served as
President and Chief Executive Officer of ForteBio, Inc. Dr. Keegan joined ForteBio from Molecular Devices
Corporation, where he served as President and Chief Executive Officer from 1998 to 2007.
University of Minnesota Duluth Student Research This report is published for educational purposes only
January 18, 2019 Appendix
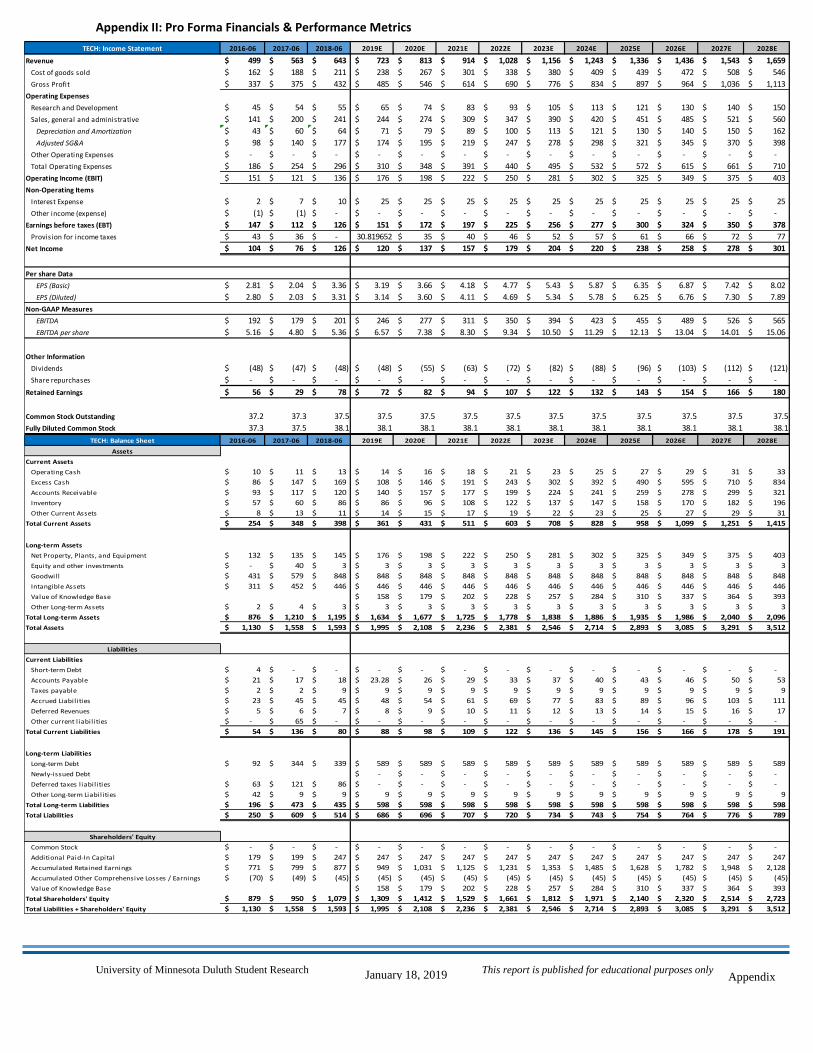
Appendix II: Pro Forma Financials & Performance Metrics
TECH: Income Statement 2016-06 2017-06 2018-06 2019E 2020E 2021E 2022E 2023E 2024E 2025E 2026E 2027E 2028E
Revenue 499$ 563$ 643$ 723$ 813$ 914$ 1,028$ 1,156$ 1,243$ 1,336$ 1,436$ 1,543$ 1,659$
Cost of goods sold 162$ 188$ 211$ 238$ 267$ 301$ 338$ 380$ 409$ 439$ 472$ 508$ 546$
Gross Profit 337$ 375$ 432$ 485$ 546$ 614$ 690$ 776$ 834$ 897$ 964$ 1,036$ 1,113$
Operating Expenses
Research and Development 45$ 54$ 55$ 65$ 74$ 83$ 93$ 105$ 113$ 121$ 130$ 140$ 150$
Sales, general and administrative 141$ 200$ 241$ 244$ 274$ 309$ 347$ 390$ 420$ 451$ 485$ 521$ 560$
Depreciation and Amortization 43$ 60$ 64$ 71$ 79$ 89$ 100$ 113$ 121$ 130$ 140$ 150$ 162$
Adjusted SG&A 98$ 140$ 177$ 174$ 195$ 219$ 247$ 278$ 298$ 321$ 345$ 370$ 398$
Other Operating Expenses -$ -$ -$ -$ -$ -$ -$ -$ -$ -$ -$ -$ -$
Total Operating Expenses 186$ 254$ 296$ 310$ 348$ 391$ 440$ 495$ 532$ 572$ 615$ 661$ 710$
Operating Income (EBIT) 151$ 121$ 136$ 176$ 198$ 222$ 250$ 281$ 302$ 325$ 349$ 375$ 403$
Non-Operating Items
Interest Expense 2$ 7$ 10$ 25$ 25$ 25$ 25$ 25$ 25$ 25$ 25$ 25$ 25$
Other income (expense) (1)$ (1)$ -$ -$ -$ -$ -$ -$ -$ -$ -$ -$ -$
Earnings before taxes (EBT) 147$ 112$ 126$ 151$ 172$ 197$ 225$ 256$ 277$ 300$ 324$ 350$ 378$
Provision for income taxes 43$ 36$ -$ 30.819652 35$ 40$ 46$ 52$ 57$ 61$ 66$ 72$ 77$
Net Income 104$ 76$ 126$ 120$ 137$ 157$ 179$ 204$ 220$ 238$ 258$ 278$ 301$
Per share Data
EPS (Basic) 2.81$ 2.04$ 3.36$ 3.19$ 3.66$ 4.18$ 4.77$ 5.43$ 5.87$ 6.35$ 6.87$ 7.42$ 8.02$
EPS (Diluted) 2.80$ 2.03$ 3.31$ 3.14$ 3.60$ 4.11$ 4.69$ 5.34$ 5.78$ 6.25$ 6.76$ 7.30$ 7.89$
Non-GAAP Measures
EBITDA 192$ 179$ 201$ 246$ 277$ 311$ 350$ 394$ 423$ 455$ 489$ 526$ 565$
EBITDA per share 5.16$ 4.80$ 5.36$ 6.57$ 7.38$ 8.30$ 9.34$ 10.50$ 11.29$ 12.13$ 13.04$ 14.01$ 15.06$
Other Information
Dividends (48)$ (47)$ (48)$ (48)$ (55)$ (63)$ (72)$ (82)$ (88)$ (96)$ (103)$ (112)$ (121)$
Share repurchases -$ -$ -$ -$ -$ -$ -$ -$ -$ -$ -$ -$ -$
Retained Earnings 56$ 29$ 78$ 72$ 82$ 94$ 107$ 122$ 132$ 143$ 154$ 166$ 180$
Common Stock Outstanding 37.2 37.3 37.5 37.5 37.5 37.5 37.5 37.5 37.5 37.5 37.5 37.5 37.5
Fully Diluted Common Stock 37.3 37.5 38.1 38.1 38.1 38.1 38.1 38.1 38.1 38.1 38.1 38.1 38.1
TECH: Balance Sheet 2016-06 2017-06 2018-06 2019E 2020E 2021E 2022E 2023E 2024E 2025E 2026E 2027E 2028E
Assets
Current Assets
Operating Cash 10$ 11$ 13$ 14$ 16$ 18$ 21$ 23$ 25$ 27$ 29$ 31$ 33$
Excess Cash 86$ 147$ 169$ 108$ 146$ 191$ 243$ 302$ 392$ 490$ 595$ 710$ 834$
Accounts Receivable 93$ 117$ 120$ 140$ 157$ 177$ 199$ 224$ 241$ 259$ 278$ 299$ 321$
Inventory 57$ 60$ 86$ 86$ 96$ 108$ 122$ 137$ 147$ 158$ 170$ 182$ 196$
Other Current Assets 8$ 13$ 11$ 14$ 15$ 17$ 19$ 22$ 23$ 25$ 27$ 29$ 31$
Total Current Assets 254$ 348$ 398$ 361$ 431$ 511$ 603$ 708$ 828$ 958$ 1,099$ 1,251$ 1,415$
Long-term Assets
Net Property, Plants, and Equipment 132$ 135$ 145$ 176$ 198$ 222$ 250$ 281$ 302$ 325$ 349$ 375$ 403$
Equity and other investments -$ 40$ 3$ 3$ 3$ 3$ 3$ 3$ 3$ 3$ 3$ 3$ 3$
Goodwill 431$ 579$ 848$ 848$ 848$ 848$ 848$ 848$ 848$ 848$ 848$ 848$ 848$
Intangible Assets 311$ 452$ 446$ 446$ 446$ 446$ 446$ 446$ 446$ 446$ 446$ 446$ 446$
Value of Knowledge Base 158$ 179$ 202$ 228$ 257$ 284$ 310$ 337$ 364$ 393$
Other Long-term Assets 2$ 4$ 3$ 3$ 3$ 3$ 3$ 3$ 3$ 3$ 3$ 3$ 3$
Total Long-term Assets 876$ 1,210$ 1,195$ 1,634$ 1,677$ 1,725$ 1,778$ 1,838$ 1,886$ 1,935$ 1,986$ 2,040$ 2,096$
Total Assets 1,130$ 1,558$ 1,593$ 1,995$ 2,108$ 2,236$ 2,381$ 2,546$ 2,714$ 2,893$ 3,085$ 3,291$ 3,512$
Liabilities
Current Liabilities
Short-term Debt 4$ -$ -$ -$ -$ -$ -$ -$ -$ -$ -$ -$ -$
Accounts Payable 21$ 17$ 18$ 23.28$ 26$ 29$ 33$ 37$ 40$ 43$ 46$ 50$ 53$
Taxes payable 2$ 2$ 9$ 9$ 9$ 9$ 9$ 9$ 9$ 9$ 9$ 9$ 9$
Accrued Liabilities 23$ 45$ 45$ 48$ 54$ 61$ 69$ 77$ 83$ 89$ 96$ 103$ 111$
Deferred Revenues 5$ 6$ 7$ 8$ 9$ 10$ 11$ 12$ 13$ 14$ 15$ 16$ 17$
Other current l iabilities -$ 65$ -$ -$ -$ -$ -$ -$ -$ -$ -$ -$ -$
Total Current Liabilities 54$ 136$ 80$ 88$ 98$ 109$ 122$ 136$ 145$ 156$ 166$ 178$ 191$
Long-term Liabilities
Long-term Debt 92$ 344$ 339$ 589$ 589$ 589$ 589$ 589$ 589$ 589$ 589$ 589$ 589$
Newly-issued Debt -$ -$ -$ -$ -$ -$ -$ -$ -$ -$
Deferred taxes l iabilities 63$ 121$ 86$ -$ -$ -$ -$ -$ -$ -$ -$ -$ -$
Other Long-term Liabilities 42$ 9$ 9$ 9$ 9$ 9$ 9$ 9$ 9$ 9$ 9$ 9$ 9$
Total Long-term Liabilities 196$ 473$ 435$ 598$ 598$ 598$ 598$ 598$ 598$ 598$ 598$ 598$ 598$
Total Liabilities 250$ 609$ 514$ 686$ 696$ 707$ 720$ 734$ 743$ 754$ 764$ 776$ 789$
Shareholders' Equity
Common Stock -$ -$ -$ -$ -$ -$ -$ -$ -$ -$ -$ -$ -$
Additional Paid-In Capital 179$ 199$ 247$ 247$ 247$ 247$ 247$ 247$ 247$ 247$ 247$ 247$ 247$
Accumulated Retained Earnings 771$ 799$ 877$ 949$ 1,031$ 1,125$ 1,231$ 1,353$ 1,485$ 1,628$ 1,782$ 1,948$ 2,128$
Accumulated Other Comprehensive Losses / Earnings (70)$ (49)$ (45)$ (45)$ (45)$ (45)$ (45)$ (45)$ (45)$ (45)$ (45)$ (45)$ (45)$
Value of Knowledge Base 158$ 179$ 202$ 228$ 257$ 284$ 310$ 337$ 364$ 393$
Total Shareholders' Equity 879$ 950$ 1,079$ 1,309$ 1,412$ 1,529$ 1,661$ 1,812$ 1,971$ 2,140$ 2,320$ 2,514$ 2,723$
Total Liabilities + Shareholders' Equity 1,130$ 1,558$ 1,593$ 1,995$ 2,108$ 2,236$ 2,381$ 2,546$ 2,714$ 2,893$ 3,085$ 3,291$ 3,512$
University of Minnesota Duluth Student Research This report is published for educational purposes only
January 18, 2019 Appendix
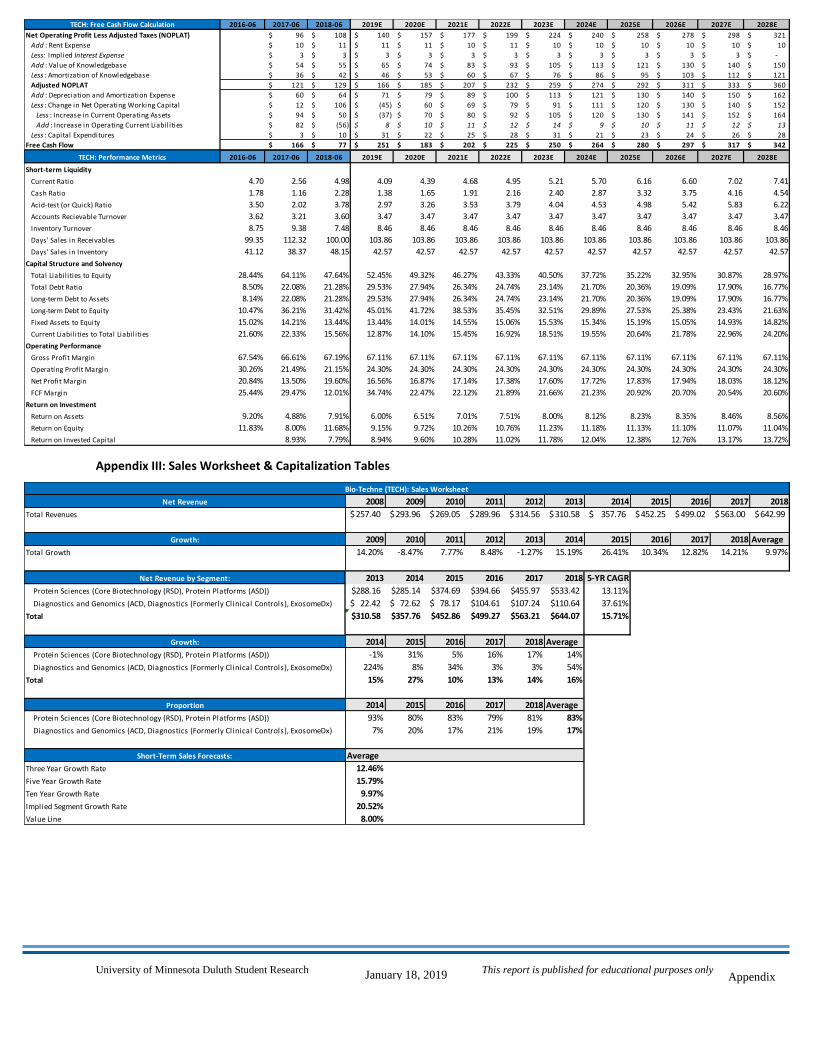
Appendix III: Sales Worksheet & Capitalization Tables
TECH: Free Cash Flow Calculation 2016-06 2017-06 2018-06 2019E 2020E 2021E 2022E 2023E 2024E 2025E 2026E 2027E 2028E
Net Operating Profit Less Adjusted Taxes (NOPLAT) 96$ 108$ 140$ 157$ 177$ 199$ 224$ 240$ 258$ 278$ 298$ 321$
Add : Rent Expense 10$ 11$ 11$ 11$ 10$ 11$ 10$ 10$ 10$ 10$ 10$ 10$
Less: Implied Interest Expense 3$ 3$ 3$ 3$ 3$ 3$ 3$ 3$ 3$ 3$ 3$ -$
Add : Value of Knowledgebase 54$ 55$ 65$ 74$ 83$ 93$ 105$ 113$ 121$ 130$ 140$ 150$
Less : Amortization of Knowledgebase 36$ 42$ 46$ 53$ 60$ 67$ 76$ 86$ 95$ 103$ 112$ 121$
Adjusted NOPLAT 121$ 129$ 166$ 185$ 207$ 232$ 259$ 274$ 292$ 311$ 333$ 360$
Add : Depreciation and Amortization Expense 60$ 64$ 71$ 79$ 89$ 100$ 113$ 121$ 130$ 140$ 150$ 162$
Less : Change in Net Operating Working Capital 12$ 106$ (45)$ 60$ 69$ 79$ 91$ 111$ 120$ 130$ 140$ 152$
Less : Increase in Current Operating Assets 94$ 50$ (37)$ 70$ 80$ 92$ 105$ 120$ 130$ 141$ 152$ 164$
Add : Increase in Operating Current Liabilities 82$ (56)$ 8$ 10$ 11$ 12$ 14$ 9$ 10$ 11$ 12$ 13$
Less : Capital Expenditures 3$ 10$ 31$ 22$ 25$ 28$ 31$ 21$ 23$ 24$ 26$ 28$
Free Cash Flow 166$ 77$ 251$ 183$ 202$ 225$ 250$ 264$ 280$ 297$ 317$ 342$
TECH: Performance Metrics 2016-06 2017-06 2018-06 2019E 2020E 2021E 2022E 2023E 2024E 2025E 2026E 2027E 2028E
Short-term Liquidity
Current Ratio 4.70 2.56 4.98 4.09 4.39 4.68 4.95 5.21 5.70 6.16 6.60 7.02 7.41
Cash Ratio 1.78 1.16 2.28 1.38 1.65 1.91 2.16 2.40 2.87 3.32 3.75 4.16 4.54
Acid-test (or Quick) Ratio 3.50 2.02 3.78 2.97 3.26 3.53 3.79 4.04 4.53 4.98 5.42 5.83 6.22
Accounts Recievable Turnover 3.62 3.21 3.60 3.47 3.47 3.47 3.47 3.47 3.47 3.47 3.47 3.47 3.47
Inventory Turnover 8.75 9.38 7.48 8.46 8.46 8.46 8.46 8.46 8.46 8.46 8.46 8.46 8.46
Days' Sales in Receivables 99.35 112.32 100.00 103.86 103.86 103.86 103.86 103.86 103.86 103.86 103.86 103.86 103.86
Days' Sales in Inventory 41.12 38.37 48.15 42.57 42.57 42.57 42.57 42.57 42.57 42.57 42.57 42.57 42.57
Capital Structure and Solvency
Total Liabilities to Equity 28.44% 64.11% 47.64% 52.45% 49.32% 46.27% 43.33% 40.50% 37.72% 35.22% 32.95% 30.87% 28.97%
Total Debt Ratio 8.50% 22.08% 21.28% 29.53% 27.94% 26.34% 24.74% 23.14% 21.70% 20.36% 19.09% 17.90% 16.77%
Long-term Debt to Assets 8.14% 22.08% 21.28% 29.53% 27.94% 26.34% 24.74% 23.14% 21.70% 20.36% 19.09% 17.90% 16.77%
Long-term Debt to Equity 10.47% 36.21% 31.42% 45.01% 41.72% 38.53% 35.45% 32.51% 29.89% 27.53% 25.38% 23.43% 21.63%
Fixed Assets to Equity 15.02% 14.21% 13.44% 13.44% 14.01% 14.55% 15.06% 15.53% 15.34% 15.19% 15.05% 14.93% 14.82%
Current Liabilities to Total Liabilities 21.60% 22.33% 15.56% 12.87% 14.10% 15.45% 16.92% 18.51% 19.55% 20.64% 21.78% 22.96% 24.20%
Operating Performance
Gross Profit Margin 67.54% 66.61% 67.19% 67.11% 67.11% 67.11% 67.11% 67.11% 67.11% 67.11% 67.11% 67.11% 67.11%
Operating Profit Margin 30.26% 21.49% 21.15% 24.30% 24.30% 24.30% 24.30% 24.30% 24.30% 24.30% 24.30% 24.30% 24.30%
Net Profit Margin 20.84% 13.50% 19.60% 16.56% 16.87% 17.14% 17.38% 17.60% 17.72% 17.83% 17.94% 18.03% 18.12%
FCF Margin 25.44% 29.47% 12.01% 34.74% 22.47% 22.12% 21.89% 21.66% 21.23% 20.92% 20.70% 20.54% 20.60%
Return on Investment
Return on Assets 9.20% 4.88% 7.91% 6.00% 6.51% 7.01% 7.51% 8.00% 8.12% 8.23% 8.35% 8.46% 8.56%
Return on Equity 11.83% 8.00% 11.68% 9.15% 9.72% 10.26% 10.76% 11.23% 11.18% 11.13% 11.10% 11.07% 11.04%
Return on Invested Capital 8.93% 7.79% 8.94% 9.60% 10.28% 11.02% 11.78% 12.04% 12.38% 12.76% 13.17% 13.72%
Bio-Techne (TECH): Sales Worksheet
Net Revenue 2008 2009 2010 2011 2012 2013 2014 2015 2016 2017 2018
Total Revenues 257.40$ 293.96$ 269.05$ 289.96$ 314.56$ 310.58$ 357.76$ 452.25$ 499.02$ 563.00$ 642.99$
Growth: 2009 2010 2011 2012 2013 2014 2015 2016 2017 2018 Average
Total Growth 14.20% -8.47% 7.77% 8.48% -1.27% 15.19% 26.41% 10.34% 12.82% 14.21% 9.97%
Net Revenue by Segment: 2013 2014 2015 2016 2017 2018 5-YR CAGR
Protein Sciences (Core Biotechnology (RSD), Protein Platforms (ASD)) 288.16$ 285.14$ 374.69$ 394.66$ 455.97$ 533.42$ 13.11%
Diagnostics and Genomics (ACD, Diagnostics (Formerly Clinical Controls), ExosomeDx) 22.42$ 72.62$ 78.17$ 104.61$ 107.24$ 110.64$ 37.61%
Total 310.58$ 357.76$ 452.86$ 499.27$ 563.21$ 644.07$ 15.71%
Growth: 2014 2015 2016 2017 2018 Average
Protein Sciences (Core Biotechnology (RSD), Protein Platforms (ASD)) -1% 31% 5% 16% 17% 14%
Diagnostics and Genomics (ACD, Diagnostics (Formerly Clinical Controls), ExosomeDx) 224% 8% 34% 3% 3% 54%
Total 15% 27% 10% 13% 14% 16%
Proportion 2014 2015 2016 2017 2018 Average
Protein Sciences (Core Biotechnology (RSD), Protein Platforms (ASD)) 93% 80% 83% 79% 81% 83%
Diagnostics and Genomics (ACD, Diagnostics (Formerly Clinical Controls), ExosomeDx) 7% 20% 17% 21% 19% 17%
Short-Term Sales Forecasts:
Three Year Growth Rate 12.46%
Five Year Growth Rate 15.79%
Ten Year Growth Rate 9.97%
Implied Segment Growth Rate 20.52%
Value Line 8.00%
Average
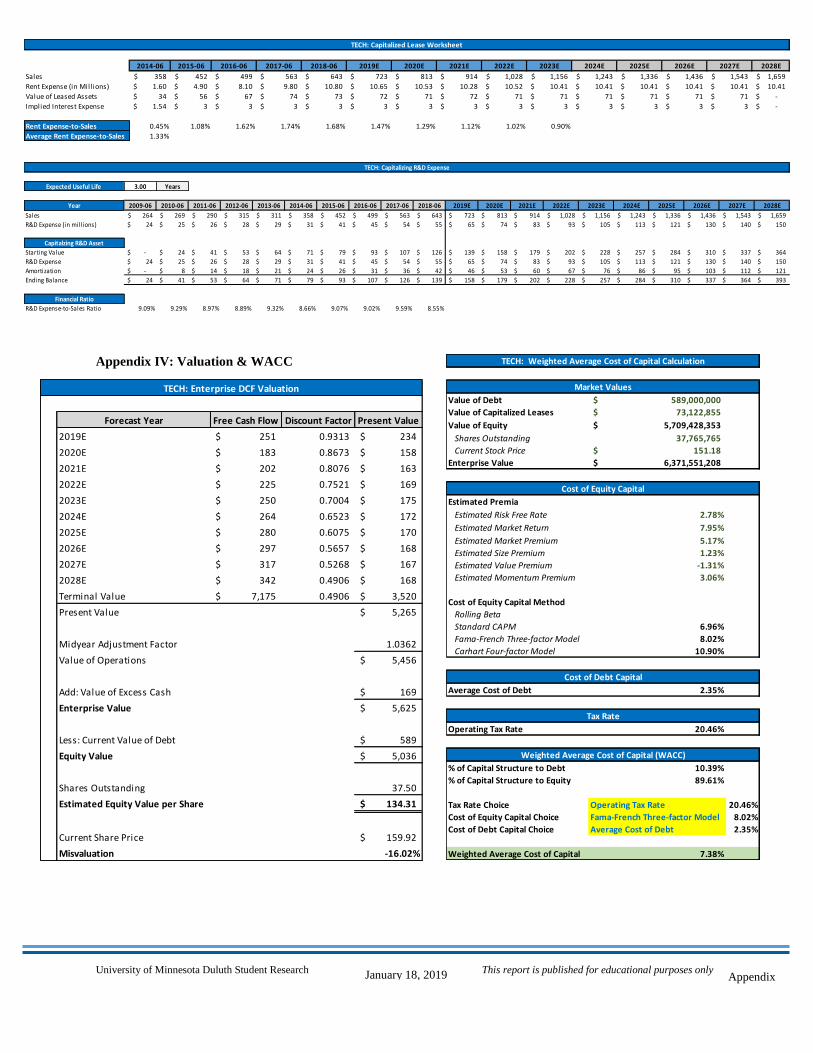
University of Minnesota Duluth Student Research This report is published for educational purposes only
January 18, 2019 Appendix
Appendix IV: Valuation & WACC
TECH: Enterprise DCF Valuation
Forecast Year Free Cash Flow Discount Factor Present Value
1 2019E 251$ 0.9313 234$
2 2020E 183$ 0.8673 158$
3 2021E 202$ 0.8076 163$
4 2022E 225$ 0.7521 169$
5 2023E 250$ 0.7004 175$
6 2024E 264$ 0.6523 172$
7 2025E 280$ 0.6075 170$
8 2026E 297$ 0.5657 168$
9 2027E 317$ 0.5268 167$
10 2028E 342$ 0.4906 168$
10 Terminal Value 7,175$ 0.4906 3,520$
Present Value 5,265$
Midyear Adjustment Factor 1.0362
Value of Operations 5,456$
Add: Value of Excess Cash 169$
Enterprise Value 5,625$
Less: Current Value of Debt 589$
Equity Value 5,036$
Shares Outstanding 37.50
Estimated Equity Value per Share 134.31$
Current Share Price 159.92$
Misvaluation -16.02%
TECH: Weighted Average Cost of Capital Calculation
Market Values Short-Term Debt
Value of Debt 589,000,000$
Value of Capitalized Leases 73,122,855$
Value of Equity 5,709,428,353$ Long-Term Debt
Shares Outstanding 37,765,765
Current Stock Price 151.18$
Enterprise Value 6,371,551,208$
Cost of Equity Capital
Estimated Premia
Estimated Risk Free Rate 2.78%
Estimated Market Return 7.95%
Estimated Market Premium 5.17%
Estimated Size Premium 1.23%
Estimated Value Premium -1.31%
Estimated Momentum Premium 3.06%
Cost of Equity Capital Method
Rolling Beta
Standard CAPM 6.96%
Fama-French Three-factor Model 8.02%
Carhart Four-factor Model 10.90%
Cost of Debt Capital
Average Cost of Debt 2.35%
Tax Rate
Operating Tax Rate 20.46%
Weighted Average Cost of Capital (WACC)
% of Capital Structure to Debt 10.39%
% of Capital Structure to Equity 89.61%
Tax Rate Choice Operating Tax Rate 20.46%
Cost of Equity Capital Choice Fama-French Three-factor Model 8.02%
Cost of Debt Capital Choice Average Cost of Debt 2.35%
Weighted Average Cost of Capital 7.38%
TECH: Capitalized Lease Worksheet
2014-06 2015-06 2016-06 2017-06 2018-06 2019E 2020E 2021E 2022E 2023E 2024E 2025E 2026E 2027E 2028E
Sales 358$ 452$ 499$ 563$ 643$ 723$ 813$ 914$ 1,028$ 1,156$ 1,243$ 1,336$ 1,436$ 1,543$ 1,659$
Rent Expense (in Millions) 1.60$ 4.90$ 8.10$ 9.80$ 10.80$ 10.65$ 10.53$ 10.28$ 10.52$ 10.41$ 10.41$ 10.41$ 10.41$ 10.41$ 10.41$
Value of Leased Assets 34$ 56$ 67$ 74$ 73$ 72$ 71$ 72$ 71$ 71$ 71$ 71$ 71$ 71$ -$
Implied Interest Expense 1.54$ 3$ 3$ 3$ 3$ 3$ 3$ 3$ 3$ 3$ 3$ 3$ 3$ 3$ -$
Rent Expense-to-Sales 0.45% 1.08% 1.62% 1.74% 1.68% 1.47% 1.29% 1.12% 1.02% 0.90%
Average Rent Expense-to-Sales 1.33%
TECH: Capitalizing R&D Expense
Expected Useful Life 3.00 Years
Year 2009-06 2010-06 2011-06 2012-06 2013-06 2014-06 2015-06 2016-06 2017-06 2018-06 2019E 2020E 2021E 2022E 2023E 2024E 2025E 2026E 2027E 2028E
Sales 264$ 269$ 290$ 315$ 311$ 358$ 452$ 499$ 563$ 643$ 723$ 813$ 914$ 1,028$ 1,156$ 1,243$ 1,336$ 1,436$ 1,543$ 1,659$
R&D Expense (in mill ions) 24$ 25$ 26$ 28$ 29$ 31$ 41$ 45$ 54$ 55$ 65$ 74$ 83$ 93$ 105$ 113$ 121$ 130$ 140$ 150$
Capitalzing R&D Asset
Starting Value -$ 24$ 41$ 53$ 64$ 71$ 79$ 93$ 107$ 126$ 139$ 158$ 179$ 202$ 228$ 257$ 284$ 310$ 337$ 364$
R&D Expense 24$ 25$ 26$ 28$ 29$ 31$ 41$ 45$ 54$ 55$ 65$ 74$ 83$ 93$ 105$ 113$ 121$ 130$ 140$ 150$
Amortization -$ 8$ 14$ 18$ 21$ 24$ 26$ 31$ 36$ 42$ 46$ 53$ 60$ 67$ 76$ 86$ 95$ 103$ 112$ 121$
Ending Balance 24$ 41$ 53$ 64$ 71$ 79$ 93$ 107$ 126$ 139$ 158$ 179$ 202$ 228$ 257$ 284$ 310$ 337$ 364$ 393$
Financial Ratio
R&D Expense-to-Sales Ratio 9.09% 9.29% 8.97% 8.89% 9.32% 8.66% 9.07% 9.02% 9.59% 8.55%
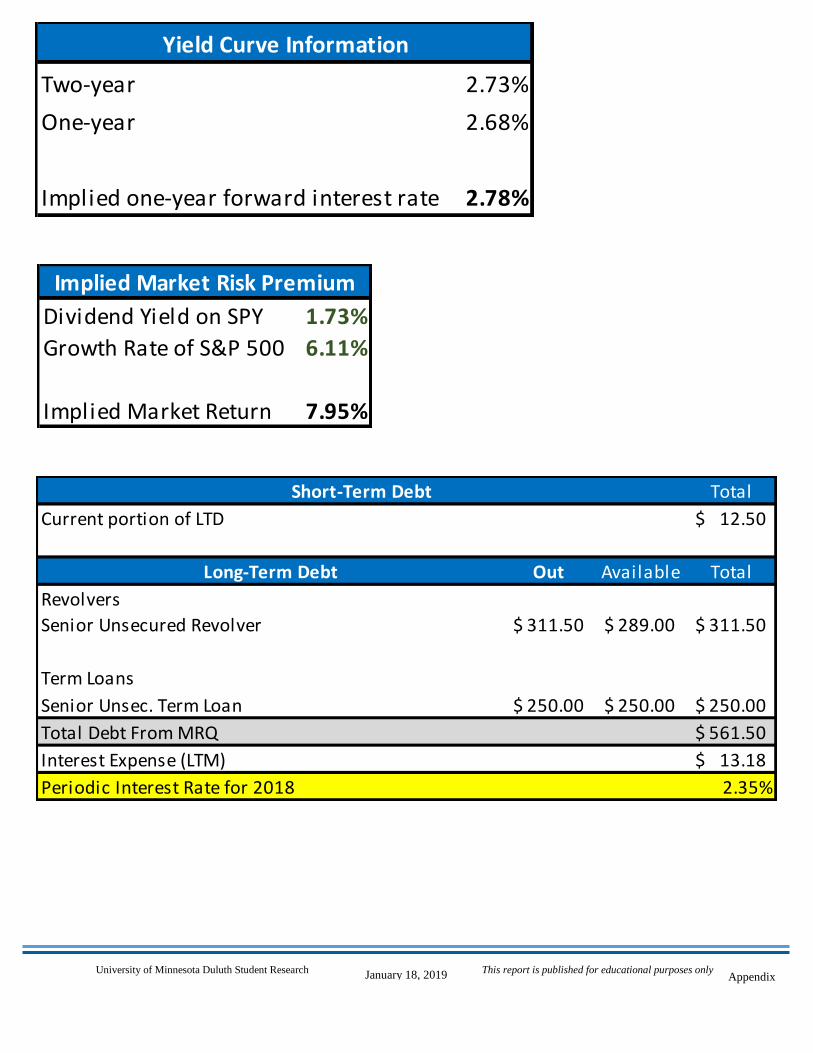
University of Minnesota Duluth Student Research This report is published for educational purposes only
January 18, 2019 Appendix
Short-Term Debt Total
Current portion of LTD 12.50$
Long-Term Debt Out Available Total
Revolvers
Senior Unsecured Revolver 311.50$ 289.00$ 311.50$
Term Loans
Senior Unsec. Term Loan 250.00$ 250.00$ 250.00$
Total Debt From MRQ 561.50$
Interest Expense (LTM) 13.18$
Periodic Interest Rate for 2018 2.35%
Yield Curve Information
Two-year 2.73%
One-year 2.68%
Implied one-year forward interest rate 2.78%
Implied Market Risk Premium
Dividend Yield on SPY 1.73%
Growth Rate of S&P 500 6.11%
Implied Market Return 7.95%
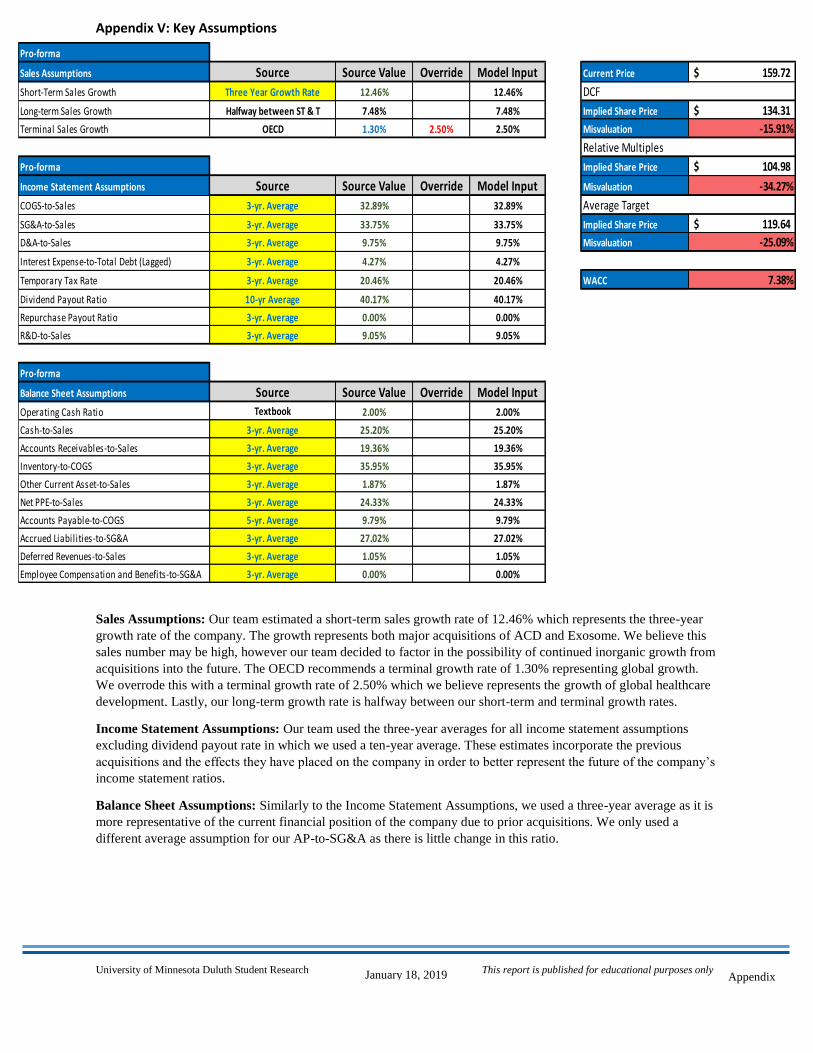
University of Minnesota Duluth Student Research This report is published for educational purposes only
January 18, 2019 Appendix
Appendix V: Key Assumptions
Sales Assumptions: Our team estimated a short-term sales growth rate of 12.46% which represents the three-year
growth rate of the company. The growth represents both major acquisitions of ACD and Exosome. We believe this
sales number may be high, however our team decided to factor in the possibility of continued inorganic growth from
acquisitions into the future. The OECD recommends a terminal growth rate of 1.30% representing global growth.
We overrode this with a terminal growth rate of 2.50% which we believe represents the growth of global healthcare
development. Lastly, our long-term growth rate is halfway between our short-term and terminal growth rates.
Income Statement Assumptions: Our team used the three-year averages for all income statement assumptions
excluding dividend payout rate in which we used a ten-year average. These estimates incorporate the previous
acquisitions and the effects they have placed on the company in order to better represent the future of the company’s
income statement ratios.
Balance Sheet Assumptions: Similarly to the Income Statement Assumptions, we used a three-year average as it is
more representative of the current financial position of the company due to prior acquisitions. We only used a
different average assumption for our AP-to-SG&A as there is little change in this ratio.
Pro-forma
Sales Assumptions Source Source Value Override Model Input Current Price 159.72$
Short-Term Sales Growth Three Year Growth Rate 12.46% 12.46% DCF
Long-term Sales Growth Halfway between ST & T 7.48% 7.48% Implied Share Price 134.31$
Terminal Sales Growth OECD 1.30% 2.50% 2.50% Misvaluation -15.91%
Relative Multiples
Pro-forma Implied Share Price 104.98$
Income Statement Assumptions Source Source Value Override Model Input Misvaluation -34.27%
COGS-to-Sales 3-yr. Average 32.89% 32.89% 2 Average Target
SG&A-to-Sales 3-yr. Average 33.75% 33.75% 3 Implied Share Price 119.64$
D&A-to-Sales 3-yr. Average 9.75% 9.75% 4 Misvaluation -25.09%
Interest Expense-to-Total Debt (Lagged) 3-yr. Average 4.27% 4.27% 5
Temporary Tax Rate 3-yr. Average 20.46% 20.46% 6 WACC 7.38%
Dividend Payout Ratio 10-yr Average 40.17% 40.17% 7
Repurchase Payout Ratio 3-yr. Average 0.00% 0.00% 8
R&D-to-Sales 3-yr. Average 9.05% 9.05% 9
Pro-forma
Balance Sheet Assumptions Source Source Value Override Model Input
Operating Cash Ratio Textbook 2.00% 2.00%
Cash-to-Sales 3-yr. Average 25.20% 25.20% 2
Accounts Receivables-to-Sales 3-yr. Average 19.36% 19.36% 3
Inventory-to-COGS 3-yr. Average 35.95% 35.95% 4
Other Current Asset-to-Sales 3-yr. Average 1.87% 1.87% 5
Net PPE-to-Sales 3-yr. Average 24.33% 24.33% 6
Accounts Payable-to-COGS 5-yr. Average 9.79% 9.79% 7
Accrued Liabilities-to-SG&A 3-yr. Average 27.02% 27.02% 8
Deferred Revenues-to-Sales 3-yr. Average 1.05% 1.05% 9
Employee Compensation and Benefits-to-SG&A 3-yr. Average 0.00% 0.00% 10
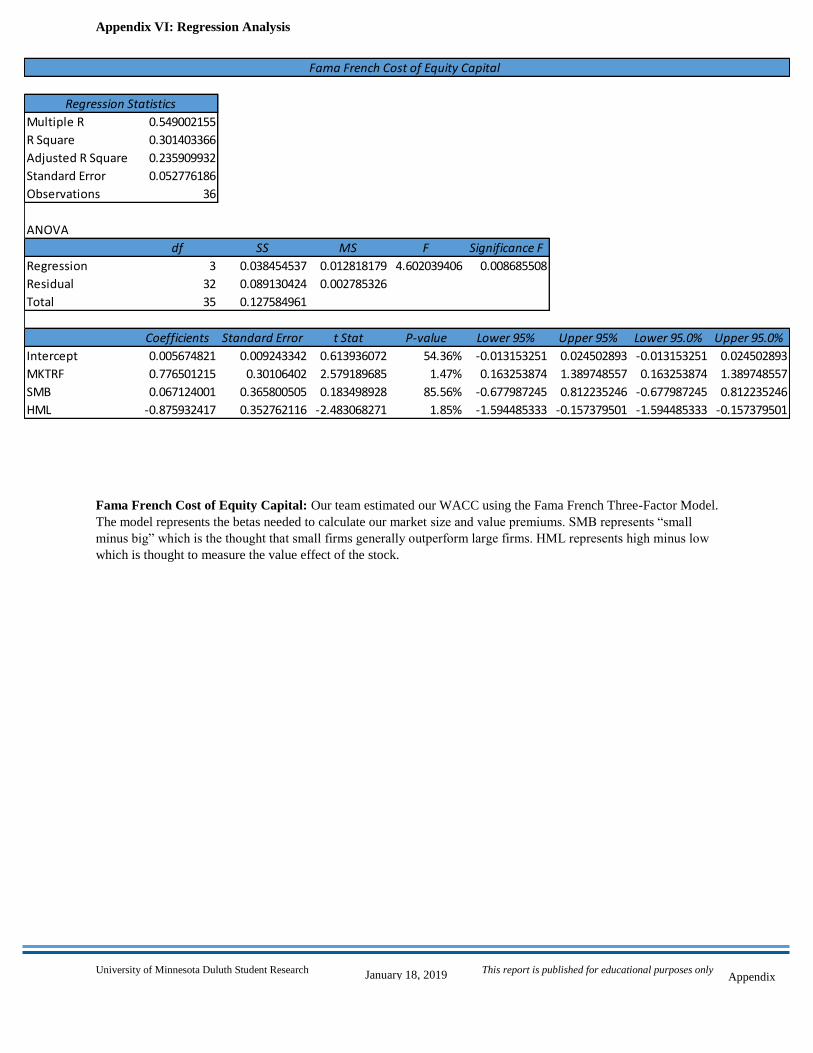
University of Minnesota Duluth Student Research This report is published for educational purposes only
January 18, 2019 Appendix
Appendix VI: Regression Analysis
Fama French Cost of Equity Capital: Our team estimated our WACC using the Fama French Three-Factor Model.
The model represents the betas needed to calculate our market size and value premiums. SMB represents “small
minus big” which is the thought that small firms generally outperform large firms. HML represents high minus low
which is thought to measure the value effect of the stock.
Fama French Cost of Equity Capital
Regression Statistics
Multiple R 0.549002155
R Square 0.301403366
Adjusted R Square 0.235909932
Standard Error 0.052776186
Observations 36
ANOVA
df SS MS F Significance F
Regression 3 0.038454537 0.012818179 4.602039406 0.008685508
Residual 32 0.089130424 0.002785326
Total 35 0.127584961
Coefficients Standard Error t Stat P-value Lower 95% Upper 95% Lower 95.0% Upper 95.0%
Intercept 0.005674821 0.009243342 0.613936072 54.36% -0.013153251 0.024502893 -0.013153251 0.024502893
MKTRF 0.776501215 0.30106402 2.579189685 1.47% 0.163253874 1.389748557 0.163253874 1.389748557
SMB 0.067124001 0.365800505 0.183498928 85.56% -0.677987245 0.812235246 -0.677987245 0.812235246
HML -0.875932417 0.352762116 -2.483068271 1.85% -1.594485333 -0.157379501 -1.594485333 -0.157379501
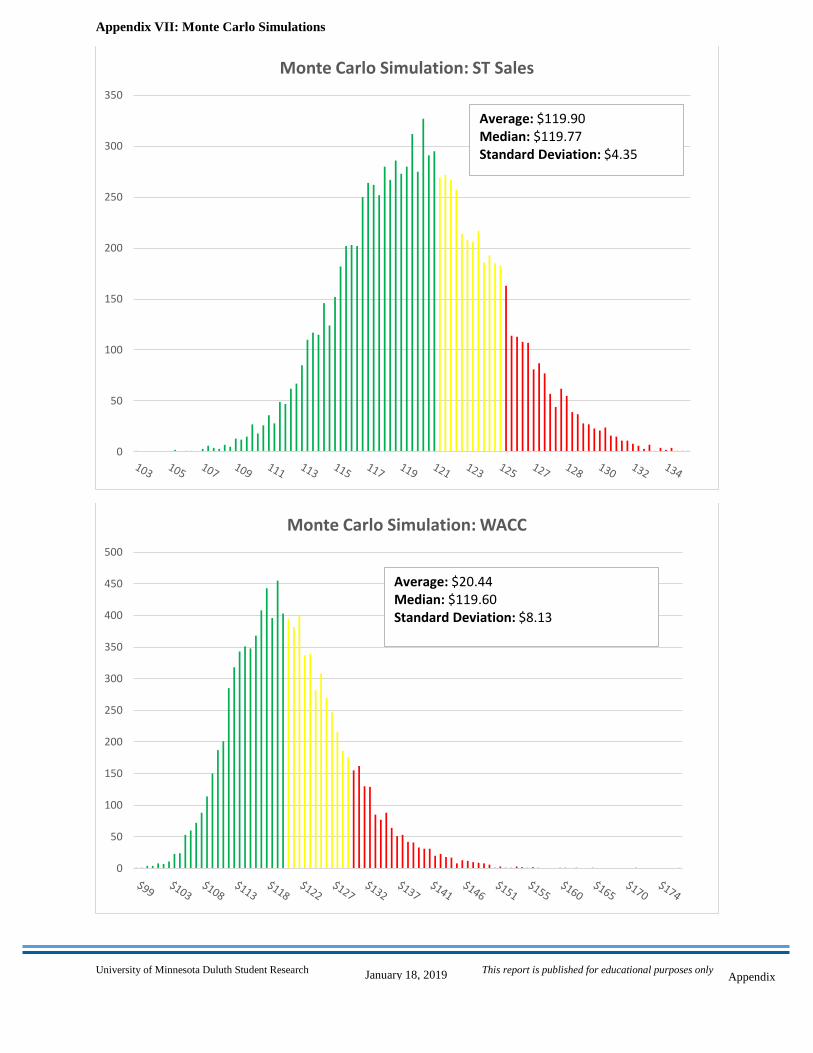
University of Minnesota Duluth Student Research This report is published for educational purposes only
January 18, 2019 Appendix
Appendix VII: Monte Carlo Simulations
0
50
100
150
200
250
300
350
Monte Carlo Simulation: ST Sales
Average: $119.90Median: $119.77Standard Deviation: $4.35
0
50
100
150
200
250
300
350
400
450
500
Monte Carlo Simulation: WACC
Average: $20.44Median: $119.60Standard Deviation: $8.13
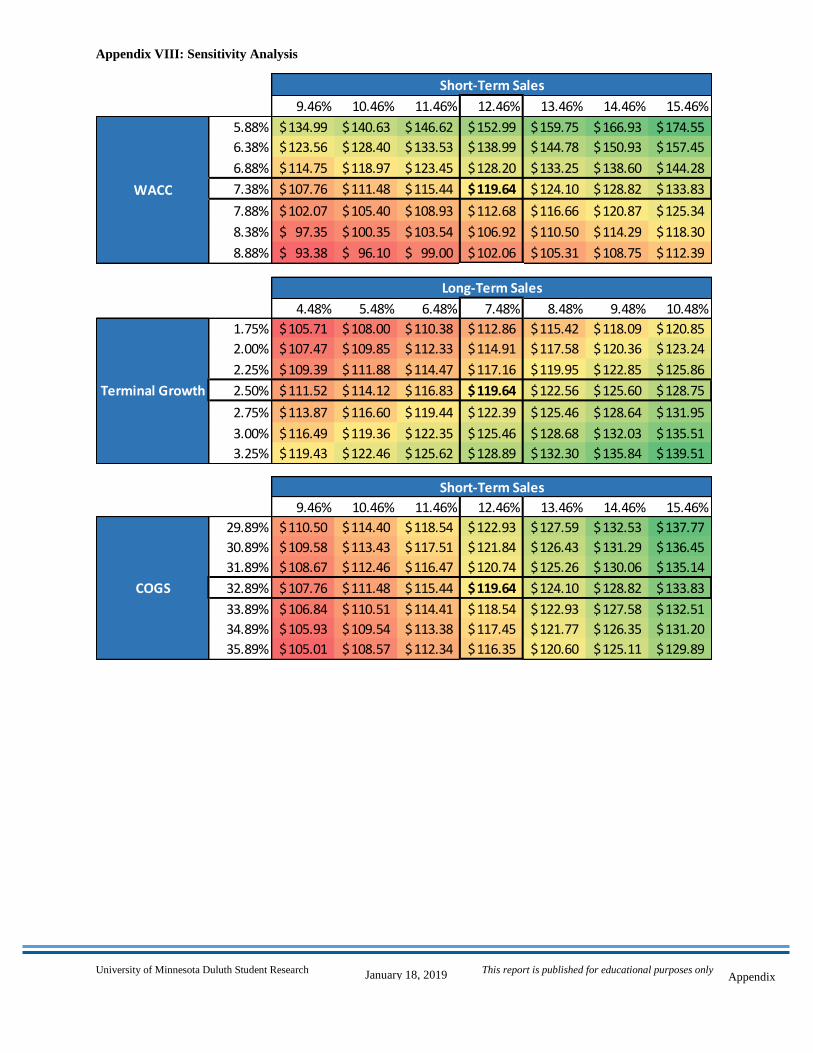
University of Minnesota Duluth Student Research This report is published for educational purposes only
January 18, 2019 Appendix
Appendix VIII: Sensitivity Analysis
119.64$ 9.46% 10.46% 11.46% 12.46% 13.46% 14.46% 15.46%
5.88% 134.99$ 140.63$ 146.62$ 152.99$ 159.75$ 166.93$ 174.55$
6.38% 123.56$ 128.40$ 133.53$ 138.99$ 144.78$ 150.93$ 157.45$
6.88% 114.75$ 118.97$ 123.45$ 128.20$ 133.25$ 138.60$ 144.28$
7.38% 107.76$ 111.48$ 115.44$ 119.64$ 124.10$ 128.82$ 133.83$
7.88% 102.07$ 105.40$ 108.93$ 112.68$ 116.66$ 120.87$ 125.34$
8.38% 97.35$ 100.35$ 103.54$ 106.92$ 110.50$ 114.29$ 118.30$
8.88% 93.38$ 96.10$ 99.00$ 102.06$ 105.31$ 108.75$ 112.39$
WACC
Short-Term Sales
119.64$ 4.48% 5.48% 6.48% 7.48% 8.48% 9.48% 10.48%
1.75% 105.71$ 108.00$ 110.38$ 112.86$ 115.42$ 118.09$ 120.85$
2.00% 107.47$ 109.85$ 112.33$ 114.91$ 117.58$ 120.36$ 123.24$
2.25% 109.39$ 111.88$ 114.47$ 117.16$ 119.95$ 122.85$ 125.86$
2.50% 111.52$ 114.12$ 116.83$ 119.64$ 122.56$ 125.60$ 128.75$
2.75% 113.87$ 116.60$ 119.44$ 122.39$ 125.46$ 128.64$ 131.95$
3.00% 116.49$ 119.36$ 122.35$ 125.46$ 128.68$ 132.03$ 135.51$
3.25% 119.43$ 122.46$ 125.62$ 128.89$ 132.30$ 135.84$ 139.51$
Terminal Growth
Long-Term Sales
119.64$ 9.46% 10.46% 11.46% 12.46% 13.46% 14.46% 15.46%
29.89% 110.50$ 114.40$ 118.54$ 122.93$ 127.59$ 132.53$ 137.77$
30.89% 109.58$ 113.43$ 117.51$ 121.84$ 126.43$ 131.29$ 136.45$
31.89% 108.67$ 112.46$ 116.47$ 120.74$ 125.26$ 130.06$ 135.14$
32.89% 107.76$ 111.48$ 115.44$ 119.64$ 124.10$ 128.82$ 133.83$
33.89% 106.84$ 110.51$ 114.41$ 118.54$ 122.93$ 127.58$ 132.51$
34.89% 105.93$ 109.54$ 113.38$ 117.45$ 121.77$ 126.35$ 131.20$
35.89% 105.01$ 108.57$ 112.34$ 116.35$ 120.60$ 125.11$ 129.89$
COGS
Short-Term Sales
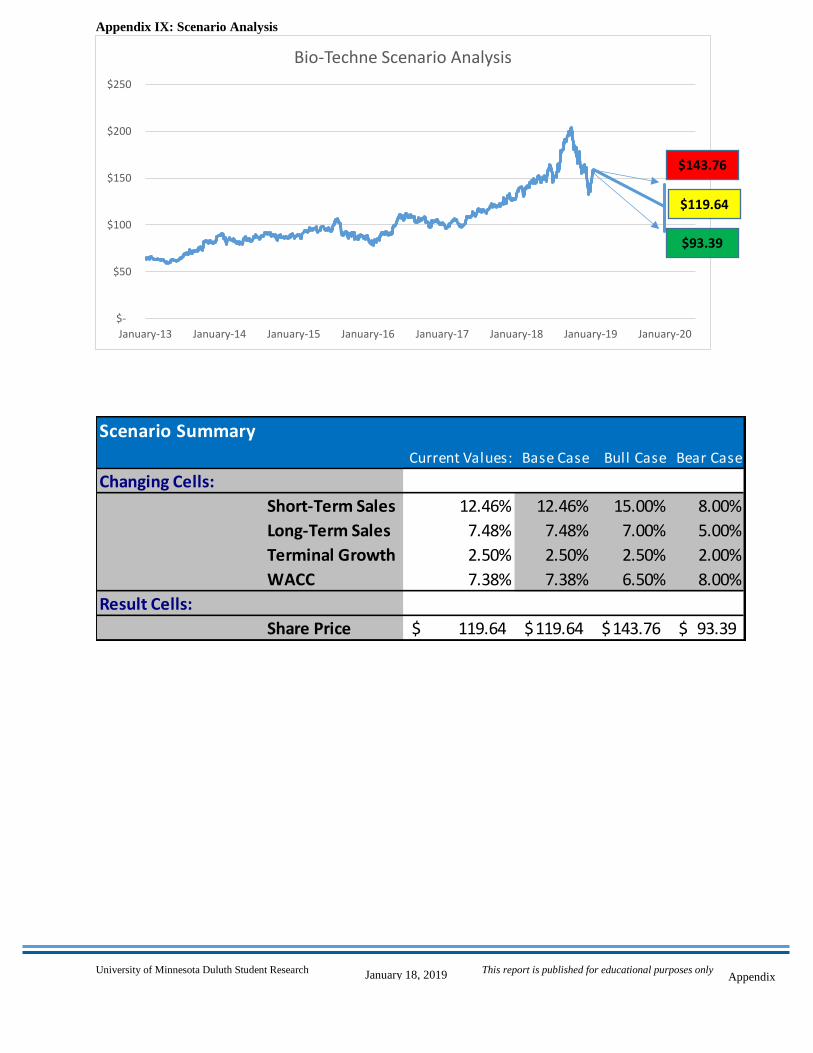
University of Minnesota Duluth Student Research This report is published for educational purposes only
January 18, 2019 Appendix
Appendix IX: Scenario Analysis
$-
$50
$100
$150
$200
$250
January-13 January-14 January-15 January-16 January-17 January-18 January-19 January-20
Bio-Techne Scenario Analysis
Scenario Summary
Current Values: Base Case Bull Case Bear Case
Changing Cells:
Short-Term Sales 12.46% 12.46% 15.00% 8.00%
Long-Term Sales 7.48% 7.48% 7.00% 5.00%
Terminal Growth 2.50% 2.50% 2.50% 2.00%
WACC 7.38% 7.38% 6.50% 8.00%
Result Cells:
Share Price 119.64$ 119.64$ 143.76$ 93.39$
$93.39
$143.76
$119.64
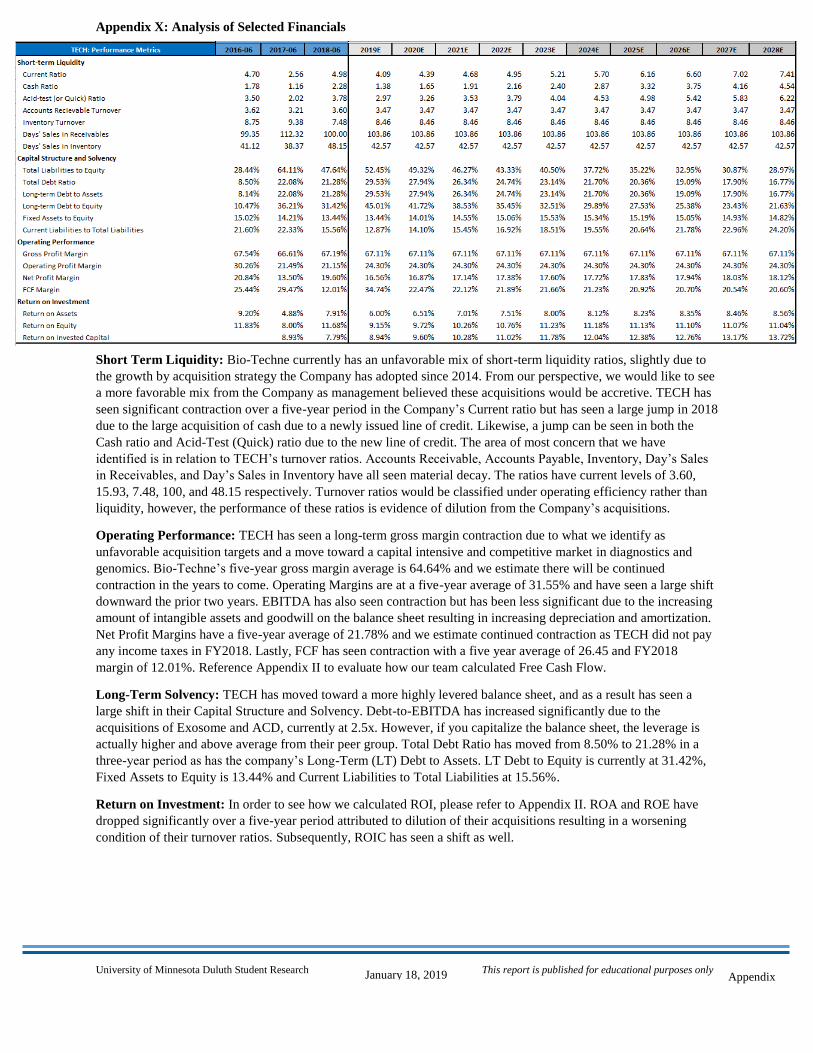
University of Minnesota Duluth Student Research This report is published for educational purposes only
January 18, 2019 Appendix
Appendix X: Analysis of Selected Financials
Short Term Liquidity: Bio-Techne currently has an unfavorable mix of short-term liquidity ratios, slightly due to
the growth by acquisition strategy the Company has adopted since 2014. From our perspective, we would like to see
a more favorable mix from the Company as management believed these acquisitions would be accretive. TECH has
seen significant contraction over a five-year period in the Company’s Current ratio but has seen a large jump in 2018
due to the large acquisition of cash due to a newly issued line of credit. Likewise, a jump can be seen in both the
Cash ratio and Acid-Test (Quick) ratio due to the new line of credit. The area of most concern that we have
identified is in relation to TECH’s turnover ratios. Accounts Receivable, Accounts Payable, Inventory, Day’s Sales
in Receivables, and Day’s Sales in Inventory have all seen material decay. The ratios have current levels of 3.60,
15.93, 7.48, 100, and 48.15 respectively. Turnover ratios would be classified under operating efficiency rather than
liquidity, however, the performance of these ratios is evidence of dilution from the Company’s acquisitions.
Operating Performance: TECH has seen a long-term gross margin contraction due to what we identify as
unfavorable acquisition targets and a move toward a capital intensive and competitive market in diagnostics and
genomics. Bio-Techne’s five-year gross margin average is 64.64% and we estimate there will be continued
contraction in the years to come. Operating Margins are at a five-year average of 31.55% and have seen a large shift
downward the prior two years. EBITDA has also seen contraction but has been less significant due to the increasing
amount of intangible assets and goodwill on the balance sheet resulting in increasing depreciation and amortization.
Net Profit Margins have a five-year average of 21.78% and we estimate continued contraction as TECH did not pay
any income taxes in FY2018. Lastly, FCF has seen contraction with a five year average of 26.45 and FY2018
margin of 12.01%. Reference Appendix II to evaluate how our team calculated Free Cash Flow.
Long-Term Solvency: TECH has moved toward a more highly levered balance sheet, and as a result has seen a
large shift in their Capital Structure and Solvency. Debt-to-EBITDA has increased significantly due to the
acquisitions of Exosome and ACD, currently at 2.5x. However, if you capitalize the balance sheet, the leverage is
actually higher and above average from their peer group. Total Debt Ratio has moved from 8.50% to 21.28% in a
three-year period as has the company’s Long-Term (LT) Debt to Assets. LT Debt to Equity is currently at 31.42%,
Fixed Assets to Equity is 13.44% and Current Liabilities to Total Liabilities at 15.56%.
Return on Investment: In order to see how we calculated ROI, please refer to Appendix II. ROA and ROE have
dropped significantly over a five-year period attributed to dilution of their acquisitions resulting in a worsening
condition of their turnover ratios. Subsequently, ROIC has seen a shift as well.
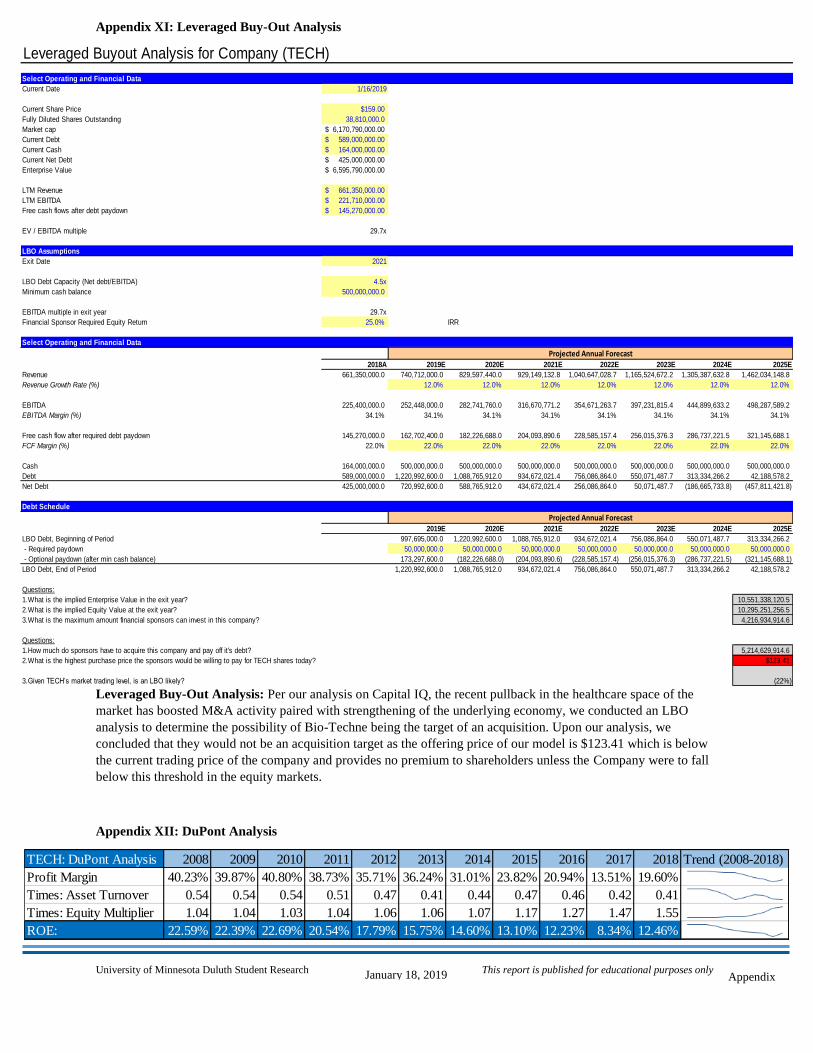
University of Minnesota Duluth Student Research This report is published for educational purposes only
January 18, 2019 Appendix
Appendix XI: Leveraged Buy-Out Analysis
Leveraged Buy-Out Analysis: Per our analysis on Capital IQ, the recent pullback in the healthcare space of the
market has boosted M&A activity paired with strengthening of the underlying economy, we conducted an LBO
analysis to determine the possibility of Bio-Techne being the target of an acquisition. Upon our analysis, we
concluded that they would not be an acquisition target as the offering price of our model is $123.41 which is below
the current trading price of the company and provides no premium to shareholders unless the Company were to fall
below this threshold in the equity markets.
Appendix XII: DuPont Analysis
Leveraged Buyout Analysis for Company (TECH)
Select Operating and Financial Data
Current Date 1/16/2019
Current Share Price $159.00
Fully Diluted Shares Outstanding 38,810,000.0
Market cap 6,170,790,000.00$
Current Debt 589,000,000.00$
Current Cash 164,000,000.00$
Current Net Debt 425,000,000.00$
Enterprise Value 6,595,790,000.00$
LTM Revenue 661,350,000.00$
LTM EBITDA 221,710,000.00$
Free cash flows after debt paydown 145,270,000.00$
EV / EBITDA multiple 29.7x
LBO Assumptions
Exit Date 2021
LBO Debt Capacity (Net debt/EBITDA) 4.5x
Minimum cash balance 500,000,000.0
EBITDA multiple in exit year 29.7x
Financial Sponsor Required Equity Return 25.0% IRR
Select Operating and Financial Data
Projected Annual Forecast2018A 2019E 2020E 2021E 2022E 2023E 2024E 2025E
Revenue 661,350,000.0 740,712,000.0 829,597,440.0 929,149,132.8 1,040,647,028.7 1,165,524,672.2 1,305,387,632.8 1,462,034,148.8
Revenue Growth Rate (%) 12.0% 12.0% 12.0% 12.0% 12.0% 12.0% 12.0%
EBITDA 225,400,000.0 252,448,000.0 282,741,760.0 316,670,771.2 354,671,263.7 397,231,815.4 444,899,633.2 498,287,589.2
EBITDA Margin (%) 34.1% 34.1% 34.1% 34.1% 34.1% 34.1% 34.1% 34.1%
Free cash flow after required debt paydown 145,270,000.0 162,702,400.0 182,226,688.0 204,093,890.6 228,585,157.4 256,015,376.3 286,737,221.5 321,145,688.1
FCF Margin (%) 22.0% 22.0% 22.0% 22.0% 22.0% 22.0% 22.0% 22.0%
Cash 164,000,000.0 500,000,000.0 500,000,000.0 500,000,000.0 500,000,000.0 500,000,000.0 500,000,000.0 500,000,000.0
Debt 589,000,000.0 1,220,992,600.0 1,088,765,912.0 934,672,021.4 756,086,864.0 550,071,487.7 313,334,266.2 42,188,578.2
Net Debt 425,000,000.0 720,992,600.0 588,765,912.0 434,672,021.4 256,086,864.0 50,071,487.7 (186,665,733.8) (457,811,421.8)
Debt Schedule
Projected Annual Forecast2019E 2020E 2021E 2022E 2023E 2024E 2025E
LBO Debt, Beginning of Period 997,695,000.0 1,220,992,600.0 1,088,765,912.0 934,672,021.4 756,086,864.0 550,071,487.7 313,334,266.2
- Required paydown 50,000,000.0 50,000,000.0 50,000,000.0 50,000,000.0 50,000,000.0 50,000,000.0 50,000,000.0
- Optional paydown (after min cash balance) 173,297,600.0 (182,226,688.0) (204,093,890.6) (228,585,157.4) (256,015,376.3) (286,737,221.5) (321,145,688.1)
LBO Debt, End of Period 1,220,992,600.0 1,088,765,912.0 934,672,021.4 756,086,864.0 550,071,487.7 313,334,266.2 42,188,578.2
Questions:
1.What is the implied Enterprise Value in the exit year? 10,551,338,120.5
2.What is the implied Equity Value at the exit year? 10,295,251,256.5
3.What is the maximum amount financial sponsors can invest in this company? 4,216,934,914.6
Questions:
1.How much do sponsors have to acquire this company and pay off it's debt? 5,214,629,914.6
2.What is the highest purchase price the sponsors would be willing to pay for TECH shares today? $123.41
3.Given TECH’s market trading level, is an LBO likely? (22%)
TECH: DuPont Analysis 2008 2009 2010 2011 2012 2013 2014 2015 2016 2017 2018 Trend (2008-2018)
Profit Margin 40.23% 39.87% 40.80% 38.73% 35.71% 36.24% 31.01% 23.82% 20.94% 13.51% 19.60%
Times: Asset Turnover 0.54 0.54 0.54 0.51 0.47 0.41 0.44 0.47 0.46 0.42 0.41
Times: Equity Multiplier 1.04 1.04 1.03 1.04 1.06 1.06 1.07 1.17 1.27 1.47 1.55
ROE: 22.59% 22.39% 22.69% 20.54% 17.79% 15.75% 14.60% 13.10% 12.23% 8.34% 12.46%
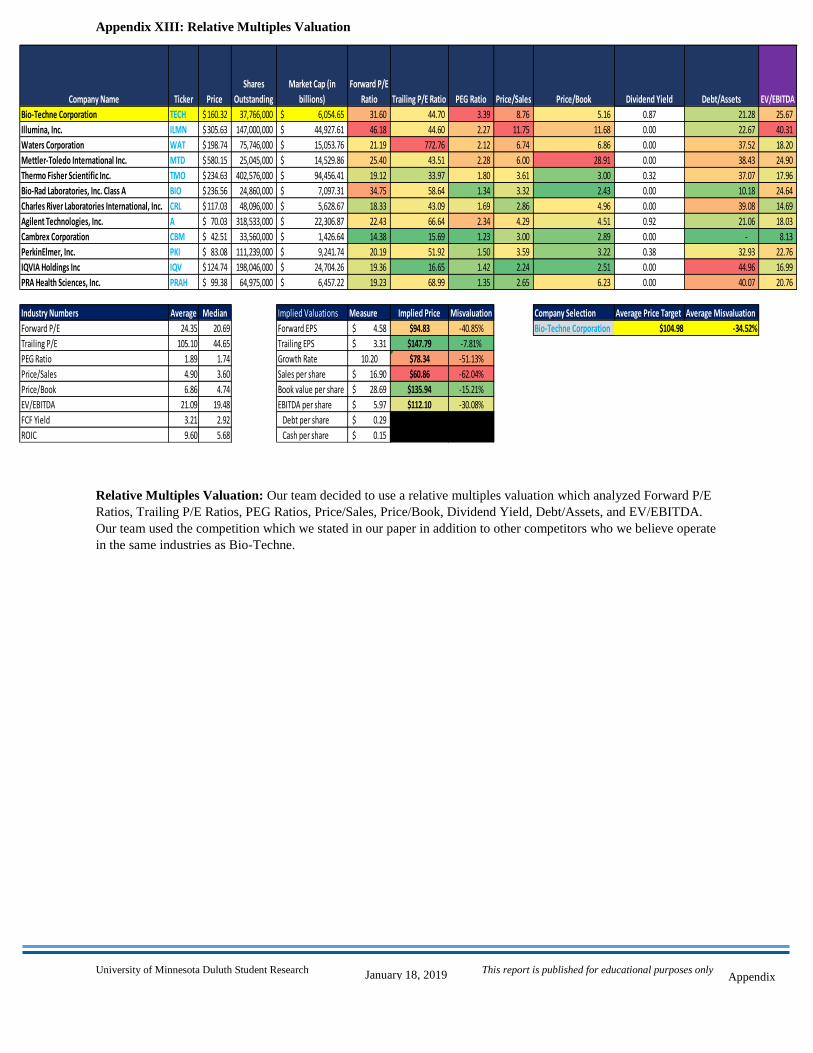
University of Minnesota Duluth Student Research This report is published for educational purposes only
January 18, 2019 Appendix
Appendix XIII: Relative Multiples Valuation
Relative Multiples Valuation: Our team decided to use a relative multiples valuation which analyzed Forward P/E
Ratios, Trailing P/E Ratios, PEG Ratios, Price/Sales, Price/Book, Dividend Yield, Debt/Assets, and EV/EBITDA.
Our team used the competition which we stated in our paper in addition to other competitors who we believe operate
in the same industries as Bio-Techne.
Company Name Ticker Price
Shares
Outstanding
Market Cap (in
billions)
Forward P/E
Ratio Trailing P/E Ratio PEG Ratio Price/Sales Price/Book Dividend Yield Debt/Assets EV/EBITDA
Bio-Techne Corporation TECH 160.32$ 37,766,000 6,054.65$ 31.60 44.70 3.39 8.76 5.16 0.87 21.28 25.67
Illumina, Inc. ILMN 305.63$ 147,000,000 44,927.61$ 46.18 44.60 2.27 11.75 11.68 0.00 22.67 40.31
Waters Corporation WAT 198.74$ 75,746,000 15,053.76$ 21.19 772.76 2.12 6.74 6.86 0.00 37.52 18.20
Mettler-Toledo International Inc. MTD 580.15$ 25,045,000 14,529.86$ 25.40 43.51 2.28 6.00 28.91 0.00 38.43 24.90
Thermo Fisher Scientific Inc. TMO 234.63$ 402,576,000 94,456.41$ 19.12 33.97 1.80 3.61 3.00 0.32 37.07 17.96
Bio-Rad Laboratories, Inc. Class A BIO 236.56$ 24,860,000 7,097.31$ 34.75 58.64 1.34 3.32 2.43 0.00 10.18 24.64
Charles River Laboratories International, Inc. CRL 117.03$ 48,096,000 5,628.67$ 18.33 43.09 1.69 2.86 4.96 0.00 39.08 14.69
Agilent Technologies, Inc. A 70.03$ 318,533,000 22,306.87$ 22.43 66.64 2.34 4.29 4.51 0.92 21.06 18.03
Cambrex Corporation CBM 42.51$ 33,560,000 1,426.64$ 14.38 15.69 1.23 3.00 2.89 0.00 - 8.13
PerkinElmer, Inc. PKI 83.08$ 111,239,000 9,241.74$ 20.19 51.92 1.50 3.59 3.22 0.38 32.93 22.76
IQVIA Holdings Inc IQV 124.74$ 198,046,000 24,704.26$ 19.36 16.65 1.42 2.24 2.51 0.00 44.96 16.99
PRA Health Sciences, Inc. PRAH 99.38$ 64,975,000 6,457.22$ 19.23 68.99 1.35 2.65 6.23 0.00 40.07 20.76
Industry Numbers Average Median Implied Valuations Measure Implied Price Misvaluation Company Selection Average Price Target Average Misvaluation
Forward P/E 24.35 20.69 Forward EPS 4.58$ $94.83 -40.85% Bio-Techne Corporation $104.98 -34.52%
Trailing P/E 105.10 44.65 Trailing EPS 3.31$ $147.79 -7.81%
PEG Ratio 1.89 1.74 Growth Rate 10.20 $78.34 -51.13%
Price/Sales 4.90 3.60 Sales per share 16.90$ $60.86 -62.04%
Price/Book 6.86 4.74 Book value per share 28.69$ $135.94 -15.21%
EV/EBITDA 21.09 19.48 EBITDA per share 5.97$ $112.10 -30.08%
FCF Yield 3.21 2.92 Debt per share 0.29$
ROIC 9.60 5.68 Cash per share 0.15$
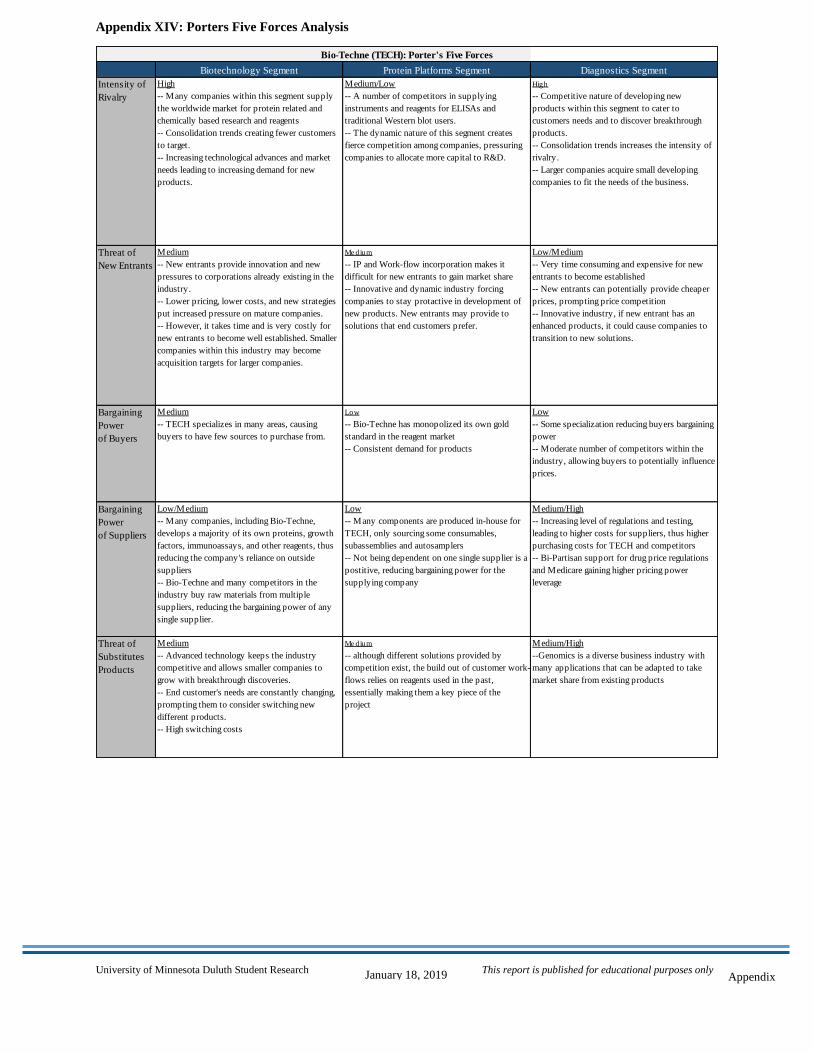
University of Minnesota Duluth Student Research This report is published for educational purposes only
January 18, 2019 Appendix
Appendix XIV: Porters Five Forces Analysis
Bio-Techne (TECH): Porter's Five Forces
Biotechnology Segment Protein Platforms Segment Diagnostics Segment
Intensity of
Rivalry
High
-- Many companies within this segment supply
the worldwide market for protein related and
chemically based research and reagents
-- Consolidation trends creating fewer customers
to target.
-- Increasing technological advances and market
needs leading to increasing demand for new
products.
Medium/Low
-- A number of competitors in supplying
instruments and reagents for ELISAs and
traditional Western blot users.
-- The dynamic nature of this segment creates
fierce competition among companies, pressuring
companies to allocate more capital to R&D.
High
-- Competitive nature of developing new
products within this segment to cater to
customers needs and to discover breakthrough
products.
-- Consolidation trends increases the intensity of
rivalry.
-- Larger companies acquire small developing
companies to fit the needs of the business.
Threat of
New Entrants
Medium
-- New entrants provide innovation and new
pressures to corporations already existing in the
industry.
-- Lower pricing, lower costs, and new strategies
put increased pressure on mature companies.
-- However, it takes time and is very costly for
new entrants to become well established. Smaller
companies within this industry may become
acquisition targets for larger companies.
Me dium
-- IP and Work-flow incorporation makes it
difficult for new entrants to gain market share
-- Innovative and dynamic industry forcing
companies to stay protactive in development of
new products. New entrants may provide to
solutions that end customers prefer.
Low/Medium
-- Very time consuming and expensive for new
entrants to become established
-- New entrants can potentially provide cheaper
prices, prompting price competition
-- Innovative industry, if new entrant has an
enhanced products, it could cause companies to
transition to new solutions.
Bargaining
Power
of Buyers
Medium
-- TECH specializes in many areas, causing
buyers to have few sources to purchase from.
Low
-- Bio-Techne has monopolized its own gold
standard in the reagent market
-- Consistent demand for products
Low
-- Some specialization reducing buyers bargaining
power
-- Moderate number of competitors within the
industry, allowing buyers to potentially influence
prices.
Bargaining
Power
of Suppliers
Low/Medium
-- Many companies, including Bio-Techne,
develops a majority of its own proteins, growth
factors, immunoassays, and other reagents, thus
reducing the company's reliance on outside
suppliers
-- Bio-Techne and many competitors in the
industry buy raw materials from multiple
suppliers, reducing the bargaining power of any
single supplier.
Low
-- Many components are produced in-house for
TECH, only sourcing some consumables,
subassemblies and autosamplers
-- Not being dependent on one single supplier is a
postitive, reducing bargaining power for the
supplying company
Medium/High
-- Increasing level of regulations and testing,
leading to higher costs for suppliers, thus higher
purchasing costs for TECH and competitors
-- Bi-Partisan support for drug price regulations
and Medicare gaining higher pricing power
leverage
Threat of
Substitutes
Products
Medium
-- Advanced technology keeps the industry
competitive and allows smaller companies to
grow with breakthrough discoveries.
-- End customer's needs are constantly changing,
prompting them to consider switching new
different products.
-- High switching costs
Me dium
-- although different solutions provided by
competition exist, the build out of customer work-
flows relies on reagents used in the past,
essentially making them a key piece of the
project
Medium/High
--Genomics is a diverse business industry with
many applications that can be adapted to take
market share from existing products
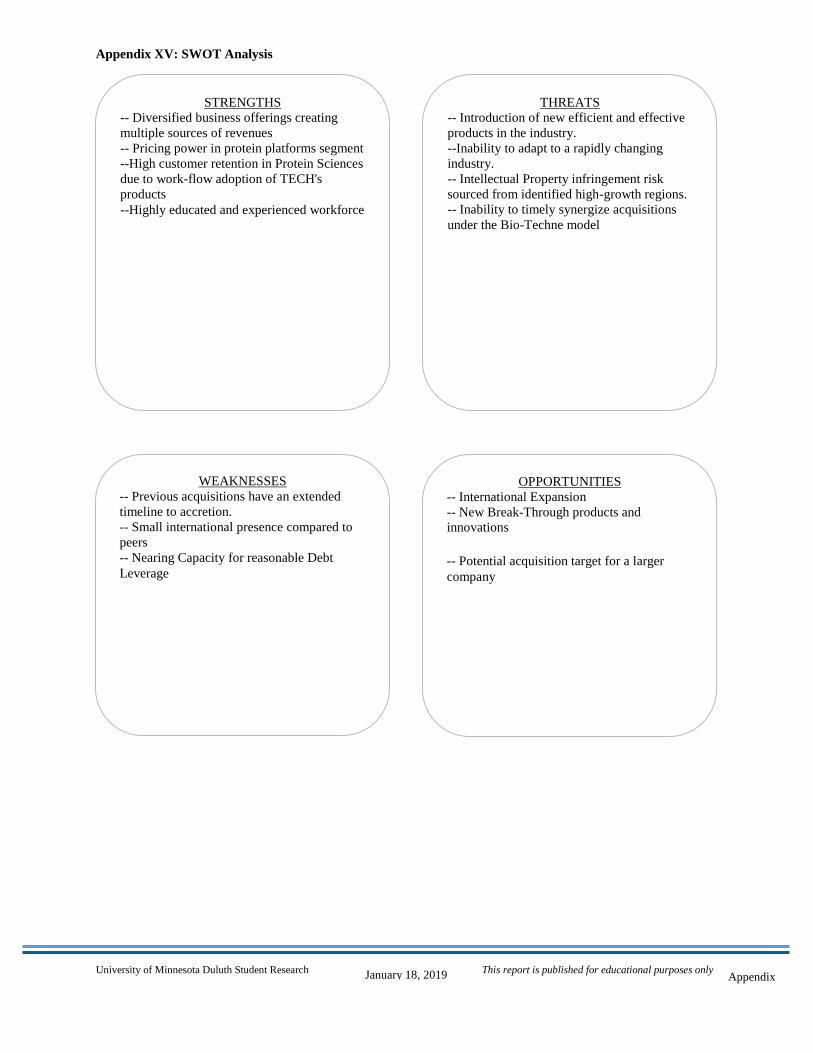
University of Minnesota Duluth Student Research This report is published for educational purposes only
January 18, 2019 Appendix
Appendix XV: SWOT Analysis
STRENGTHS -- Diversified business offerings creating
multiple sources of revenues -- Pricing power in protein platforms segment --High customer retention in Protein Sciences
due to work-flow adoption of TECH's
products --Highly educated and experienced workforce
THREATS -- Introduction of new efficient and effective
products in the industry. --Inability to adapt to a rapidly changing
industry. -- Intellectual Property infringement risk
sourced from identified high-growth regions. -- Inability to timely synergize acquisitions
under the Bio-Techne model
OPPORTUNITIES -- International Expansion -- New Break-Through products and
innovations -- Potential acquisition target for a larger
company
WEAKNESSES -- Previous acquisitions have an extended
timeline to accretion. -- Small international presence compared to
peers -- Nearing Capacity for reasonable Debt
Leverage
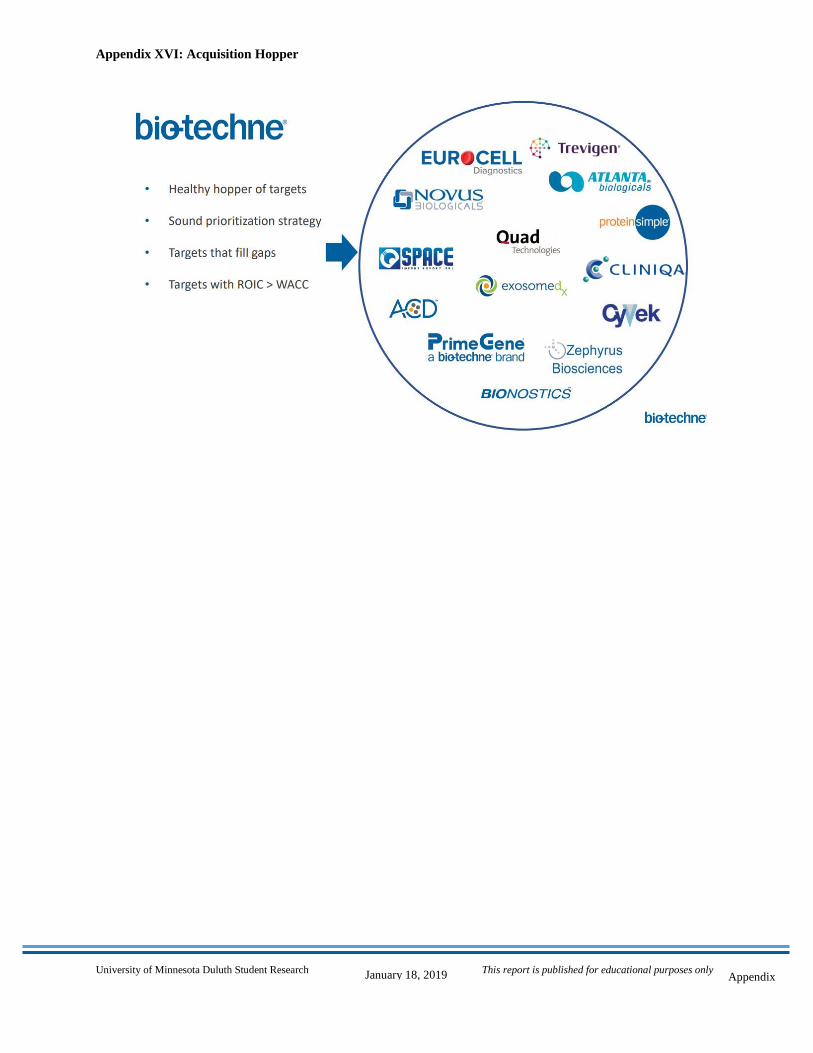
University of Minnesota Duluth Student Research This report is published for educational purposes only
January 18, 2019 Appendix
Appendix XVI: Acquisition Hopper
University of Minnesota Duluth Student Research This report is published for educational purposes only
January 18, 2019 Appendix
Appendix XVII: Works Cited
(1) Bio-Techne Corporation (2018, 09-10) Investor Relations, Last Retrieved 1/15/2019,
https://investors.bio-techne.com/
(2) Federal Reserve. (2018, 12-15) Press Release Meeting, Retrieved from,
https://www.federalreserve.gov/monetarypolicy/fomccalendars.htm
(3) Bloomberg Terminal
(4) Thomson Reuters
(5) Capital IQ Research and Company Viewer
(6) Factset.com
(7) Congress.Gov (12/20/2017). U.S. Tax Cuts and Jobs Act. (01/03/2018). Retrieved from
https://www.congress.gov/bill/115thcongress/house-bill/1/text
(8) U.S. Department of the Treasury (web). Treasury Yields (01/11/2018). Retrieved
https://www.treasury.gov/resourcecenter/data-chart-center/interest-rates/Pages/Historic-Yield-Data-
Visualization.aspx
(9) Google Finance
(10) Yahoo! Finance
(11) Morningstar
(12) Value Line
(13) Moody’s
(14) Bio-Techne Management Team
(15) Seeking Alpha
(16) White House (2018, 5-11) President Donald J. Trump’s Blueprint to Lower Drug Prices, Retrieved:
https://www.whitehouse.gov/briefings-statements/president-donald-j-trumps-blueprint-lower-drug-prices/
(17) CMS (2019, 1-3), Proposed Changes to Lower Drug Prices in Medicare Advantage and Part D, Retrieved:
https://www.cms.gov
(18) Stephen, Sunderland. “Innovation in China, “Made in China 2025” and Implications for Healthcare MNCs”
July 2018 Retrieved: https://www.lek.com/sites/default/files/insights/pdf-attachments/Chinas-Healthcare-
Innovation-by-Made-in-China-2025-and-Implications-for-MNCs_JUL06.pdf
(19) Securities and Exchange Commission (01/2019), EDGAR Filing System, Retrieved
https://www.sec.gov/cgi-bin/browse-edgar?company=tech&owner=exclude&action=getcompany
(20) Derik de Bruin, Michael Ryskin, Juan E. Avendaro, Ivy Ma, “2019 Year Ahead: Solid Growth still
expected for Tools; Dx still a mixed bag” January 3rd, 2019 Retrieved:
https://rsch.baml.com/r?q=NCAuvJHUDTnk4r1o3c1LbA__&activityid=105149252&id_token=eyJhbGciO
iJFUzI1NiIsImtpZCI6ImJvZmFwaW5ndG9rZW5rZXkifQ.eyJzdWIiOiI1OTY4NzU1MjkiLCJhdWQiOiJy
c2NoLmJhbWwuY29tIiwib3JnX2lkIjoiIiwiaXNzIjoiaHR0cHM6Ly9mZWRzc28tZGV2LmJhbmtvZmFtZ
XJpY2EuY29tIiwiZW50aXR5aWQiOiIiLCJleHAiOjE1NDcyMjU2NDcsImlhdCI6MTU0NzIyNTM0Nyw
iY2xpZW50X2lkIjoiIn0.nSCmpXaDgeMcvvPxmyB9OG5wr-
pSjRpkuqb2BKcl6zmwrxgsVoi1sbL48SNcApaaduQYwBN3BZUFT9eWX1yxlQ&vk=CAPIQ
(21) Henry J Kaiser Family Foundation (2019, 1-15) Health Policy Research, Retrieved:
https://www.kff.org/global-health-policy/
(22) The Economist, The Economist Special Reports, Retrieved:
https://www.economist.com/sections/special-reports
Disclosures: Ownership and material conflicts of interest
The author(s), or a member of their household, of this report does not hold a financial interest in the securities of this company. The author(s), or a member of their household, of this report does not know of the existence of any conflicts of interest that might bias the content or publication of this report. Receipt of compensation
Compensation of the author(s) of this report is not based on investment banking revenue. Position as an officer or a director
The author(s), or a member of their household, does not serve as an officer, director, or advisory board member of the subject company. Market making
The author(s) does not act as a market maker in the subject company’s securities. Disclaimer
The information set forth herein has been obtained or derived from sources generally available to the public and believed by the author(s) to be reliable, but the author(s) does not make any representation or warranty, express or implied, as to its accuracy or completeness. The information is not intended to be used as the basis of any investment decisions by any person or entity. This information does not constitute investment advice, nor is it an offer or a solicitation of an offer to buy or sell any security. This report should not be considered to be a recommendation by any individual affiliated with CFA Society of Minnesota], CFA Institute, or the CFA Institute Research Challenge with regard to this company’s stock.