Embed Size (px)
Citation preview

CESSE 2005
MEM5:
Survey Design: Best Practices
Kevin WhortonWhorton Marketing & Research10798 Symphony WayColumbia, MD [email protected]

Conducting and Analyzing SurveysCESSE 2005 Whorton Marketing & Research
______________________________________________________________________
Sources of Information
Association Marketing Program
FormalInformal
Glo
bal
Needs
Ass
essm
ent
Conference &
Meeting Evaluations
Specialized Studies
Focus groups
Structured
Interviews
User
Feedback
Board/
comm
ittee
feedbackStaff OpinionsKnowledge & history
Membership Database
Queries
Usage Statistics:
Email/Calls
Member/Customer Service
Enviro
nmen
tal
Scans

Conducting and Analyzing SurveysCESSE 2005 Whorton Marketing & Research
______________________________________________________________________
Methodology Choices
Secondary research Understanding the association & membership through
their promotions, sales, history, old studies Qualitative research
Focus groups, personal interviews, face-to-face Quantitative surveys
Samples vs. census Formats: online, print, telephone Sequence of mailings/reminders Testing for bias: unrepresentative results Premiums/incentives for response Length/format of instrument

Conducting and Analyzing SurveysCESSE 2005 Whorton Marketing & Research
______________________________________________________________________
Topical/Type Choices
Member satisfaction Member needs
assessment Non-member/customer
needs Educational
assessment/evaluation Readership surveys Compensation surveys Consumer surveys
Diversity studies Meeting evaluations Industry specific studies Pricing Product development Operating/financial
operations Employee/staff satisfaction Web usage
Source: 2005 ASAE Policies & Procedures survey
Studies most commonly conducted:

Conducting and Analyzing SurveysCESSE 2005 Whorton Marketing & Research
______________________________________________________________________
What Other Associations Do
Administration—Print only or online only (30% each); print/online mix or phone (20% each). Other methods: personal interviews & focus groups (15% each)
Response rates—Average (all methods combined): 42% Online: 21% response Print: 28% response Print with lapsed segment: 31% response Phone: 24% response
Audience—65%/35% split: random sample vs. census Incentives—28% offered a premium to respondents 11% see lower, 32% higher response (remainder split between
about the same and unsure)
Source: July 2005 ASAE Listserver survey (29 associations)

Conducting and Analyzing SurveysCESSE 2005 Whorton Marketing & Research
______________________________________________________________________
Practices of Other Associations (cont’d)
Frequency—Members are most likely to conduct needs assessments about every 2-3 years: 27% do so annually, 15% never and 20% less often than four years
Performance—Associations pleased with their most recent needs assessment (4.2 satisfaction score). Less so with more targeted research (3.7), membership database (3.4), or environmental scans/competitive assessments (3.0)
Analysis—25% looked only at overall membership.60% looked at demographic segments.35% at membership type, 30% at lapsed, and 20% at prospective members

Conducting and Analyzing SurveysCESSE 2005 Whorton Marketing & Research
______________________________________________________________________
Defining Our Needs
Opinions Perceptions Changes of mind/trends Differences across
segments Externalities: other
memberships/value
Decision support Feasibility Verification/validity Link to probable retention Evaluation/growth
potential Incidence/prevalence
Focus on what you need to know:
Compile this into a survey, and you’re done!! :O]
Conducting and Analyzing SurveysCESSE 2005 Whorton Marketing & Research
______________________________________________________________________
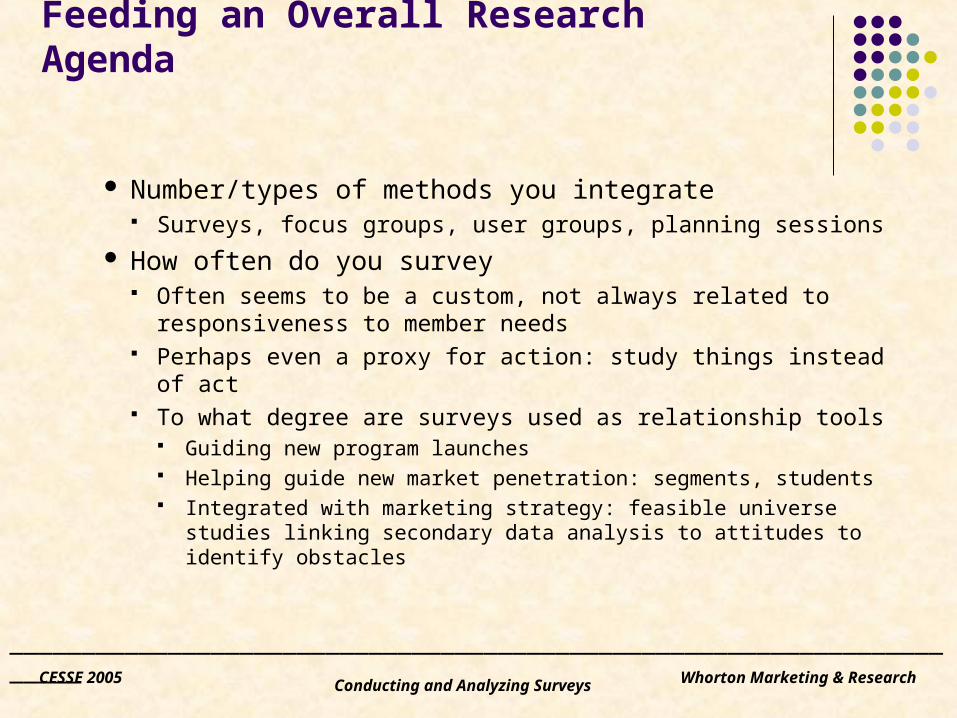
Feeding an Overall Research Agenda
Number/types of methods you integrate Surveys, focus groups, user groups, planning sessions
How often do you survey Often seems to be a custom, not always related to
responsiveness to member needs Perhaps even a proxy for action: study things instead of act To what degree are surveys used as relationship tools
Guiding new program launches Helping guide new market penetration: segments, students Integrated with marketing strategy: feasible universe studies
linking secondary data analysis to attitudes to identify obstacles

Conducting and Analyzing SurveysCESSE 2005 Whorton Marketing & Research
______________________________________________________________________
Qualitative Research
Focus groups Strengths: Good brainstorming/idea formation, concept tests,
good member networking Weaknesses: bias, often done as a convenience sample (i.e.
conference attendees), weak facilitation, insufficient probes, weak group dynamics
Essentials: Recruitment, guide, facilitation Depth interviews
Often more promising: more candid feedback More content per member: 30-45 minutes per person, not 90
minutes divided by 10! Pretesting your instrument
Using members/insiders who understand the profession but aren’t insiders from your process
Conducting and Analyzing SurveysCESSE 2005 Whorton Marketing & Research
______________________________________________________________________
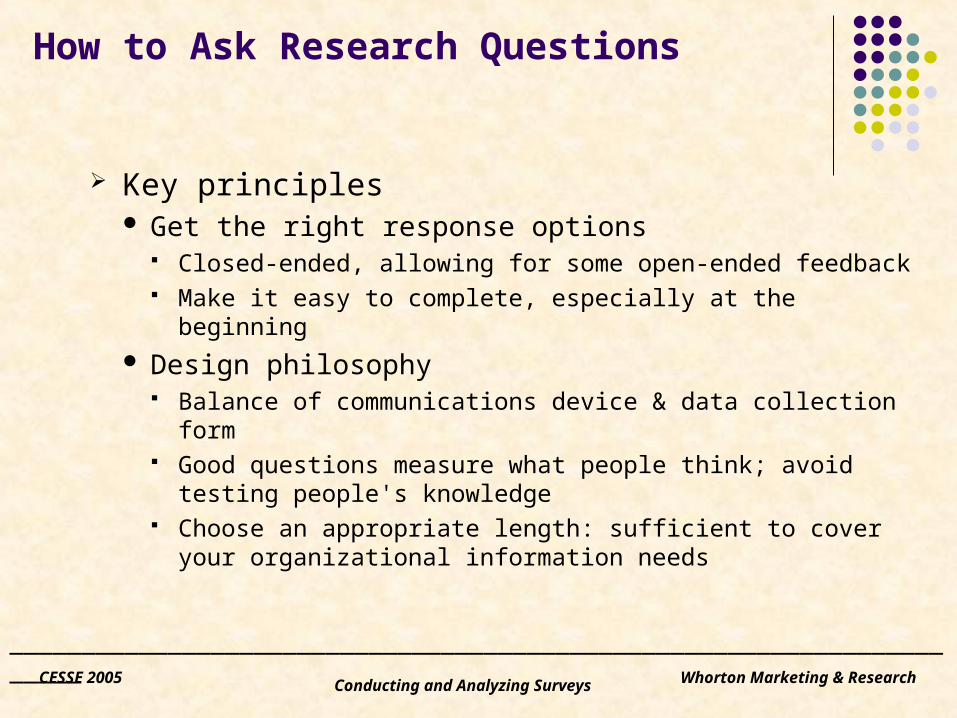
How to Ask Research Questions
Key principles Get the right response options
Closed-ended, allowing for some open-ended feedback Make it easy to complete, especially at the beginning
Design philosophy Balance of communications device & data collection form Good questions measure what people think; avoid testing
people's knowledge Choose an appropriate length: sufficient to cover your
organizational information needs

Conducting and Analyzing SurveysCESSE 2005 Whorton Marketing & Research
______________________________________________________________________
Developing the Survey
Being comprehensive: ensure key points are covered Myth: "if you can't do something about it don't ask" Reality: "I don't trust you if you only ask about happy things"
Order/sequence matters Make it easy to complete the first questions Avoid taking more than 15 minutes: but avoid being too short Use sections to divide content, helps for long needs
assessments

Conducting and Analyzing SurveysCESSE 2005 Whorton Marketing & Research
______________________________________________________________________
Common Survey Mistakes
1) Poor fielding: populist Census rather than a sample: little or no consideration of bias
2) Low response: unclear thought on incentive: “what’s in it for the respondent” and unwillingness to exert effort for high response
3) Poor shelf life: Insufficient use of the study after first presentation: not retaining data for re-use or building on learnings for subsequent studies
4) Surface level analysis: Weak conclusions the err on the side of being “objective” or looking at the trees not the forest
5) Over-focus: Too much emphasis on the global needs assessment and not for specific applications

Conducting and Analyzing SurveysCESSE 2005 Whorton Marketing & Research
______________________________________________________________________
Messaging/Introductions
Phrase communications to elicit a response Bandwagon effect, yet “specialness” of the sample Impart sense of urgent action Repetitive contacts to increase likelihood of participation Use your unique selling proposition in marketing Focus on them—”What’s In It For Me” Offer incentives that matter:
Tangible—summaries Intangible--better decisions
Win trust: cite past successes using information Be conversational & friendly

Conducting and Analyzing SurveysCESSE 2005 Whorton Marketing & Research
______________________________________________________________________
Testing/Mixed Methods
Consider multiple administration methods/vehicles Accept that some are “e-people” and others are print Component: letters, instrument, business reply envelope
Test wherever possible Methods: premium to determine sensitivity Sequence: E-mail first, mail second as followup, phone
followup with hard core nonresponders Analyze respondents by media/source to determine any
real differences in attitudes & behavior

Samples: Question/Item Types
RatingRanking
Forced-ChoiceOpen-ended
Special Applications

Conducting and Analyzing SurveysCESSE 2005 Whorton Marketing & Research
______________________________________________________________________
Ratings/Likert Scale
4. How do you rate the value of OSAP overall, and for each of the following resources? (circle your response)
Very Valuable Somewhat Not at all Valuable
Overall 1 2 3 NA
Infection control guidelines 1 2 3 NA
Position papers 1 2 3 NA
Monthly Focus mailings with C.E. 1 2 3 NA
Quarterly OSAP Report newsletter 1 2 3 NA
OSAP web site 1 2 3 NA
Notes: "Overall" to catch details, often we miss this among the detailed questions Gives us a report card for each service. Report it two ways:
percentages and average scores (more useful if it's a 5-point or a 10-point scale)

Conducting and Analyzing SurveysCESSE 2005 Whorton Marketing & Research
______________________________________________________________________
Ranking
14. What method do you prefer to receive information regarding products, services, and programs? (indicate “#1” for your first choice and so on) Rank#1 #2 #3 E-mails
Fax Mail
Web site Other (specify) _________________________
Notes: Goal is to prioritize: forcing choices between various options Often good for clarifying rating questions: some people are consistent “high scorers”
or “low scorers” and survey findings merely aggregate their tendencies. Both can be cross-tabulated with usage, satisfaction to help explain interest levels
and satisfaction with specific services
Conducting and Analyzing SurveysCESSE 2005 Whorton Marketing & Research
______________________________________________________________________
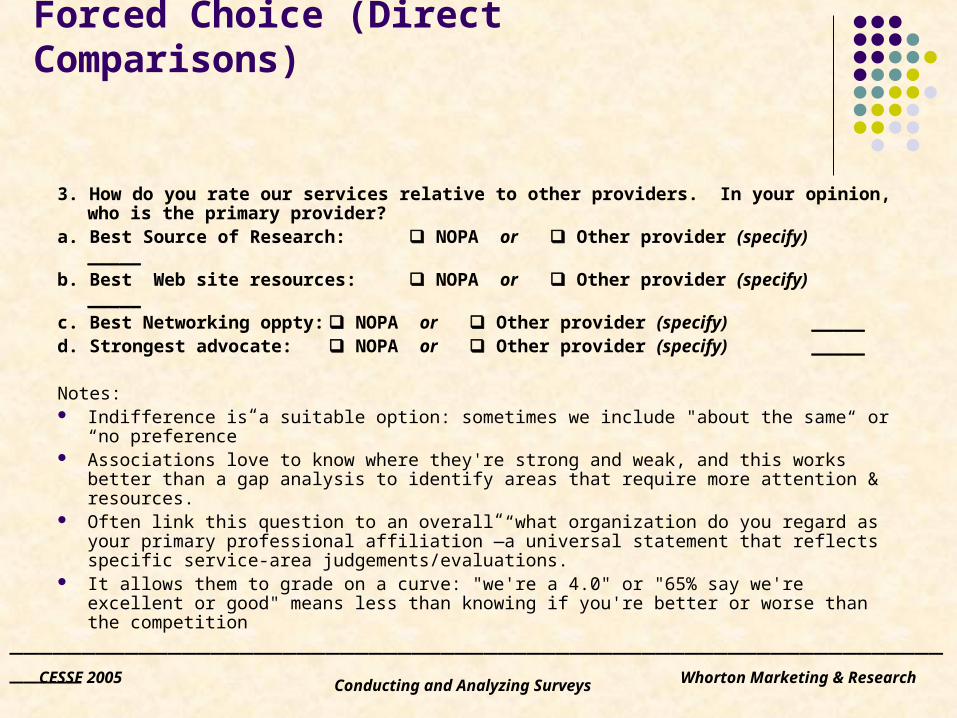
Forced Choice (Direct Comparisons)
3. How do you rate our services relative to other providers. In your opinion, who is the primary provider?
a. Best Source of Research: NOPA or Other provider (specify) _____b. Best Web site resources: NOPA or Other provider (specify) _____c. Best Networking oppty: NOPA or Other provider (specify) _____d. Strongest advocate: NOPA or Other provider (specify) _____
Notes: Indifference is a suitable option: sometimes we include "about the same“ or “no preference” Associations love to know where they're strong and weak, and this works better than a gap
analysis to identify areas that require more attention & resources. Often link this question to an overall “what organization do you regard as your primary
professional affiliation”—a universal statement that reflects specific service-area judgements/evaluations.
It allows them to grade on a curve: "we're a 4.0" or "65% say we're excellent or good" means less than knowing if you're better or worse than the competition

Conducting and Analyzing SurveysCESSE 2005 Whorton Marketing & Research
______________________________________________________________________
Open-ended (Demographics Collection)
1. Approximately how long have you been a registered nurse? ___________ years
2. How long have you worked: for a NOPA member company? ________ years in the industry? ________ years3. What is your approximate age: _______ years
Notes: Open-ended questions for short values get high response; convert to ranges later. Open ended allow for correlation better analysis. can combine average timelines for
those who wait to join/join early, enter mid-career, etc. Critical for operational studies—always want the detailed data point Ranges only necessary when people can’t remember or won’t approximate or you
only need a cross-tab heading or a contingency table “Optional" is a good idea to avoid losing some responses by offending people Convey a better reason than “for statistical purposes“; if no perceived reason,
question level non-response may be as high as 20% Consequently ask these last

Conducting and Analyzing SurveysCESSE 2005 Whorton Marketing & Research
______________________________________________________________________
Open-ended (Long-format)
1. What do you believe to be the top two issues our profession will face over the next 3-5 years?
#1: ______________________________________________________ #2: ______________________________________________________
Notes: We always need to include this kind of question to get at what people think Questions don’t lend themselves to quantification, but … The alternative of closed ended options introduces a bias where you get the answers
you’re looking for Organize open-ended in final report, by theme and general category—too often this
data isn’t misinterpreted, it’s just laid out “objectively” without covering any key issues Recognize that low-involvement people who hold strong opinions but don’t care to
write will drop out of this analysis Don’t overuse, blanks lower the response rate by increasing the perceived difficulty of
completing the survey

Conducting and Analyzing SurveysCESSE 2005 Whorton Marketing & Research
______________________________________________________________________
Feasibility of New Services
1. What is your interest in using each of the following potential new services that we are currently in the stages of evaluating?
A. Certified Advanced Practice Nurse (CAPN)—A certification program featuring an examination for your field of specialty nursing practice, developed by a committee of practicing nurses. Recertification would be required to ensure expertise and familiarity with current practice. Extremely interested Somewhat interested Not interested
2. Of the three services concepts above:Which one offers you the greatest value? #1 _____ (enter A,B or C)Which one offers you the second greatest value? #2 _____
Notes: Hard to interpret/assess feasibility: strategic responses, gaps between what people
say and do. Ensure that multiple concepts force prioritization among members. Keep responses simple and description complex to ensures clients know what was
evaluated and have an unambiguous basis for projecting future behavior. First cut or litmus test. Analyze for profile of interested members

Conducting and Analyzing SurveysCESSE 2005 Whorton Marketing & Research
______________________________________________________________________
Perceived Value/Price-Sensitivity
9. What are each of the following services worth to you if you had to pay for them separately?A. All print and electronic newsletters $ ____________ or ZeroB. Key research study reports $ ____________ or ZeroC. Access to content on assn-net.org Web site $ ____________ or ZeroD. Access to unique industry education programs $ ____________ or ZeroE. Government advocacy programs $ ____________ or Zero
Notes: • These techniques allow us to get at issues otherwise explored in focus groups• Try to quantify things that people don’t share very often• Analysis often sums the responses and compares to actual price paid (i.e. dues)• More complex methods might include tradeoff analysis (good for small scale new product/service development studies: when including features and effect on pricing becomes important).

Analyzing Surveys: Beyond Quantification
Processing Steps
Tools: Cross-tabs & Graphics
Sample Interpretation/Conclusions
Kevin WhortonWhorton Marketing & Research10798 Symphony WayColumbia, MD [email protected]

Conducting and Analyzing SurveysCESSE 2005 Whorton Marketing & Research
______________________________________________________________________
Steps in Processing
Data capture: data entry (mail/phone) and/or download (online) Data cleaning/coding: categorical, nesting variables,
consistency checks, coding non-responses as “none” etc. Cross-tabulation: creating a table of column percents and
summary statistics by a variety of “banner variables” Verbatims: spell check/editing, categorizing text by theme Narrative report: writing the “sports story” narrative Presentation graphics: bar/pie charts for all questions Full report: importing tables and charts, appending verbatims
and questionnaire

Conducting and Analyzing SurveysCESSE 2005 Whorton Marketing & Research
______________________________________________________________________
Measuring Bias: Projection Comparisons
Technique: Calculate percentage responding “used service,”
“attend every year,” “attended last year” Multiply proportion across the overall membership
to project total showing behavior If proportions vary
substantially across member segments, adjust accordingly
Compare to actual figures: higher or lower than the 7,200 total in our example?
Common Variables to Test: Average retention/tenure: compare to aveage years of respondent, likelihood of future renewalService Utilization: the proportion who use and who are in Board/committees are often grossly over-represented
Interest Code Description Attending Total
count ID
New Members 12% 3,500 420
Long-time Members 21% 20,000 6,300
Associate Members 8% 6,000 480

Conducting and Analyzing SurveysCESSE 2005 Whorton Marketing & Research
______________________________________________________________________
Cross-Tabulations
Probable Effect of a Dues Increase 2004: YEARS OF EXPERIENCE
A.$170 - $10 increase Overall 0-5 6-10 11-20 >20
Considerable negative 3% 6% 3% 3%
Some effect 19% 24% 15% 17% 18%
No effect 79% 70% 82% 83% 78%
B.$185 - $25 increase
Considerable negative 19% 29% 21% 16% 12%
Some effect 51% 52% 52% 50% 52%
No effect 29% 19% 26% 34% 36%
C.$210 - $50 increase
Considerable negative 68% 76% 72% 62% 65%
Some effect 25% 20% 23% 27% 27%
No effect 7% 4% 5% 10% 8%
Basic tool is irreplaceable. This chart shows column percentages and demonstrates how a key factor (price sensitivity) relates to a single key variable that influences it.

Conducting and Analyzing SurveysCESSE 2005 Whorton Marketing & Research
______________________________________________________________________
Pie Charts
Flat rate33%
Sliding scale67%
Dues Structure
Strong competition
16%
One key competitor
20%
No direct competition
64%
Competitive Position in the Industry
Common, overused method of presentation Only works when totals add to 100% Note that differences don’t
jump out: stacked/horizontal bar formats are much more effective
Often good for conveying demographics/descriptive data

Conducting and Analyzing SurveysCESSE 2005 Whorton Marketing & Research
______________________________________________________________________
18%
24%
21%
37%
57%
60%
0% 20% 40% 60%
Other methods
Web site/outbound e-mailmarketing
Exhibits at otherassociations' trade shows
Personal sales visits
Response to incominginquiries
Proactive direct marketing(mail/telemarketing
campaigns)
Pct ofassociations
Horizontal Bar Charts: Single Value
Chart format is more helpful than vertical format, allows longer descriptions.
Tip: Helpful to sort data in ascending order, transpose in Excel, then load into Power Pointdata tables.)

Conducting and Analyzing SurveysCESSE 2005 Whorton Marketing & Research
______________________________________________________________________
39%
20%
23%
31%
17%
12%
11%
29%
9%
8%
0% 10% 20% 30% 40% 50%
Over 70%
50-70%
33-49%
20-33%
under 20%
Long-time Members
Newer Members
Horizontal Bar Charts: Comparative Series
This format shows contrasts between the series Good: visually demonstrates
fluctuations in responses due to filter variables
Outside oralpresentation, may be confusing

Conducting and Analyzing SurveysCESSE 2005 Whorton Marketing & Research
______________________________________________________________________
0
10
20
30
40
50
60
70
Assn pct of industry
Top 10 companies
Difference
Assn pct of industry 61 54 70 58 62 60
Top 10 companies 51 42 54 51 57 36
Difference 10 12 17 7 6 24
Overall Small Medium LargeLow
GrowHigh Grow
Median pct share (computed from ranges)
Charting with Detailed Data: Telling Two Stories
This format uses the graphic as a prop and the data tells the story: good for operational studies

Conducting and Analyzing SurveysCESSE 2005 Whorton Marketing & Research
______________________________________________________________________
Total in Profession
Aware
UsersMembers
Alternative Visualization
Example:Total in profession: 35,000Level of awareness: 30% unaided, 50% aidedTotal current members: 5,500Total “users”: 9,500 (members, conference attendees, product purchasers, recent lapses)
Prognosis: Good pool for membership acquisition with non-member “users”-4,000 potential
Need to raise awareness overall and among those who “know” you but lack top of mind recall.
Membership penetration of 16%:may indicate issues with offer, past marketing: needs clarification.

Conducting and Analyzing SurveysCESSE 2005 Whorton Marketing & Research
______________________________________________________________________
Non Graphical Comparisons
Summarize diverse data in considerable detail. The statistical equivalent of the narrative Executive Summary.
Profile of responding associations:Average size association Mean MedianTotal general members 1,967 540Total associate members 309 108Budget size $4.91M $2.20M
Mean percent of total income: Today 5 yrs agoGeneral/primary member dues 42.0% 45.4%Associate/affiliate member dues 8.2% 8.7%Exhibit/sponsorship income 20.3% 19.9%All other sources of income 29.5% 26.0%
Average changes over five years: Mean MedianTotal general members 9.6% 0.0%Total associate members 22.0% 2.8%Total budget 53.1% 18.8%
Conducting and Analyzing SurveysCESSE 2005 Whorton Marketing & Research
______________________________________________________________________
11%
12%
13%
16%
27%
33%
34%
37%
38%
50%
50%
32%
0% 20% 40% 60%
Scholarship fund
Insurance programs
University Online
Member advocacy
Tech newsletter
Washington Summary
Compensation Survey
Small Business publication
Financial benchmarking
Weekly News Bulletin
Industry/Products Report
None
Specificservicesused
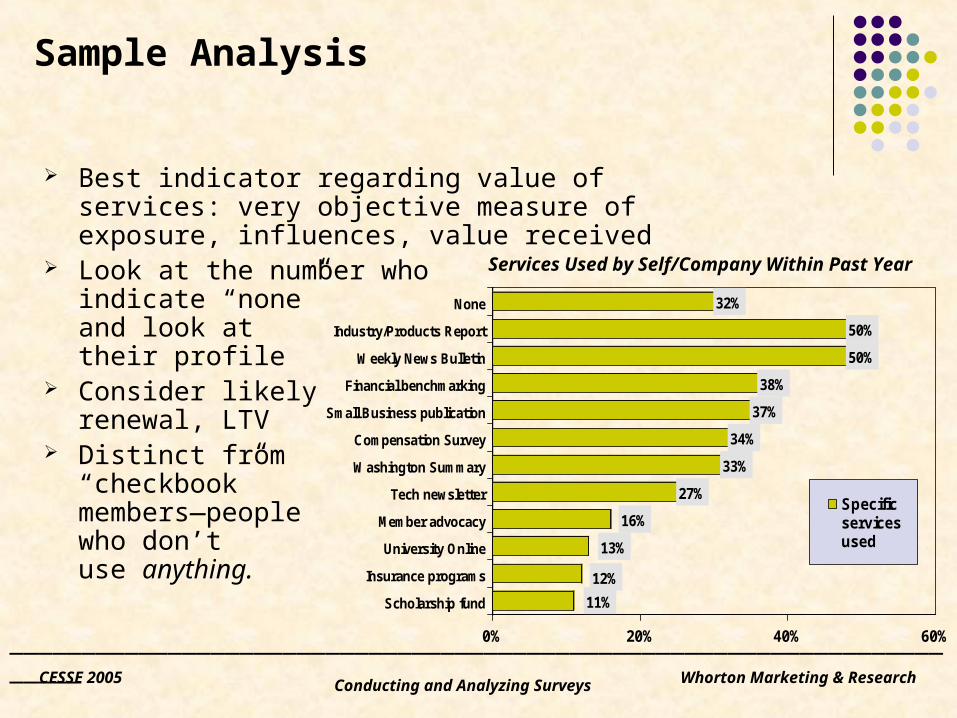
Sample Analysis
Best indicator regarding value of services: very objective measure of exposure, influences, value received
Look at the number who indicate “none” and look at their profile
Consider likely renewal, LTV
Distinct from “checkbook” members—people who don’tuse anything.
Services Used by Self/Company Within Past Year

Conducting and Analyzing SurveysCESSE 2005 Whorton Marketing & Research
______________________________________________________________________
REPORT CARD:How Satisfied Overall
0%
3%
18%
57%
22%
0% 10% 20% 30% 40% 50% 60%
Not satisfied at all
Somewhatdissatisfied
Neither satisfied nordissatisfied
Somewhat satisfied
Extremely satisfied
Basic indicator of overall performance Average compared to averages per service helps to
identify what makes a positive contribution or detracts from overall satisfaction
Very typical to see 3.7 to 4.0 score
Higher among long-term members
Positively related to awareness
Performance by segmentsays a lot about how wellyou represent/servediverse constituencies.

Conducting and Analyzing SurveysCESSE 2005 Whorton Marketing & Research
______________________________________________________________________4.51
4.40
4.13
4.44
4.33
4.13
Treated courteously
Satisfied with info
Call returned/24 hrs
MEMBER SERVICES& SUBS.
Treated courteously
Satisfied with info
Call returned/24 hrs
MEETINGS
SATISFACTION: Quality of Service
Often helpful for scorecarding with big problem: self-selection
People who complete thesetypically say good things
Similar to judging speakers solely on wirtten evals
Someone who cleans the room still gets high marksfrom the survivors.

Conducting and Analyzing SurveysCESSE 2005 Whorton Marketing & Research
______________________________________________________________________
12% 7% 17%
7% 13% 27%
14% 17% 19%
18% 42% 18%
49% 21% 14%
0% 20% 40% 60% 80% 100%
DM listserver
Online directory
Regional meetings
Case Study
Benchmarking
First choice Second choice Third choice
PRIORITY OF NEW SERVICES :Percent ranking top, second, third
We can easily tell what is a winner in an environment where we can develop one new service
We can handicap pet projects and board favorites
We can drill down and compare across services
Do the same people rate each one highly?
Any compatibilities/audience synergies for specific services?

Conducting and Analyzing SurveysCESSE 2005 Whorton Marketing & Research
______________________________________________________________________
38% 13% 49%
20% 17% 63%
11% 37% 52%
15% 21% 64%
35% 14% 50%
20% 19% 60%
18% 20% 62%
39% 10% 51%
0% 20% 40% 60% 80% 100%
Best research
Best Web site
Best networking
Best staff training
Best news/information
Best technology information
Best professional education
Best government advocacy
ABWM Other Neither
RELATIVE PERFORMANCE: Rating of Association Relative to Others
Good “bubble burster”: often we’re not strong in the areas we think we are
This takes into account where we begin
Membership penetrationaffects this
Rather than serve as true competitive intelligence:it’s just operational and serves as environmental scan

Conducting and Analyzing SurveysCESSE 2005 Whorton Marketing & Research
______________________________________________________________________
TIME TRENDS: Measures of Performance Over Time
58% 28% 14%
56% 28% 16%
56% 23% 21%
0% 20% 40% 60% 80% 100%
2005
2004
2003
Direct mail MG/PG Other
Need to provide somecontext
Can’t compare how people feel from period to periodby comparing studiesif administration differs
Rather, ask respondents each time how they feel, or what happened now vs. before and maybe vs. future