Embed Size (px)
Citation preview

The California Energy Storage Alliance (CESA) Janice Lin | CESA Co-‐Founder and Director
September 9, 2010
Impera;ve of Energy Storage for Mee;ng California’s Clean Energy Needs Prepared for the Smart Energy Storage Summit San Jose, CA
Overview
» CESA Overview – Why California? » The Market for Grid Connected Energy Storage » Benefits of Energy Storage » Overview of AB 2514 – Why LegislaSon is Necessary
» Other California Energy Storage Regulatory AcSviSes » Summary
1
Expand the role of storage technology to promote the growth of renewable energy and create a cleaner, more affordable and reliable electric system Our Goal:
StrateGen, Douglass & Liddell, and Other Storage Leaders Founded CESA in January 2009
2
Steering CommiNee:
Other Members:

3
Why California?
» ‘FoundaSonal’ LegislaSon § Energy Storage Procurement Targets (AB 2514, introduced) § RPS LegislaSon (SB 722, introduced) § Self-‐GeneraSon IncenSve Program: SGIP (SB 412) § Smart Grid Systems (SB 17) § Global Warming SoluSons Act of 2006 (AB 32) § Solar Energy System IncenSves: CSI (SB 1)
» AcSve regulatory implementaSon of legislaSon at California Public USlity Commission & California Air Resources Board
» IncenSves available for customer sited applicaSons via SGIP: $476M though 2016
» Non-‐Generator ParScipaSon in Ancillary Services Stakeholder Process—California Independent System Operator (CAISO)
» Many California storage projects currently underway (list in appendix)
Energy storage is fundamental to many key California policy ini;a;ves
CESA is driving results-‐oriented change in all of these areas
4
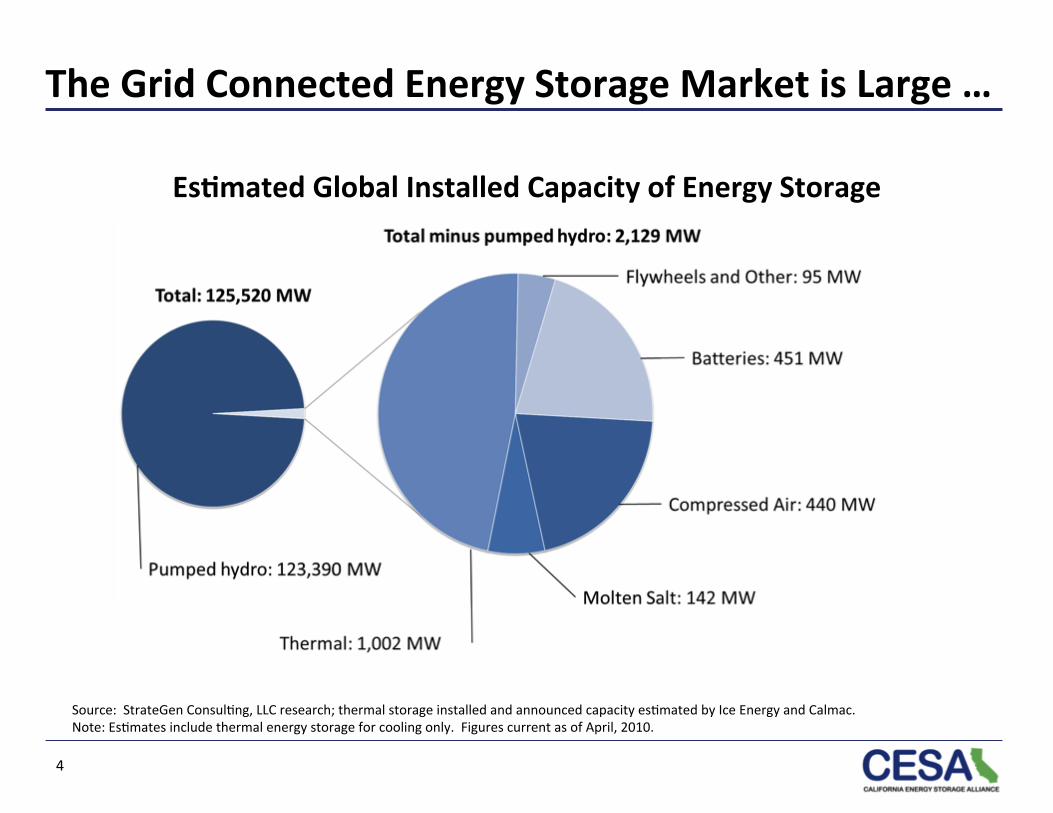
Source: StrateGen ConsulSng, LLC research; thermal storage installed and announced capacity esSmated by Ice Energy and Calmac. Note: EsSmates include thermal energy storage for cooling only. Figures current as of April, 2010.
Es;mated Global Installed Capacity of Energy Storage
The Grid Connected Energy Storage Market is Large …

… and Growing Fast
» Top clean tech investment area in 2009: $320M invested
» Key focus of ARRA sSmulus funding: $185M awarded in 2009 – California received $74M
» Advanced energy storage (AES) capacity will increase by >100% (2,128 MW current, announced new capacity of 2,250 MW)
» New proposals AES projects in California total over 550 MW
» GTM Research forecasts AES market to grow by 40% per annum
Source: StrateGen ConsulSng, LLC research; thermal storage installed and announced capacity esSmated by Ice Energy and Calmac, EsSmates include thermal energy storage for cooling only. Figures current as of March, 2010.
5

6
Key Drivers of Growth for Grid Storage
Smart Grid Renewables Integra;on
Peak Load Growth Transmission Constraints
“Our expecta;on is that this [smart grid] network will be 100 or 1,000 ;mes larger than the Internet” -‐ Cisco, May 2009

Storage is a Necessary Component of Smart Grid
Transmission Operator
Distribution Operator
Load Serving Entity
Substation
Other Substations
Residential Customer Multi-
Dwelling Unit
Industrial Customer
Commercial Customer
Distributed Resources
Microgrid / sustainable communities
Energy Storage
Substation
Microgrid
Commercial & Industrial
Transmission Scale
Residential Source: Diagram courtesy of PG&E
7

Peak vs. Off-‐peak CO2 Emission Rate (Tons/MWh)
Peaker Plant Genera;on – Poor U;liza;on of U;lity Assets
And Higher Emissions
Baseload Genera;on -‐ BeNer Use of U;lity Assets and
Lower Emissions
8
» Percent CO2 / MWh Reduc;on Shining from Peak to Off-‐Peak:
§ SCE: 33% reduc;on § PG&E: 26%
reduc;on § SDG&E: 32%
reduc;on » Also ~56% lower NOx
emissions
E3 Calculator Tons CO2 / MWh
Summer On-Peak
Summer Mid-Peak
Summer Off-Peak
Utility
PG&E 0.67 0.61 0.49
SCE 0.72 0.63 0.49
SDG&E 0.69 0.58 0.47
Another Key Driver: Storage Reduces GHG Emissions
1) Source: Southern California Edison

Source: California Energy Commission California Energy Demand 2008–2018, CEC-‐200-‐2007-‐015-‐SF Note: near term demand may decrease due to recession
Power plant u;liza;on declines
Peak demand grows
9
Statewide Coincident Peak
Peak Has Been Growing & Asset U;liza;on Decreasing

» Energy storage can dampen the volaSlity of energy demand § Reduces T&D losses by as much as 50% § Reduces congesSon and opSmizes grid uSlizaSon § Reduces CO2 and NOx by uSlizing beker heat rate resources § Efficiently stores off-‐peak wind
Storage can Permanently Shin Load Away From Peak Hours and Op;mize our Exis;ng T&D System
Low capacity factor
Low Capacity Factor High Capacity Factor
With energy storage (thermal example) Typical 24 hour load profile
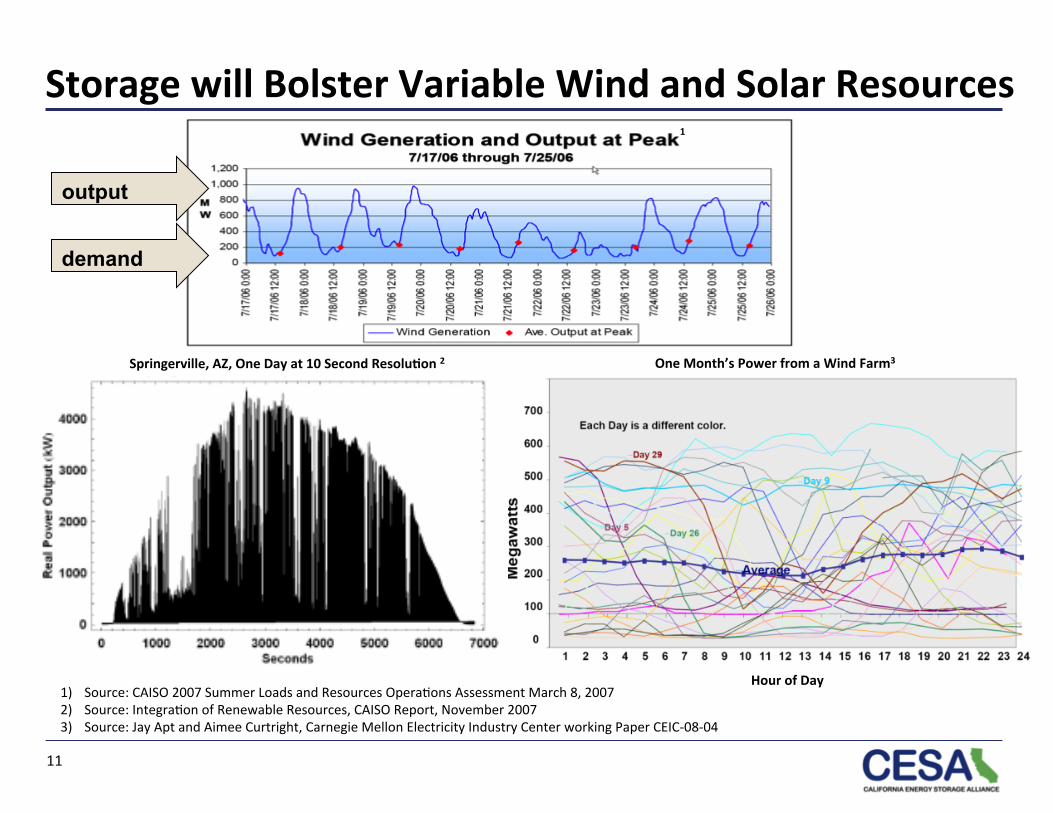
1) Source: CAISO 2007 Summer Loads and Resources OperaSons Assessment March 8, 2007 2) Source: IntegraSon of Renewable Resources, CAISO Report, November 2007 3) Source: Jay Apt and Aimee Curtright, Carnegie Mellon Electricity Industry Center working Paper CEIC-‐08-‐04
11
demand
output
1
One Month’s Power from a Wind Farm3 Springerville, AZ, One Day at 10 Second Resolu;on 2
Hour of Day
Storage will Bolster Variable Wind and Solar Resources

“Enabling technologies such as fuel switching in ‘smart’ appliances, dispatch-‐able load from plug-‐in hybrid or other electric vehicles, or sta;onary energy storage would be required to enable very high levels of PV contribu;on (>20%) to the electric power system”. -‐ NREL Denholm & Margolis, April 2006 “When PV penetra;on reaches sufficiently high levels (e.g., 5 to 20% of total genera;on), the intermiNent nature of PV can begin to have no;ceable, nega;ve effects on the en;re grid” [requiring storage] -‐ US DOE, SEGIS-‐ES, July 2008 “Storage will need to be part of our porwolio if going to 15 to 20 percent wind at a na;onal level, otherwise it won’t be efficient at a lower level and it won’t get us where we want to go environmentally” -‐ Electric Power Research InsOtute, March 2009 “Fast response technologies can reduce the amount of regula;on procurement required – Up to 40% in CAISO” -‐Pacific Northwest NaOonal Lab, June 2008
Experts Agree: Storage Aids Renewable Integra;on
12
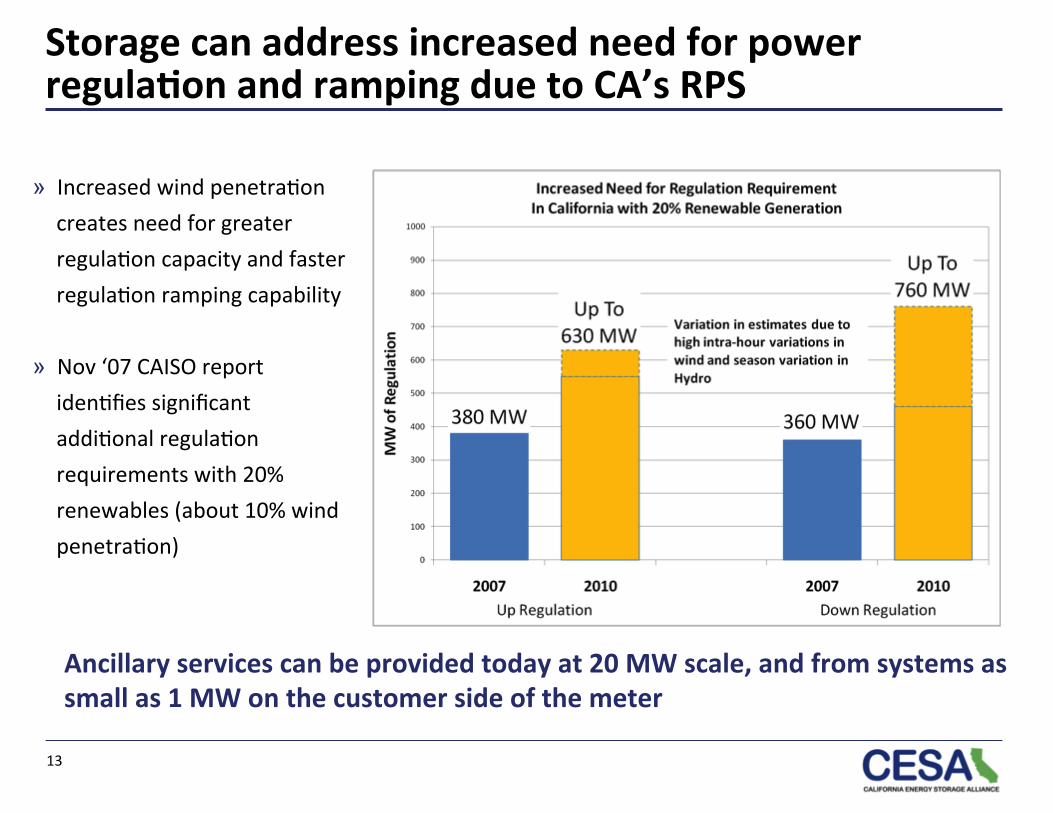
Storage can address increased need for power regula;on and ramping due to CA’s RPS
Ancillary services can be provided today at 20 MW scale, and from systems as small as 1 MW on the customer side of the meter
» Increased wind penetraSon creates need for greater regulaSon capacity and faster regulaSon ramping capability
» Nov ‘07 CAISO report idenSfies significant addiSonal regulaSon requirements with 20% renewables (about 10% wind penetraSon)
13

Typical Summer Daily Demand for CA-‐ISO Region
Demand Curve aoer ImplementaSon of 3,000 MW solar
0 6 12 18 24 24
26
28
30
32
34
36
38
40
42
44
Hour of Day
CA Gen
eraS
on (G
W)
Peak -‐ Shaving Impact of 13 GWh storage
Equivalent to 5 kWh Storage for each kW Installed Solar
Source: EPRI
Storage can shave peak demand synergis;cally with renewables … solar example The chart below demonstrates how distributed energy storage – par;cularly when paired with renewables – can have a significant load shaving impact
14
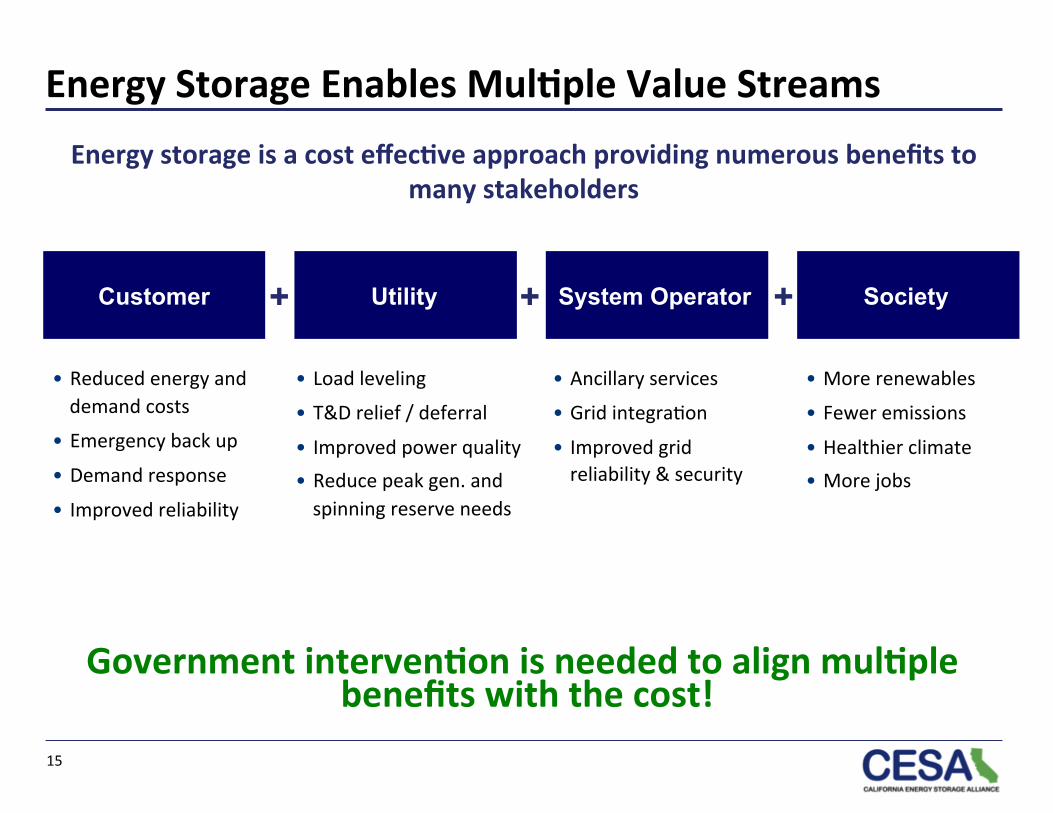
Customer Utility System Operator + +
• Reduced energy and demand costs
• Emergency back up
• Demand response
• Improved reliability
• Load leveling • T&D relief / deferral • Improved power quality • Reduce peak gen. and spinning reserve needs
• Ancillary services • Grid integraSon • Improved grid reliability & security
Society +
• More renewables
• Fewer emissions
• Healthier climate • More jobs
Energy storage is a cost effec;ve approach providing numerous benefits to many stakeholders
Energy Storage Enables Mul;ple Value Streams
15
Government interven;on is needed to align mul;ple benefits with the cost!
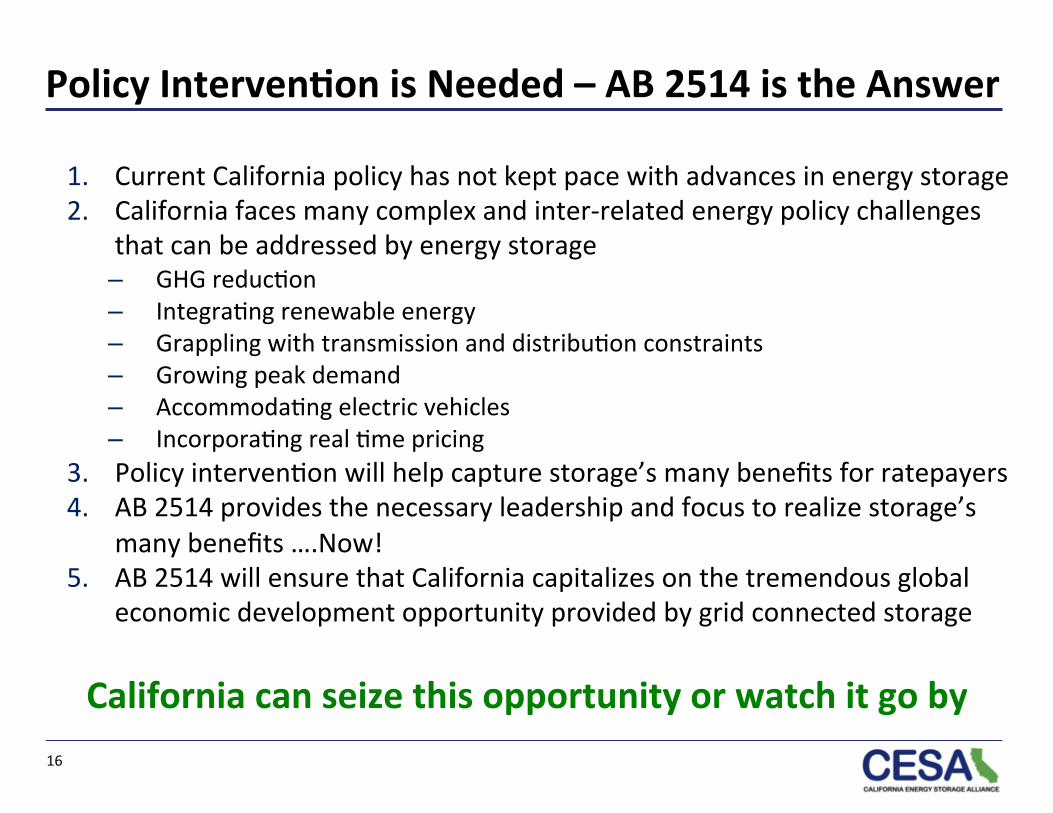
Policy Interven;on is Needed – AB 2514 is the Answer
1. Current California policy has not kept pace with advances in energy storage 2. California faces many complex and inter-‐related energy policy challenges
that can be addressed by energy storage – GHG reducSon – IntegraSng renewable energy – Grappling with transmission and distribuSon constraints – Growing peak demand – AccommodaSng electric vehicles – IncorporaSng real Sme pricing
3. Policy intervenSon will help capture storage’s many benefits for ratepayers 4. AB 2514 provides the necessary leadership and focus to realize storage’s
many benefits ….Now! 5. AB 2514 will ensure that California capitalizes on the tremendous global
economic development opportunity provided by grid connected storage
California can seize this opportunity or watch it go by 16
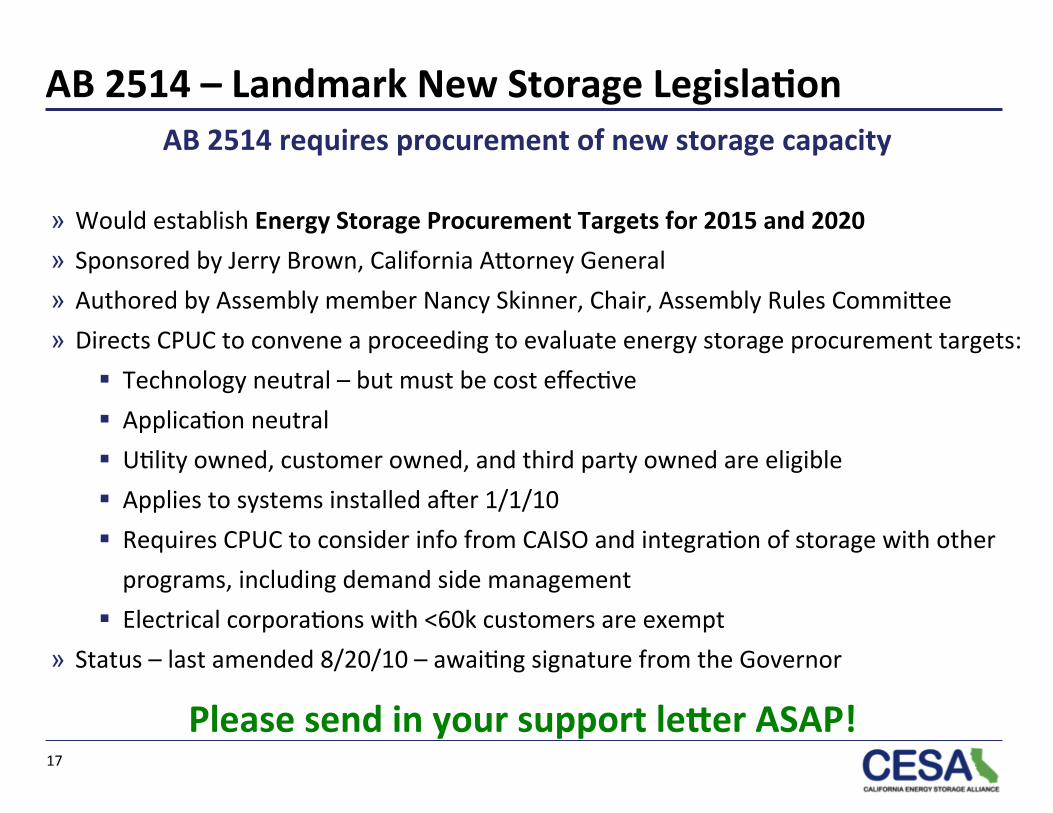
AB 2514 – Landmark New Storage Legisla;on
» Would establish Energy Storage Procurement Targets for 2015 and 2020 » Sponsored by Jerry Brown, California Akorney General » Authored by Assembly member Nancy Skinner, Chair, Assembly Rules Commikee » Directs CPUC to convene a proceeding to evaluate energy storage procurement targets:
§ Technology neutral – but must be cost effecSve § ApplicaSon neutral § USlity owned, customer owned, and third party owned are eligible § Applies to systems installed aoer 1/1/10 § Requires CPUC to consider info from CAISO and integraSon of storage with other programs, including demand side management
§ Electrical corporaSons with <60k customers are exempt » Status – last amended 8/20/10 – awaiSng signature from the Governor
AB 2514 requires procurement of new storage capacity
Please send in your support leNer ASAP! 17

AB 2514 -‐ Diverse Stakeholder Support
18
Attorney General (co-source) Mayor Antonio Villaraigosa A123 Systems AIC Labs Altairnano Applied Intellectual Council Balanced Clean Energy Solutions Beacon Power Breathe California CALMAC California Energy Storage Alliance CAREBS Clean Power Campaign Debenham Energy, LLC Dow Kokam ElectronVault Electricity Storage Association Enersys EnerVault Evapco, Inc. Fafco Fluidic Energy HDR-DTA Green California Ice Energy Independent Energy Producers Large-scale Solar Association LightSail Energy MegaWatt Storage Farm
Mohr Davidow Ventures Natgun NGK-Locke Pacific Housing Inc. Panasonic Pearl Street Liquidity Advisors Polaris Venture Partners PowerGenix Primus Power Prudent Energy PVT Solar ReStore Energy Systems Rockport Capital Partners Saft America, Inc. Sail Venture Partners Samsung SDI America, Inc. Sanyo Seeo, Inc. Sierra Club The Solar Alliance South Coast Air Quality Management District Suntech Sunverge SustainX Velkess Inc. The Vote Solar Initiative Union of Concerned Scientists Wallrich Landi Xtreme Power
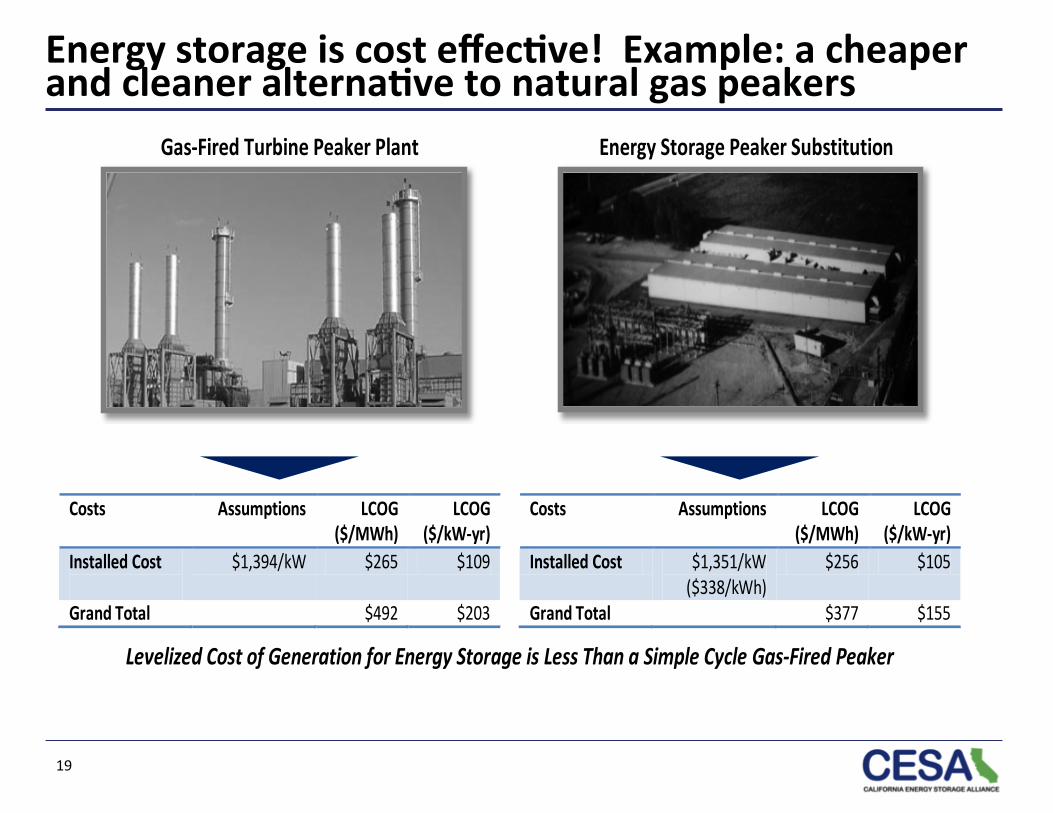
Energy storage is cost effec;ve! Example: a cheaper and cleaner alterna;ve to natural gas peakers
19
Gas-‐Fired Turbine Peaker Plant
Energy Storage Peaker Substitution
Costs Assumptions LCOG
($/MWh) LCOG
($/kW-‐yr) Installed Cost
$1,394/kW $265 $109
Grand Total $492 $203
Costs Assumptions LCOG ($/MWh)
LCOG ($/kW-‐yr)
Installed Cost $1,351/kW ($338/kWh)
$256 $105
Grand Total $377 $155
Levelized Cost of Generation for Energy Storage is Less Than a Simple Cycle Gas-‐Fired Peaker

Energy storage is a cheaper and cleaner alterna;ve to natural gas peakers – analysis assump;ons
20
Gas-‐Fired Peaker Plant1 Energy Storage Peaker Substitution2 General Assumptions Technology: Simple Cycle Combustion Turbine Plant Size 49.9MW Efficiency 37% (9,266 Btu/kWh Heat Rate) Ownership POU Owned/Financed Project Life 20 years Capacity Factor 5% Plant, T&D Losses 6% (Centralized Plant)
General Assumptions Technology: Lead-‐Acid Battery Plant Size 49.9MW (4h duration) Efficiency 84% (AC to AC Roundtrip) Ownership POU Owned/Financed Project Life 20 years Capacity Factor 5% Plant, T&D Losses 6% (Centralized Plant)
Costs Assumptions LCOG ($/MWh)
LCOG ($/kW-‐yr)
Fixed O&M $24/kW/yr $69 $29 Corp. Taxes 0% $0 $0 Insurance 0.6% of CAPEX $23 $10 Property Tax 1.1% of CAPEX $29 $12 Natural Gas Fuel
$61/MWh $100 $41
Variable O&M $0.04/kWh $5 $2 Subtotal $227 $93
Costs Assumptions LCOG ($/MWh)
LCOG ($/kW-‐yr)
Fixed O&M $6/kW/yr $17 $7 Corp. Taxes 0% $0 $0 Insurance 0.6% of CAPEX $22 $9 Property Tax 1.1% of CAPEX $28 $12 Off-‐Peak Grid Charging
$24/MWh3 $48 $20
Variable O&M $0.04/kWh $5 $2 Subtotal $121 $50
Costs Assumptions LCOG
($/MWh) LCOG
($/kW-‐yr) Installed Cost
$1,394/kW $265 $109
Grand Total $492 $203
Costs Assumptions LCOG ($/MWh)
LCOG ($/kW-‐yr)
Installed Cost $1,351/kW4 ($338/kWh)
$256 $105
Grand Total $377 $155
Levelized Cost of Generation for Energy Storage is Less Than a Simple Cycle Gas-‐Fired Peaker
1 Source: CEC 2009 Comparative Cost of California Central Station Electricity Generation Technologies (CEC_COG_Model_Version_2.02-‐4-‐5-‐10) 2 Source: StrateGen Consulting, Levelized Cost of Generation Model 3 Assumes most recent sample of average summer off-‐peak wholesale price from CAISO OASIS database 4 EPRI Chino Study TR-‐101787, Chino Battery Energy Storage Power Plant: Engineer-‐of-‐Record Report (December 1992)
1) Source: CEC 2009 Compara5ve Cost of California Central Sta5on Electricity Genera5on Technologies (CEC_COG_Model_Version_2.02-‐4-‐5-‐10) 2) Source: StrateGen ConsulSng, Levelized Cost of GeneraSon Model 3) Assumes most recent sample of average summer off-‐peak wholesale price from CAISO OASIS database 4) EPRI Chino Study TR-‐101787, Chino Ba@ery Energy Storage Power Plant: Engineer-‐of-‐Record Report (December 1992)
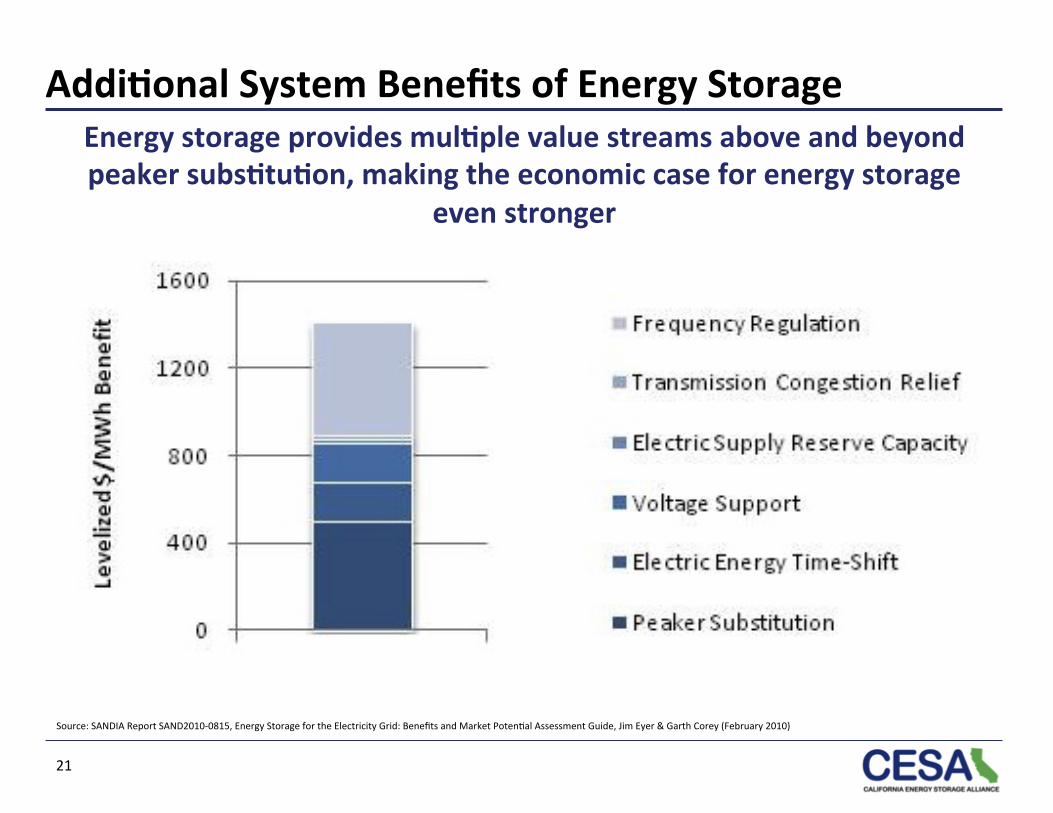
Addi;onal System Benefits of Energy Storage
21
Source: SANDIA Report SAND2010-‐0815, Energy Storage for the Electricity Grid: Benefits and Market PotenSal Assessment Guide, Jim Eyer & Garth Corey (February 2010)
Energy storage provides mul;ple value streams above and beyond peaker subs;tu;on, making the economic case for energy storage
even stronger

Energy storage is a cheaper alterna;ve to natural gas peakers – addi;onal benefits of storage
22
Fossil Fuel Societal, Grid, and Peaking Costs vs. Energy Storage Costs1,2 Avoided Costs Realized
Societal Level: -‐ GHG & Air Quality -‐ Renewables Integration -‐ Smart Grid Implementation -‐ Streamlined Permitting Grid System Level: -‐ Electric Energy Time-‐Shift -‐ Voltage Support -‐ Electric Supply Reserve Capacity -‐ Transmission Congestion Relief -‐ Frequency Regulation Peaker Level: -‐ Peaker Plant Substitution
1 Assumptions: All energy storage technology costs shown are normalized for a four-‐hour duration; Technology comparison is for modern energy storage
systems only, but does not include pumped hydro or high-‐speed flywheels which are not designed for long-‐duration peaking applications 2 Source: Average estimated total installed cost estimate from: Sandia Report SAND2008-‐0978, Susan M. Schoenung and Jim Eyer, Benefit/Cost Framework
for Evaluating (February 2008)
0
500
1000
1500
2000
2500
Installed Co
st ($
/kWh)
High Estimated Total Installed Cost by Technology
Average Estimated Total Installed Cost by Technology
Societal Costs
Grid System Level Costs
Peaker Substitution Costs
1) AssumpSons: All energy storage technology costs shown are normalized for a four-‐hour duraSon; Technology comparison is for modern energy storage systems only, but does not include pumped hydro or high-‐speed flywheels which are not designed for long-‐duraSon peaking applicaSons
2) Source: Average esSmated total installed cost esSmate from: Sandia Report SAND2008-‐0978, Susan M. Schoenung and Jim Eyer, Benefit/Cost Framework for EvaluaSng (February 2008)

Energy storage is a cleaner alterna;ve to natural gas peakers
23
1) AssumpSons from CEC Cost of GeneraSon Model for simple cycle peaker and standard combined cycle for off-‐peak base load; generaSon mix based on annual report of actual electricity purchases for Pacific Gas and Electric in 2008
55%
85%96%
77%84%
0.00
0.25
0.50
0.75
1.00
1.25
CO2 NOx CO SOx PM10
lbs/MWh (lb
s/GW
H for C
O2)
GHG & Air Quality ComparisonPeaker Plant Storage System Percent Reduction

24
Other California Energy Storage Regulatory Ac;vi;es
» CA ISO Stakeholder process for Ancillary Services » CPUC Self GeneraSon IncenSve Program (SGIP)
» CPUC Standard Offer for Permanent Load Shioing (PLS)
» CPUC Smart Grid Deployment
» CPUC Mandatory Default CriScal Peak Pricing Tariffs (CPP)
» CPUC Feed in Tariffs with differenSal rates for renewables coupled with storage » CARB Renewable Electricity Standard (RES) ImplementaSon
» CEC Integrated Energy Policy Report 2010 update includes storage
California’s regulatory framework is rapidly evolving to accelerate deployment of grid storage
Successful passage of the Federal ITC will accelerate deployment significantly

25
Summary
» Energy storage is fundamental to many key California energy policy iniSaSves
» Grid storage market is large and growing fast
» Energy storage enables many value streams, but requires government intervenSon to align benefits with costs
» Energy storage is already considered an eligible subset of demand response, onsite generaSon, ancillary services and the smart grid
» However, as an ‘eligible subset’, energy storage suffers as it is not a priority of any of these areas – resulSng in incorrect market structure and underinvestment
» Energy storage enables compelling economic and environmental benefits and is deserving of greater focus to realize these benefits
Grid storage will be a key enabler of California’s many energy policy goals
AB 2514 provides the necessary leadership to realize the benefits of energy storage now!
For addi;onal ques;ons, please contact: Janice Lin [email protected] 415-‐595-‐8301
The California Energy Storage Alliance (CESA) Janice Lin | CESA Co-‐Founder and Managing Partner of StrateGen ConsulSng
Appendix
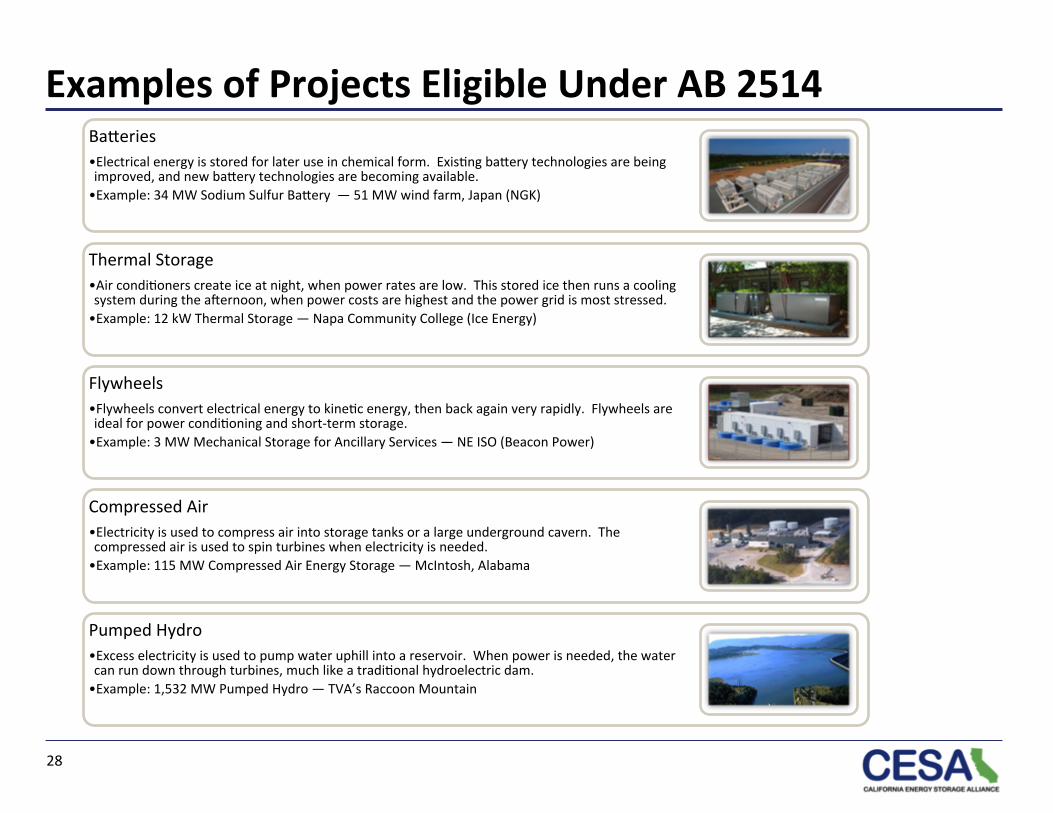
Examples of Projects Eligible Under AB 2514
28
Bakeries • Electrical energy is stored for later use in chemical form. ExisSng bakery technologies are being improved, and new bakery technologies are becoming available. • Example: 34 MW Sodium Sulfur Bakery — 51 MW wind farm, Japan (NGK)
Thermal Storage • Air condiSoners create ice at night, when power rates are low. This stored ice then runs a cooling system during the aoernoon, when power costs are highest and the power grid is most stressed. • Example: 12 kW Thermal Storage — Napa Community College (Ice Energy)
Flywheels • Flywheels convert electrical energy to kineSc energy, then back again very rapidly. Flywheels are ideal for power condiSoning and short-‐term storage. • Example: 3 MW Mechanical Storage for Ancillary Services — NE ISO (Beacon Power)
Compressed Air • Electricity is used to compress air into storage tanks or a large underground cavern. The compressed air is used to spin turbines when electricity is needed. • Example: 115 MW Compressed Air Energy Storage — McIntosh, Alabama
Pumped Hydro • Excess electricity is used to pump water uphill into a reservoir. When power is needed, the water can run down through turbines, much like a tradiSonal hydroelectric dam. • Example: 1,532 MW Pumped Hydro — TVA’s Raccoon Mountain
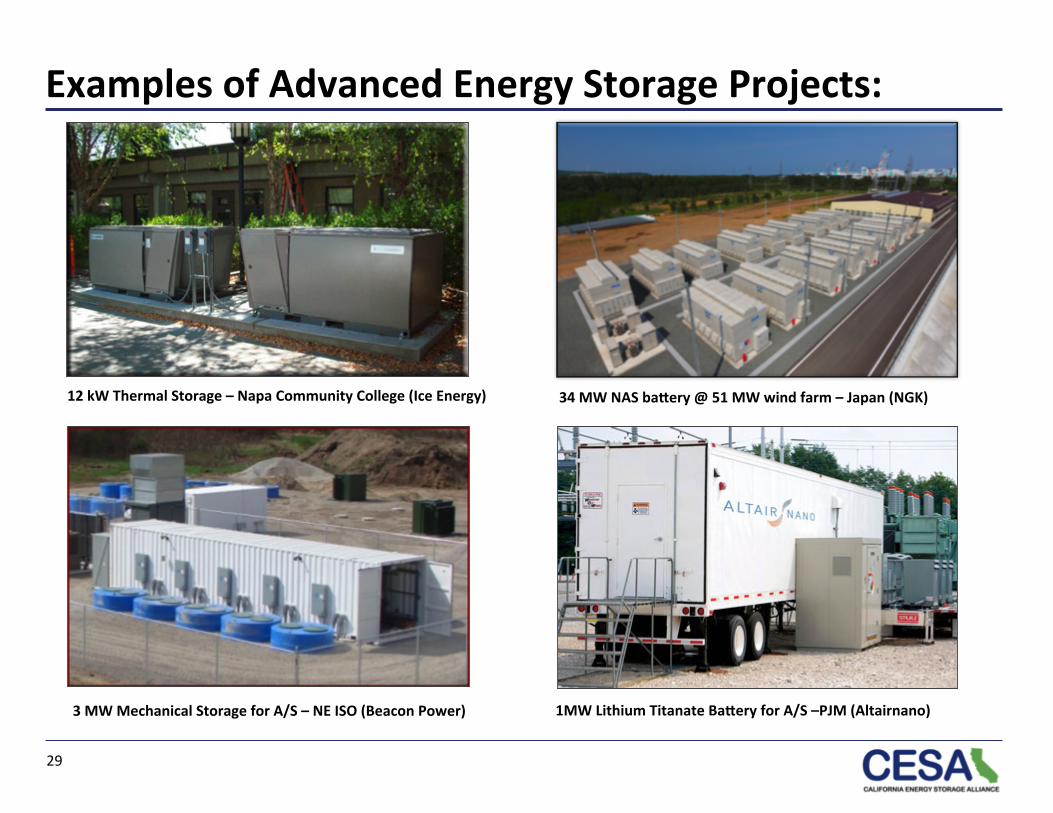
Examples of Advanced Energy Storage Projects:
12 kW Thermal Storage – Napa Community College (Ice Energy) 34 MW NAS baNery @ 51 MW wind farm – Japan (NGK)
3 MW Mechanical Storage for A/S – NE ISO (Beacon Power) 1MW Lithium Titanate BaNery for A/S –PJM (Altairnano)
29
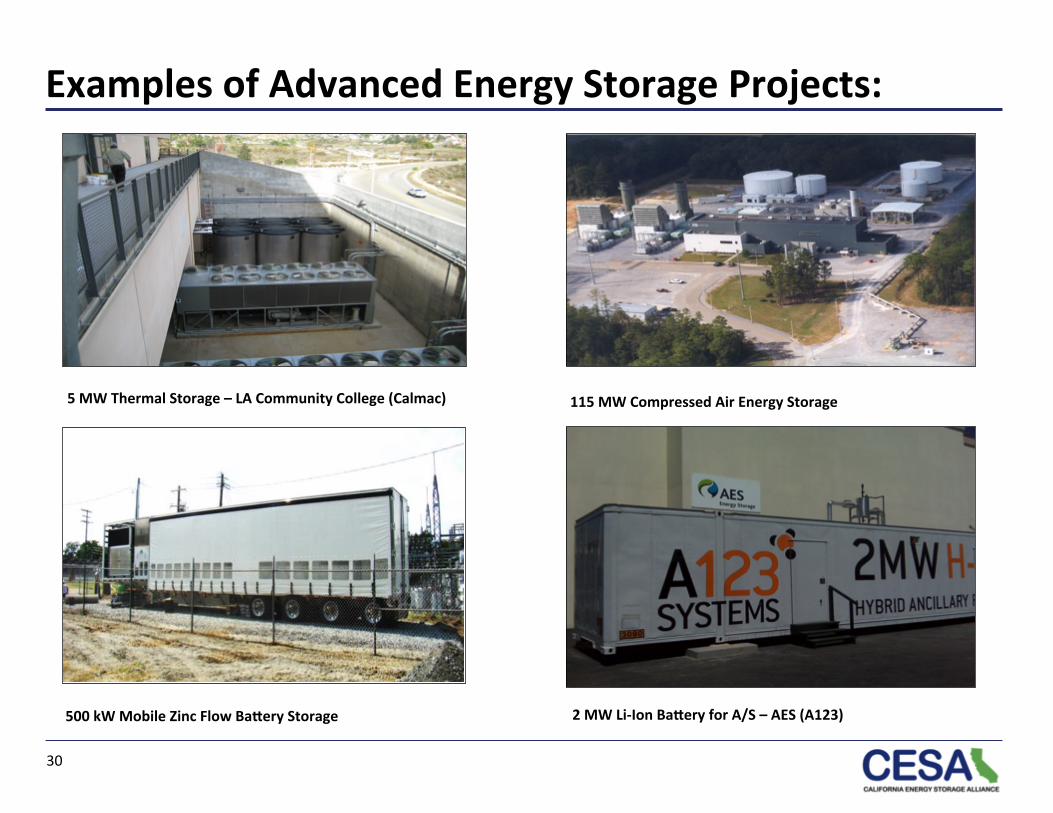
Examples of Advanced Energy Storage Projects:
5 MW Thermal Storage – LA Community College (Calmac) 115 MW Compressed Air Energy Storage
500 kW Mobile Zinc Flow BaNery Storage 2 MW Li-‐Ion BaNery for A/S – AES (A123)
30
Storage Provides Four Timely Benefits to California
1. Energy storage deployed in CA will create jobs for CA
– Direct installaSon of projects in California
– New manufacturing capacity
– Spur enabling communicaSons and controls technologies
2. Energy storage supports CA’s landmark legislaSon (AB 32) to reduce
GHG emissions and convenSonal pollutants
3. Energy storage will enable CA to achieve a RPS of 33% by 2020
4. Energy Storage is a key component of CA’s smart grid goals
31

Global Installed & Announced Energy Storage
32
Technology CA Rest of USA Rest of World TotalsBatteries 19 44 388 451 Compressed Air -‐ 110 330 440 Molten Salt -‐ -‐ 142 142 Other 2 75 18 95 Pumped Hydro 3,850 19,862 99,678 123,390 Thermal 2 668 332 1,002 Total 3,872 20,760 100,888 125,520 Total minus Hydro 22 898 1,210 2,129
Energy Storage Installed Capacity (MW)Technology CA Rest of USA Rest of World TotalsBatteries 45 89 450 584 Compressed Air 300 421 -‐ 721 Molten Salt 143 361 479 982 Other -‐ 80 -‐ 80 Pumped Hydro 3,410 -‐ 42,908 46,318 Thermal 56 -‐ -‐ 56 Total 3,953 951 43,837 48,741 Total minus Hydro 543 951 929 2,423
Energy Storage Announced Capacity (MW)
Source: StrateGen ConsulSng, LLC research; thermal storage installed and announced capacity esSmated by Ice Energy and Calmac. Note: EsSmates include thermal energy storage for cooling only. Figures current as of April, 2010.

Projects Announced in CA
33
Technology Location Date Announced Utility Vendor Power (MW) References
Li Ion Irvine, California 2009 Southern California Edison A123 DOE FOA 36 Award
Pumped Hydro Riverside, California 2008 Eagle Mountain Eagle Crest Energy 1,300 HydroReview magazine, July 2009 edition, Eagle Mountain Energy
Pumped Hydro Tuolumne, California 2009 Modesto & Turlock Irrigation Districts 880 HydroReview magazine, July 2009 edition
Pumped Hydro Riverside, California 2009 Several 500 HydroReview magazine, July 2009 edition
Pumped Hydro Iowa Hill, California 2009 Sacramento Municipal Utility District (SMUD) 400 Sacramento Municipal Utility District (SMUD)
CAES Kern County, California 2009 PG&E 300 Next 100 Article
Pumped Hydro Alameda, California 2009 Brookfield Renewable Power 280 HydroReview magazine, July 2009 edition
Thermal California 2010 Southern California Public Power Ice Energy 53 Ice Energy Press Release
Pumped Hydro San Diego, California 2009 San Diego County Water Authority 50 HydroReview magazine, July 2009 edition
Li Ion Tehachapi, California 2009 Southern California Edison A123 8 DOE FOA 36 Award, Tehachapi Wind Integration, 2011 deployment
NAS San Jose, California 2009 PG&E 4 CEC press release
Flow Sacramento, California 2009 SMUD Premium Power 4
Molten Salt Rice, California 2009 PG&E Solar Reserve 143 New York Times article
Flow California 2010 PG&E ZBB 2 Blog w/ access to good data (Platts)
Flow Alameda, California 2009 Modesto Irrigation District Primus Power 25 Sandia Press Release
Li Ion Berkeley, California 2009 Seeo Sandia Press Release
Flywheels Fremont, California 2009 Amber Kinetics Sandia Press Release
Thermal Glendale, California 2009 Glendale Water & Power Ice Energy 1500 Ice Energy Press Release
Total 5,448
Source: StrateGen ConsulSng, LLC. ConfidenSal projects excluded. Figures current as of April, 2010.