Embed Size (px)
Citation preview
International Research Journal of Engineering and Technology (IRJET) e-ISSN: 2395 -0056
Volume: 03 Issue: 02 | Feb-2016 www.irjet.net p-ISSN: 2395-0072
CERTAIN RESULTS ON TIGHTENED-NORMAL-TIGHTENED REPETITIVE
DEFERRED SAMPLING SCHEME (TNTRDSS) INDEXED THROUGH BASIC
QUALITY LEVELS
V.Kaviyarasu1 & A.Manikandan2 1Assistant Professor, 2Research Scholar
Department of Statistics, Bharathiar University, Coimbatore-641046, Tamilnadu, India.
Corresponding addresses: [email protected], [email protected]
----------------------------------------------------------------------***---------------------------------------------------------------------Abstract - The present work, examines Tightened-Normal-Tightened Sampling Scheme with Repetitive Deferred Sampling plan as the reference plan, designated as (TNTRDSS)-(n; u1, u2; v1, v2; i) indexed through producer’s risk and consumer’s risk for specified Acceptable Quality Level (AQL) and Limiting Quality Level (LQL) using Poisson distribution. Unity values have been tabulated to facilitate the construction and selection of the scheme. Few
illustrations were provided for the proposed work. Keywords: Tightened-Normal-Tightened, Repetitive Deferred Sampling, Operating Characteristic curve, Acceptable Quality Level (AQL) and Limiting Quality Level (LQL). 1. INTRODUCTION Acceptance sampling is an effective Quality Control tool, which deals with the procedures in which decision to accept or reject lots or process based on their examination of samples. Acceptance sampling is playing a key role in improving the quality. The basic aim of any industries in the world is to improve the quality of their products. The high quality of products may have the high probability of acceptance. Accordingly sampling plans are widely used in manufacturing industries, pharmaceutical products and so on specifically in the areas of compliance and safety inspection of the products. According to Schilling (1982) the tightened-normal-tightened (TNT) sampling schemes are popularly used in compliance sampling.
2. TIGHTENED NORMAL TIGHTENED SAMPLING SCHEME Tightened Normal Tightened (TNT) is a sampling scheme involving switching between two sampling plans. MIL-STD-105D contains a sampling scheme with a
fixed sample size but with two different acceptance numbers. TNT sampling scheme can also be accomplished by maintaining the acceptance criteria and switching between two sample sizes. This approach is particularly appealing with zero acceptance number plans. Calvin T.W (1977) has introduced Tightened Normal Tightened Sampling Scheme utilizing zero acceptance number in two single sampling plans with different sample sizes, namely, n1 and n2 (< n1) together with the switching rules, which is designated as TNT-(n1, n2; 0). Soundararajan and Vijayaraghavan (1992) have developed TNT-(n1, n2; c) scheme for various entry parameters. Further they have proposed another type of TNT sampling scheme using one sample size and two acceptance numbers, designated as TNT-(n; c1, c2) scheme. This scheme utilizes the single sampling plan with tightened plan of sample size n and acceptance number c1 as well as single sampling plan with normal plan of sample size n and acceptance number c2. Radhakrishnan and Sivakumaran (2010) have proposed TNT-(n1, n2; c) indexed through Six Sigma Quality Level-1 (SSQL-1) and Six Sigma Quality Level-2 (SSQL 2). Further they have proposed TNT-(n1, n2; c) indexed through Producer’s Nano Quality Level (PNQL) and Consumer’s Nano Quality Level (CNQL). Subramani and Haridoss (2012) have proposed Tightened-Normal-Tightened system for given values of the Acceptable Quality Level and Limiting Quality Level using Weighted Poisson distribution.
3. REPETITIVE DEFERRED SAMPLING PLAN In Repetitive Deferred Sampling plan, the acceptance or rejection of a lot in deferred state is dependent on the inspection results of the preceding or succeeding lots under Repetitive Group Sampling (RGS) inspection. RGS is the particular case of RDS plan.
© 2016, IRJET | Impact Factor value: 4.45 | ISO 9001:2008 Certified Journal | Page 164
International Research Journal of Engineering and Technology (IRJET) e-ISSN: 2395 -0056
Volume: 03 Issue: 02 | Feb-2016 www.irjet.net p-ISSN: 2395-0072
Sankar and Mahopatra (1991) has developed the RDS plan which is an extension of the Multiple Deferred Sampling plan MDS-(c1, c2) which was proposed by Rambert Vaerst (1980). Lilly Christina (1995) has given the procedure for the selection of RDS plan with given acceptable quality levels and also compared RDS plan with RGS plan with respect to operating ratio (OR) and ASN curve. Suresh and Saminathan, (2010) present are
construction and selection of Repetitive Deferred Sampling (RDS) plan through Acceptable and Limiting Quality Levels. Suresh and Vinitha Xavier (2014) presents a new procedure and tables for minimum sum of risk of a Generalized Two Plan system of type GTPS-(n; cN, cT) with Repetitive Deferred Sampling Plan as reference plan indexed through Acceptable Quality Level (AQL) and Limiting Quality Level (LQL).
4. Tightened-Normal-Tightened Repetitive Deferred Sampling Scheme (TNTRDSS) Here, the construction and selection of Tightened-Normal-Tightened Repetitive Deferred Sampling Scheme (TNTRDSS) for different parameter ‘s’ and ‘t’ are carried out under Poisson model. The sampling plan was indexed through Incoming and Outgoing Quality levels. Performance measures are indicated for Acceptable Quality Level (AQL), Limiting Quality Level (LQL) and Indifference Quality Level (IQL). Necessary tables and procedures were given for designing the scheme through various entries of plan parameters.
4.1. Designation Tightened-Normal-Tightened Repetitive Deferred Sampling Scheme (TNTRDSS)-(n; u1, u2; v1, v2; i) refers to a Tightened-Normal-Tightened sampling inspection where the normal RDS plan has a sample size n and acceptance number u1, u2 (u1 < u2) and the tightened RDS plan has a sample size n and acceptance number v1, v2 (v1
< v2, v1 ≤ u1 and v2 ≤ u2).
4.2. Operating Procedure for TNTRDSS The Tightened-Normal-Tightened Repetitive Deferred Sampling Scheme (TNTRDSS) is carried out through the following steps.
Step 1: Draw a random sample of size n and test each unit for conformance for the specified requirements
Step 2: Inspect under tightened inspection using the
Repetitive Deferred Sampling plan with sample size n and acceptance number v1 and v2 (v2 > v1). If ‘t’ lots in a row are accepted under tightened inspection, switch to normal inspection (step 3).
Step 3: Inspect under normal inspection using the
Repetitive Deferred Sampling plan with sample size n and acceptance number u1 and u2 (u2 > u1). Switch to tightened inspection, if an additional lots is rejected in the next ‘s’.
Thus, the Tightened-Normal-Tightened Repetitive Deferred Sampling Scheme (TNTRDSS) has eight parameters. They are n; u1, u2; v1, v2, s, t and i. When s = 4 and t = 5, the above procedure corresponds to MIL-STD-105D involving only tightened and normal inspection. When i =1 RDS plan reduces to Repetitive Group sampling plan.
4.3. Operating Characteristics Function According to Calvin (1977) the expression for OC function of TNT is given by,
)2)(1()1)(1)(1(
)2)(1()1)(1)(1()(
s
NT
t
TN
t
T
s
N
s
NT
t
TNN
t
T
s
NT
aPPPPPP
PPPPPPPPpP
(1)
Where,
PT and PN are probability of acceptance under tightened and normal inspections.
4.4. Designing TNTRDSS for given p1, p2, α and β For construction and evaluation of the Tightened-Normal-Tightened Repetitive Deferred Sampling Scheme (TNTRDSS)-(n; u1, u2; v1, v2; i), the values presented in tables were derived under the procedure stated by Duncan [1965]. Tables are used to derive individual plan to meet specified values of fraction defectives and probability of acceptance.
Tables can be used to select Tightened-Normal-Tightened Repetitive Deferred Sampling Scheme (TNTRDSS)-(n; u1, u2; v1, v2; i) for given p1, p2, α and β by using the following steps. Step 1: Specify p1 - AQL, p2 - LTPD, producer risk (α)
and consumer risk (β). Step 2: Compute the operating ratio is OR = p2 / p1.
© 2016, IRJET | Impact Factor value: 4.45 | ISO 9001:2008 Certified Journal | Page 165
International Research Journal of Engineering and Technology (IRJET) e-ISSN: 2395 -0056
Volume: 03 Issue: 02 | Feb-2016 www.irjet.net p-ISSN: 2395-0072
Step 3: Select the value p2 / p1 in Table 4 in the column for appropriate α and β that is nearly equal to the computed OR.
Step 4: Determine the plan parameters of u1, u2, v1 and v2 corresponding to the value of p2 / p1 located.
Step 5: Determine the value of np1 from Table 1 corresponding to the parameters u1, u2, v1 and v2.
Step 6: The sample size of the scheme is then determined by np1 by p1.
Step 7: Thus, the values of n, u1, u2, v1 and v2 constitute the required TNTRDSS-(n; u1, u2; v1, v2; i) scheme.
4.5. Plotting the OC curve of TNTRDSS Table 1 can be used to obtain eight values of p and Pa(p) to plot the OC Curve of a given Tightened-Normal-Tightened Repetitive Deferred Sampling Scheme TNTRDSS-(n; u1, u2; v1, v2).
Example 1: Suppose a Tightened-Normal-Tightened Repetitive Deferred Sampling Scheme (TNTRDSS) is desired with Pa(p1) = 0.95 for having p1 = 0.01 and p2 = 0.75 then, p1 = 0.02, α = 0.05, p2 = 0.08 and β = 0.10.
1. OR = p1 / p2 = 0.08 / 0.02 = 4. 2. The operating ratio is OR = 4 in the table 1
which is nearest to the desired ratio is 3.976. 3. Corresponding plan parameters are u1 = 3, u2 =
5, v1 = 2, v2 = 3 when, s = 4, t = 5 and i = 1 of computed OR.
4. The np1 value in Table 1 corresponding to the parameters u1, u2, v1 and v2 is 1.3437.
5. The sample size n = np1 / p1 = 1.3437/ 0.02 = 67.185 ≈ 66.
The OC curve is obtained by dividing the values of np is given below Pa(p).
Pa(p) P
0.99 0.01213
0.95 0.02036
0.90 0.02496
0.75 0.03297
0.50 0.04399
0.25 0.06061
0.10 0.08089
0.05 0.09542
0.01 0.12709
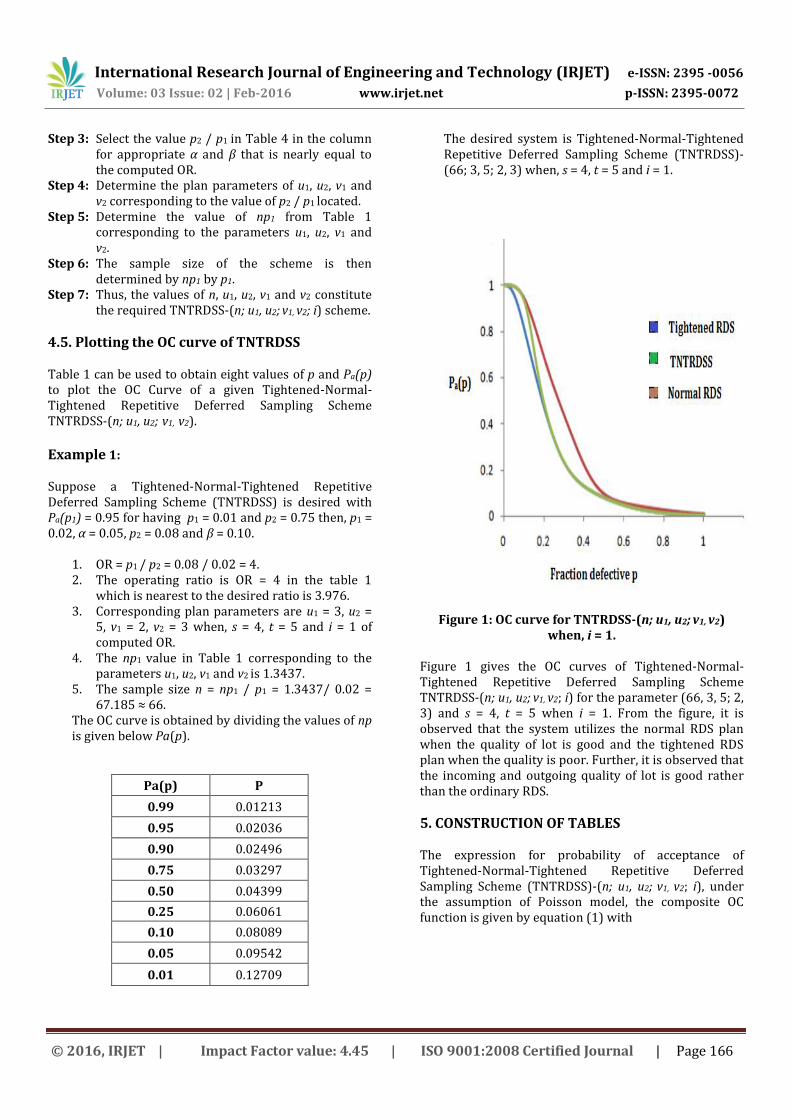
The desired system is Tightened-Normal-Tightened Repetitive Deferred Sampling Scheme (TNTRDSS)-(66; 3, 5; 2, 3) when, s = 4, t = 5 and i = 1.
Figure 1: OC curve for TNTRDSS-(n; u1, u2; v1, v2) when, i = 1.
Figure 1 gives the OC curves of Tightened-Normal-Tightened Repetitive Deferred Sampling Scheme TNTRDSS-(n; u1, u2; v1, v2; i) for the parameter (66, 3, 5; 2, 3) and s = 4, t = 5 when i = 1. From the figure, it is observed that the system utilizes the normal RDS plan when the quality of lot is good and the tightened RDS plan when the quality is poor. Further, it is observed that the incoming and outgoing quality of lot is good rather than the ordinary RDS.
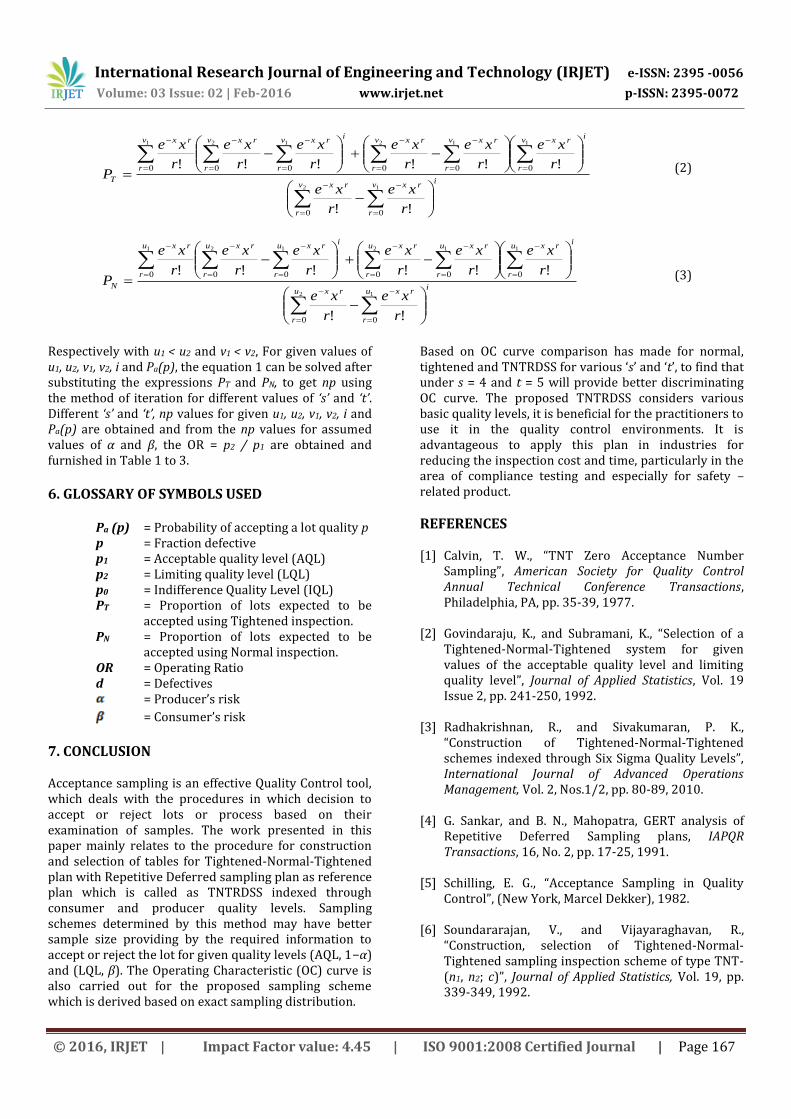
5. CONSTRUCTION OF TABLES The expression for probability of acceptance of Tightened-Normal-Tightened Repetitive Deferred Sampling Scheme (TNTRDSS)-(n; u1, u2; v1, v2; i), under the assumption of Poisson model, the composite OC function is given by equation (1) with
© 2016, IRJET | Impact Factor value: 4.45 | ISO 9001:2008 Certified Journal | Page 166
International Research Journal of Engineering and Technology (IRJET) e-ISSN: 2395 -0056
Volume: 03 Issue: 02 | Feb-2016 www.irjet.net p-ISSN: 2395-0072
iv
r
rxv
r
rx
iv
r
rxv
r
rxv
r
rxi
v
r
rxv
r
rxv
r
rx
T
r
xe
r
xe
r
xe
r
xe
r
xe
r
xe
r
xe
r
xe
P
12
112121
00
000000
!!
!!!!!! (2)
iu
r
rxu
r
rx
iu
r
rxu
r
rxu
r
rxi
u
r
rxu
r
rxu
r
rx
N
r
xe
r
xe
r
xe
r
xe
r
xe
r
xe
r
xe
r
xe
P
12
112121
00
000000
!!
!!!!!!
(3)
Respectively with u1 < u2 and v1 < v2, For given values of u1, u2, v1, v2, i and Pa(p), the equation 1 can be solved after substituting the expressions PT and PN, to get np using the method of iteration for different values of ‘s’ and ‘t’. Different ‘s’ and ‘t’, np values for given u1, u2, v1, v2, i and Pa(p) are obtained and from the np values for assumed values of α and β, the OR = p2 / p1 are obtained and furnished in Table 1 to 3.
6. GLOSSARY OF SYMBOLS USED
Pa (p) = Probability of accepting a lot quality p p = Fraction defective p1 = Acceptable quality level (AQL) p2 = Limiting quality level (LQL) p0 = Indifference Quality Level (IQL) PT = Proportion of lots expected to be
accepted using Tightened inspection. PN = Proportion of lots expected to be
accepted using Normal inspection. OR = Operating Ratio d = Defectives
= Producer’s risk
= Consumer’s risk
7. CONCLUSION Acceptance sampling is an effective Quality Control tool, which deals with the procedures in which decision to accept or reject lots or process based on their examination of samples. The work presented in this paper mainly relates to the procedure for construction and selection of tables for Tightened-Normal-Tightened plan with Repetitive Deferred sampling plan as reference plan which is called as TNTRDSS indexed through consumer and producer quality levels. Sampling schemes determined by this method may have better sample size providing by the required information to accept or reject the lot for given quality levels (AQL, 1−α) and (LQL, β). The Operating Characteristic (OC) curve is also carried out for the proposed sampling scheme which is derived based on exact sampling distribution.
Based on OC curve comparison has made for normal, tightened and TNTRDSS for various ‘s’ and ‘t’, to find that under s = 4 and t = 5 will provide better discriminating OC curve. The proposed TNTRDSS considers various basic quality levels, it is beneficial for the practitioners to use it in the quality control environments. It is advantageous to apply this plan in industries for reducing the inspection cost and time, particularly in the area of compliance testing and especially for safety – related product.
REFERENCES [1] Calvin, T. W., “TNT Zero Acceptance Number
Sampling”, American Society for Quality Control Annual Technical Conference Transactions, Philadelphia, PA, pp. 35-39, 1977.
[2] Govindaraju, K., and Subramani, K., “Selection of a Tightened-Normal-Tightened system for given values of the acceptable quality level and limiting quality level”, Journal of Applied Statistics, Vol. 19 Issue 2, pp. 241-250, 1992.
[3] Radhakrishnan, R., and Sivakumaran, P. K., “Construction of Tightened-Normal-Tightened schemes indexed through Six Sigma Quality Levels”, International Journal of Advanced Operations Management, Vol. 2, Nos.1/2, pp. 80-89, 2010.
[4] G. Sankar, and B. N., Mahopatra, GERT analysis of
Repetitive Deferred Sampling plans, IAPQR Transactions, 16, No. 2, pp. 17-25, 1991.
[5] Schilling, E. G., “Acceptance Sampling in Quality
Control”, (New York, Marcel Dekker), 1982. [6] Soundararajan, V., and Vijayaraghavan, R.,
“Construction, selection of Tightened-Normal-Tightened sampling inspection scheme of type TNT-(n1, n2; c)”, Journal of Applied Statistics, Vol. 19, pp. 339-349, 1992.
© 2016, IRJET | Impact Factor value: 4.45 | ISO 9001:2008 Certified Journal | Page 167
International Research Journal of Engineering and Technology (IRJET) e-ISSN: 2395 -0056
Volume: 03 Issue: 02 | Feb-2016 www.irjet.net p-ISSN: 2395-0072
[7] Soundararajan, V., and Vijayaraghavan, R., “Procedures and tables for the selection of Tightened-Normal-Tightened TNT-(n; c1, c2) sampling schemes”, Journal of Applied Statistics, Vol. 23, pp. 69-79, 1996.
[8] Subrmani, K., and Haridoss, V., “Selection of a
Tightened-Normal-Tightened system for given values of the Acceptable Quality Level and Limiting Quality Level using Weighted Poisson distribution”, International Journal of Decision Sciences, Risk and Management, 4(3/4), pp. 300-313, 2012.
[9] Suresh, K. K., and Saminathan, R., “Construction and
Selection of Repetitive Deferred Sampling (RDS) plan through Acceptable and Limiting Quality Levels”, International Journal of Pure and Applied Mathematics, Vol. 65, No.3, pp. 257-264, 2010.
[10] Suresh, K. K., and Vinitha Xavier, K., “Designing
of Generalized Two Plan System with Repetitive Deferred Sampling Plan as reference plan using minimum risks”, International Journal of Statistika and Mathematika, Vol. 9, Issue 1, pp. 34-39, 201
© 2016, IRJET | Impact Factor value: 4.45 | ISO 9001:2008 Certified Journal | Page 168

International Research Journal of Engineering and Technology (IRJET) e-ISSN: 2395 -0056
Volume: 03 Issue: 02 | Nov-2016 www.irjet.net p-ISSN: 2395-0072
Table -1: Value of np Tabulated against ‘s’ and ‘t’ for Given Pa (p) and Operating ratio Value for Given for TNTRDSS-(n; u1, u2; v1, v2; i), When, i = 1
s t u1 u2 v1 v2
Probability of Acceptance OR
p2 / p1 for = 0.05 p2 / p1 for = 0.01
0.99 0.95 0.90 0.75 0.50 0.25 0.10 0.05 0.01 =0.05 =0.10
=0.05 =0.05
=0.05 =0.01
=0.01 =0.10
=0.01 =0.05
=0.01 =0.01
1 2
1 2 0 1 0.1528 0.3544 0.5344 0.8899 1.2943 1.7608 2.4289 3.0375 4.5172 6.8531 8.5703 12.745 15.899 19.883 29.569 2 4 1 3 0.4336 0.825 1.1328 1.8284 2.601 3.2898 4.1316 4.8445 6.6144 5.0082 5.8724 8.0178 9.5276 11.172 15.253 3 5 2 3 0.8052 1.3833 1.7793 2.5608 3.395 4.265 5.3947 6.3069 8.38 3.9 4.5594 6.0581 6.6999 7.8328 10.407 4 5 1 2 1.2846 1.9158 2.2394 2.6851 3.1135 3.5968 4.2479 4.861 6.5793 2.2174 2.5374 3.4343 3.3068 3.784 5.1217 4 6 3 4 1.2868 1.9883 2.4732 3.4011 4.3824 5.4264 6.7481 7.7465 9.9476 3.3938 3.896 5.003 5.2441 6.02 7.7305 5 7 4 5 1.7998 2.6461 3.205 4.2459 5.3705 6.5665 8.0491 9.1671 11.582 3.0419 3.4644 4.3772 4.4722 5.0934 6.4354
2 4
1 2 0 1 0.1519 0.3402 0.4751 0.7193 1.0369 1.5569 2.3598 3.0138 4.5883 6.9372 8.8596 13.488 15.531 19.835 30.199 2 4 1 3 0.4327 0.8146 1.0813 1.6422 2.3276 3.1059 4.0786 4.8278 6.6226 5.0072 5.9269 8.1302 9.4259 11.157 15.305 3 5 2 3 0.8036 1.367 1.7153 2.3041 3.0067 4.0173 5.3423 6.2968 8.3859 3.908 4.6062 6.1344 6.6483 7.836 10.436 4 5 1 2 1.2754 1.7337 1.9167 2.1746 2.4679 2.9435 3.9246 4.747 6.5895 2.2637 2.738 3.8008 3.0772 3.722 5.1668 4 6 3 4 1.2866 1.969 2.4065 3.1386 3.988 5.1902 6.6996 7.7404 10.005 3.4026 3.9312 5.0811 5.2074 6.0163 7.7762 5 7 4 5 1.7997 2.6164 3.127 3.9805 4.9726 6.3487 8.0037 9.1572 11.473 3.059 3.4999 4.3852 4.4473 5.0883 6.3753
4 5
1 2 0 1 0.1503 0.3186 0.4301 0.64 0.9638 1.5416 2.3595 3.014 4.5888 7.4064 9.461 14.404 15.7 20.055 30.534 2 4 1 3 0.4309 0.7931 1.0263 1.5368 2.2586 3.0972 4.0717 4.8198 6.6098 5.1341 6.0775 8.3345 9.4494 11.186 15.34 3 5 2 3 0.8005 1.3437 1.647 2.176 2.9035 4.0001 5.3426 6.2978 8.3879 3.976 4.6869 6.2423 6.674 7.8672 10.478 4 5 1 2 1.2432 1.5987 1.7489 1.9694 2.2506 2.8334 3.9237 4.7484 6.605 2.4543 2.9702 4.1316 3.156 3.8193 5.3127 4 6 3 4 1.2861 1.9393 2.3385 2.9985 3.8805 5.1734 6.6989 7.7366 9.999 3.4543 3.9893 5.1559 5.2088 6.0157 7.7749 5 7 4 5 1.7994 2.5894 3.0554 3.8436 4.8687 6.3362 8.0058 9.1313 11.489 3.0918 3.5265 4.4371 4.4491 5.0746 6.385
6 8
1 2 0 1 0.1371 0.28 0.3611 0.5304 0.8969 1.5373 2.3614 3.0166 4.5188 8.435 10.775 16.141 17.224 22.003 32.96 2 4 1 3 0.4261 0.7516 0.9374 1.3887 2.1999 3.0931 4.0804 4.8175 6.6059 5.4286 6.4093 8.7887 9.575 11.305 15.501 3 5 2 3 0.8249 1.2971 1.5431 2.0091 2.8117 3.9957 5.3433 6.299 8.2937 4.1195 4.8563 6.3941 6.4774 7.636 10.054 4 5 1 2 1.1739 1.4083 1.5143 1.6849 1.9723 2.7915 3.9191 4.7509 6.5377 2.7828 3.3734 4.6422 3.3385 4.047 5.5691 4 6 3 4 1.2851 1.9 2.2223 2.8225 3.7931 5.1688 6.6989 7.7362 9.9983 3.5258 4.0717 5.2624 5.2127 6.0198 7.7801 5 7 4 5 1.7991 2.5358 2.9391 3.6532 4.7815 6.3272 8.0055 9.1527 11.476 3.157 3.6094 4.5254 4.4497 5.0874 6.3785
8 10
1 2 0 1 0.1371 0.2558 0.3232 0.4815 0.8862 1.5341 2.3623 3.0179 4.5333 9.2333 11.796 17.719 17.231 22.012 33.066 2 4 1 3 0.4207 0.7202 0.8862 1.3228 2.1963 3.0935 4.0727 4.8215 6.6139 5.6551 6.6949 9.1837 9.6805 11.46 15.721 3 5 2 3 0.8233 1.2592 1.4822 1.9387 2.8012 3.9941 5.3436 6.2995 8.2989 4.2435 5.0026 6.5904 6.4905 7.6516 10.08 4 5 1 2 1.0916 1.3064 1.397 1.554 1.8826 2.7911 3.9196 4.7514 6.5411 3.0003 3.637 5.0069 3.5907 4.3526 5.9921 4 6 3 4 1.284 1.8565 2.1585 2.7436 3.7821 5.169 6.6989 7.7372 10 3.6083 4.1676 5.3864 5.217 6.0257 7.7879 5 7 4 5 1.7991 2.4959 2.8697 3.5739 4.7709 6.3286 8.0026 9.1499 11.582 3.2063 3.666 4.6406 4.4482 5.0859 6.4379
© 2016, IRJET | Impact Factor value: 4.45 | ISO 9001:2008 Certified Journal | Page 169
International Research Journal of Engineering and Technology (IRJET) e-ISSN: 2395 -0056
Volume: 03 Issue: 02 | Nov-2016 www.irjet.net p-ISSN: 2395-0072
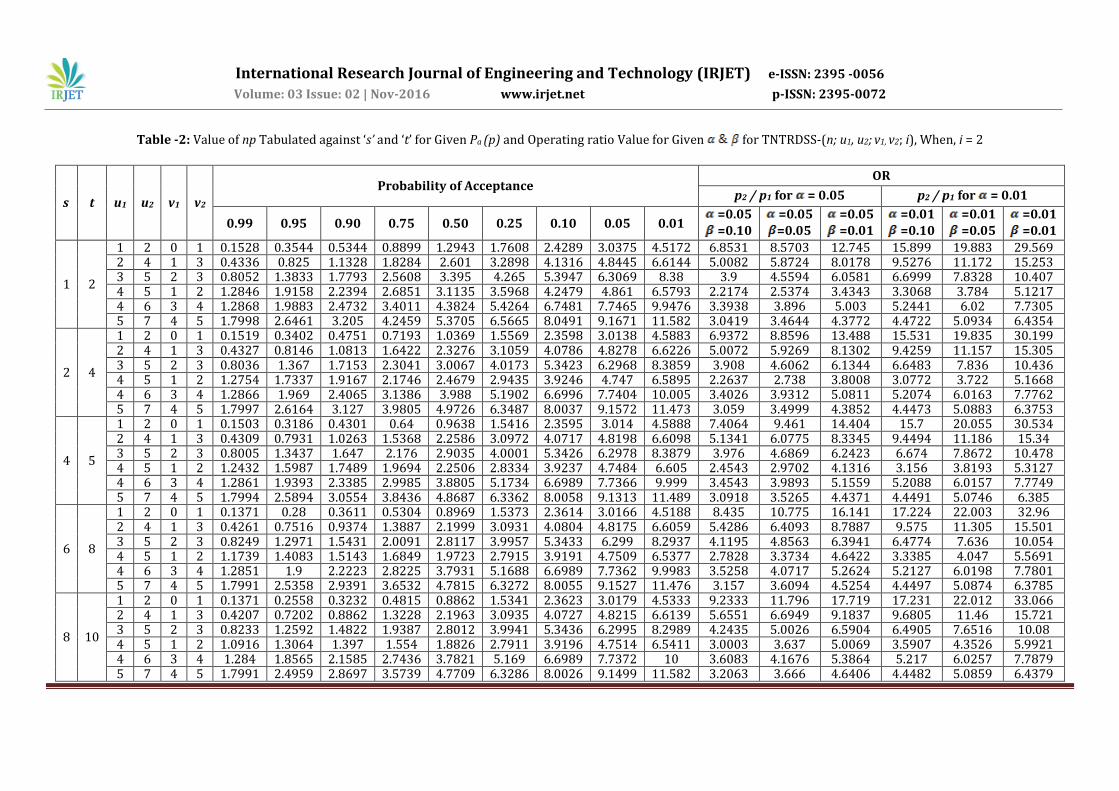
Table -2: Value of np Tabulated against ‘s’ and ‘t’ for Given Pa (p) and Operating ratio Value for Given for TNTRDSS-(n; u1, u2; v1, v2; i), When, i = 2
s t u1 u2 v1 v2
Probability of Acceptance OR
p2 / p1 for = 0.05 p2 / p1 for = 0.01
0.99 0.95 0.90 0.75 0.50 0.25 0.10 0.05 0.01 =0.05 =0.10
=0.05 =0.05
=0.05 =0.01
=0.01 =0.10
=0.01 =0.05
=0.01 =0.01
1 2
1 2 0 1 0.1528 0.3544 0.5344 0.8899 1.2943 1.7608 2.4289 3.0375 4.5172 6.8531 8.5703 12.745 15.899 19.883 29.569 2 4 1 3 0.4336 0.825 1.1328 1.8284 2.601 3.2898 4.1316 4.8445 6.6144 5.0082 5.8724 8.0178 9.5276 11.172 15.253 3 5 2 3 0.8052 1.3833 1.7793 2.5608 3.395 4.265 5.3947 6.3069 8.38 3.9 4.5594 6.0581 6.6999 7.8328 10.407 4 5 1 2 1.2846 1.9158 2.2394 2.6851 3.1135 3.5968 4.2479 4.861 6.5793 2.2174 2.5374 3.4343 3.3068 3.784 5.1217 4 6 3 4 1.2868 1.9883 2.4732 3.4011 4.3824 5.4264 6.7481 7.7465 9.9476 3.3938 3.896 5.003 5.2441 6.02 7.7305 5 7 4 5 1.7998 2.6461 3.205 4.2459 5.3705 6.5665 8.0491 9.1671 11.582 3.0419 3.4644 4.3772 4.4722 5.0934 6.4354
2 4
1 2 0 1 0.1519 0.3402 0.4751 0.7193 1.0369 1.5569 2.3598 3.0138 4.5883 6.9372 8.8596 13.488 15.531 19.835 30.199 2 4 1 3 0.4327 0.8146 1.0813 1.6422 2.3276 3.1059 4.0786 4.8278 6.6226 5.0072 5.9269 8.1302 9.4259 11.157 15.305 3 5 2 3 0.8036 1.367 1.7153 2.3041 3.0067 4.0173 5.3423 6.2968 8.3859 3.908 4.6062 6.1344 6.6483 7.836 10.436 4 5 1 2 1.2754 1.7337 1.9167 2.1746 2.4679 2.9435 3.9246 4.747 6.5895 2.2637 2.738 3.8008 3.0772 3.722 5.1668 4 6 3 4 1.2866 1.969 2.4065 3.1386 3.988 5.1902 6.6996 7.7404 10.005 3.4026 3.9312 5.0811 5.2074 6.0163 7.7762 5 7 4 5 1.7997 2.6164 3.127 3.9805 4.9726 6.3487 8.0037 9.1572 11.473 3.059 3.4999 4.3852 4.4473 5.0883 6.3753
4 5
1 2 0 1 0.1503 0.3186 0.4301 0.64 0.9638 1.5416 2.3595 3.014 4.5888 7.4064 9.461 14.404 15.7 20.055 30.534 2 4 1 3 0.4309 0.7931 1.0263 1.5368 2.2586 3.0972 4.0717 4.8198 6.6098 5.1341 6.0775 8.3345 9.4494 11.186 15.34 3 5 2 3 0.8005 1.3437 1.647 2.176 2.9035 4.0001 5.3426 6.2978 8.3879 3.976 4.6869 6.2423 6.674 7.8672 10.478 4 5 1 2 1.2432 1.5987 1.7489 1.9694 2.2506 2.8334 3.9237 4.7484 6.605 2.4543 2.9702 4.1316 3.156 3.8193 5.3127 4 6 3 4 1.2861 1.9393 2.3385 2.9985 3.8805 5.1734 6.6989 7.7366 9.999 3.4543 3.9893 5.1559 5.2088 6.0157 7.7749 5 7 4 5 1.7994 2.5894 3.0554 3.8436 4.8687 6.3362 8.0058 9.1313 11.489 3.0918 3.5265 4.4371 4.4491 5.0746 6.385
6 8
1 2 0 1 0.1371 0.28 0.3611 0.5304 0.8969 1.5373 2.3614 3.0166 4.5188 8.435 10.775 16.141 17.224 22.003 32.96 2 4 1 3 0.4261 0.7516 0.9374 1.3887 2.1999 3.0931 4.0804 4.8175 6.6059 5.4286 6.4093 8.7887 9.575 11.305 15.501 3 5 2 3 0.8249 1.2971 1.5431 2.0091 2.8117 3.9957 5.3433 6.299 8.2937 4.1195 4.8563 6.3941 6.4774 7.636 10.054 4 5 1 2 1.1739 1.4083 1.5143 1.6849 1.9723 2.7915 3.9191 4.7509 6.5377 2.7828 3.3734 4.6422 3.3385 4.047 5.5691 4 6 3 4 1.2851 1.9 2.2223 2.8225 3.7931 5.1688 6.6989 7.7362 9.9983 3.5258 4.0717 5.2624 5.2127 6.0198 7.7801 5 7 4 5 1.7991 2.5358 2.9391 3.6532 4.7815 6.3272 8.0055 9.1527 11.476 3.157 3.6094 4.5254 4.4497 5.0874 6.3785
8 10
1 2 0 1 0.1371 0.2558 0.3232 0.4815 0.8862 1.5341 2.3623 3.0179 4.5333 9.2333 11.796 17.719 17.231 22.012 33.066 2 4 1 3 0.4207 0.7202 0.8862 1.3228 2.1963 3.0935 4.0727 4.8215 6.6139 5.6551 6.6949 9.1837 9.6805 11.46 15.721 3 5 2 3 0.8233 1.2592 1.4822 1.9387 2.8012 3.9941 5.3436 6.2995 8.2989 4.2435 5.0026 6.5904 6.4905 7.6516 10.08 4 5 1 2 1.0916 1.3064 1.397 1.554 1.8826 2.7911 3.9196 4.7514 6.5411 3.0003 3.637 5.0069 3.5907 4.3526 5.9921 4 6 3 4 1.284 1.8565 2.1585 2.7436 3.7821 5.169 6.6989 7.7372 10 3.6083 4.1676 5.3864 5.217 6.0257 7.7879 5 7 4 5 1.7991 2.4959 2.8697 3.5739 4.7709 6.3286 8.0026 9.1499 11.582 3.2063 3.666 4.6406 4.4482 5.0859 6.4379
© 2016, IRJET | Impact Factor value: 4.45 | ISO 9001:2008 Certified Journal | Page 164
International Research Journal of Engineering and Technology (IRJET) e-ISSN: 2395 -0056
Volume: 03 Issue: 02 | Nov-2016 www.irjet.net p-ISSN: 2395-0072
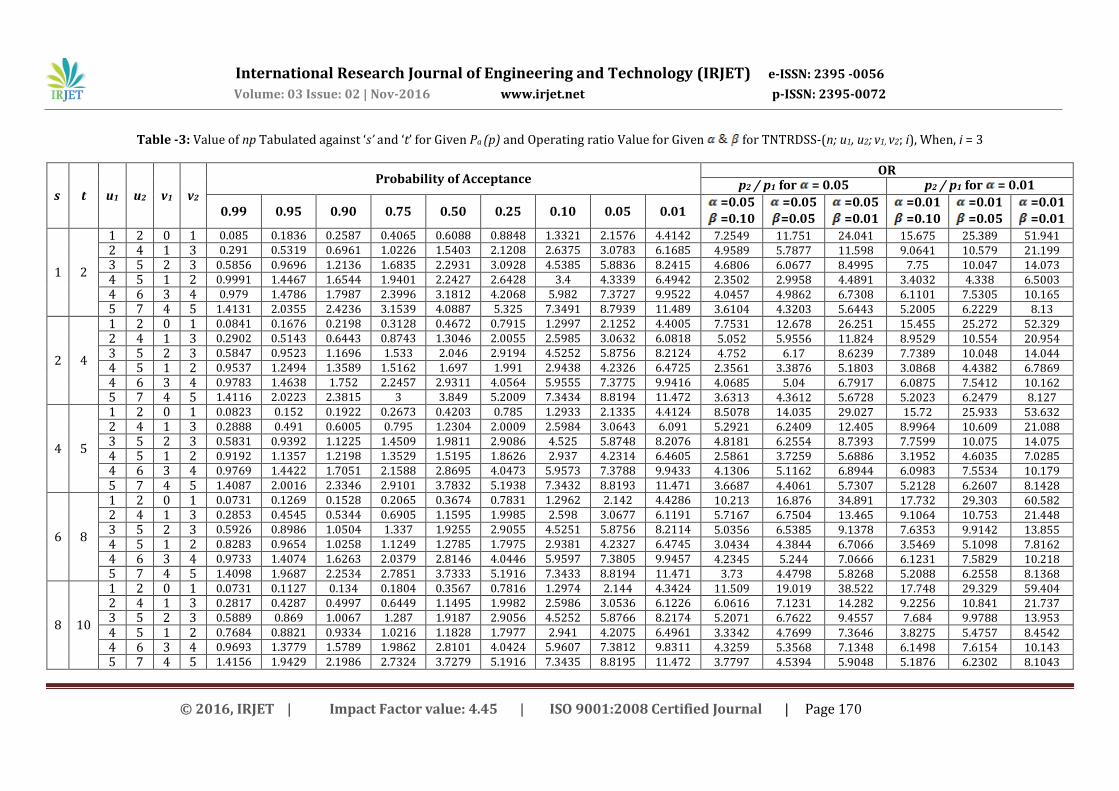
Table -3: Value of np Tabulated against ‘s’ and ‘t’ for Given Pa (p) and Operating ratio Value for Given for TNTRDSS-(n; u1, u2; v1, v2; i), When, i = 3
s t u1 u2 v1 v2
Probability of Acceptance OR
p2 / p1 for = 0.05 p2 / p1 for = 0.01
0.99 0.95 0.90 0.75 0.50 0.25 0.10 0.05 0.01 =0.05 =0.10
=0.05 =0.05
=0.05 =0.01
=0.01 =0.10
=0.01 =0.05
=0.01 =0.01
1 2
1 2 0 1 0.085 0.1836 0.2587 0.4065 0.6088 0.8848 1.3321 2.1576 4.4142 7.2549 11.751 24.041 15.675 25.389 51.941 2 4 1 3 0.291 0.5319 0.6961 1.0226 1.5403 2.1208 2.6375 3.0783 6.1685 4.9589 5.7877 11.598 9.0641 10.579 21.199 3 5 2 3 0.5856 0.9696 1.2136 1.6835 2.2931 3.0928 4.5385 5.8836 8.2415 4.6806 6.0677 8.4995 7.75 10.047 14.073 4 5 1 2 0.9991 1.4467 1.6544 1.9401 2.2427 2.6428 3.4 4.3339 6.4942 2.3502 2.9958 4.4891 3.4032 4.338 6.5003 4 6 3 4 0.979 1.4786 1.7987 2.3996 3.1812 4.2068 5.982 7.3727 9.9522 4.0457 4.9862 6.7308 6.1101 7.5305 10.165 5 7 4 5 1.4131 2.0355 2.4236 3.1539 4.0887 5.325 7.3491 8.7939 11.489 3.6104 4.3203 5.6443 5.2005 6.2229 8.13
2 4
1 2 0 1 0.0841 0.1676 0.2198 0.3128 0.4672 0.7915 1.2997 2.1252 4.4005 7.7531 12.678 26.251 15.455 25.272 52.329 2 4 1 3 0.2902 0.5143 0.6443 0.8743 1.3046 2.0055 2.5985 3.0632 6.0818 5.052 5.9556 11.824 8.9529 10.554 20.954 3 5 2 3 0.5847 0.9523 1.1696 1.533 2.046 2.9194 4.5252 5.8756 8.2124 4.752 6.17 8.6239 7.7389 10.048 14.044 4 5 1 2 0.9537 1.2494 1.3589 1.5162 1.697 1.991 2.9438 4.2326 6.4725 2.3561 3.3876 5.1803 3.0868 4.4382 6.7869 4 6 3 4 0.9783 1.4638 1.752 2.2457 2.9311 4.0564 5.9555 7.3775 9.9416 4.0685 5.04 6.7917 6.0875 7.5412 10.162 5 7 4 5 1.4116 2.0223 2.3815 3 3.849 5.2009 7.3434 8.8194 11.472 3.6313 4.3612 5.6728 5.2023 6.2479 8.127
4 5
1 2 0 1 0.0823 0.152 0.1922 0.2673 0.4203 0.785 1.2933 2.1335 4.4124 8.5078 14.035 29.027 15.72 25.933 53.632 2 4 1 3 0.2888 0.491 0.6005 0.795 1.2304 2.0009 2.5984 3.0643 6.091 5.2921 6.2409 12.405 8.9964 10.609 21.088 3 5 2 3 0.5831 0.9392 1.1225 1.4509 1.9811 2.9086 4.525 5.8748 8.2076 4.8181 6.2554 8.7393 7.7599 10.075 14.075 4 5 1 2 0.9192 1.1357 1.2198 1.3529 1.5195 1.8626 2.937 4.2314 6.4605 2.5861 3.7259 5.6886 3.1952 4.6035 7.0285 4 6 3 4 0.9769 1.4422 1.7051 2.1588 2.8695 4.0473 5.9573 7.3788 9.9433 4.1306 5.1162 6.8944 6.0983 7.5534 10.179
5 7 4 5 1.4087 2.0016 2.3346 2.9101 3.7832 5.1938 7.3432 8.8193 11.471 3.6687 4.4061 5.7307 5.2128 6.2607 8.1428
6 8
1 2 0 1 0.0731 0.1269 0.1528 0.2065 0.3674 0.7831 1.2962 2.142 4.4286 10.213 16.876 34.891 17.732 29.303 60.582 2 4 1 3 0.2853 0.4545 0.5344 0.6905 1.1595 1.9985 2.598 3.0677 6.1191 5.7167 6.7504 13.465 9.1064 10.753 21.448 3 5 2 3 0.5926 0.8986 1.0504 1.337 1.9255 2.9055 4.5251 5.8756 8.2114 5.0356 6.5385 9.1378 7.6353 9.9142 13.855 4 5 1 2 0.8283 0.9654 1.0258 1.1249 1.2785 1.7975 2.9381 4.2327 6.4745 3.0434 4.3844 6.7066 3.5469 5.1098 7.8162 4 6 3 4 0.9733 1.4074 1.6263 2.0379 2.8146 4.0446 5.9597 7.3805 9.9457 4.2345 5.244 7.0666 6.1231 7.5829 10.218 5 7 4 5 1.4098 1.9687 2.2534 2.7851 3.7333 5.1916 7.3433 8.8194 11.471 3.73 4.4798 5.8268 5.2088 6.2558 8.1368
8 10
1 2 0 1 0.0731 0.1127 0.134 0.1804 0.3567 0.7816 1.2974 2.144 4.3424 11.509 19.019 38.522 17.748 29.329 59.404 2 4 1 3 0.2817 0.4287 0.4997 0.6449 1.1495 1.9982 2.5986 3.0536 6.1226 6.0616 7.1231 14.282 9.2256 10.841 21.737 3 5 2 3 0.5889 0.869 1.0067 1.287 1.9187 2.9056 4.5252 5.8766 8.2174 5.2071 6.7622 9.4557 7.684 9.9788 13.953
4 5 1 2 0.7684 0.8821 0.9334 1.0216 1.1828 1.7977 2.941 4.2075 6.4961 3.3342 4.7699 7.3646 3.8275 5.4757 8.4542 4 6 3 4 0.9693 1.3779 1.5789 1.9862 2.8101 4.0424 5.9607 7.3812 9.8311 4.3259 5.3568 7.1348 6.1498 7.6154 10.143 5 7 4 5 1.4156 1.9429 2.1986 2.7324 3.7279 5.1916 7.3435 8.8195 11.472 3.7797 4.5394 5.9048 5.1876 6.2302 8.1043
© 2016, IRJET | Impact Factor value: 4.45 | ISO 9001:2008 Certified Journal | Page 170