Embed Size (px)
Citation preview
Bådholm et al. Crit Care (2021) 25:291 https://doi.org/10.1186/s13054-021-03715-1
RESEARCH
Cerebrospinal fluid cell count variability is a major confounding factor in external ventricular drain-associated infection surveillance diagnostics: a prospective observational studyMarcus Bådholm1,2* , Jonas Blixt1,2, Martin Glimåker3, Anders Ternhag3,4, Jonas Hedlund3,4 and David W. Nelson1,2
Abstract
Background: External ventricular drain (EVD)-related infections (EVDIs) are feared complications that are difficult to rapidly and correctly diagnose, which can lead to unnecessary treatment with broad-spectrum antibiotics. No readily available diagnostic parameters have been identified to reliably predict or identify EVDIs. Moreover, intraven-tricular hemorrhage is common and affect cerebrospinal fluid (CSF) cellularity. The relationship between leukocytes and erythrocytes is often used to identify suspected infection and triggers the use of antibiotics pending results of cultures, which may take days. Cell count based surveillance diagnostics assumes a homogeneous distribution of cells in the CSF. Given the intraventricular sedimentation of erythrocytes on computed tomography scans this assumption may be erroneous and could affect diagnostics.
Aims: To evaluate the consistency of cell counts in serially sampled CSF from EVDs, with and without patient reposi-tioning, to assess the effect on infection diagnostics.
Methods: We performed a prospective single-center study where routine CSF sampling was followed by a second sample after 10 min, allocated around a standard patient repositioning, or not. Changes in absolute and pairwise cell counts and ratios were analyzed, including mixed regression models.
Results: Data from 51 patients and 162 paired samples were analyzed. We observed substantial changes in CSF cellu-larity as the result of both resampling and repositioning, with repositioning found to be an independent predictor of bidirectional cellular change. Glucose and lactate levels were affected, however clinically non-significant. No positive CSF cultures were seen during the study. Thirty percent (30%) of patients changed suspected EVDI status, as defined by the cell component of local and national guidelines, when resampling after repositioning.
Conclusions: CSF cell counts are not consistent and are affected by patient movement suggesting a heterogene-ity in the intraventricular space. The relationship between leukocytes and erythrocytes was less affected than abso-lute changes. Importantly, cell changes are found to increase with increased cellularity, often leading to changes in
© The Author(s) 2021. Open Access This article is licensed under a Creative Commons Attribution 4.0 International License, which permits use, sharing, adaptation, distribution and reproduction in any medium or format, as long as you give appropriate credit to the original author(s) and the source, provide a link to the Creative Commons licence, and indicate if changes were made. The images or other third party material in this article are included in the article’s Creative Commons licence, unless indicated otherwise in a credit line to the material. If material is not included in the article’s Creative Commons licence and your intended use is not permitted by statutory regulation or exceeds the permitted use, you will need to obtain permission directly from the copyright holder. To view a copy of this licence, visit http:// creat iveco mmons. org/ licen ses/ by/4. 0/. The Creative Commons Public Domain Dedication waiver (http:// creat iveco mmons. org/ publi cdoma in/ zero/1. 0/) applies to the data made available in this article, unless otherwise stated in a credit line to the data.
Open Access
*Correspondence: [email protected] Function Perioperative Medicine and Intensive Care, Karolinska University Hospital, Stockholm, SwedenFull list of author information is available at the end of the article

Page 2 of 14Bådholm et al. Crit Care (2021) 25:291
BackgroundThe external ventricular drain (EVD) is an essential device in the treatment of the neurocritically ill, how-ever, it is associated with a number of complications including EVD related infections (EVDIs) [1]. EVDIs are severe complications, associated with prolonged hospital stay, increased morbidity, and mortality, and may impact long term sequelae [2, 3]. EVDIs are frequently caused by pathogens commonly colonizing the skin at the inser-tion site [4, 5]. Several studies have shown that the use of hygienic routines in the placement and management of EVDs reduces infection rates, suggesting that bacteria are often introduced introgenically, or by extraluminal migration along the catheter [6–8].
In the literature, the reported incidence of EVDIs ranges between 1 and 35% of inserted drains [9–12]. This disparity results from the lack of an international consen-sus on a definition for EVDIs and the use of various diag-nostic criteria across studies [6]. In a neurointensive care setting, clinical symptoms are often difficult to evaluate due to underlying illness [1, 4, 13]. Consequently, in case of suspicion of EVDI, cerebrospinal fluid (CSF) analysis of glucose, lactate, protein, and cell counts are performed with results within hours [14, 15]. CSF bacterial cultures are the golden standard to verify infection, and positive cultures or bacterial identification using 16S sequenc-ing often means true infection but could also be a result of contamination, thus, true positives can be difficult to distinguish based on the cultured bacteria alone [16, 17]. In the neurocritically ill, CSF parameters are frequently influenced by intraventricular hemorrhage (IVH) and CSF cell counts in particular may vary greatly depending on the IVH volume [18]. CSF bacterial cultures may take several days to finalize and prior use of antibiotics may further prolong culture incubation time or cause false negative cultures [13]. Thus, it is seldom possible to delay treatment until the bacterial cultures have finalized [8]. Ideally the clinical picture would help in rejecting false positives, however, parameters and symptoms are often ambiguous.
The cell index has been suggested as a method to adjust for confounding caused by IVH in EVDI surveillance diagnostics, where the ratio of leukocytes to erythrocytes in CSF (LE ratio) is compared to the ratio in peripheral blood [18, 19]. However, the LE ratio fails to account for
the fact that the blood causes an aseptic inflammation, resulting in immigration of leukocytes [1, 18, 20]. Fur-thermore, a greater aseptic response is elicited in patients with greater intraventricular blood volumes [21]. Cell count based metrics, the LE ratio included, are based on the assumption that erythrocytes and leukocytes are homogeneously distributed in the CSF. However, com-puted tomography (CT) scans frequently show intraven-tricular gravity sedimentation of blood, suggesting that a homogeneous distribution is unlikely. Leukocytes and erythrocytes possesses different densities which causes them to separate during gravity sedimentation [22, 23]. With the densities of CSF and blood plasma being simi-lar, intraventricular gravity sedimentation should in the-ory mimic that of gravity sedimentation of whole blood, with leukocytes positioned on top of the erythrocytes in analogy to a buffy coat. Additionally, leukocytes and in particular granulocytes, exhibit anti-sedimentation, a property that have been shown to be exacerbated in critically ill patients, thus, leukocytes may sediment at a slower rate in this patient group [24–26]. As such, leuko-cytes may be more susceptible to turbulence or intraven-tricular shifting compared to erythrocytes.
In summary, due to the pathogens involved, patient characteristics, and confounding factors, early identifica-tion of EVDIs have proven difficult and no CSF param-eter, by itself or in aggregate, have shown to reliably predict or identify EVDIs [5, 27, 28]. Combined with the potential severity of EVDIs, this has led to an excessive use of broad-spectrum antibiotics in this patient group [8, 13]. Methods to adjust for IVH are based on the uncertain assumption that cells are homogeneously dis-tributed in the CSF. If, and how, this affects routinely ana-lyzed CSF parameters has yet to be studied.
We hypothesize that a heterogeneous distribution of blood components in the CSF may affect the variability of routinely analyzed CSF parameters. The aim of this study was to test this hypothesis by testing the reproducibility of serially drawn CSF samples and to evaluate if resam-pling and changes in a patient’s body position affects CSF parameters.
suspected EVDI status. Faster and more precise diagnostics are needed, and methods such as emerging next genera-tion sequencing techniques my provide tools to more timely and accurately guide antibiotic treatment.
Trial Registration NCT04736407, Clinicaltrials.gov, retrospectively registered 2nd February 2021.
Keywords: External ventricular drain, External ventricular drain associated infections, Infection diagnostics, Cerebrospinal fluid, Cell counts

Page 3 of 14Bådholm et al. Crit Care (2021) 25:291
MethodsSetting and participantsThis prospective observational single-center study with allocation, included adult (18 or older) patients treated with EVDs at the neurointensive care unit (NICU) at the Karolinska University Hospital in Stockholm. Exclusion criteria were patients admitted with bacterial or viral CNS infections. The data collection process is shown in Fig. 1.
Data collection and interventionTwo CSF samples (paired samples) were collected biweekly or during workup due to suspected infection as per routine. The first eight patients were considered burn-in patients in order to familiarize the staff with the study and to identify any problems related to the sam-pling routine. All paired samples were allocated indi-vidually to two serially drawn samples performed before and after a standard clinical repositioning (repositioned samples, R-samples), or a 10-min wait period between two serially drawn samples (control samples, C-samples). As such, individual patients could have both R-samples and C-samples. For R-samples, patients were positioned
in a lateral side position two hours prior to sample 1. After the first sample, patients were repositioned to the contralateral side after which the second sample was col-lected. For C-samples, patients were stationary 2 h prior to sample 1 and 10 min separated the two samples, cor-responding to the average time between R-samples, as identified during the burn-in period. Non-sedated and compliant patients were asked to lie in a lateral side posi-tion prior to the first sample in applicable cases. Open drains were closed 5 min prior to the first sample and remained so between samples. 1.5 mL of CSF was drawn and discarded prior to each sample. After the burn-in period of eight patients with only R-samples, all patients were allocated to R-samples or C-samples for each sam-ple session. CSF was analyzed for cell counts, lactate, glucose, and albumin by the Karolinska University Hos-pital Laboratory. The laboratory utilizes machine cell counting using the Sysmex XN10 system. Sampling was performed by a registered nurse. Information on primary diagnosis, length of stay, sex, Glascow Coma Scale (GCS), GCS motor response, and antibiotic treatment were col-lected. The intraventricular blood volume was measured from CT scans using the MPR volume tool in the Sectra
Fig. 1 Study flowchart. All burn-in patients were repositioned (R) before resampling. All others were allocated to R or Control (C) with a 10 min wait time before resampling but no repositioning

Page 4 of 14Bådholm et al. Crit Care (2021) 25:291
IDS7 system (version 21.1.1.1997) as well as estimated using the intraventricular hemorrhage score (IVHS) by Hallevi et al. [29]. The shortest two-dimensional distance between the tip of the EVD catheter and intraventricu-lar blood was measured, as well as the depth of blood sediment in the dorsal horns of the lateral ventricles. The measured IVH volume, IVHS, the two-dimensional cath-eter distance, and the sediment depth were measured or estimated using the earliest CT scans after EVD inser-tion. For IVHS calculation see Additional file 2.
EVDI definitionThe cell count components of the Karolinska University Hospital (earlier Swedish national guideline) EVDI defini-tions were used to denote suspected EVDI status for each individual sample as suspected EVDI (SI) or no EVDI (NI) to identify clinical implications of any observed CSF cell count variability. The cell count component of our local guidelines is one of several metrics used to identify suspected infections and guide antibiotic treatment in wait of culture results. The cell count component of the new current Swedish national guidelines was also tested for the same purpose and is included below [30].
Cell count component of Karolinska University Hospital and earlier national EVDI definition
1 CSF cellular constitution consistent with EVDI as fol-lows:
Cell count component of the current national EVDI guidelines
1 CSF-Leukocytes > 250 ∗ 106 /L with predominantly granulocytes.
Derived variablesDerived variables are defined as below. � is used to denote the difference between paired samples (sample 1 and sample 2) for all CSF parameters. The absolute value (nonnegative) is denoted by two vertical lines (|x|).
A positive � indicates an increase from sample 1 to sam-ple 2.
Granulocytes −Erythrocytes
1000> 100
� = Cell count 2− Cell count 1
Relative � =Cell count 2− Cell count 1
Cell count 1
The relative cell count � is presented as percentage (IQR).
A positive and negative � will here have the same number.
Statistical analysisContinuous variables were described as median, inter-quartile range (IQR), and percentage. The LE ratio was calculated for samples with cell count levels above the lower limit of the Sysmex XN10 system (Additional file 1), as measurement imprecision could produce false positive changes in the LE ratio at lower cell counts. The nonparametric Clustered Wilcoxon Signed Rank test was used to compare the median location shift for each CSF parameter between sample 1 and 2 [31, 32], clustered by Patient ID. The nonparametric Fligner-Killeen test was used to compare the variance of the derived variables between R-samples and C-samples. Mixed effects lin-ear regression analysis was used to identify correlations between CT-derived variables and the pair-wise differ-ences in a univariate setting with Patient ID as a random effect with random intercept, but not slope. Mixed effects logistic regression analysis was used to evaluate the effect of repositioning on pair-wise differences and to identify variables that were correlated to changes in suspected EVDI status between samples, also with Patient ID as random intercept but not slope. Outliers were identified based on Cook’s distance and removed. Fifteen R-sam-ples and 5 C-samples had CSF cell counts below the func-tional sensitivity of the Sysmex XN10 system and were excluded from the mixed effects regression analyses and LE ratio calculations. Thus, 104 R-samples and 38 C-sam-ples had the LE ratio calculated and were included in the mixed effects regression analyses.
All data were analyzed and allocation was performed using computer generated randomization in the statis-tical program R version 4.0.3. Mixed effects regression analyses were performed using R package lme4 v1.1-21. A p-value of p < .05 is considered significant in regres-sion analyses. In tables with multiple comparisons, p-val-ues of p < .01 are bolded.
ResultsDemographicsThe mean age of the cohort was 61 years and 61% were female (Table 1). The dominant NICU admission diag-nosis was subarachnoidal hemorrhage (80%). Sample groups and numbers are depicted (Fig. 1). One hundred
Absolute � = |Cell count 2− Cell count 1|
LE Ratio =Granulocytes
Erythrocytes∗ 1000

Page 5 of 14Bådholm et al. Crit Care (2021) 25:291
sixty-two paired samples were included in the final anal-ysis, 119 R-samples and 43 C-samples. The difference between the two groups was in part attributable to the burn-in period of eight patients and differences in length of stay between patients, contributing to large interindi-vidual differences in the number of samples per patient (Fig. 2).
CSF variablesSubstantial pair-wise differences were seen in both R- and C-samples for granulocytes (absolute � IQR [3, 95.5] and [0, 8.5], respectively) and erythrocytes (abso-lute � IQR [900, 20,050] and [250, 4950], respectively),
where the variability of drawn samples suggests a potential to confound early identification of EVDIs (Table 2.1). The IQR does not clearly reflect the large variability seen in this study as many patients had low cell counts. While we expected cells to be sedimented and affected in a positive direction, changes were both negative and positive in equal amounts (bidirectional), resulting in no significant differences in mean or medi-ans between paired samples on a cohort level ( p > 0.05 , clustered signed rank) (Table 2.2), with the exception of albumin. This suggests a heterogeneous sample space.
The variance of granulocytes (range R-samples [− 3505, 619] and C-samples [− 77, 757]) and erythrocytes
Fig. 2 Paired samples per patient. R-samples (light gray) and C-Samples (dark gray) per patient. The first eight patients were all repositioned before resampling (burn-in period). The number of samples per patient was influenced by length of stay which varied significantly between patients
Page 6 of 14Bådholm et al. Crit Care (2021) 25:291
(range R-samples [− 271,500, 331,700] and C-samples [− 47,500, 121,100]) was significantly greater ( p < .01 , Fligner Killeen) (Table 2.1, Fig. 3) in the R-samples, sug-gesting that movement affect variability, again bidirec-tional. The correlation between repositioning and cell count � ’s and derivatives were evaluated with logistic regression mixed model analyses with Patient ID as a random effect (Table 3). The absolute � , but not the � or relative � , were significantly related to repositioning for all variables, supporting that the variance is greater in the repositioned group, but that the direction of change is random ( p < .05 , Table 3). To summarize, the exacer-bated CSF cell count variability seen in the R-samples was significantly correlated to repositioning of the patient in a mixed effects setting (Table 3), and not merely an effect of sample group heterogeneity.
Cell counts varied more compared to glucose, lac-tate, and albumin, which exhibited an intermediate level, suggesting that molecular weight or size may also influence variability (Fig. 4). Here, the paired LE ratio is more highly correlated than erythrocytes and leuko-cytes individually, suggesting that changes may be in concert between cell types. However, the correlation
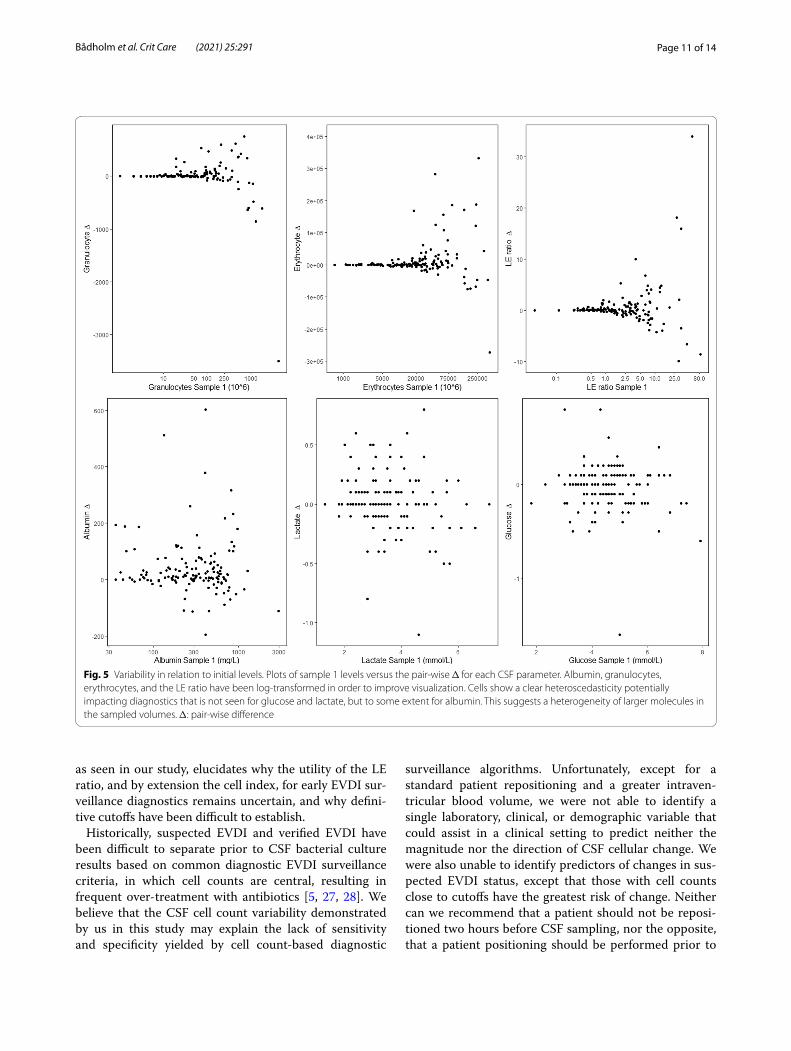
between paired samples of monocytes and granulocytes is stronger than that of leukocytes and erythrocytes (Additional file 3), suggesting that cell types are differen-tially distributed in the sample space. Pair-wise variabil-ity increased with increasing levels in sample 1 for cells in particular (Fig. 5), but not glucose and lactate, conse-quently cells showed larger variability at levels used for clinical EVDI cutoffs for suspected infection. In conclu-sion, CSF cell counts varied significantly and could not be reproduced in serially drawn CSF, where R-samples exhibited greater variability.
Cell count criteria for suspected EVDIWhen the Stockholm EVDI cell count criteria for sus-pected infection were applied on our cohort as to evaluate changes of suspected EVDI status (suspected infection, SI, or no infection, NI) between paired sam-ples, 14 R-samples from 13 unique patients changed EVDI diagnostic group, corresponding to 30% of all patients with collected R-samples in our cohort. Eleven R-samples changed from NI to SI, and 3 R-samples from SI to NI. One patient had changes in both directions with one paired sample that changed from NI to SI, and one that changed from SI to NI. No changes in suspected EVDI status were seen for any C-samples. Two patients were initiated on broad-spectrum antibiotics due to sig-nificant pleocytosis in the second sample. No patient had a positive CSF culture confirmed EVDI in this study.
Repositioning as a cause of suspected EVDI group change could not computationally be evaluated with logistic regression as all positive events occurred solely for R-samples. Repositioning was, however, significantly correlated with suspected EVDI group change in a chi-squared test ( p = .042 ) suggesting that cell changes in regions near diagnostic cutoffs may be influenced by patient movement. The cell count criteria from the new national EVDI guidelines applied to the sample cohort resulted in 18 R-samples and 2 C-samples from 16 unique patients changing diagnostic status ( p = .06 ) in logistic regression. No random effects were seen for patient ID. No other studied parameter was found significantly cor-related with changes of suspected EVDI status (Table 4). In summary, 30% of all patients with R-samples changed diagnostic EVDI status at least once during the study period, indicating that EVDI surveillance diagnostics based on cell counts are neither sensitive nor specific in a clinical setting.
CT‑derived variablesCatheter distance, sediment depth, measured blood vol-ume, and IVHS were calculated or estimated based on the first CT scan after EVD insertion. The correlation between all CT-derived variables and the observed � ’s
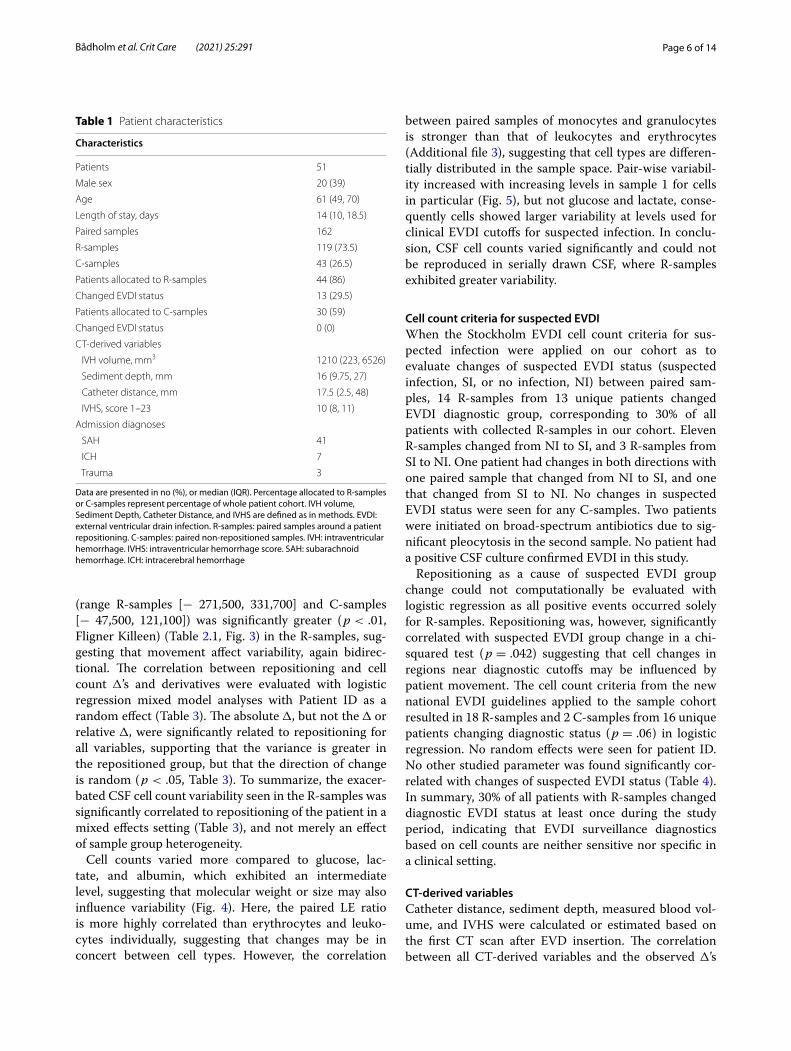
Table 1 Patient characteristics
Data are presented in no (%), or median (IQR). Percentage allocated to R-samples or C-samples represent percentage of whole patient cohort. IVH volume, Sediment Depth, Catheter Distance, and IVHS are defined as in methods. EVDI: external ventricular drain infection. R-samples: paired samples around a patient repositioning. C-samples: paired non-repositioned samples. IVH: intraventricular hemorrhage. IVHS: intraventricular hemorrhage score. SAH: subarachnoid hemorrhage. ICH: intracerebral hemorrhage
Characteristics
Patients 51
Male sex 20 (39)
Age 61 (49, 70)
Length of stay, days 14 (10, 18.5)
Paired samples 162
R-samples 119 (73.5)
C-samples 43 (26.5)
Patients allocated to R-samples 44 (86)
Changed EVDI status 13 (29.5)
Patients allocated to C-samples 30 (59)
Changed EVDI status 0 (0)
CT-derived variables
IVH volume, mm3 1210 (223, 6526)
Sediment depth, mm 16 (9.75, 27)
Catheter distance, mm 17.5 (2.5, 48)
IVHS, score 1–23 10 (8, 11)
Admission diagnoses
SAH 41
ICH 7
Trauma 3

Page 7 of 14Bådholm et al. Crit Care (2021) 25:291
Table 2 Comparison of CSF variable variances between repositioned and non-repositioned samples and medians between serial samples
Data are presented as IQR (square brackets) and in the case of the � , the range is also included (no brackets) in 2.1. Data are presented as medians in 2.2. Sample medians were evaluated with the clustered Wilcoxon signed rank, clustered by Patient ID. Variances were evaluated with the Fligner–Killeen test. The results of p < .01 are bolded. As patients are represented in the R-samples and C-samples unequally, mixed effects regression models are required for further interpretation of this data. � : pair-wise difference, including absolute and relative derivatives. R-samples: Repositioned samples. C-Samples: Non-repositioned control samples
R‑samples C‑samples P‑value Statistical test
2.1 Outcome Variance R-samples versus C-samples
Granulocytes, 106
� , Range − 3505 , 619 − 77 , 757
� , IQR [− 4.5 , 50.5] [− 1 , 2.5] < .001 Fligner Killeen
Relative � , IQR [− 31 , 80] [− 10 , 15] < .001 Fligner Killeen
Absolute � , IQR [3 , 95.5] [0 , 8.5] < .001 Fligner Killeen
Erythrocytes, 106
� , Range − 271,500 , 331,700 − 47,500 , 121,100
� , IQR [− 2450 , 13,150] [− 400 , 2450] < .001 Fligner Killeen
Relative � , IQR [− 23 , 56] [− 10 , 20] < .001 Fligner Killeen
Absolute � , IQR [900 , 20,050] [250 , 4950] < .001 Fligner Killeen
Albumin, mg/L
� , Range − 222 , 603 − 68 , 378
� , IQR [− 3 , 72] [− 1 , 28] < .01 Fligner Killeen
Relative � , IQR [− 1.9 , 20] [− 0.5 , 11] .02 Fligner Killeen
Absolute � , IQR [8 , 90.5] [3 , 30.5] < .001 Fligner Killeen
Lactate, mmol/L
� , Range − 1.1 , 0.8 − 0.3 , 0.4
� , IQR [− 0.1 , 0.1] [0 , 0.05] < .01 Fligner Killeen
Relative � , IQR [− 3.2 , 4] [0 , 1.1] < .01 Fligner Killeen
Absolute � , IQR [0.1 , 0.2] [0 , 0.1] .1 Fligner Killeen
Glucose, mmol/L
� , Range − 0.6 , 0.8 − 1.6 , 0.2
� , IQR [− 0.2 , 0.1] [− 0.1 , 0] < .01 Fligner Killeen
Relative � , IQR [− 2.7 , 2.4] [− 2.1 , 0] < .01 Fligner Killeen
Absolute � , IQR [0.1 , 0.2] [0 , 0.1] .04 Fligner Killeen
LE Ratio
� , Range − 72.1 , 40.1 − 2.1 , 3.9
� , IQR [− 0.55 , 0.64] [− 0.25 , 0.38] .02 Fligner Killeen
Relative � , IQR [− 15 , 35] [− 19 , 17] .06 Fligner Killeen
Absolute � , IQR [0.15 , 2] [0.066 , 1.3] < .01 Fligner Killeen
R‑Samples C‑Samples
Sample 1 Sample 2 P‑value Sample 1 Sample 2 P‑value Statistical test
2.2 Outcome Median Sample 1 versus Sample 2
Granulocytes, 106 40 54 .33 13 14 .81 Clustered Signed rank
Erythrocytes, 106 22,100 22,300 .25 7700 6700 .37 Clustered Signed rank
Albumin, mg/L 318 333 < .001 235 251 .02 Clustered Signed rank
Lactate, mmol/L 3.2 3.3 .56 3.1 3.1 .53 Clustered Signed rank
Glucose, mmol/L 4.5 4.5 .19 4.5 4.5 .35 Clustered Signed rank
LE ratio 2.16 2.24 .25 2.51 2.31 .76 Clustered Signed rank

Page 8 of 14Bådholm et al. Crit Care (2021) 25:291
and derivatives for all CSF parameters were evaluated in a univariate mixed effects regression model with Patient ID as a random effect. IVH volume was not seen signifi-cantly related to any CSF variable. Other CT parameters appear most highly related to erythrocyte-derived vari-ables (Additional file 4), but not the direction of change. However, no significance here withstands adjustment for multiple testing and the explanatory value is found lim-ited with no pseudo R2 above 0.0635 for the fixed effects.
DiscussionIn this study we tested the reproducibility of two seri-ally drawn CSF samples in patients who were allocated to sampling around a routine patient repositioning, or not. We show that serially drawn CSF parameters, and cell counts in particular, were subject to significant vari-ability which may greatly influence early identification of EVDIs and impact clinical decision making . Additionally, patient movement was also shown to effect cell counts and diagnostics.
Fig. 3 Variability of paired samples. Density plots of the pair-wise � distributions for R-samples (light gray) and C-samples (dark gray) for all CSF parameters, respectively. The x-axis shows the pair-wise differences or � . The area under each will be sum-able to 1, defining the y-axis values. One R-sample with a � of − 3505 was excluded from the granulocyte plot in order to improve visualization. R-samples: paired samples around a patient repositioning. C-samples: paired non-repositioned samples

Page 9 of 14Bådholm et al. Crit Care (2021) 25:291
Homogeneity of the sample space is assumed in EVDI surveillance diagnostics but has not been tested previ-ously. Gravity sedimentation of erythrocytes is seemingly apparent from CT imaging in these patients but the effect on sampled cell counts is unclear. The effect of cellular sedimentation in the CSF has been studied previously, but only relating to lumbar versus ventricular drains.
Previous research and case studies have found cellu-larity to be increased in lumbar CSF compared to ven-tricular CSF [33–36]. Additionally, both Podkovik et al and Gerber et al noted the risk of these findings impact-ing early infection diagnostics [34, 35]. As a sedimenta-tion effect that may impact clinical decision making have been demonstrated for the lumbar versus the ventricular region, it is somewhat surprising that the local sedimen-tation effect in the ventricles have not been previously studied.
This study provides insight to the assumption of homo-geneity. We found substantial cell variability between
serially drawn CSF samples with the largest difference observed being -3505*106 granulocytes in the second sample, suggesting an initial heterogeneity in the sample space. However, in opposition with our initial hypothesis that there would be a predominate increase of leukocytes (due to potential turbulence caused by initial sampling or the effect of repositioning), changes were generally bidi-rectional. Bidirectional changes make theoretical sense, as blood can be shifted both away and toward the cath-eter in the intraventricular space. Repositioning, and thus patient movement, was also found significantly related to changes in cell count, further compounding that of serial sampling. Moreover, changes, and direction of changes, of cell levels could not be readily predicted from our CT-derived variables, further suggesting that an initial het-erogeneity of the sample space leads to random direction of change. In aggregate, it is clear from this study that a basic assumption of EVDI surveillance diagnostics that cells are homogeneously distributed in the CSF is erro-neous and that resampling and a simple routine patient repositioning both result in changes in sampled CSF cell counts, impacting early identification of EDVIs.
The potential impact of variable CSF cell counts on EVDI surveillance diagnostics is readily seen in this study where 30% of repositioned patients changed EVDI diag-nostic status in the course of 10 min based on the cell count criteria for suspected infection. We also noted that variability increased with increasing cell counts levels (heteroscedasticity) such that large changes are found near to diagnostic cutoff levels. This heteroscedasticity, as shown in Fig. 5, is apparent for cells but not for lac-tate and glucose, with albumin showing an intermedi-ate nature, suggesting that molecular size or weight may be related to homogeneity. Generally, serial changes in lactate and glucose are found small and clinically insig-nificant and may represent more stable components of diagnostic algorithms. In summary, variability of cell counts, especially near cutoffs used for EVDI surveil-lance diagnostics are highly impacted by sample space heterogeneity.
The LE ratio, or variations thereof based on the rationale that the number of leukocytes is related to the amount of blood in the non-infected state, is one of the methods used in EVDI surveillance diagnostics. We observed significant changes of the LE ratio when resa-mpling. The changes in cell counts were bidirectional and independent between cell types. Repositioning exac-erbated changes in the LE ratio, but we were not able to predict neither the magnitude nor the direction of the change which makes any variability difficult to adjust for in a clinical setting. While changes in the LE ratio were more stable compared to individual cell types, the vari-ability increased here also with higher ratios in the first
Table 3 Effect of repositioning
Univariate mixed effect logistic regression analysis toward repositioning. The results of p < .01 are bolded. Changes in all parameters can be seen attributable to repositioning, but not unidirectional and therefore predominately in the absolute � representation. *indicates log transformation of variable. � : pair-wise difference, including absolute and relative derivatives
Predictor variables RepositionedP‑value
LE ratio
�* .1
Relative � .04
Absolute �* < .01
Granulocytes
�* .09
Relative � .046
Absolute �* < .001
Erythrocytes
�* .61
Relative � .1
Absolute �* < .001
Albumin
�* .06
Relative � .12
Absolute �* .01
Lactate
� .64
Relative � .36
Absolute � < .01
Glucose
� .78
Relative � .93
Absolute � < .01

Page 10 of 14Bådholm et al. Crit Care (2021) 25:291
sample (Fig. 5). Appropriate LE ratio cutoffs have been difficult to establish with satisfactory sensitivity and specificity for early EVDI identification. The cell index have been suggested to improve sensitivity and specific-ity for EVDI surveillance diagnostics [19]. A CI of 10 as a cutoff to identify EVDIs early with a sensitivity of 80% and specificity of 75% was suggested by Liew et al. [37].
As they included 95 patients with and without IVH the diagnostic utility of the CI in EVDI surveillance diagnos-tics in patients with large intraventricular blood volumes remain uncertain. In contrast, Lunardi et al. suggested a vastly different CI of 2.9 as a suspected EVDI cutoff with a sensitivity of 95% and a specificity of 92.9%, in their prospective study of 34 patients [18]. Thus, variability,
Fig. 4 Correlations of paired samples. Scatter plots comparing sample 1 on the x-axis with sample 2 on the y-axis for each CSF parameter. The R2 of linear regression is given. The correlations are seen weaker for cells exhibiting a greater variability of paired samples
Page 11 of 14Bådholm et al. Crit Care (2021) 25:291
as seen in our study, elucidates why the utility of the LE ratio, and by extension the cell index, for early EVDI sur-veillance diagnostics remains uncertain, and why defini-tive cutoffs have been difficult to establish.
Historically, suspected EVDI and verified EVDI have been difficult to separate prior to CSF bacterial culture results based on common diagnostic EVDI surveillance criteria, in which cell counts are central, resulting in frequent over-treatment with antibiotics [5, 27, 28]. We believe that the CSF cell count variability demonstrated by us in this study may explain the lack of sensitivity and specificity yielded by cell count-based diagnostic
surveillance algorithms. Unfortunately, except for a standard patient repositioning and a greater intraven-tricular blood volume, we were not able to identify a single laboratory, clinical, or demographic variable that could assist in a clinical setting to predict neither the magnitude nor the direction of CSF cellular change. We were also unable to identify predictors of changes in sus-pected EVDI status, except that those with cell counts close to cutoffs have the greatest risk of change. Neither can we recommend that a patient should not be reposi-tioned two hours before CSF sampling, nor the opposite, that a patient positioning should be performed prior to
Fig. 5 Variability in relation to initial levels. Plots of sample 1 levels versus the pair-wise � for each CSF parameter. Albumin, granulocytes, erythrocytes, and the LE ratio have been log-transformed in order to improve visualization. Cells show a clear heteroscedasticity potentially impacting diagnostics that is not seen for glucose and lactate, but to some extent for albumin. This suggests a heterogeneity of larger molecules in the sampled volumes. � : pair-wise difference

Page 12 of 14Bådholm et al. Crit Care (2021) 25:291
CSF sampling, as we cannot determine which regime would yield CSF samples that best represent true intra-ventricular conditions. In summary, this study introduces further complexity into the use of surveillance algorithms using cell counts. We suggest that future studies aim to investigate less cell count centric algorithms or focus on novel techniques for rapid direct bacterial detection.
LimitationsThere are several limitations to this study. This is a sin-gle-center clinical trial and the external validity of this study may need further validation. As different cent-ers will have different treatment regimes, routines, and algorithms concerning EVD care and EVDI surveillance diagnostics, findings may be to some extent be popula-tion and location dependent. Moreover, we have not studied the time component of cell change, where the aseptic inflammation component might be expected to increase over time, and heterogeneity might itself be related to the inflammatory process. However, as the risk of true infection also increases over time, late variability would also be expected to impact diagnostics. Addition-ally, our study cohort is 80% SAH patients, and power will not permit if there is a disease-related component to
variability. As, we have no positive cultures we provide no information on if heterogeneity is different in true infec-tion. Finally, our sample groups are unbalanced, mainly due to a burn-in period where all patient samples were allocated around repositioning, with by chance long ICU stays. We have attempted to account for this using mixed model analyses.
ConclusionsCurrent methods of adjusting for IVH in EVDI sur-veillance diagnostics are based on the assumption that blood is homogeneously distributed in the CSF and that CSF sampling provides a fair representation of intra-ventricular blood volumes and granulocyte counts. Our findings in this prospective observational study with allocation to repositioning or not suggest that this assumption is erroneous. CSF cell counts varied greatly in serially drawn samples with repositioning also sig-nificantly contributing to change in mixed effect mod-els. This change was seen to be in both directions and is larger at higher counts, confounding EVDI surveillance diagnostics. Importantly, one-third of the patients in our repositioned group changed suspected EVDI sta-tus in the time frame of 10 min between CSF samplings based on the cell count criteria from local and national EVDI diagnostic guidelines. Two patients who would otherwise not have been initiated on broad-spectrum antibiotics received treatment due to significant pleo-cytosis in the second sample. Consequently, analysis of current CSF parameters may not be adequate to distin-guish between natural aseptic inflammation and EVDIs in neurocritically ill patients. Our findings add yet more complexity into identifying and defining EVDIs prior to bacterial cultures and may explain why no routinely analyzed CSF parameter, singularly or in aggregate, have been found to reliably predict or identify EVDIs.
Faster and more precise diagnostics are needed, and methods such as emerging next-generation sequencing techniques may provide tools to more timely and accu-rately exclude EVDIs and guide antibiotic treatment.
Supplementary InformationThe online version contains supplementary material available at https:// doi. org/ 10. 1186/ s13054- 021- 03715-1.
Additional file 1: Sysmex XN10 machine cell counting.docx: Information regarding Sysmex XN10 machine cell counting and the term functional sensitivity.
Additional file 2: Intraventricular Hemorrhage Score (IVHS).docx: Informa-tion regarding IVHS calculation.
Additional file 3: Correlation of paired sample differences and cell types.PNG: Scatter plots comparing the granulocyte Δ with the erythrocyte Δ and the granulocyte Δ with the monocyte Δ, respectively. Granulocytes and monocytes exhibit a stronger correlation (R2 = 0,624) vs. granulocytes
Table 4 Changes of diagnostic status and suspected infection
Univariate logistic mixed model analyses toward diagnostic EVDI status change. No variable can be seen to predict change of status. The variable repositioning could, however, not be included in this analysis computationally due to zero events in the C-samples, thus noted not applicable (NA), but was seen statistically significant ( p = .042 ) with a Chi-Squared test. IVH volume, sediment depth, catheter distance, and IVHS are defined in the methods section. IVHS: Intraventricular Hemorrhage Score, see methods section. EVDI: External Ventricular Drain Infection. GCS: Glascow Coma Scale. GCS motor: Glascow Coma Scale motor response
Predictor variables Diagnostic EVDI status changed
P‑value
Repositioned NA
Erythrocytes 1 .4
Leukocytes 1 .74
Monocytes 1 .82
Granulocytes 1 .73
Glucose 1 .61
Lactate 1 .6
Albumin 1 .74
LE ratio 1 .47
Sample number .58
Catheter distance .51
Sediment depth .9
IVHS .55
IVH volume .24
GCS .25
GCS motor .16
Page 13 of 14Bådholm et al. Crit Care (2021) 25:291
and erythrocytes (R2 = 0,346) suggesting that a greater concordance is seen for cells of similar types. Δ: pair-wise difference.
Additional file 4: Computed tomography (CT)-related predictors of change between pair samples.PNG: Table with univariate mixed model linear regression analyses. The results of p < .01 are bolded. CT param-eters appear most correlated with changes in erythrocytes, but not with direction of change. IVH volume, sediment depth, catheter distance, and IVHS are defined in the methods section. Δ: pair-wise difference, including absolute and relative derivatives. IVHS: intraventricular hemorrhage score. IVH: intraventricular hemorrhage.
AcknowledgementsWe acknowledge and thank Marianna Ioanna Kotopouli, biostatician at the Karolinska Institute, for valuable statistical input. We further acknowledge the staff at the Karolinska University Hospital NICU without whom this study would have been impossible to perform.
Authors’ contributionsDWN conceived of the study and participated in data analysis and interpreta-tion as well as hypothesis generation, study design, and helped with manu-script drafting. MB participated in study design, data collection, data analysis, data interpretation and drafted the manuscript. JB, MG, AT, and JH participated in hypothesis generation, data interpretation and helped with drafting the manuscript. All authors’ read and approved the final manuscript.
FundingOpen access funding provided by Karolinska Institute. This study was in part funded by the regional Agreement on Medical Training and Clinical Research (ALF).
Availability of data and materialsThe data set used and analyzed are available from the corresponding author on reasonable request.
Declarations
Ethics approval and consent to participateThe study was approved by the local ethics committee in Stockholm (DNR 2017/1544-31/1). Written informed consent to participate was acquired from nearest of kin.
Consent for publicationNot applicable.
Competing interestsThe authors declare that they have no competing interests.
Author details1 Function Perioperative Medicine and Intensive Care, Karolinska University Hospital, Stockholm, Sweden. 2 Department of Physiology and Pharmacology, Karolinska Institute, Stockholm, Sweden. 3 Department of Infectious Diseases, Karolinska University Hospital, Stockholm, Sweden. 4 Division of Infectious Diseases, Department of Medicine, Karolinska Institute, Stockholm, Sweden.
Received: 20 April 2021 Accepted: 29 July 2021
References 1. Beer R, Lackner P, Pfausler B, Schmutzhard E. Nosocomial ventriculitis and
meningitis in neurocritical care patients. J Neurol. 2008;255(11):1617–24. 2. Hagel S, Bruns T, Pletz MW, Engel C, Kalff R, Ewald C. External ventricular
drain infections: risk factors and outcome. Interdiscip Perspect Infect Dis. 2014;2014:708531.
3. Hersh EH, Yaeger KA, Neifert SN, Kim J, Dangayach NS, Weiss N. Patterns of healthcare costs due to external ventricular drain infections. World Neurosurg. 2019;128:e31–7.
4. Ramanan M, Lipman J, Shorr A, Shankar A. A meta-analysis of ventriculos-tomy-associated cerebrospinal fluid infections. BMC Infect Dis. 2015;15:3.
5. Citerio G, Signorini L, Bronco A, Vargiolu A, Rota M, Latronico N, et al. External ventricular and lumbar drain device infections in ICU patients: a prospective multicenter Italian study. Crit Care Med. 2015;43(8):1630–7.
6. Lewis A, Wahlster S, Karinja S, Czeisler BM, Kimberly WT, Lord AS. Ventric-ulostomy-related infections: the performance of different definitions for diagnosing infection. Br J Neurosurg. 2016;30(1):49–56.
7. Kim JH, Desai NS, Ricci J, Stieg PE, Rosengart AJ, Härtl R, et al. Fac-tors contributing to ventriculostomy infection. World Neurosurg. 2012;77(1):135–40.
8. Mounier R, Lobo D, Cook F, Fratani A, Attias A, Martin M, et al. Clinical, biological, and microbiological pattern associated with ventriculostomy-related infection: a retrospective longitudinal study. Acta Neurochir. 2015;157(12):2209–17.
9. Dos Santos SC, Fortes Lima TT, Lunardi LW, Stefani MA. External ventricu-lar drain-related infection in spontaneous intracerebral hemorrhage. World Neurosurg. 2017;99:580–3.
10. Lwin S, Low SW, Choy DKS, Yeo TT, Chou N. External ventricular drain infections: successful implementation of strategies to reduce infection rate. Singapore Med J. 2012;53(4):255–9.
11. Chatzi M, Karvouniaris M, Makris D, Tsimitrea E, Gatos C, Tasiou A, et al. Bundle of measures for external cerebral ventricular drainage-associated ventriculitis. Crit Care Med. 2014;42(1):66–73.
12. Arabi Y, Memish ZA, Balkhy HH, Francis C, Ferayan A, Al Shimemeri A, et al. Ventriculostomy-associated infections: incidence and risk factors. Am J Infect Control. 2005;33(3):137–43.
13. Beer R, Pfausler B, Schmutzhard E. Infectious intracranial complications in the neuro-ICU patient population. Curr Opin Crit Care. 2010;16(2):117–22.
14. Brouwer MC, Tunkel AR, van de Beek D. Epidemiology, diagnosis, and antimicrobial treatment of acute bacterial meningitis. Clin Microbiol Rev. 2010;23(3):467–92.
15. van Ettekoven CN, van de Beek D, Brouwer MC. Update on community-acquired bacterial meningitis: guidance and challenges. Clin Microbiol Infect Off Publ Eur Soc Clin Microbiol Infect Dis. 2017;23(9):601–6.
16. Lozier AP, Sciacca RR, Romagnoli MF, Connolly ES. Ventriculostomy-related infections: a critical review of the literature. Neurosurgery. 2008;62(Suppl 2):688–700.
17. Tunkel AR, Hasbun R, Bhimraj A, Byers K, Kaplan SL, Scheld WM, et al. 2017 Infectious Diseases Society of America’s clinical practice guidelines for healthcare-associated ventriculitis and meningitis. Clin Infect Dis Off Publ Infect Dis Soc Am. 2017;64(6):e34–65.
18. Lunardi LW, Zimmer ER, Dos Santos SC, Merzoni J, Portela LV, Stefani MA. Cell index in the diagnosis of external ventricular drain-related infections. World Neurosurg. 2017;106:504–8.
19. Pfausler B, Beer R, Engelhardt K, Kemmler G, Mohsenipour I, Schmutzhard E. Cell index-a new parameter for the early diagnosis of ventriculostomy (external ventricular drainage)-related ventriculitis in patients with intra-ventricular hemorrhage? Acta Neurochir. 2004;146(5):477–81.
20. Beer R, Pfausler B, Schmutzhard E. Management of nosocomial external ventricular drain-related ventriculomeningitis. Neurocrit Care. 2009;10(3):363–7.
21. Fam MD, Zeineddine HA, Eliyas JK, Stadnik A, Jesselson M, McBee N, et al. CSF inflammatory response after intraventricular hemorrhage. Neurology. 2017;89(15):1553–60.
22. Norouzi N, Bhakta HC, Grover WH. Sorting cells by their density. PLoS ONE. 2017;12(7):e0180520.
23. Lui AC, Polis TZ, Cicutti NJ. Densities of cerebrospinal fluid and spinal anaesthetic solutions in surgical patients at body temperature. Can J Anaesth J Can D’anesth. 1998;45(4):297–303.
24. Bogar LL, Tarsoly PP. Gravity sedimentation of leukocytes is partially independent from erythrocyte sedimentation. Clin Hemorheol Microcirc. 2006;34(3):439–45.
25. Bogar L, Tekeres M. Leukocyte flotation during gravity sedimentation of the whole blood. Clin Hemorheol Microcirc. 2000;22(1):29–33.
26. Pember SO, Barnes KC, Brandt SJ, Kinkade JM. Density heterogeneity of neutrophilic polymorphonuclear leukocytes: gradient fractionation and relationship to chemotactic stimulation. Blood. 1983;61(6):1105–15.
27. Pfisterer W, Mühlbauer M, Czech T, Reinprecht A. Early diagnosis of exter-nal ventricular drainage infection: results of a prospective study. J Neurol Neurosurg Psychiatry. 2003;74(7):929–32.

Page 14 of 14Bådholm et al. Crit Care (2021) 25:291
• fast, convenient online submission
•
thorough peer review by experienced researchers in your field
• rapid publication on acceptance
• support for research data, including large and complex data types
•
gold Open Access which fosters wider collaboration and increased citations
maximum visibility for your research: over 100M website views per year •
At BMC, research is always in progress.
Learn more biomedcentral.com/submissions
Ready to submit your researchReady to submit your research ? Choose BMC and benefit from: ? Choose BMC and benefit from:
28. Schade RP, Schinkel J, Roelandse FWC, Geskus RB, Visser LG, van Dijk JMC, et al. Lack of value of routine analysis of cerebrospinal fluid for prediction and diagnosis of external drainage-related bacterial meningitis. J Neuro-surg. 2006;104(1):101–8.
29. Hallevi H, Dar NS, Barreto AD, Morales MM, Martin-Schild S, Abraham AT, et al. The IVH score: a novel tool for estimating intraventricular hemorrhage volume: clinical and research implications. Crit Care Med. 2009;37(3):969–74.
30. Brink M, Bruchfeld J, Fredlund H, Glimåker M, Ljunghill-Hedberg A, Mehle C, et al. Vårdprogram Bakteriella CNS-infektioner—Avser vuxna patienter med akut bakteriell meningit, neurokirurgisk infektion, tuberkulös menin-git, hjärnabscess och neuroborrelios. Svenska Infektionsläkarföreningen; 2020. https:// infek tion. net/ vardp rogram/ cns- infek tioner- bakte riell a/#.
31. Rosner B, Glynn RJ, Lee MLT. The Wilcoxon signed rank test for paired comparisons of clustered data. Biometrics. 2006;62(1):185–92.
32. Jiang Y, Lee MLT, He X, Rosner B, Yan J. Wilcoxon rank-based tests for clustered data with R package clusrank. J Stat Softw. 2020;96(1):1–26.
33. Sommer JB, Gaul C, Heckmann J, Neundörfer B, Erbguth FJ. Does lumbar cerebrospinal fluid reflect ventricular cerebrospinal fluid? A prospec-tive study in patients with external ventricular drainage. Eur Neurol. 2002;47(4):224–32.
34. Gerber J, Tumani H, Kolenda H, Nau R. Lumbar and ventricular CSF protein, leukocytes, and lactate in suspected bacterial CNS infections. Neurology. 1998;51(6):1710–4.
35. Podkovik S, Kashyap S, Wiginton J, Kang C, Mo K, Goodrich M, et al. Comparison of ventricular and lumbar cerebrospinal fluid composition. Cureus. 2020;12(7):e9315.
36. Naija W, Matéo J, Raskine L, Timsit JF, Lukascewicz AC, George B, et al. Case report: greater meningeal inflammation in lumbar than in ventricu-lar region in human bacterial meningitis. Crit Care (London, England). 2004;8(6):R491-494.
37. Liew S, Richards S, Ho KM, Murray R. Utility of the cell index in predicting external ventricular drain-related ventriculo-meningitis. Neurocrit Care. 2020;33(3):776–84.
Publisher’s NoteSpringer Nature remains neutral with regard to jurisdictional claims in pub-lished maps and institutional affiliations.