Embed Size (px)
Citation preview

RESEARCH ARTICLE
Cerebellar volume as imaging outcome in
progressive multiple sclerosis
Matilde Inglese1,2,3,4*, Maria Petracca1☯, Enricomaria Mormina1,5☯, Anat Achiron6,7,
Rebecca Straus-Farber8, Shmuel Miron6, Michelle Fabian1, Stephen Krieger1,
Aaron Miller1, Fred Lublin1, Maria Pia Sormani9
1 Department of Neurology, Icahn School of Medicine at Mount Sinai, New York, NY, United States of
America, 2 Department of Radiology Icahn School of Medicine at Mount Sinai, New York, NY, United States
of America, 3 Department of Neuroscience, Icahn School of Medicine at Mount Sinai, New York, NY, United
States of America, 4 Department of Neuroscience, Rehabilitation, Ophthalmology, Genetics, and Mother-
Child health, University of Genoa, and IRCCS Azienda Ospedale Università San Martino-IST, Genova, Italy,
5 Department of Biomedical Sciences and of Morphologic and Functional Images, University of Messina,
Messina, Italy, 6 Multiple Sclerosis Center, Sheba Medical Center, Tel Hashomer, Israel, 7 Sackler Faculty
of Medicine, Tel-Aviv University, Tel-Aviv, Israel, 8 Department of Neurology, Columbia University, New
York, NY, United States of America, 9 Biostatistics Unit, University of Genoa, Genoa, Italy
☯ These authors contributed equally to this work.
Abstract
Background and purpose
To assess whether cerebellar volumes changes could represent a sensitive outcome mea-
sure in primary-progressive MS.
Material and methods
Changes in cerebellar volumes over one-year follow-up, estimated in 26 primary-progres-
sive MS patients and 20 controls with Freesurfer longitudinal pipeline, were assessed using
Wilcoxon test and tested for their correlation with disability worsening by a logistic regres-
sion. Clinical worsening was defined as EDSS score increase or change of >20% for 25-foot
walk test or 9-hole peg test scores at follow-up. Sample sizes for given treatment effects
and power were calculated. The findings were validated in an independent cohort of 20 pri-
mary-progressive MS patients.
Results
Significant changes were detected in brain T1 lesion volume (p<0.01), cerebellar T2 and T1
lesion volume (p<0.01 and p<0.05), cerebellar volume, cerebellar cortex volume, and cere-
bellar WM volume (p<0.001). Only cerebellar volume and cerebellar cortex volume percent-
age change were significantly reduced in clinically progressed patients when compared to
patients who did not progress (p<0.01; respectively AUC of 0.91 and 0.96). Cerebellar vol-
ume percentage changes were consistent in the exploration and validation cohorts (cerebel-
lar volume -1.90±1.11% vs -1.47±2.30%; cerebellar cortex volume -1.68±1.41% vs -1.56
±2.23%). Based on our results the numbers of patients required to detect a 30% effect are
PLOS ONE | https://doi.org/10.1371/journal.pone.0176519 April 24, 2017 1 / 11
a1111111111
a1111111111
a1111111111
a1111111111
a1111111111
OPENACCESS
Citation: Inglese M, Petracca M, Mormina E,
Achiron A, Straus-Farber R, Miron S, et al. (2017)
Cerebellar volume as imaging outcome in
progressive multiple sclerosis. PLoS ONE 12(4):
e0176519. https://doi.org/10.1371/journal.
pone.0176519
Editor: Kewei Chen, Banner Alzheimer’s Institute,
UNITED STATES
Received: February 17, 2017
Accepted: April 12, 2017
Published: April 24, 2017
Copyright: © 2017 Inglese et al. This is an open
access article distributed under the terms of the
Creative Commons Attribution License, which
permits unrestricted use, distribution, and
reproduction in any medium, provided the original
author and source are credited.
Data Availability Statement: All relevant data are
within the paper.
Funding: This study was supported in part by
Novartis Pharmaceuticals (CFTY20DUSNC15T),
National Multiple Sclerosis Society (NMSS RG
5120A3/1), and the Noto Foundation to MI and by
a research fellowship from Fondazione Italiana
Sclerosi Multipla (2013/B/7) to MP. The funders
had no role in study design, data collection and
analysis, decision to publish, or preparation of the
manuscript.

81 per arm for cerebellar volume and 162 per arm for cerebellar cortex volume (90% power,
type 1 error alpha = 0.05).
Conclusions
Our results suggest a role for cerebellar cortex volume and cerebellar volume as potential
short-term imaging metrics to monitor treatment effect in primary-progressive MS clinical
trials.
Introduction
One of the barriers to assessing potential neuroprotective agents in multiple sclerosis (MS)
is the slow rate of disability accrual. Unfortunately, clinical outcome measures exhibit poor
sensitivity when applied to small groups of patients over relatively short periods of time. MRI
surrogates are more sensitive to disease activity and current MRI measures such as number of
Gadolinium-enhancing and new T2 lesions are useful to monitor response to antinflammatory
agents in patients with relapsing-remitting MS. However, they are quite insensitive to changes
in patients with primary-progressive MS (PP-MS) where the underlying pathology is domi-
nated by diffuse brain GM and WM damage, and worsening of tissue damage within existing
lesions rather than by accumulation of new brain WM lesions[1].
While both brain and cerebellar cortex are major predilection sites for demyelination in
patients with primary and secondary progressive MS[2–8], the clinical impact of cerebellar vol-
ume over short-term disease progression in PP-MS has received less attention[9,10]. Due to its
multiple connections to the forebrain, the thalamus, and the spinal cord, the cerebellum is not
only affected by focal WM and GM lesions but also by the secondary degeneration of multiple
afferent and efferent connections to the supratentorial brain areas and to the spinal cord.
Hence, we hypothesize that cerebellar neurodegeneration might occur at a significant rate with
higher chances to impact the patients’ clinical outcome due to the cerebellar strategic position
in the motor, coordination and cognitive networks.
The aims of this study were: a) to measure global and cortical cerebellar volume changes in
PP-MS patients over one-year follow-up; b) to assess whether changes in cerebellar volume
correlated with short-term clinical progression and, c) to determine sample sizes required to
demonstrate reduction of cerebellar volume as an outcome measure in a placebo-controlled
trial for PP-MS.
Methods
Subjects
Twenty-six patients who met the modified McDonald diagnostic criteria[11] and presented a
primary-progressive (PP) course[12] were prospectively enrolled. Twenty sex- and age-
matched healthy subjects served as controls (CTRLs) (11F/9M; mean age, 51.1 years; range,
34–63 years) for the comparison of MRI metrics. Inclusion criteria for PP-MS patients were:
(i) age between 25–65 years; (ii) an Expanded Disability Status Scale (EDSS)[13] lower than 6.5
at screening visit; (iii) disease duration up to 15 years. The use of immuno-modulatory drugs
was allowed but, if treated, patients had to be on current treatment for at least one-year. At
screening visit, 12 patients were under immuno-modulatory treatment with either glatiramer
acetate, interferon β-1a or fingolimod. Exclusion criteria for all subjects were: (i)
Imaging outcome in multiple sclerosis
PLOS ONE | https://doi.org/10.1371/journal.pone.0176519 April 24, 2017 2 / 11
Competing interests: Dr. Matilde Inglese has
received research grants from NIH, NMSS,
Novartis Pharmaceuticals Corp., Teva
Neuroscience, Noto Foundation. Dr. Maria Petracca
has received a research fellowship from FISM. Dr
Enricomaria Mormina has nothing to disclose. Dr.
Anat Achiron has nothing to disclose. Dr Rebecca
Straus-Farber has nothing to disclose. Dr Shmuel
Miron has nothing to disclose. Dr. Michelle Fabian
has nothing to disclose. Dr. Stephen Krieger has
served as a consultant for Acorda Therapeutics,
Bayer, Biogen, EMD Serono, Genentech, Genzyme
Corporation, Novartis, and Teva Pharmaceutical
Industries. He has participated in Industry-
Sponsored Non-Promotional, Non-Marketing
Lectures for Genzyme Corporation, Genentech, and
Biogen Idec. Dr. Aaron Miller has served as a
consultant and/or participant in advisory board
meetings for Genzyme/sanofi-aventis, Biogen Idec,
Glaxo Smith Kline, EMD Serono (Merck Serono),
Novartis, ONO, Acorda, Nuron Biotech,Teva,
Questcor, and Accordant Health Services. He has
received research support from Acorda, Novartis,
Genentech, Genzyme/sanofi-aventis, Biogen Idec,
Roche, and Questcor. He has served as Editor of
Continuum, a continuing medical education
publication of the AAN and currently serves as
Editor of Continuum Audio. He is a member of the
editorial board of Multiple Sclerosis and Related
Disorders. He occasionally performs expert
reviews of medical records or serves as an expert
witness in medical malpractice cases. Dr. Fred
Lublin Sources of Funding for Research: Acorda
Therapeutics, Inc.; Biogen Idec; Novartis
Pharmaceuticals Corp; Teva Neuroscience, Inc.;
Genzyme; Sanofi; Celgene; NIH; NMSS; Consulting
Agreements/Advisory Boards/DSMB: Bayer
HealthCare Pharmaceuticals; Biogen Idec; EMD
Serono, Inc.; Novartis; Teva Neuroscience;
Actelion; Sanofi-Aventis; Acorda; Questcor; Roche,
Genentech; Celgene; Johnson & Johnson;
Revalesio; Coronado Bioscience, Genzyme,
MedImmune; Bristol-Myers Squibb, Xenoport,
Receptos; Forward Pharma; Co-Chief Editor:
Multiple Sclerosis and Related Diseases; Stock
Ownership: Cognition Pharmaceuticals, Inc. Dr.
Maria Pia Sormani received consulting fees from
Novartis, Biogen, TEVA, Merck Serono, Genzyme,
Roche, Geneuro, Vertex and research grant from
Merck Serono. This study was supported in part by
Novartis Pharmaceuticals (CFTY20DUSNC15T),
National Multiple Sclerosis Society (NMSS RG
5120A3/1), and the Noto Foundation to MI and by
a research fellowship from Fondazione Italiana
Sclerosi Multipla (2013/B/7) to MP. Novartis
Pharmaceuticals funding does not alter our

neuropsychiatric disorders other than MS, (ii) ophthalmological pathologies (i.e., diabetes
mellitus or glaucoma), (iii) history of alcohol or drug abuse, (iv) contra-indications to MRI.
Twenty-one patients with baseline and one-year clinical and MRI examination were included
in the analysis.
Clinical assessment
All subjects underwent clinical and MRI assessment on the same day. Clinical disability was
assessed with the EDSS, 25-foot walk and 9-hole-peg tests (25-FWT and 9-HPT) at baseline,
month six and month 12. To confirm sustained disability progression, patients were further
assessed during a clinical follow-up visit 12 months after study termination. Clinical worsening
was defined as EDSS score increase of one point if the baseline EDSS score was less than or
equal to five, or an increase of 0.5 if it was greater than five, or change of>20% for 25-FWT or
change of>20% for 9-HPT scores. Disability progression was defined as clinical worsening (i)
at month six compared with baseline, confirmed at month 12 or (ii) at clinical follow-up visit
12 months after study termination compared with month 12.
MRI acquisition and analysis
MRI was performed using a 3.0 T scanner (Philips Achieva, The Netherlands) with an 8-chan-
nel SENSE phased-array head coil (Philips Achieva, The Netherlands). The MRI protocol
included the following sequences: a) axial dual echo TSE sequence: TR = 2500 msec, TE1 = 10
msec, TE2 = 80 msec, FOV = 230x230 mm, matrix size = 512x512, 46 contiguous 3 mm-thick
slices; b) sagittal 3D T1-weighted turbo field echo sequence: TR = 7.5 msec, TE = 3.5 msec,
TI = 900 msec, flip angle = 8˚, voxel size = 1x1x1 mm, 172 contiguous slices; c) phase-sensitive
inversion recovery sequence (PSIR): TR/TE/TI = 4500/8/400 ms, 46 contiguous 3-mm-thick
slices with in-plane reconstructed resolution of 0.5x0.5 mm. The same protocol was used for
both baseline and follow-up, and patients were repositioned according to established guide-
lines[14].
Brain T2 and T1 lesion volumes (LV) were measured as previously described[15]. Cerebellar
GM and WM lesions were identified respectively on PSIR and dual echo/3D T1 scans by con-
sensus of two examiners (M.P., E.M). All the lesions involving the cortex (either purely intracor-
tical or extending in the WM) were pooled together in the analysis[6]. Cerebellar lesion loads
were measured following the same steps applied for whole brain LV quantification.
Normalized brain, GM and WM volumes (NBV, GMV and WMV) were measured on
T1-weighted-lesion-filled and non-uniformity corrected images using SIENAX[16] while cere-
bellar cortical and WM volumes (CCV and CWMV) were measured using Freesurfer (version
v5.3.0) longitudinal pipeline[17,18]. Volumes percentage change at follow up was computed,
as suggested in Freesurfer, according to the following formula: percentage change = rate of
change/volume at baseline, where rate of change = (volume at follow up–volume at baseline)/
(time2 –time1).
After Freesurfer analysis, all images were reviewed to maintain accuracy and consistency of
volume calculation. The volume-based stream outputs were reviewed and manually edited by
two experienced operators according to published guidelines[19,20]. Briefly, the optimal con-
trast between GM, WM and CSF was obtained by adjusting the contrast intensity window
before manual editing. The right and left cerebellar hemispheres were outlined separately.
Since it was difficult to distinguish deep cerebellar nuclei from the WM of cerebellar peduncles
due to a limited imaging contrast resolution, they were included in the WM segmentation.
Image resolution also limited the segmentation of WM peripheral lamellae from cerebellar
cortex, since both tissues were often included in the same voxel. When evaluating the postero-
Imaging outcome in multiple sclerosis
PLOS ONE | https://doi.org/10.1371/journal.pone.0176519 April 24, 2017 3 / 11
adherence to PLOS ONE policies on sharing data
and materials.
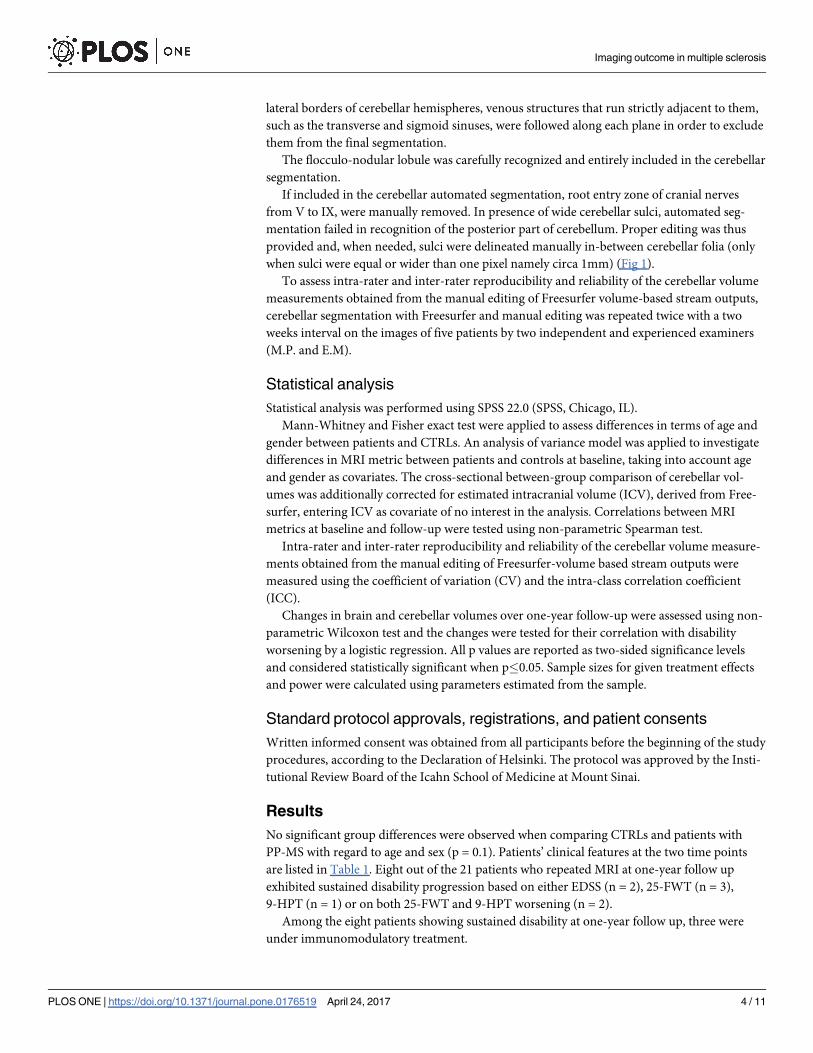
lateral borders of cerebellar hemispheres, venous structures that run strictly adjacent to them,
such as the transverse and sigmoid sinuses, were followed along each plane in order to exclude
them from the final segmentation.
The flocculo-nodular lobule was carefully recognized and entirely included in the cerebellar
segmentation.
If included in the cerebellar automated segmentation, root entry zone of cranial nerves
from V to IX, were manually removed. In presence of wide cerebellar sulci, automated seg-
mentation failed in recognition of the posterior part of cerebellum. Proper editing was thus
provided and, when needed, sulci were delineated manually in-between cerebellar folia (only
when sulci were equal or wider than one pixel namely circa 1mm) (Fig 1).
To assess intra-rater and inter-rater reproducibility and reliability of the cerebellar volume
measurements obtained from the manual editing of Freesurfer volume-based stream outputs,
cerebellar segmentation with Freesurfer and manual editing was repeated twice with a two
weeks interval on the images of five patients by two independent and experienced examiners
(M.P. and E.M).
Statistical analysis
Statistical analysis was performed using SPSS 22.0 (SPSS, Chicago, IL).
Mann-Whitney and Fisher exact test were applied to assess differences in terms of age and
gender between patients and CTRLs. An analysis of variance model was applied to investigate
differences in MRI metric between patients and controls at baseline, taking into account age
and gender as covariates. The cross-sectional between-group comparison of cerebellar vol-
umes was additionally corrected for estimated intracranial volume (ICV), derived from Free-
surfer, entering ICV as covariate of no interest in the analysis. Correlations between MRI
metrics at baseline and follow-up were tested using non-parametric Spearman test.
Intra-rater and inter-rater reproducibility and reliability of the cerebellar volume measure-
ments obtained from the manual editing of Freesurfer-volume based stream outputs were
measured using the coefficient of variation (CV) and the intra-class correlation coefficient
(ICC).
Changes in brain and cerebellar volumes over one-year follow-up were assessed using non-
parametric Wilcoxon test and the changes were tested for their correlation with disability
worsening by a logistic regression. All p values are reported as two-sided significance levels
and considered statistically significant when p�0.05. Sample sizes for given treatment effects
and power were calculated using parameters estimated from the sample.
Standard protocol approvals, registrations, and patient consents
Written informed consent was obtained from all participants before the beginning of the study
procedures, according to the Declaration of Helsinki. The protocol was approved by the Insti-
tutional Review Board of the Icahn School of Medicine at Mount Sinai.
Results
No significant group differences were observed when comparing CTRLs and patients with
PP-MS with regard to age and sex (p = 0.1). Patients’ clinical features at the two time points
are listed in Table 1. Eight out of the 21 patients who repeated MRI at one-year follow up
exhibited sustained disability progression based on either EDSS (n = 2), 25-FWT (n = 3),
9-HPT (n = 1) or on both 25-FWT and 9-HPT worsening (n = 2).
Among the eight patients showing sustained disability at one-year follow up, three were
under immunomodulatory treatment.
Imaging outcome in multiple sclerosis
PLOS ONE | https://doi.org/10.1371/journal.pone.0176519 April 24, 2017 4 / 11

Fig 1. Manual editing of Freesurfer automated segmentation. A-B. Axial T1 of the cerebellum with original
(A) and manual edited (B) output volumes of Freesurfer segmentation overlayed. Red arrows show several
cerebellar folia not recognized by the automated segmentation. C-D. Axial T1 of the cerebellum with original
(C) and manual edited (D) output volumes of Freesurfer segmentation overlayed. Red arrows show several
cerebellar folia not recognized by the automated segmentation of Freesurfer. Ellipses show how flocculo-
nodular lobule of the cerebellum is not entirely recognized by the automated segmentation. White arrows
show some manually segmented sulci. E-F. Axial T1 of the cerebellum without (E) and with (F) the original
output volume of Freesurfer segmentation overlayed. Ellipses show how transverse sinus is misrecognized as
a part of the cerebellum. Proper manual editing was provided to avoid this issue. G-H. Axial T1 of the
cerebellum without (G) and with (H) the original output volume of Freesurfer segmentation overlayed. Red
arrows show how VII and VIII cranial nerves are misrecognized as a part of the cerebellum. Proper manual
editing was provided to avoid this issue.
https://doi.org/10.1371/journal.pone.0176519.g001
Imaging outcome in multiple sclerosis
PLOS ONE | https://doi.org/10.1371/journal.pone.0176519 April 24, 2017 5 / 11

MRI measures at baseline and 1-year FU
Compared to CTRLs, NBV, GMV, WMV volumes were lower in PP-MS patients (respectively
1376.88± 69.30 vs 1434.06±53.67 mL, p<0.05; 728.99±43.86 vs 757.31±38.95 mL, p<0.01;
647.88±45.16 vs 676.75±37.02 mL, p>0.05). Likewise, cerebellar volume and CCV were signif-
icantly lower (respectively 114.42±12.52 vs 121.93±15.23 and 86.90±8.88 vs 92.77±11.72 mL,
p<0.05) while CWMV did not differ between the two groups (27.52±5.26 vs 29.16±4.32 mL,
p>0.05). Over one-year, a significant difference was detected in terms of cerebellar T2LV (0.11
±0.20 vs 0.13±0.26 mL, p<0.01) and cerebellar T1LV (0.09±0.19 vs 0.11±0.21 mL, p<0.05) but
not in terms of PSIR LV (0.06 ± 0.10 vs 0.07 ± 0.10 mL, p = 0.20). Additional patients’ MRI
measures at baseline and one-year follow-up are summarized in Table 2.
The intra-rater CV and ICC for cerebellar volume were 7.78%, 0.95 with an inter-rater ICC
of 0.91 (p<0.001).
At follow-up, cerebellar volume was significantly correlated with cerebellar T2LV (r -0.43,
p = 0.05), T1LV (r-0.51, p<0.05) but not with PSIR LV (r -0.34, p = 0.13). CCV showed signifi-
cant correlations with the change of cerebellar T2LV (r -0.53, p<0.01) and T1LV (r -0.50,
p<0.05) but not with cerebellar PSIR LV (r -0.17, p = 0.48). CWMV was correlated to cerebel-
lar T2LV (r -0.44, p<0.05), T1LV (r -0.56, p<0.01), and PSIR LV (r -0.48, p<0.05). In addi-
tion, cerebellar volume was correlated with brain WMV (r 0.56, p<0.01), but not with NBV,
GMV (p>0.1). CWMV was correlated with brain WMV (r 0.58, p<0.01), but not with NBV
or GMV (p = 0.1) and CCV did not show any significant correlations with brain volumes
(p>0.13 for all).
Table 1. Clinical characteristics of PP-MS patients at baseline and follow-up.
Baseline (21) 1-year FU (21)
EDSS median (range) 4.0 (1.5–6.0) 4.0 (2.0–6.0)
EDSS cerebellar subsystem median (range) 1.0 (0.0–3.0) 2.0 (0.0–3.0)
9-HPT dominant hand, seconds 30.8±12.2 33.4±17.9
9-HPT non-dominant hand, seconds 34.7±17.3 35.9±26.7
25-FWT, seconds 7.0±2.1 7.0±2.2
Abbreviations: EDSS = Expanded Disability Status Scale; 9-HPT = 9-Hole Peg Test;
25-FWT = 25-FootWalkingTest. Unless specified, all values are expressed as mean ± SD.
https://doi.org/10.1371/journal.pone.0176519.t001
Table 2. Baseline and one-year follow-up MRI findings.
Baseline 1-year FU % change P values*
NBV, mL 1376.88±69.30 1372.06±65.21 -0.17±1.60 0.217
NGMV, mL 728.99±43.86 727.44±42.36 -0.07±2.17 0.274
NWMV, mL 647.88±45.16 644.61±42.76 -0.26±1.86 0.274
T2LV, mL 6.00±7.94 6.67±8.61 9.50±25.44 0.056
T1LV, mL 3.33±5.24 4.03±6.48 35.23±82.53 0.002
CL volume, mL 0.50±0.47 0.48±0.48 0.54±22.19 0.936
Cerebellar volume, mL 114.42± 12.52 111.84±12.03 -1.90±1.11 0.0001
CCV, mL 86.90±8.88 85.13±8.27 -1.68±1.41 0.0001
CWMV, mL 27.52±5.26 26.70±5.15 -2.52±1.95 0.0001
Abbreviations: NBV = normalized brain volume; NGMV = normalized gray matter volume; NWMV = normalized white matter volume; CL = cortical lesion;
LV = lesion volume; CCV = cerebellar cortex volume; CWMV = cerebellar white matter volume. All values are expressed as mean ± SD.
*Wilcoxon signed rank test.
https://doi.org/10.1371/journal.pone.0176519.t002
Imaging outcome in multiple sclerosis
PLOS ONE | https://doi.org/10.1371/journal.pone.0176519 April 24, 2017 6 / 11

Relationship between one-year changes in MRI metrics and clinical
outcome
Over one-year, significant changes were detected in brain T1LV (p<0.01), cerebellar T2LV
(p<0.01) and cerebellar T1LV (p<0.05), cerebellar volume, CCV and CWMV (p<0.001)
(Table 2). However, only global cerebellar volume and CCV percentage change were signifi-
cantly reduced in clinically progressed patients when compared to not-progressed patients
(p<0.01; respectively AUC of 0.91 and 0.96) (Fig 2).
Sample size estimates for cerebellar volumes for clinical trials
Based on the percentage change in cerebellar volume and CCV at one-year follow up we calcu-
lated preliminary estimates of sample sizes for clinical trials. The numbers of patients required
to detect a 30% effect are 81 per group for cerebellar volume and 162 per group for CCV,
assuming 90% power and type 1 error alpha = 0.05 with equal numbers of patients per group.
Validation PP-MS cohort
We tested the reproducibility of decrease of cerebellar volume in an independent cohort of 20
PP-MS patients from the Sheba Medical Center who presented with clinical characteristics
similar to those of our group of PP-MS patients (Table 3). All patients underwent MRI scan
and clinical evaluation with the assessment of the EDSS score at baseline and at 1-year follow-
Fig 2. Cerebellar volume and cerebellar cortex volume percentage change for progressed and not-
progressed patients. Box plots displaying the 25% to 75% values (boxes) ± 95% values (whiskers), median
values (horizontal lines within boxes) of cerebellar volume and cerebellar cortex volume percentage change
for progressed (hatched box) and not-progressed (empty box) patients.
https://doi.org/10.1371/journal.pone.0176519.g002
Imaging outcome in multiple sclerosis
PLOS ONE | https://doi.org/10.1371/journal.pone.0176519 April 24, 2017 7 / 11

up. MRI was performed on a 3.0 T scanner (Signa HDxt-General Electric Milwaukee, WI,
USA) with an 8-channel head coil (Signa HDxt- General Electric Milwaukee, WI, USA)]
according to the following protocol: a) sagittal 3D T1-weighted fast spoiled gradient echo
(FSPGR) sequence: TR = 6.5 msec, TE = 2.1 msec, TI = 450 msec, flip angle = 20˚, voxel
size = 1x1x1 mm, 255 contiguous slices; b) axial FSE sequence: TR = 4400 msec, TE = 101 msec,
FoV = 230x230 mm, matrix size = 256x256, 56 contiguous 2.6 mm-thick slices. At baseline, the
cerebellar volume was 133.29±14.05 mL, the CWMV was 31.26±4.28 mL and the CCV was
102.04±12.30. At 1-year follow-up the cerebellar volumes were respectively 131.70±14.58 mL,
31.15±4.17 mL and 100.54±12.59 mL. Over one-year, a significant difference was detected in
terms of cerebellar volume (p = 0.009), CCV (p = 0.002), but not CWMV (p = 0.852).
The finding of significant changes in cerebellar volume at one-year follow-up in this valida-
tion cohort strengthens the reliability of our results. The changes in cerebellar volume were
consistent in terms of directionality and magnitude of absolute and percentage change (explo-
ration cohort: cerebellar volume -1.90±1.11%, cerebellar CCV -1.68±1.41%; validation cohort:
cerebellar volume -1.47±2.30%, CCV -1.56±2.23%). Although in the validation cohort pro-
gressed patients showed higher volumetric percentage change than non-progressed patients
for both cerebellar volume (respectively -2.92±3.66% and -1.09±1.85%) and cerebellar CCV
(respectively 2.96±3.97% and -1.21±1.69%), considering that only three out of 20 PP-MS
patients in the validation cohort exhibited sustained disability progression at one-year follow-
up, we did not have the power to replicate the association between changes in cerebellar vol-
ume and changes in clinical measures observed in the exploration cohort.
Discussion
The main findings of our study are the presence of a significant decrease of total and cortical
cerebellar volumes over one-year follow-up in patients with PP-MS and the association
between the decrease of cerebellar volume and the worsening of clinical measures.
Neuropathological examination of post-mortem brain tissue has revealed that cerebellum is
a major predilection site of demyelination in MS, especially in patients with PP-MS and
SP-MS[2].
The importance of cerebellar involvement and its contribution to disease-related impairment
in MS, especially in progressive forms of the disease has been confirmed by several cross-sec-
tional MRI studies that have demonstrated a significant reduction in cerebellar volume in MS
patients when compared with healthy controls[21–23] and a marked reduction in CCV in
SP-MS compared with benign MS and CIS[4,24,25].
Despite its relevance, the dynamic of cerebellar volumes over time remains elusive. This is
due to the peculiar anatomy of the cerebellum where the tightly folded cortex and its poor
demarcation from the white matter challenges the segmentation techniques. However, these
challenges have been partly overcome by the better spatial resolution due to the advent of high
field MRI, improved gradients, coils, and MRI sequences as well as advancements in data post-
Table 3. Demographics and clinical characteristics of patients and controls.
Exploration cohort Validation cohort Controls
Age, (range) 50.8±10.98 (32–65) 50.9±11.3 (25–68) 51.1±9.8 (34–63)
Gender 9M/12F 9M/11F 9M/11F
Disease duration, 9.1±4.9 11.1±7.4 -
EDSS, median (range) 4.0 (1.5–6.0) 4.0 (1.5–6.5) -
Abbreviations: M = male; F = female; EDSS = Expanded Disability Status Scale. All values are expressed as mean ± SD, unless otherwise specified.
https://doi.org/10.1371/journal.pone.0176519.t003
Imaging outcome in multiple sclerosis
PLOS ONE | https://doi.org/10.1371/journal.pone.0176519 April 24, 2017 8 / 11

processing techniques[26,27]. In our study, we adopted the last released version of the Freesur-
fer longitudinal pipeline, choosing to apply a widely used brain structure segmentation
method. Freesurfer out-streams were visually checked and manually edited by two experienced
operators after several hours of training. First, we selected a brief set of guidelines based on the
ones provided by de Macedo Rodrigues et al. and Bogovic et al.[19,20] for the manual segmen-
tation of the cerebellum. Then we identified two experienced operators who underwent train-
ing of the Freesurfer out-streams manual editing based on the selected guidelines. Finally, we
established the intra- and inter-rater reproducibility of the manual editing of the Freesurfer
volume-based out-streams. Although we are aware that a correct segmentation of the thin cer-
ebellar gyri and sulci is very difficult and that partial volume voxels may limit the detection of
subtle changes in the folia structure, we believe that our results are promising because we
found significant changes not only of the CCV but also of the entire cerebellar volume and
because we were able to validate our findings relative to the cerebellar changes over time in an
independent group of PP-MS patients with similar clinical characteristics. Unfortunately, the
small number of patients (n = 3) showing clinical progression in this group, precluded us from
testing the association between the decrease of cerebellar volume and the worsening of clinical
measures in the validation cohort; however, the higher cerebellar volume loss in the three clini-
cally progressed patients compared to the ones who did not progress is in line with our results
in the exploration cohort.
Although almost all PP-MS patients presented some degree of cerebellar involvement at
baseline, only five of them experienced a clinical worsening of cerebellar function at follow-up
as reflected by the EDSS cerebellar functional system score. In addition, the majority of
patients presented focal lesions in cerebellar white matter and/or gray matter. We did find sta-
tistically significant associations between cerebellar volumes and local lesion volumes suggest-
ing that the progressive cerebellar atrophy is related to the degeneration of afferent, efferent
and association fibers transected in local lesions. Additionally, the association between cerebel-
lar volumes and brain white matter volume suggests that cerebellar atrophy may also result
from the degeneration of regions that are remote but connected to the cerebellum through
multiple afferent and efferent tracts. This is in line with the findings of a previous study in
PP-MS patients showing that reduced fiber coherence, measured by means of DTI tractogra-
phy, affects the main cerebellar connections (i.e. middle and superior cerebellar peduncles),
which mediate important brain functions such as upper limb motor dexterity and speed of
walking[22]. Hence, due to the strategic position of the cerebellum in the motor, coordination
and cognitive networks, the association that we identified between cerebellar atrophy and sus-
tained disability worsening may be explained not only by the local focal and diffuse WM and
GM injury but also by the damage to the multiple connections to the forebrain, the thalamus,
and the spinal cord[28–30].
In summary, our results suggest a role for both cerebellar cortex and whole cerebellar vol-
ume as a potential short-term imaging measure to monitor treatment effect in clinical trials.
Hence, if confirmed in a larger sample of patients, measures of cerebellar volume could pro-
vide a short-term outcome for screening experimental treatments in clinical trials of PP-MS
with relatively small sample sizes and serve as a potential phase II MRI marker for progressive
MS clinical trials.
Acknowledgments
The authors thank Drs. C. Riley, J. Howard and A. Katz, for patients’ referral; Dr. C. Saiote for
technical support; Colleen Farrell for help with patients’ scheduling and assistance.
Imaging outcome in multiple sclerosis
PLOS ONE | https://doi.org/10.1371/journal.pone.0176519 April 24, 2017 9 / 11

Author Contributions
Conceptualization: MI MPS FL.
Data curation: MI MP EM AA RS SM MF SK AM FL MPS.
Formal analysis: MPS.
Funding acquisition: MI.
Investigation: MI MP EM AA RS SM MF SK AM FL MPS.
Methodology: MI MPS.
Project administration: MI.
Resources: MI.
Supervision: MI.
Validation: MI MPS.
Visualization: MI MP EM.
Writing – original draft: MI MP MPS.
Writing – review & editing: MI MP EM AA RS SM MF SK AM FL MPS.
References1. Ontaneda D, Fox RJ, Chataway J. Clinical trials in progressive multiple sclerosis: Lessons learned and
future perspectives. Lancet Neurol. Elsevier Ltd; 2015; 14: 208–223. https://doi.org/10.1016/S1474-
4422(14)70264-9 PMID: 25772899
2. Kutzelnigg A, Faber-Rod JC, Bauer J, Lucchinetti CF, Sorensen PS, Laursen H, et al. Widespread
demyelination in the cerebellar cortex in multiple sclerosis. Brain Pathol. 2007; 17: 38–44. https://doi.
org/10.1111/j.1750-3639.2006.00041.x PMID: 17493036
3. Gilmore CP, Donaldson I, Bo L, Owens T, Lowe J, Evangelou N. Regional variations in the extent and
pattern of grey matter demyelination in multiple sclerosis: a comparison between the cerebral cortex,
cerebellar cortex, deep grey matter nuclei and the spinal cord. J Neurol Neurosurg Psychiatry. 2009;
80: 182–187. https://doi.org/10.1136/jnnp.2008.148767 PMID: 18829630
4. Calabrese M, Mattisi I, Rinaldi F, Favaretto A, Atzori M, Bernardi V, et al. Magnetic resonance evidence
of cerebellar cortical pathology in multiple sclerosis. J Neurol Neurosurg Psychiatry. 2010; 81: 401–404.
https://doi.org/10.1136/jnnp.2009.177733 PMID: 19965849
5. Redondo J, Kemp K, Hares K, Rice C, Scolding N, Wilkins A. Purkinje Cell Pathology and Loss in Multi-
ple Sclerosis Cerebellum. Brain Pathol. 2015; 25: 692–700. https://doi.org/10.1111/bpa.12230 PMID:
25411024
6. Favaretto A, Lazzarotto A, Poggiali D, Rolma G, Causin F, Rinaldi F, et al. MRI-detectable cortical
lesions in the cerebellum and their clinical relevance in multiple sclerosis. Mult Scler J. 2016; 1–8.
7. Ceccarelli A, Rocca MA, Valsasina P, Rodegher M, Pagani E, Falini A, et al. A multiparametric evalua-
tion of regional brain damage in patients with primary progressive multiple sclerosis. Hum Brain Mapp.
2009; 30: 3009–3019. https://doi.org/10.1002/hbm.20725 PMID: 19172642
8. Mainero C, Louapre C, Govindarajan ST, Gianni C, Scott Nielsen A, Cohen-Adad J, et al. A gradient in
cortical pathology in multiple sclerosis by in vivo quantitative 7 T imaging. Brain. 2015; 138: 932–945.
https://doi.org/10.1093/brain/awv011 PMID: 25681411
9. Eshaghi A, Bodini B, Ridgway GR, Garcıa-Lorenzo D, Tozer DJ, Sahraian MA, et al. Temporal and spa-
tial evolution of grey matter atrophy in primary progressive multiple sclerosis. Neuroimage. Elsevier
Inc.; 2014; 86: 257–264. https://doi.org/10.1016/j.neuroimage.2013.09.059 PMID: 24099844
10. Sepulcre J, Sastre-Garriga J, Cercignani M, Ingle GT, Miller DH, Thompson AJ. Regional gray matter
atrophy in early primary progressive multiple sclerosis: a voxel-based morphometry study. Arch Neurol.
2006; 63: 1175–1180. https://doi.org/10.1001/archneur.63.8.1175 PMID: 16908748
Imaging outcome in multiple sclerosis
PLOS ONE | https://doi.org/10.1371/journal.pone.0176519 April 24, 2017 10 / 11

11. Polman CH, Reingold SC, Banwell B, Clanet M, Cohen J a, Filippi M, et al. Diagnostic criteria for multi-
ple sclerosis: 2010 revisions to the McDonald criteria. Ann Neurol. 2011; 69: 292–302. https://doi.org/
10.1002/ana.22366 PMID: 21387374
12. Lublin FD, Reingold SC. Defining the clinical course of multiple sclerosis: Results of an international sur-
vey. Neurology. 1996; 46: 907–911. PMID: 8780061
13. Kurtzke JF. Rating neurologic impairment in multiple sclerosis: an expanded disability status scale
(EDSS). Neurology. 1983; 33: 1444–1452. PMID: 6685237
14. Miller DH, Barkhof F, Berry I, Kappos L, Scotti G, Thompson AJ. Magnetic resonance imaging in moni-
toring the treatment of multiple sclerosis: Concerted Action Guidelines. J Neurol Neurosurg Psychiatry.
1991; 54: 683–688. PMID: 1940938
15. Ghassemi R, Narayanan S, Banwell B, Sled JG, Shroff M, Arnold DL. Quantitative Determination of
Regional Lesion Volume and Distribution in Children and Adults with Relapsing-Remitting Multiple Scle-
rosis. PLoS One. 2014; 9: e85741. https://doi.org/10.1371/journal.pone.0085741 PMID: 24586244
16. Smith SM, Zhang Y, Jenkinson M, Chen J, Matthews PM, Federico A, et al. Accurate, robust, and auto-
mated longitudinal and cross-sectional brain change analysis. Neuroimage. 2002; 17: 479–489. PMID:
12482100
17. Fischl B, Dale AM. Measuring the thickness of the human cerebral cortex from magnetic resonance
images. Proc Natl Acad Sci. 2000; 97: 11050–11055. https://doi.org/10.1073/pnas.200033797 PMID:
10984517
18. Reuter M, Schmansky NJ, Rosas HD, Fischl B. Within-subject template estimation for unbiased longitu-
dinal image analysis. Neuroimage. Elsevier Inc.; 2012; 61: 1402–1418. https://doi.org/10.1016/j.
neuroimage.2012.02.084 PMID: 22430496
19. de Macedo Rodrigues K, Ben-Avi E, Sliva DD, Choe M-S, Drottar M, Wang R, et al. A FreeSurfer-com-
pliant consistent manual segmentation of infant brains spanning the 0–2 year age range. Front Hum
Neurosci. 2015; 9: 1–12.
20. Bogovic JA, Jedynak B, Rigg R, Du A, Landman BA, Prince JL, et al. Approaching expert results using
a hierarchical cerebellum parcellation protocol for multiple inexpert human raters. Neuroimage. Elsevier
Inc.; 2013; 64: 616–629. https://doi.org/10.1016/j.neuroimage.2012.08.075 PMID: 22975160
21. Anderson VM, Fisniku LK, Altmann DR, Thompson a J, Miller DH. MRI measures show significant cere-
bellar gray matter volume loss in multiple sclerosis and are associated with cerebellar dysfunction. Mult
Scler. 2009; 15: 811–817. https://doi.org/10.1177/1352458508101934 PMID: 19465449
22. Anderson VM, Wheeler-Kingshott CA, Abdel-Aziz K, Miller DH, Toosy A, Thompson AJ, et al. A compre-
hensive assessment of cerebellar damage in multiple sclerosis using diffusion tractography and volumetric
analysis. Mult Scler. 2011; 17: 1079–1087. https://doi.org/10.1177/1352458511403528 PMID: 21511688
23. Ramasamy DP, Benedict RHB, Cox JL, Fritz D, Abdelrahman N, Hussein S, et al. Extent of cerebellum,
subcortical and cortical atrophy in patients with MS. A case-control study. J Neurol Sci. Elsevier B.V.;
2009; 282: 47–54. https://doi.org/10.1016/j.jns.2008.12.034 PMID: 19201003
24. Calabrese M, Reynolds R, Magliozzi R, Castellaro M, Morra A, Scalfari A, et al. Regional distribution
and evolution of gray matter damage in different populations of multiple sclerosis patients. PLoS One.
2015; 10: 1–12.
25. Mesaros S, Rovaris M, Pagani E, Pulizzi A, Caputo D, Ghezzi A, et al. A magnetic resonance imaging
voxel-based morphometry study of regional gray matter atrophy in patients with benign multiple sclero-
sis. Arch Neurol. 2008; 65: 1223–1230. https://doi.org/10.1001/archneur.65.9.1223 PMID: 18779427
26. Weier K, Fonov V, Lavoie K, Doyon J, Collins DL. Rapid automatic segmentation of the human cerebel-
lum and its lobules (RASCAL)-Implementation and application of the patch-based label-fusion technique
with a template library to segment the human cerebellum. Hum Brain Mapp. 2014; 5039: 5026–5039.
27. Park MTM, Pipitone J, Baer LH, Winterburn JL, Shah Y, Chavez S, et al. Derivation of high-resolution
MRI atlases of the human cerebellum at 3T and segmentation using multiple automatically generated
templates. Neuroimage. 2014; 95: 217–231. https://doi.org/10.1016/j.neuroimage.2014.03.037 PMID:
24657354
28. Choi SR, Howell OW, Carassiti D, Magliozzi R, Gveric D, Muraro P, et al. Meningeal inflammation plays
a role in the pathology of primary progressive multiple sclerosis. Brain. 2012; 135: 2925–37 https://doi.
org/10.1093/brain/aws189 PMID: 22907116
29. Howell OW, Schulz-Trieglaff EK, Carassiti D, Gentleman SM, Nicholas R, Roncaroli F, et al. Extensive
grey matter pathology in the cerebellum in multiple sclerosis is linked to inflammation in the subarach-
noid space. Neuropathol Appl Neurobiol. 2015; 41: 798–813. https://doi.org/10.1111/nan.12199 PMID:
25421634
30. Weier K, Penner IK, Magon S, Amann M, Naegelin Y, Andelova M, et al. Cerebellar abnormalities con-
tribute to disability including cognitive impairment in multiple sclerosis. PLoS One. 2014; 9.
Imaging outcome in multiple sclerosis
PLOS ONE | https://doi.org/10.1371/journal.pone.0176519 April 24, 2017 11 / 11