Embed Size (px)
Citation preview
UNITED STATES SECURITIES AND EXCHANGE COMMISSION
WASHINGTON, DC 20549
FORM 6-K
REPORT OF FOREIGN PRIVATE ISSUER PURSUANT TO RULE 13a-16 OR 15d-16 OF THE
SECURITIES EXCHANGE ACT OF 1934 For the month of September 2017 Commission File Number 0-30862
CERAGON NETWORKS LTD. (Translation of registrant’s name into English)
24 Raoul Wallenberg Street, Tel Aviv 69719, Israel
(Address of principal executive offices) Indicate by check mark whether the registrant files or will file annual reports under cover of Form 20-F or Form 40-F.
Form 20-F ☒ Form 40-F ☐ Indicate by check mark if the registrant is submitting the Form 6-K in paper as permitted by Regulation S-T Rule 101(b)(1): ☐ Indicate by check mark if the registrant is submitting the Form 6-K in paper as permitted by Regulation S-T Rule 101(b)(7): ☐
EXPLANANTORY NOTE Ceragon Networks Ltd. (the “Registrant”) is furnishing on this Form 6-K its unaudited interim consolidated financial statements for the six months ended June 30, 2017, and the related Operating and Financial Review and Prospects for such period. The Registrant is also furnishing the consent of its independent registered accounting firm to the incorporation by reference into Registrant’s Registration Statement on Form F-3 (No. 333-217194) of its opinion on the Registrant’s consolidated financial statements included in Registrant’s Annual Report on Form 20-F for the year ended December 31, 2016. Exhibits
This Report on Form 6-K and the exhibits hereto are hereby incorporated by reference into the Registrant’s Registration Statement on Form F-3 (No. 333-217194), as amended and
supplemented from time to time.
Exhibit Number Description 5.1 Consent of Independent Registered Public Accounting Firm. 99.1 Unaudited financial statements of Ceragon Networks, Ltd. for the six months ended June 30, 2017. 99.2 Operating and Financial Review and Prospects for the six months ended June 30, 2017. 101 Interactive Data File relating to the materials in this report on Form 6-K is formatted in Extensible Business Reporting Language (XBRL).

SIGNATURES
Pursuant to the requirements of the Securities Exchange Act of 1934, the registrant has duly caused this report to be signed on its behalf by the undersigned, thereunto duly
authorized.
CERAGON NETWORKS LTD. (Registrant)
Date: September 29, 2017 By: /s/ Doron Arazi
Name: Doron Arazi Title: Chief Financial Officer

Exhibit 5.1
CONSENT OF INDEPENDENT REGISTERED PUBLIC ACCOUNTING FIRM We consent to the reference to our firm under the caption “Experts” in the Registration Statement (Form F-3, No. 333-217194) and related Prospectus of Ceragon Networks Ltd. and to the incorporation by reference therein of our report dated April 7, 2017, with respect to the consolidated financial statements of Ceragon Networks Ltd. and the effectiveness of internal control over financial reporting of Ceragon Networks Ltd. included in its Annual Report (Form 20-F) for the year ended December 31, 2016, filed with the Securities and Exchange Commission.
Tel-Aviv Kost Forer Gabbay & Kasierer September 29, 2017 A Member of Ernst & Young Global

Exhibit 99.1
CERAGON NETWORKS LTD. AND SUBSIDIARIES
CONDENSED INTERIM CONSOLIDATED FINANCIAL STATEMENTS
AS OF JUNE 30, 2017
IN U.S. DOLLARS
UNAUDITED
INDEX
Page Condensed Consolidated Balance Sheets 2 - 3 Condensed Consolidated Statements of Operations 4 Condensed Consolidated Statements of Comprehensive Income 5 Condensed Consolidated Statements of Changes in Shareholders' Equity 6 Condensed Consolidated Statements of Cash Flows 7 Notes to Condensed Consolidated Financial Statements 8 - 17
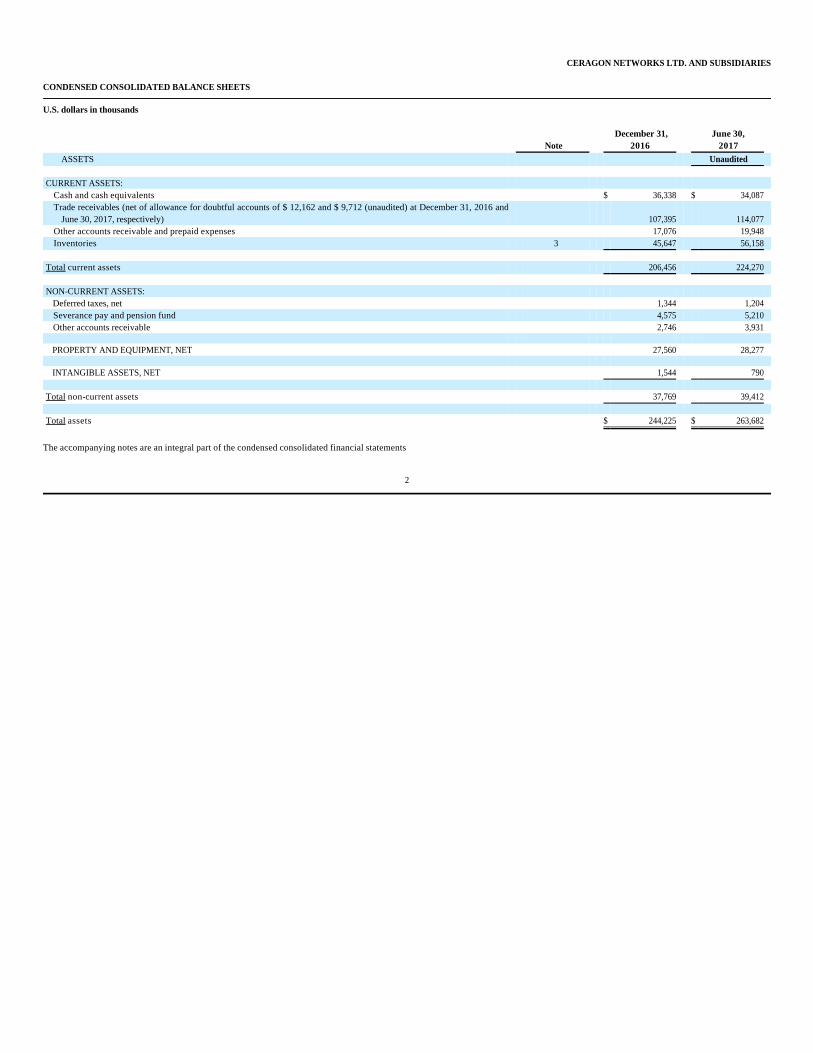
CERAGON NETWORKS LTD. AND SUBSIDIARIES
CONDENSED CONSOLIDATED BALANCE SHEETS
U.S. dollars in thousands
The accompanying notes are an integral part of the condensed consolidated financial statements
2
Note December 31,
2016 June 30,
2017 ASSETS Unaudited
CURRENT ASSETS:
Cash and cash equivalents $ 36,338 $ 34,087 Trade receivables (net of allowance for doubtful accounts of $ 12,162 and $ 9,712 (unaudited) at December 31, 2016 and
June 30, 2017, respectively) 107,395 114,077 Other accounts receivable and prepaid expenses 17,076 19,948 Inventories 3 45,647 56,158
Total current assets 206,456 224,270
NON-CURRENT ASSETS: Deferred taxes, net 1,344 1,204 Severance pay and pension fund 4,575 5,210 Other accounts receivable 2,746 3,931
PROPERTY AND EQUIPMENT, NET 27,560 28,277
INTANGIBLE ASSETS, NET 1,544 790
Total non-current assets 37,769 39,412
Total assets $ 244,225 $ 263,682
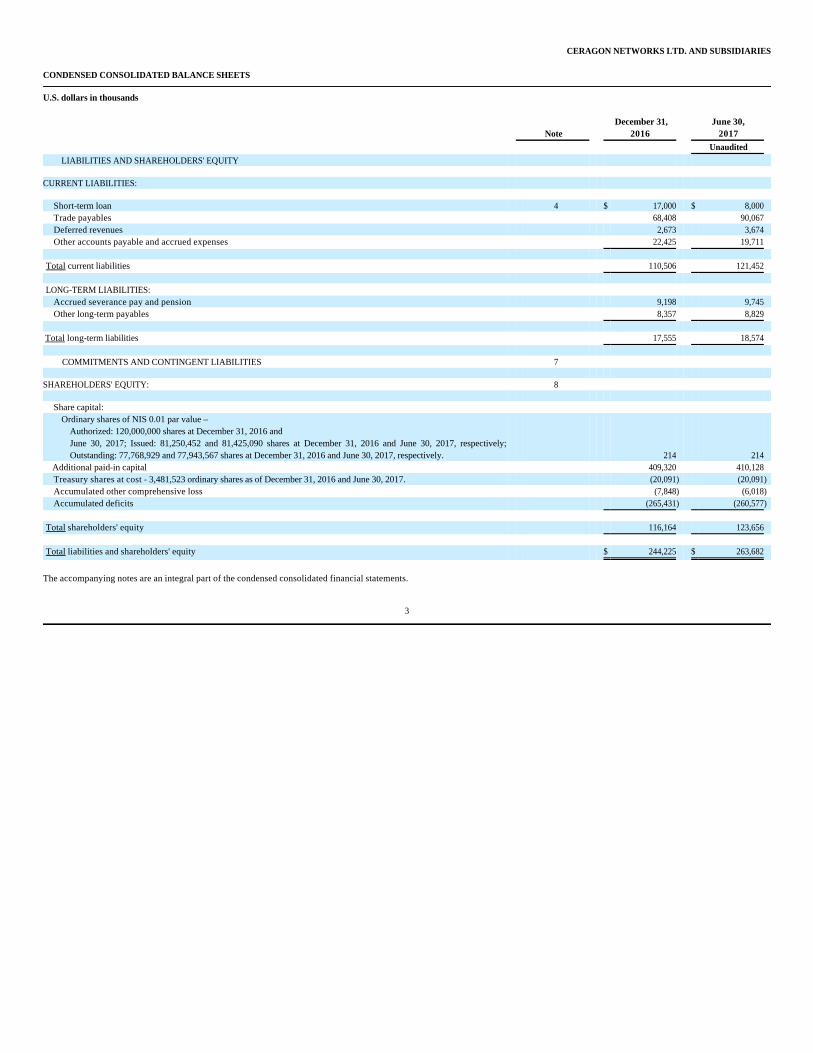
CERAGON NETWORKS LTD. AND SUBSIDIARIES
CONDENSED CONSOLIDATED BALANCE SHEETS
U.S. dollars in thousands
The accompanying notes are an integral part of the condensed consolidated financial statements.
3
Note December 31,
2016 June 30,
2017
Unaudited LIABILITIES AND SHAREHOLDERS' EQUITY
CURRENT LIABILITIES:
Short-term loan 4 $ 17,000 $ 8,000 Trade payables 68,408 90,067 Deferred revenues 2,673 3,674 Other accounts payable and accrued expenses 22,425 19,711
Total current liabilities 110,506 121,452
LONG-TERM LIABILITIES:
Accrued severance pay and pension 9,198 9,745 Other long-term payables 8,357 8,829
Total long-term liabilities 17,555 18,574
COMMITMENTS AND CONTINGENT LIABILITIES 7 SHAREHOLDERS' EQUITY: 8
Share capital: Ordinary shares of NIS 0.01 par value –
Authorized: 120,000,000 shares at December 31, 2016 and June 30, 2017; Issued: 81,250,452 and 81,425,090 shares at December 31, 2016 and June 30, 2017, respectively; Outstanding: 77,768,929 and 77,943,567 shares at December 31, 2016 and June 30, 2017, respectively. 214 214
Additional paid-in capital 409,320 410,128 Treasury shares at cost - 3,481,523 ordinary shares as of December 31, 2016 and June 30, 2017. (20,091) (20,091) Accumulated other comprehensive loss (7,848) (6,018) Accumulated deficits (265,431) (260,577)
Total shareholders' equity 116,164 123,656
Total liabilities and shareholders' equity $ 244,225 $ 263,682

CERAGON NETWORKS LTD. AND SUBSIDIARIES
CONDENSED CONSOLIDATED STATEMENTS OF OPERATIONS
U.S. dollars in thousands (except per share data)
4
Six months ended
June 30,
2016 2017
Unaudited Revenues $ 129,844 $ 169,355 Cost of revenues 84,263 117,848 Gross profit 45,581 51,507 Operating expenses: Research and development 10,638 12,235 Selling and marketing 19,573 19,776 General and administrative 10,110 9,570 Total operating expenses 40,321 41,581 Operating income 5,260 9,926 Financial expenses, net 3,290 3,079 Income before taxes 1,970 6,847 Taxes on income 2,357 1,993 Net income (loss) $ (387) $ 4,854
Basic net income (loss) per share $ (0.00) $ 0.06
Diluted net income (loss) per share $ (0.00) $ 0.06
Weighted average number of shares used in computing basic net income (loss) per share 77,664,815 77,845,690
Weighted average number of shares used in computing diluted net income (loss) per share 77,664,815 80,359,375
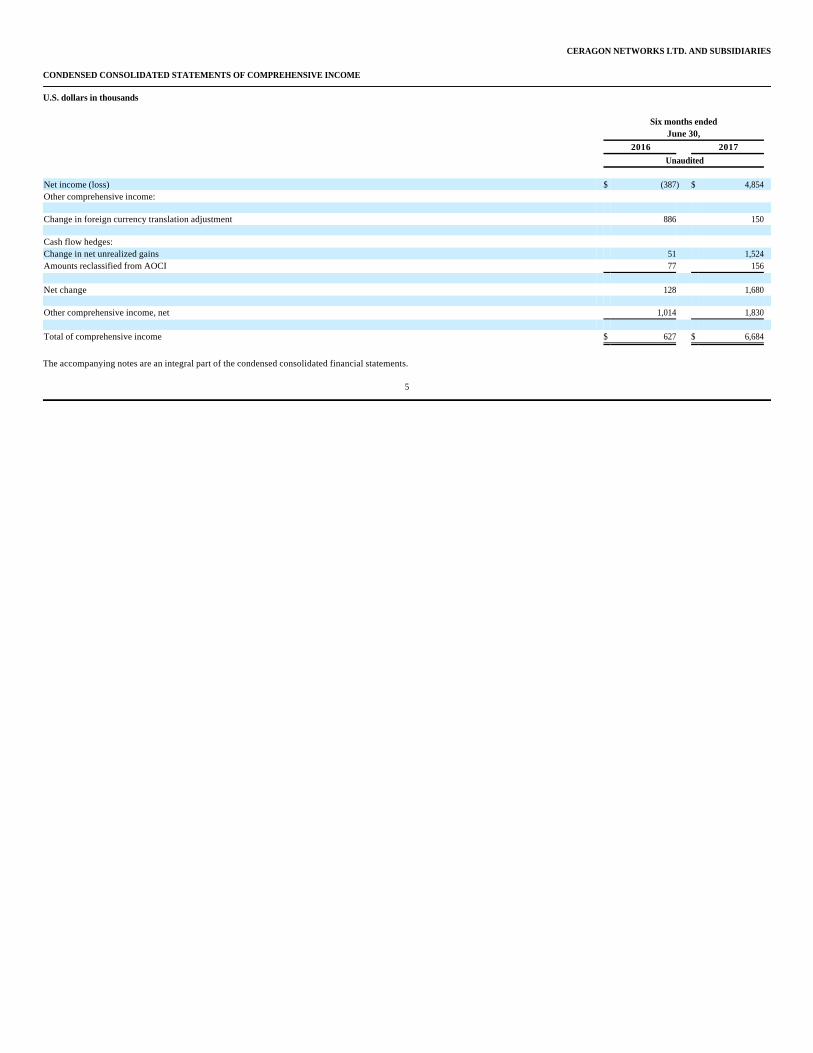
CERAGON NETWORKS LTD. AND SUBSIDIARIES
CONDENSED CONSOLIDATED STATEMENTS OF COMPREHENSIVE INCOME
U.S. dollars in thousands
The accompanying notes are an integral part of the condensed consolidated financial statements.
5
Six months ended
June 30,
2016 2017
Unaudited Net income (loss) $ (387) $ 4,854 Other comprehensive income: Change in foreign currency translation adjustment 886 150 Cash flow hedges: Change in net unrealized gains 51 1,524 Amounts reclassified from AOCI 77 156 Net change 128 1,680 Other comprehensive income, net 1,014 1,830 Total of comprehensive income $ 627 $ 6,684
CERAGON NETWORKS LTD. AND SUBSIDIARIES
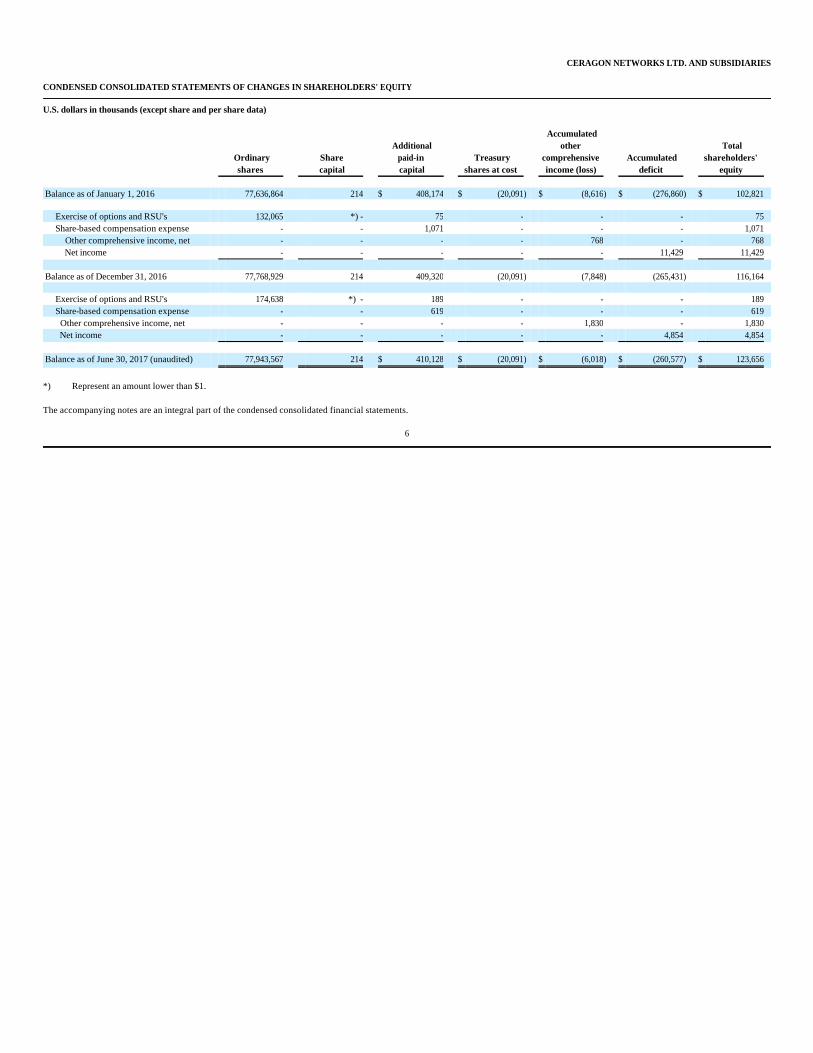
CONDENSED CONSOLIDATED STATEMENTS OF CHANGES IN SHAREHOLDERS' EQUITY
U.S. dollars in thousands (except share and per share data)
*) Represent an amount lower than $1. The accompanying notes are an integral part of the condensed consolidated financial statements.
6
Ordinary shares
Share capital
Additional paid-in capital
Treasury shares at cost
Accumulated other
comprehensive income (loss)
Accumulated deficit
Total shareholders'
equity Balance as of January 1, 2016 77,636,864 214 $ 408,174 $ (20,091) $ (8,616) $ (276,860) $ 102,821
Exercise of options and RSU's 132,065 *) - 75 - - - 75 Share-based compensation expense - - 1,071 - - - 1,071
Other comprehensive income, net - - - - 768 - 768 Net income - - - - - 11,429 11,429
Balance as of December 31, 2016 77,768,929 214 409,320 (20,091) (7,848) (265,431) 116,164
Exercise of options and RSU's 174,638 *) - 189 - - - 189 Share-based compensation expense - - 619 - - - 619 Other comprehensive income, net - - - - 1,830 - 1,830 Net income - - - - - 4,854 4,854
Balance as of June 30, 2017 (unaudited) 77,943,567 214 $ 410,128 $ (20,091) $ (6,018) $ (260,577) $ 123,656

CERAGON NETWORKS LTD. AND SUBSIDIARIES CONDENSED CONSOLIDATED STATEMENTS OF CASH FLOWS
U.S. dollars in thousands
The accompanying notes are an integral part of the condensed consolidated financial statements.
7
Six months ended
June 30,
2016 2017
Unaudited Cash flow from operating activities:
Net income (loss) $ (387) $ 4,854 Adjustments to reconcile net income (loss) to net cash provided by operating activities:
Depreciation and amortization 4,976 4,574 Stock-based compensation expense 592 619 Decrease (increase) in trade and other receivables, net 30,503 (9,288) Decrease (increase) in inventory, net of write off 1,603 (10,555) Decrease in deferred tax asset, net 1,205 140 Increase (decrease) in trade payables and accrued liabilities (18,445) 18,775 Increase (decrease) in deferred revenues (4,934) 1,018 Other adjustments (108) (88)
Net cash provided by operating activities 15,005 10,049
Cash flow from investing activities: Purchase of property and equipment (3,608) (3,505) Investment in short-term bank deposits (153) -
Net cash used in investing activities (3,761) (3,505)
Cash flow from financing activities:
Proceeds from share options exercise 7 189 Repayment of bank loans (13,472) (9,000)
Net cash used in financing activities (13,465) (8,811) Effect of exchange rate changes on cash 280 16 Decrease in cash and cash equivalents (1,941) (2,251) Cash and cash equivalents at the beginning of the period 36,318 36,338 Cash and cash equivalents at the end of the period $ 34,377 $ 34,087

CERAGON NETWORKS LTD. AND SUBSIDIARIES NOTES TO CONDENSED CONSOLIDATED FINANCIAL STATEMENTS
U.S. dollars in thousands (except share and per share data)
The accompanying consolidated balance sheet as of June 30, 2017, the consolidated statements of operations, the consolidated statements of comprehensive income and the consolidated statements of cash flows for the six months ended June 30, 2016 and 2017, as well as the statement of changes in shareholders' equity for the six months ended June 30, 2017, are unaudited. These unaudited interim consolidated financial statements have been prepared in accordance with generally accepted accounting principles in the United States (“U.S. GAAP”) and applicable rules and regulations of the Securities and Exchange Commission regarding interim financial reporting. In the management’s opinion, the unaudited interim consolidated financial statements include all adjustments of a normal recurring nature necessary for the fair presentation of the Company’s financial position as of June 30, 2017, as well as its results of operations and cash flows for the six months ended June 30, 2016 and 2017. The results of operations for the six months ended June 30, 2017 are not necessarily indicative of the results to be expected for the year ending December 31, 2017.
8
NOTE 1:- GENERAL
a. Ceragon Networks Ltd. ("the Company") is a wireless backhaul specialist. It provides wireless backhaul solutions that enable cellular operators and other wireless service providers to deliver voice and data services, enabling smart-phone applications such as internet browsing, social networking applications, image sharing, music and video applications. Its wireless backhaul solutions use microwave radio technology to transfer large amounts of telecommunication traffic between base stations and small-cells and the core of the service provider's network. The Company also provides wireless fronthaul solutions that use microwave technology for ultra-high speed, ultra-low latency communication between LTE/LTE-Advanced base band digital units stations and remote radio heads.
b. The Company's solutions support all wireless access technologies, including LTE-Advanced, LTE, HSPA, EV-DO, CDMA, W-CDMA and GSM. The Company's systems also serve evolving network architectures including all-IP long haul networks.
c. The Company sells its products through a direct sales force, systems integrators, distributors and original equipment manufacturers.
d. The Company's wholly owned subsidiaries provide research and development, marketing, manufacturing, distribution, sales and technical support to the Company's customers worldwide.
NOTE 2:- SUMMARY OF SIGNIFICANT ACCOUNTING POLICIES
a. Interim Financial Statements
CERAGON NETWORKS LTD. AND SUBSIDIARIES NOTES TO CONDENSED CONSOLIDATED FINANCIAL STATEMENTS
U.S. dollars in thousands (except share and per share data)
The accompanying unaudited interim financial statements should be read in conjunction with the Company’s Annual Report on Form 20-F filed with the Securities and Exchange Commission (the "SEC") on April 7, 2017.
There have been no changes to the significant accounting policies described in the Annual Report on Form 20-F for the fiscal year ended December 31, 2016 that have had a material impact on the unaudited interim consolidated financial statements and related notes.
The preparation of the consolidated financial statements in conformity with U.S. Generally Accepted Accounting Principles (“GAAP”) requires management to make estimates, judgments and assumptions that affect the amounts reported and disclosed in the financial statements and the accompanying notes. Actual results could differ materially from those estimates. On an ongoing basis, the Company's management evaluates its estimates, including those related to accounts receivable, fair values and useful lives of intangible assets, fair values of stock-based awards, income taxes, and contingent liabilities, among others. Such estimates are based on historical experience and on various other assumptions that are believed to be reasonable, the results of which form the basis for making judgments about the carrying values of the Company’s assets and liabilities.
In May 2014, the FASB issued a new standard related to revenue recognition. Under the new standard, revenue is recognized when a customer obtains control of promised goods or services and is recognized in an amount that reflects the consideration which the entity expects to receive in exchange for those goods or services. In addition, the standard requires disclosure of the nature, amount, timing, and uncertainty of revenue and cash flows arising from contracts with customers. The FASB has recently issued several amendments to the standard, including clarification on identifying performance obligations.
The guidance permits two methods of modification: retrospectively to each prior reporting period presented (full retrospective method), or retrospectively with the cumulative effect of initially applying the guidance recognized at the date of initial application (the cumulative catch-up transition method). The Company elected to use the cumulative effect method of adoption.
The new standard will be effective for the Company beginning January 1, 2018.
The Company has made progress toward completing its evaluation of the potential changes from adopting this new standard on its financial reporting and disclosures. The Company has evaluated the impact of the standard on majority of its revenue streams and associated contracts. The Company formed an implementation work group and expects to complete the evaluation of the impact of the accounting and disclosure changes on its business processes, controls and systems throughout 2017, design any changes to such business processes, controls and systems, and implement the changes before the end of 2017.
9
NOTE 2:- SUMMARY OF SIGNIFICANT ACCOUNTING POLICIES (Cont.)
b. Use of estimates
c. Impact of recently issued Accounting Standards:
CERAGON NETWORKS LTD. AND SUBSIDIARIES NOTES TO CONDENSED CONSOLIDATED FINANCIAL STATEMENTS
U.S. dollars in thousands (except share and per share data)
Currently, the Company is analyzing the impact that the adoption of the standard will have on specific performance obligations and variable consideration transactions. In addition, incremental costs that are related to sales from contracts signed during the period would require capitalization. The Company also will consider if there is a significant financing component if the time between payment and delivery is more than one year.
The Company continues to assess all potential impacts under the new revenue recognition standard.
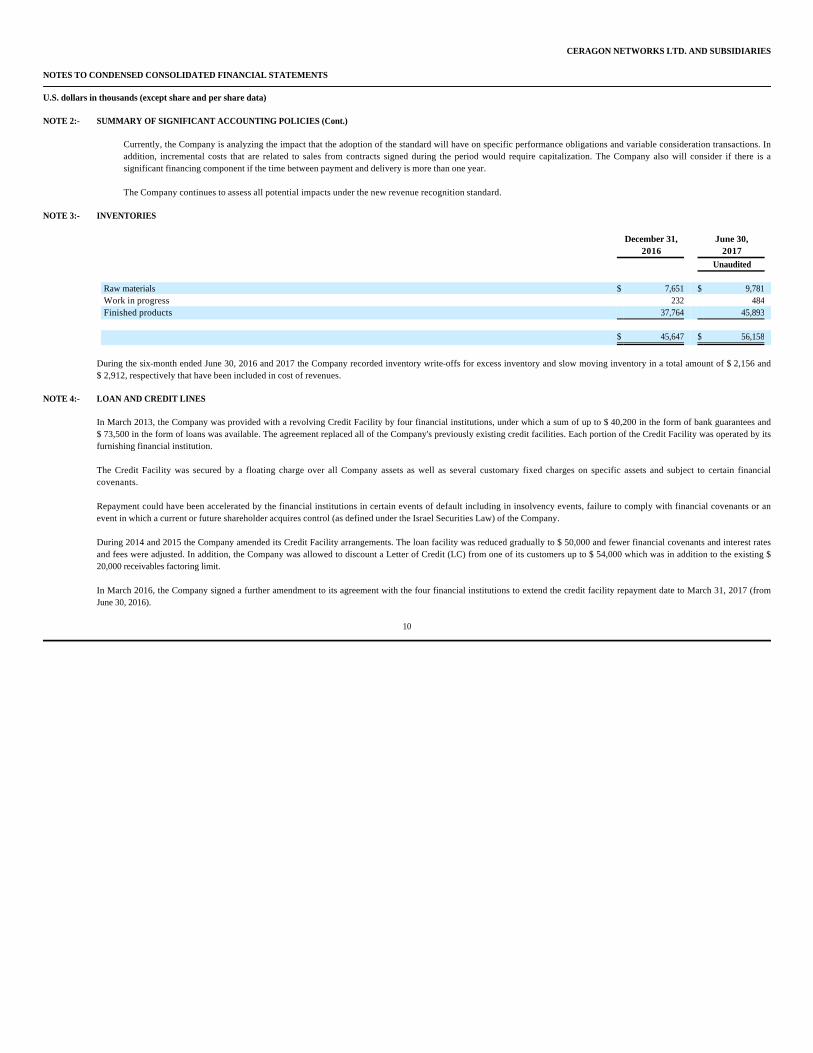
During the six-month ended June 30, 2016 and 2017 the Company recorded inventory write-offs for excess inventory and slow moving inventory in a total amount of $ 2,156 and $ 2,912, respectively that have been included in cost of revenues.
In March 2013, the Company was provided with a revolving Credit Facility by four financial institutions, under which a sum of up to $ 40,200 in the form of bank guarantees and $ 73,500 in the form of loans was available. The agreement replaced all of the Company's previously existing credit facilities. Each portion of the Credit Facility was operated by its furnishing financial institution.
The Credit Facility was secured by a floating charge over all Company assets as well as several customary fixed charges on specific assets and subject to certain financial covenants.
Repayment could have been accelerated by the financial institutions in certain events of default including in insolvency events, failure to comply with financial covenants or an event in which a current or future shareholder acquires control (as defined under the Israel Securities Law) of the Company.
During 2014 and 2015 the Company amended its Credit Facility arrangements. The loan facility was reduced gradually to $ 50,000 and fewer financial covenants and interest rates and fees were adjusted. In addition, the Company was allowed to discount a Letter of Credit (LC) from one of its customers up to $ 54,000 which was in addition to the existing $ 20,000 receivables factoring limit.
In March 2016, the Company signed a further amendment to its agreement with the four financial institutions to extend the credit facility repayment date to March 31, 2017 (from June 30, 2016).
10
NOTE 2:- SUMMARY OF SIGNIFICANT ACCOUNTING POLICIES (Cont.)
NOTE 3:- INVENTORIES
December 31, June 30, 2016 2017
Unaudited Raw materials $ 7,651 $ 9,781 Work in progress 232 484 Finished products 37,764 45,893
$ 45,647 $ 56,158
NOTE 4:- LOAN AND CREDIT LINES

CERAGON NETWORKS LTD. AND SUBSIDIARIES NOTES TO CONDENSED CONSOLIDATED FINANCIAL STATEMENTS
U.S. dollars in thousands (except share and per share data)
In December 2016, the Company signed a further amendment to its agreement with the four financial institutions to increase the allowed discounting activities of LC receivables to $ 94,000.
In March 2017, the Company signed a further amendment to its agreement with the four financial institutions to extend the credit facility repayment date to March 31, 2018. One of the four banks had to terminate its participation in the agreement because of regulatory constraints and its share in the Credit Facility was re-distributed by the other three on a pro-rata basis. In addition, the credit facility for bank guarantees was increased to $ 50,200. Other changes adjusted the fees and interest spread to the same levels of the original agreement from March 2013.
As of June 30, 2017, the Company utilized $ 8,000 out of $ 50,000 of available credit lines. During the period ended on June 30, 2017, the credit lines carry interest rates in the range of Libor+3% and Libor+3.1%.
The credit agreement contains financial and other covenants requiring that the Company maintains, among other things, minimum shareholders’ equity value and financial assets, a certain ratio between our shareholders’ equity and the total value of our assets on our balance sheet and a certain ratio between our net financial debt to each of our working capital and accounts receivable. As of June 30, 2017, the Company met all of its covenants.
The carrying amounts of financial instruments carried at cost, including cash and cash equivalents, short-term deposits, restricted cash, accounts receivable, prepaid expenses and other assets, accounts payable, accrued expenses and other liabilities, approximate their fair value due to the short-term maturities of such instruments. The following table present assets measured at fair value on a recurring basis as of June 30, 2017:
11
NOTE 4:- LOAN AND CREDIT LINES (Cont.)
NOTE 5:- FAIR VALUE MEASUREMENT
June 30, 2017
Fair value measurements
using input type
Level 2 Total Derivatives instruments $ 1,478 $ 1,478
Total assets $ 1,478 $ 1,478

CERAGON NETWORKS LTD. AND SUBSIDIARIES NOTES TO CONDENSED CONSOLIDATED FINANCIAL STATEMENTS
U.S. dollars in thousands (except share and per share data)
The following table present liabilities measured at fair value on a recurring basis as of December 31, 2016:
As of December 31, 2016, the Company had outstanding forward exchange contracts designated as a cash flow hedge for the acquisition of NIS 71,274 in consideration for $ 18,890 maturing in a period of up to one year. As of June 30, 2017, the Company had outstanding forward exchange contracts designated as a cash flow hedge for the acquisition of NIS 69,307 in consideration for $ 18,495 maturing in a period of up to one year.
The Company also enters into forward exchange contracts to hedge a portion of its certain monetary items in the balance sheet, such as trade receivables and trade payables denominated in foreign currencies for a period of up to one month (the "Fair Value Hedging Program"). The purpose of the Company's Fair Value Hedging Program is to protect the fair value of the monetary assets from foreign exchange rates fluctuations. Gains and losses from derivatives related to the Fair Value Hedging Program are not designated as hedging instruments.
12
NOTE 5:- FAIR VALUE MEASUREMENT
Year ended
December 31, 2016
Fair value measurements
using input type
Level 2 Total Derivatives instruments $ (159) $ (159)
Total liabilities $ (159) $ (159)
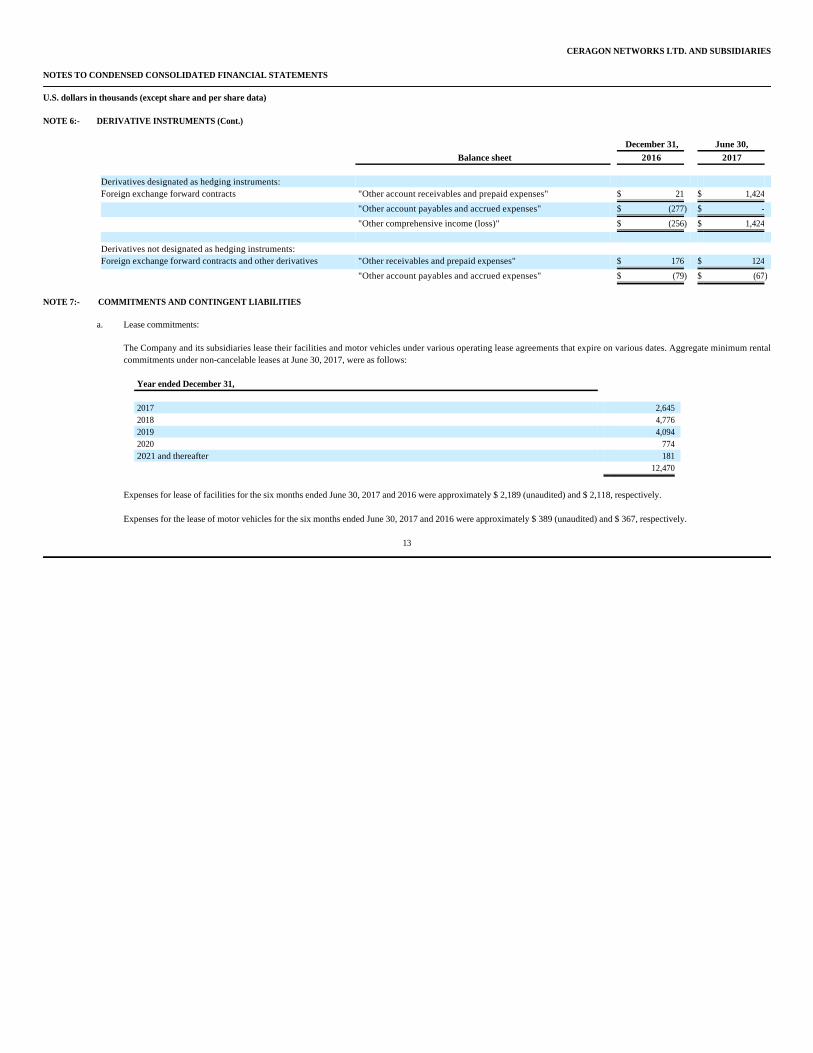
NOTE 6:- DERIVATIVE INSTRUMENTS
Gain recognized in Statements of Comprehensive
income
Gain (loss) recognized in consolidated statements of
operations
Six months
ended June 30, Statement of Six months ended June 30, 2017 Operations item 2016 2017 Derivatives designated as hedging instruments:
forward contract $ 1,424 Operating expenses $ (77) $ (156) Derivatives not designated as hedging instruments:
Foreign exchange forward contracts - Financial expenses (409) (1,374) Total $ 1,424 $ (486) $ (1,530)
CERAGON NETWORKS LTD. AND SUBSIDIARIES NOTES TO CONDENSED CONSOLIDATED FINANCIAL STATEMENTS
U.S. dollars in thousands (except share and per share data)
The Company and its subsidiaries lease their facilities and motor vehicles under various operating lease agreements that expire on various dates. Aggregate minimum rental commitments under non-cancelable leases at June 30, 2017, were as follows:
Expenses for lease of facilities for the six months ended June 30, 2017 and 2016 were approximately $ 2,189 (unaudited) and $ 2,118, respectively.
Expenses for the lease of motor vehicles for the six months ended June 30, 2017 and 2016 were approximately $ 389 (unaudited) and $ 367, respectively.
13
NOTE 6:- DERIVATIVE INSTRUMENTS (Cont.)
December 31, June 30,
Balance sheet 2016 2017 Derivatives designated as hedging instruments: Foreign exchange forward contracts "Other account receivables and prepaid expenses" $ 21 $ 1,424
"Other account payables and accrued expenses" $ (277) $ -
"Other comprehensive income (loss)" $ (256) $ 1,424
Derivatives not designated as hedging instruments: Foreign exchange forward contracts and other derivatives "Other receivables and prepaid expenses" $ 176 $ 124
"Other account payables and accrued expenses" $ (79) $ (67)
NOTE 7:- COMMITMENTS AND CONTINGENT LIABILITIES
a. Lease commitments:
Year ended December 31, 2017 2,645 2018 4,776 2019 4,094 2020 774 2021 and thereafter 181
12,470
CERAGON NETWORKS LTD. AND SUBSIDIARIES NOTES TO CONDENSED CONSOLIDATED FINANCIAL STATEMENTS
U.S. dollars in thousands (except share and per share data)
As of June 30, 2017, the Company provided bank guarantees in an aggregate amount of $34,988 (which counts as part of its credit line) with respect to tender offer guarantees and performance guarantees to its customers.
The Company is currently involved in various claims and legal proceedings. The Company reviews the status of each matter and assesses its potential financial exposure. If the potential loss from any claim or legal proceeding is considered probable and the amount can be reasonably estimated, the Company accrues a liability for the estimated loss.
On January 6, 2015 the Company was served with a motion to approve a purported class action, naming the Company, its Chief Executive Officer and its directors as defendants. The motion was filed with the District Court of Tel-Aviv. The purported class action alleges breaches of duties by making false and misleading statements in the Company's SEC filings and public statements. The Company filed its defense on June 21, 2015, and on October 22, 2015 the plaintiff filed a request for discovery of specific documents. The Company filed its response to the plaintiffs' request for discovery on January 25, 2016 and the plaintiffs submitted their response on February 24, 2016. On June 8, 2016, the District Court partially accepted the plaintiff's request for discovery, and ordered the Company to disclose some of the requested documents. The Company's request to appeal this decision was denied by the Supreme Court on October 25, 2016, and the Company disclosed the required documents to the plaintiff. The plaintiff filed his reply to the Company’s response to the motion by April 2, 2017. A preliminary hearing was held on May 22 2017, in the framework of which the court set dates for response to the Company’s abovementioned requests as well as dates for evidence hearings, which are due to take place on November 2 and 13, 2017.
In May 2017, the Company filed two requests: the first, requesting to dismiss the plaintiff’s response to the Company’s defense, or, alternatively, to allow the Company to respond to it; the second, to continue discussions with regards to the legal question of the governing law. On July 17, 2017, the court issued its decision in the first request, denying the requested dismissal of plaintiff’s response to the Company’s defense, but allowing the Company to respond to it; on July 29, the Court issued its decision in the second request, and denied it. The Company filed its response on September 18, 2017. The plaintiff seeks specified compensatory damages in a sum of up to $75,000,000, as well as attorneys’ fees and costs.
14
NOTE 7:- COMMITMENTS AND CONTINGENT LIABILITIES (Co t.)
b. During the six months ended June 30, 2016 and 2017, the Company received several grants from the Israeli Innovation Authority (“IIA”). The grants require the Company to comply with the requirements of the Research and Development Law, however, the Company is not obligated to pay royalties on sales of products based on technology or know how developed from the grants. In a case involving the transfer of technology or know how developed from the grants outside of Israel, the Company may be required to pay royalties related to past sales of products based on the technology or the developed know how. The Company recorded the IIA grants as a reduction of research and development expenses in the six months ended June 30, 2016 and 2017 in the amount of $ 1,575 and $ 937, respectively.
c. Charges and guarantees:
d. Litigations:
CERAGON NETWORKS LTD. AND SUBSIDIARIES NOTES TO CONDENSED CONSOLIDATED FINANCIAL STATEMENTS
U.S. dollars in thousands (except share and per share data)
The initial procedure (i.e. until the District Court decides whether to approve the motion or to deny it) has been conducted for over two and a half years now. The Company is unable to estimate how long it is expected to last. The Company believes that the District Court should deny the motion. There is no assurance that the Company's position will be accepted by the District Court. In such case the Company may have to divert attention of its executives to deal with this class action as well as incur expenses that may be beyond its insurance coverage for such cases, which cause a risk of loss and expenditures that may adversely affect its financial condition and results of operations.
The Company believes it has strong defense claims and intends to vigorously defend its position. The Company cannot assess the outcome of this claim due its early stage. Therefore, the Company did not record a provision as of June 30, 2017.
The ordinary shares of the Company entitle their holders to receive notice to participate and vote in general meetings of the Company, the right to share in distributions upon liquidation of the Company, and to receive dividends, if declared.
In 2003, the Company adopted a share option plan (the "Plan"). Under the Plan, options and RSU’s may be granted to officers, directors, employees and consultants of the Company or its subsidiaries. The options vest primarily over four years. The options expire ten years from the date of grant. In December 2012, the Company extended the term of the Plan for an additional period of ten years.
Upon adoption of the Plan, the Company reserved for issuance 8,639,000 ordinary shares in accordance with the respective terms thereof. Any options or RSU’s, which are canceled or forfeited before the expiration date, become available for future grants. As of June 30, 2017, the Company has 1,644,014 Ordinary shares available for future grant under the Plan.
On September 6, 2010, the Company's board of directors amended the Plan so as to enable to grant Restricted share Units ("RSUs") pursuant to such Plan.
15
NOTE 7:- COMMITMENTS AND CONTINGENT LIABILITIES (Cont.)
NOTE 8:- SHAREHOLDERS' EQUITY
a. Ordinary shares
b. Stock Options, Restricted Stock Units
CERAGON NETWORKS LTD. AND SUBSIDIARIES NOTES TO CONDENSED CONSOLIDATED FINANCIAL STATEMENTS
U.S. dollars in thousands (except share and per share data)
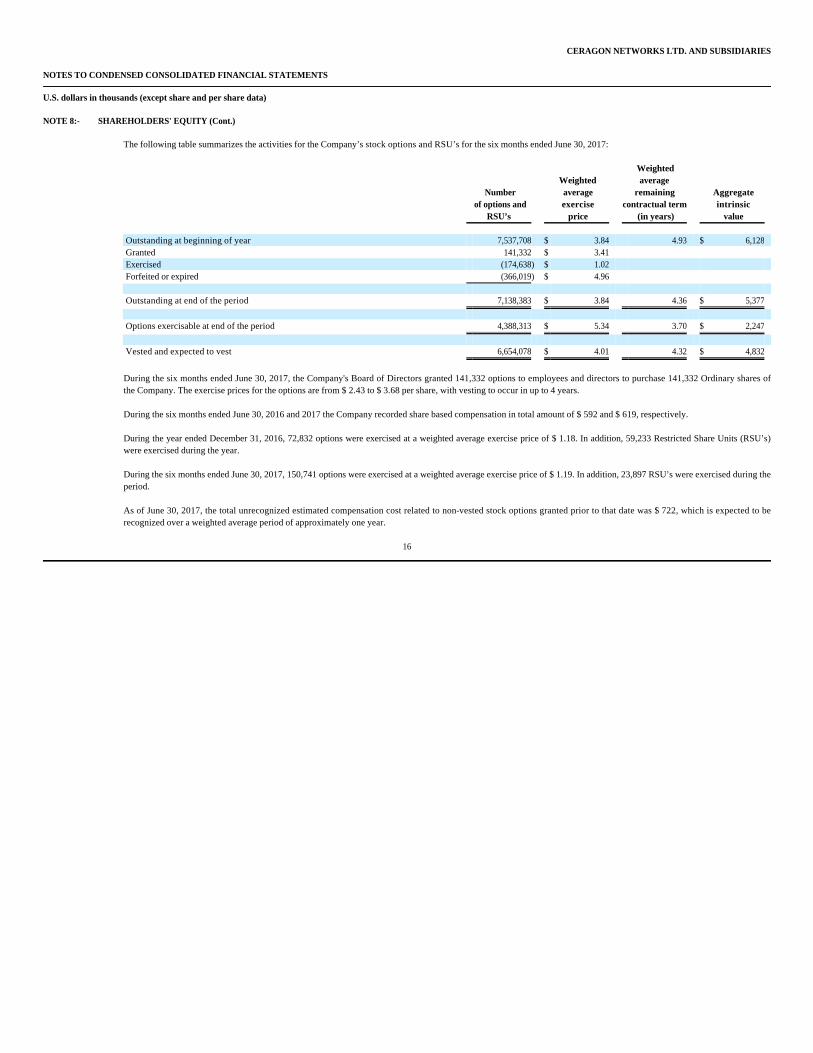
The following table summarizes the activities for the Company’s stock options and RSU’s for the six months ended June 30, 2017:
During the six months ended June 30, 2017, the Company's Board of Directors granted 141,332 options to employees and directors to purchase 141,332 Ordinary shares of the Company. The exercise prices for the options are from $ 2.43 to $ 3.68 per share, with vesting to occur in up to 4 years.
During the six months ended June 30, 2016 and 2017 the Company recorded share based compensation in total amount of $ 592 and $ 619, respectively.
During the year ended December 31, 2016, 72,832 options were exercised at a weighted average exercise price of $ 1.18. In addition, 59,233 Restricted Share Units (RSU’s) were exercised during the year.
During the six months ended June 30, 2017, 150,741 options were exercised at a weighted average exercise price of $ 1.19. In addition, 23,897 RSU’s were exercised during the period.
As of June 30, 2017, the total unrecognized estimated compensation cost related to non-vested stock options granted prior to that date was $ 722, which is expected to be recognized over a weighted average period of approximately one year.
16
NOTE 8:- SHAREHOLDERS' EQUITY (Cont.)
Number of options and
RSU’s
Weighted average exercise
price
Weighted average
remaining contractual term
(in years)
Aggregate intrinsic
value Outstanding at beginning of year 7,537,708 $ 3.84 4.93 $ 6,128 Granted 141,332 $ 3.41 Exercised (174,638) $ 1.02 Forfeited or expired (366,019) $ 4.96
Outstanding at end of the period 7,138,383 $ 3.84 4.36 $ 5,377
Options exercisable at end of the period 4,388,313 $ 5.34 3.70 $ 2,247
Vested and expected to vest 6,654,078 $ 4.01 4.32 $ 4,832
CERAGON NETWORKS LTD. AND SUBSIDIARIES NOTES TO CONDENSED CONSOLIDATED FINANCIAL STATEMENTS
U.S. dollars in thousands (except share and per share data)
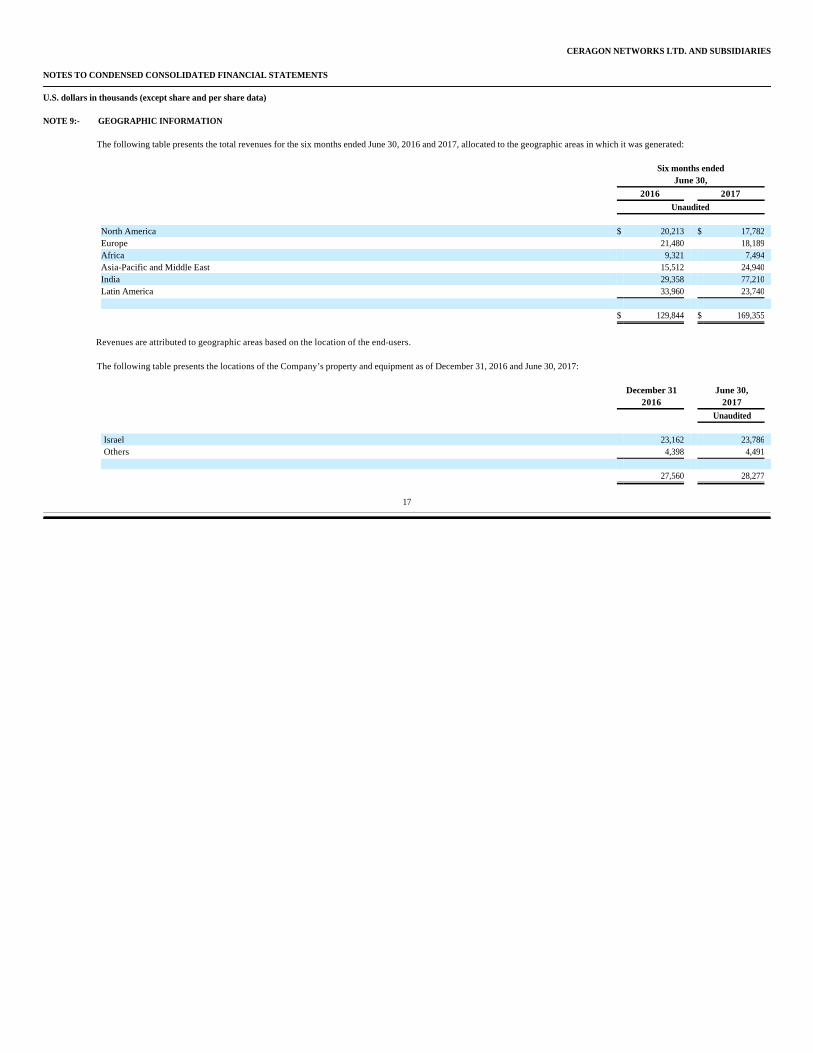
The following table presents the total revenues for the six months ended June 30, 2016 and 2017, allocated to the geographic areas in which it was generated:
Revenues are attributed to geographic areas based on the location of the end-users.
The following table presents the locations of the Company’s property and equipment as of December 31, 2016 and June 30, 2017:
17
NOTE 9:- GEOGRAPHIC INFORMATION
Six months ended
June 30,
2016 2017
Unaudited North America $ 20,213 $ 17,782 Europe 21,480 18,189 Africa 9,321 7,494 Asia-Pacific and Middle East 15,512 24,940 India 29,358 77,210 Latin America 33,960 23,740 $ 129,844 $ 169,355
December 31 June 30, 2016 2017
Unaudited Israel 23,162 23,786 Others 4,398 4,491
27,560 28,277

Exhibit 99.2
OPERATING AND FINANCIAL REVIEW AND PROSPECTS Components of Results of Operations
Revenues. We generate revenues primarily from the sale of our products, and, to a lesser extent, services. The final price to the customer may largely vary based on various factors, including but not limited to the size of a given transaction, the geographic location of the customer, the specific application for which products are sold, the channel through which products are sold, the competitive environment and the results of negotiation.
Cost of Revenues. Our cost of revenues consists primarily of the prices we pay contract manufacturers for the products they manufacture for us, the costs of off the shelf parts, accessories and antennas, the costs of our manufacturing facility, estimated warranty costs, costs related to management of our manufacturing facility, supply chain and shipping, as well as inventory write-off costs and amortization of intangible assets. In addition, we pay salaries and related costs to our employees and fees to subcontractors relating to installation services with respect to our products. Significant Expenses
Research and Development Expenses. Our research and development expenses consist primarily of salaries and related costs for research and development personnel, subcontractors’ costs, costs of materials and depreciation of equipment. All of our research and development costs are expensed as incurred. We believe that continued investment in research and development is essential to attaining our strategic objectives.
Selling and Marketing Expenses. Our selling and marketing expenses consist primarily of compensation and related costs for sales and marketing personnel, amortization of intangible assets, trade show and exhibit expenses, travel expenses, commissions and promotional materials.
General and Administrative Expenses. Our general and administrative expenses consist primarily of compensation and related costs for executive, finance, information system and human resources personnel, professional fees (including legal and accounting fees), insurance, provisions for doubtful accounts and other general corporate expenses.
Financial Income (expenses), net. Our financial income (expenses), net, consists primarily of interest paid on bank debts, gains and losses arising from the re-measurement of
transactions and balances denominated in non-dollar currencies into dollars, gains and losses from our currency hedging activity and other fees and commissions paid to banks, offset by interest earned on bank deposits.
Taxes. Our tax expenses consist of current corporate tax expenses in various locations and changes in tax deferred assets and liabilities, as well as reserves for uncertain tax positions.
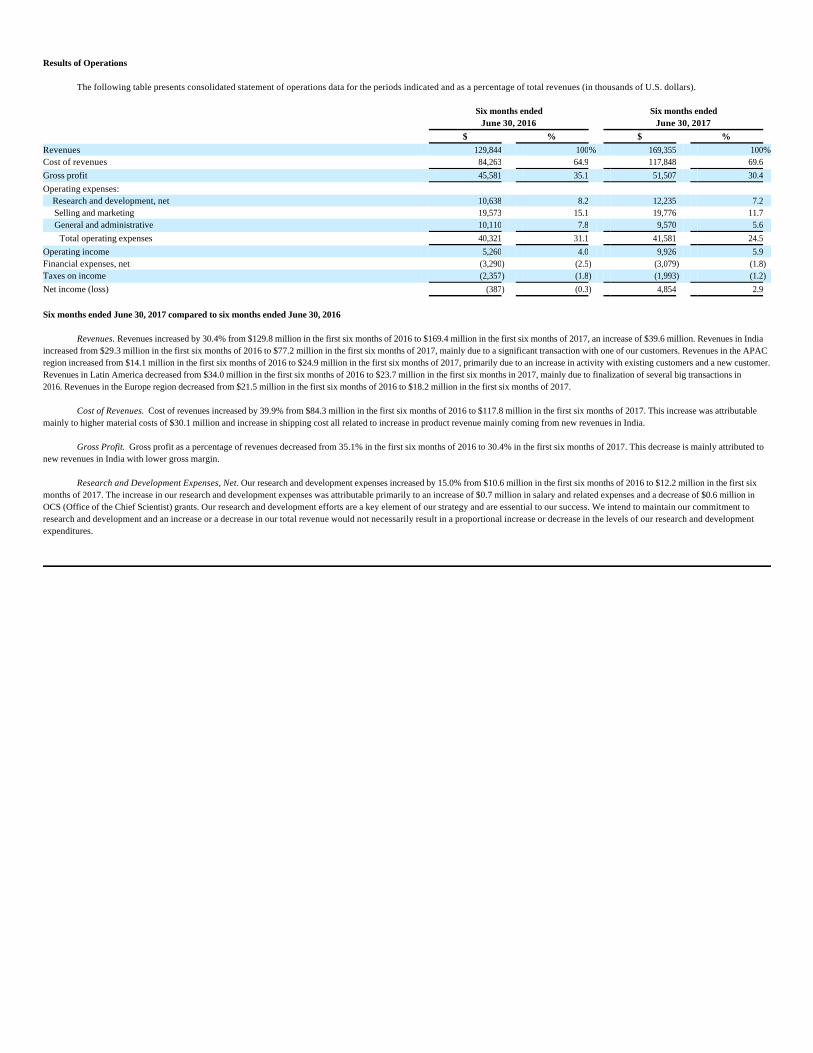
Results of Operations
The following table presents consolidated statement of operations data for the periods indicated and as a percentage of total revenues (in thousands of U.S. dollars).
Six months ended June 30, 2017 compared to six months ended June 30, 2016
Revenues. Revenues increased by 30.4% from $129.8 million in the first six months of 2016 to $169.4 million in the first six months of 2017, an increase of $39.6 million. Revenues in India increased from $29.3 million in the first six months of 2016 to $77.2 million in the first six months of 2017, mainly due to a significant transaction with one of our customers. Revenues in the APAC region increased from $14.1 million in the first six months of 2016 to $24.9 million in the first six months of 2017, primarily due to an increase in activity with existing customers and a new customer. Revenues in Latin America decreased from $34.0 million in the first six months of 2016 to $23.7 million in the first six months in 2017, mainly due to finalization of several big transactions in 2016. Revenues in the Europe region decreased from $21.5 million in the first six months of 2016 to $18.2 million in the first six months of 2017.
Cost of Revenues. Cost of revenues increased by 39.9% from $84.3 million in the first six months of 2016 to $117.8 million in the first six months of 2017. This increase was attributable mainly to higher material costs of $30.1 million and increase in shipping cost all related to increase in product revenue mainly coming from new revenues in India.
Gross Profit. Gross profit as a percentage of revenues decreased from 35.1% in the first six months of 2016 to 30.4% in the first six months of 2017. This decrease is mainly attributed to new revenues in India with lower gross margin.
Research and Development Expenses, Net. Our research and development expenses increased by 15.0% from $10.6 million in the first six months of 2016 to $12.2 million in the first six months of 2017. The increase in our research and development expenses was attributable primarily to an increase of $0.7 million in salary and related expenses and a decrease of $0.6 million in OCS (Office of the Chief Scientist) grants. Our research and development efforts are a key element of our strategy and are essential to our success. We intend to maintain our commitment to research and development and an increase or a decrease in our total revenue would not necessarily result in a proportional increase or decrease in the levels of our research and development expenditures.
Six months ended
June 30, 2016 Six months ended
June 30, 2017
$ % $ % Revenues 129,844 100% 169,355 100%Cost of revenues 84,263 64.9 117,848 69.6 Gross profit 45,581 35.1 51,507 30.4 Operating expenses: Research and development, net 10,638 8.2 12,235 7.2 Selling and marketing 19,573 15.1 19,776 11.7 General and administrative 10,110 7.8 9,570 5.6 Total operating expenses 40,321 31.1 41,581 24.5 Operating income 5,260 4.0 9,926 5.9 Financial expenses, net (3,290) (2.5) (3,079) (1.8) Taxes on income (2,357) (1.8) (1,993) (1.2)
Net income (loss) (387) (0.3) 4,854 2.9
Selling and Marketing Expenses. Selling and marketing expenses increased by 1% from $19.6 million in the first six months of 2016 to $19.8 million in the first six months of 2017. This
increase was primarily attributable to the increase of approximately $0.7 million in commission expenses, which was partially offset by lower consultancy expenses of $0.3 million and lower office expenses of $0.3 million.
General and Administrative Expenses. General and administrative expenses decreased by 5.3% from $10.1 million in the first six months of 2016 to $9.6 million in the first six months of 2017. This decrease was primarily attributable to the decrease in doubtful debt expenses of $1.0 million, which was partially offset by increase of $0.7 million in salary and related expenses.
Financial expenses, Net. Financial expenses, net decreased by 6.4% from $3.3 million in the first six months of 2016 to $3.1 million in the first six months of 2017. The decrease in financial expenses was mainly attributable to a decrease in exchange rate differences related mainly to our activity in Venezuela, India and Nigeria as well as a decrease in interest paid on loans, offset by an increase in bank commissions and factoring expenses.
Taxes on income. Taxes on income decreased by 15.4% from $2.4 million in the first six months of 2016 to $2.0 million in the first six months of 2017. This change was mainly attributed to the decrease in our deferred tax expenses of $0.9 million, due to a significant deferred tax assets utilization in the first six months of 2016. The decrease was partially offset by increase in FIN 48 reserves of $0.7 million, related to changes in our tax exposures.
Net income. Net income (loss) increased from $(0.4) million in the first six months of 2016 to $4.8 million in the first six months of 2017. The increase in net income was attributable primarily to higher gross profit resulted from revenue and lower financial expenses and tax on income expenses partially offset by higher operating expenses. Liquidity and Capital Resources
As of June 30, 2017, we had approximately $34.1 million in cash and cash equivalents, out of which $0.2 million is located in Venezuela. It may be difficult to transfer foreign currency outside of Venezuela due to foreign currency restrictions.
As of June 30, 2017, our cash investments were comprised entirely of short-term, highly liquid investments with original maturities of up to three months. Most of these investments are in U.S. dollars.
As of June 30, 2017, our short-term debt from financial institutions was $8.0 million. We have a committed credit facility with a maximum line of credit of $50.2 million in the form of bank guarantees and $50 million in the form of loans, available for our use from a syndicate
of three banks, for which we pay commitment fees. The credit facility is provided by the syndicate with each bank agreeing severally (and not jointly) to make its agreed portion of the credit loans to us in accordance with the terms of the credit agreement which includes a framework for joint decision making powers by the banks. As of June 30, 2017, we had $42 million available under our credit facility in the form of loans.
In addition, the credit agreement contains financial and other covenants requiring that we maintain, among other things, minimum shareholders` equity, a certain ratio between our shareholders’ equity and the total value of our assets on our balance sheet, a certain ratio between our net financial debt to each of our working capital and accounts receivable, and a minimum cash covenant. Any failure to comply with the covenants, including for poor financial performance, may constitute a default under the credit agreement and may require us to seek an amendment or waiver from the banks to avoid termination of their commitments and/or an immediate repayment of all outstanding amounts under the credit facilities. The credit facility is secured by a floating charge over all Company assets as well as several customary fixed charges on specific assets. As of June 30, 2017, the Company met all of its covenants.
Net cash provided by operating activities was $10.0 million for the six months ended June 30, 2017.
In the first six months of 2017, our cash provided from operating activities was affected by the following principal factors:
These factors were offset by:
Net cash provided in operating activities was $15.0 million for the six months ended June 30, 2016. In the first six months of 2016, our cash provided by operating activities was affected by the following principal factors:
These factors were offset by:
ö our net income of $4.9 million;
ö a $4.6 million of depreciation and amortization expenses;
ö a $1.0 million increase in deferred revenues paid in advance; and
ö a $18.8 million increase in trade payables, net of accrued expenses and other accounts payables;
ö a $10.6 million increase in inventories, net of write-offs; and
ö a $9.3 million increase in trade and other receivables, net.
ö our net loss of $0.4 million;
ö a $5.0 million of depreciation and amortization expenses; and
ö a $30.5 million decrease in trade and other receivables, net;
ö a $18.4 million decrease in trade payables, net of accrued expenses and other accounts payables; and
ö a $5.0 million of decrease in deferred revenues paid in advance;

Net cash used in investing activities was approximately $3.5 million in the first six months of 2017 entirely attributed to purchase of property and equipment ,compared to $3.8 million
used in investing activities in the first six months of 2016, attributed to purchase of property and equipment of $3.6 million and to investment of $0.2 in short term bank deposits. Net cash used in financing activities was approximately $8.8 million in the first six months of 2017, attributed to repayment of a bank loan of $9.0 million, offset by proceeds from
exercises of share options, compared to $13.5 million used in the first six months in 2016 mainly due to repayment of bank loan.
Our capital requirements are dependent on many factors, including working capital requirements to finance the business activity of the Company, and the allocation of resources to research and development, marketing and sales activities. We plan on continuing to raise capital as we may require, subject to changes in our business activities.
We believe that current cash and cash equivalent balances together with the credit facility available with the lenders will be sufficient for our requirements through at least the next 12 months.