Embed Size (px)
Citation preview
ISSN 2042-2695
CEP Discussion Paper No 1467
February 2017
Parental Sleep and Employment: Evidence from a British Cohort Study
Joan Costa-Font Sarah Flèche
Abstract We show that sleep deprivation exerts a strong negative effect on labour market performance. We exploit variations in child sleep quality to instrument for parental sleep quality. A one-hour reduction in sleep duration significantly decreases labour force participation, the number of hour’s worked and household income. In addition, we find that low-skilled mothers are more likely to opt out of the labour market and work less hours than high-skilled mothers when exposed to sleep deprivation. We argue that sleep is a major determinant of employment outcomes that needs more attention in designing economic models of time allocation and employment policies. Keywords: child sleep, sleep, maternal employment, working hours, job satisfaction, ALSPAC JEL codes: J13; J22; I18; J28 This paper was produced as part of the Centre’s Wellbeing Programme. The Centre for Economic Performance is financed by the Economic and Social Research Council. Acknowledgements We are grateful to Berkay Ozcan, Sebastian Sneider, Colin Espie, Sophie Bostock, Christopher Barnes for their comments and suggestions to an earlier version of this project. This study uses ALSPAC data. We are extremely grateful to all the families who took part in this study, the midwives for their help in recruiting them, and the whole ALSPAC team, which includes interviewers, computer and laboratory technicians, clerical workers, research scientists, volunteers, managers, receptionists and nurses. The UK Medical Research Council and the Wellcome Trust (Grant ref: 102215/2/13/2) and the University of Bristol provide core support for ALSPAC. This research was specifically funded by the US National Institute on Aging (Grant R01AG0400640), the John Templeton Foundation and the What Works Centre for Wellbeing. Ethical approval for the study was obtained from the ALSPAC Ethics and Law Committee and the Local Research Ethics Committees. Joan Costa-Font, Department of Social Policy, London School of Economics. Sarah Fleche, Centre for Economic Performance, London School of Economics. Published by Centre for Economic Performance London School of Economics and Political Science Houghton Street London WC2A 2AE All rights reserved. No part of this publication may be reproduced, stored in a retrieval system or transmitted in any form or by any means without the prior permission in writing of the publisher nor be issued to the public or circulated in any form other than that in which it is published. Requests for permission to reproduce any article or part of the Working Paper should be sent to the editor at the above address. J. Costa-Font and S. Flèche, submitted 2017.
3
I. Introduction
Sleep is an essential human function associated with both physiological and cognitive
development. Lack of sleep is responsible for human fatigue, and can undermine economic
performance. Paradoxically, the extent to which sleep time is a productive activity or not, has
received very limited attention in economics research so far. Sleep is often overlooked in
economics models despite its obvious restorative effects on human health alongside its
influence on brain plasticity and feelings of wellbeing (Siegel, 2005; Frank, 2006). The
prefrontal cortex, which has proven to be critical for executive functioning is found to be
vulnerable to a lack of sleep (Harrison and Stone, 2000). Sleep exerts an influence on
emotional wellbeing and restful perceptions, and sleep deprivation more generally, even
when moderate, is found to be detrimental to employment behaviours and can underpin the
association between socio-economic status and both physical and mental health (Moore et al.,
2002). The number of hours the average person sleeps has declined over the past century, and
we still ignore its effects on economic activity and economic performance.
There are a number of mechanisms through which sleep can influence economic
activity. Sleep loss can increase the “allostatic load” and can lead to chronic diseases
associated with hypertension, diabetes, depression and obesity, as well as with cancer,
increased mortality and more generally a reduced quality of life (Barnes and Wagner, 2009;
Caruso et al., 2006; Scott and Judge, 2006). Sleep-deprived individuals are more likely to
make impulsive decisions. Although sleep deprivation can have several triggers such as
round-the-clock access to technology, time and work schedules alongside changes in light
and noise, there is evidence of household derived sleep deprivation. Specifically, sleep
deprivation resulting from children's sleep routines together with increasing parental
involvement and parental sharing in child bearing duties makes child related sleep
deprivation a potential source of variation in adult sleep.
A meta-analysis of existing research suggests that sleep deprivation strongly impairs
cognitive or motor performance (Pilcher and Huffcutt, 1996; Killgore 2010). Hence, one
would expect to find an effect of sleep deprivation, and more specifically sleep quality, on
measures of economic performance, including individual’s earnings, consistent with recent
evidence (Gibson and Shrader, 2015). However, to estimate the impact of sleep deprivation
on economic performance, we need a source of exogenous variation in sleep quality. In this
4
paper, we propose to exploit variations in child sleep quality as a possible source of
exogenous variation of parental sleep. Our strategy relies on three hypotheses:
i. We can identify significant longitudinal variations in child sleep quality, which in turn
affect parental sleep.
ii. Although having children is a matter of choice itself, the quality of children’s sleep is
to a large extent uncertain and hence orthogonal to parental sleep, and can be thought
of as resulting from the ‘luck of the genetic draw’ as the genetic component of sleep is
not higher than in other areas of child development (Barclay et al., 2010).
iii. The effect of child sleep on parental employment and working-time decisions works
through its effect on parental sleep quality.
Based on these three hypotheses, we draw upon an instrumental variable strategy
using the variation in child sleep quality as an instrument for changes in parental sleep
quality. We rely on a unique dataset for the United Kingdom (UK): the Avon Longitudinal
Study of Parents and Children (ALSPAC). This is a cohort study which follows a sample of
14,000 families from a child’s birth to age 25. More specifically, it contains records of
mothers since pregnancy and, crucially for our paper, has the advantage of including a rich
and validated set of measures of both parental and child sleep alongside a set of other
variables to be employed as controls and employment outcomes. Given that it has been
designed by public health researchers, it contains very precise information on the child's
quality of sleep, including whether the child wakes up at night, sleep time and day sleep, as
well as child sleeping routines and environmental triggers of sleep quality. We can then relate
these measures to objective and subjective measures of parental sleep quality, including
average sleep duration, and whether the mother/father feels she had enough sleep. Another
advantage is that the data provides us with information on both maternal and paternal
employment characteristics, including employment status, the number of hours worked, job
satisfaction and income for parents on a longitudinal basis. The latter are the key variables we
use as economic outcomes in our empirical exercise. Furthermore, it contains maternal
coordination capacity.
As a first step towards defining and evaluating the suitability of our empirical
strategy, we visually examine reduced form associations between children’s sleep and
5
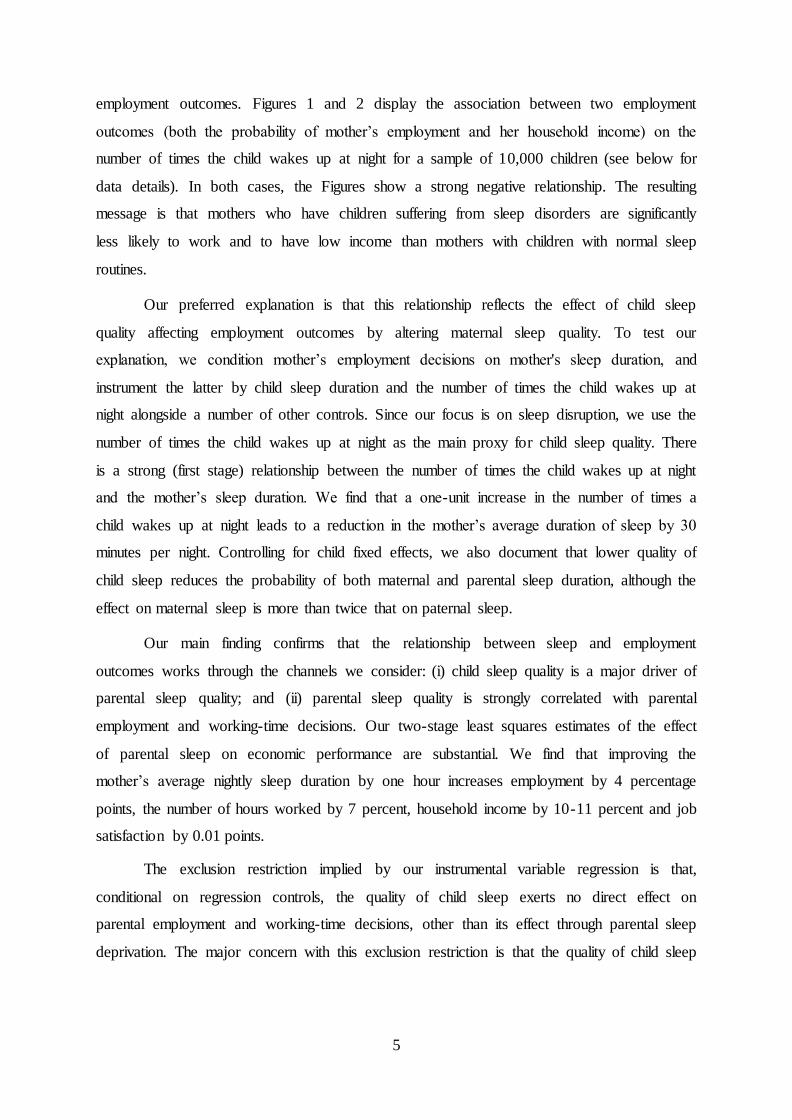
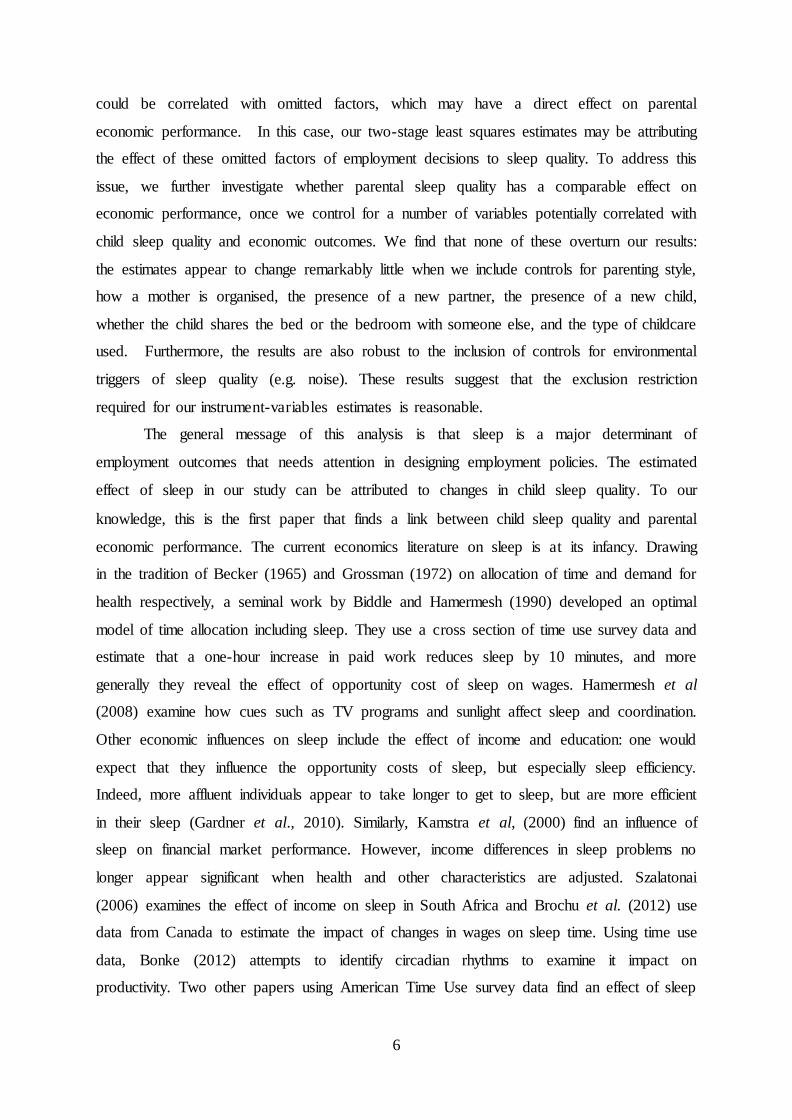
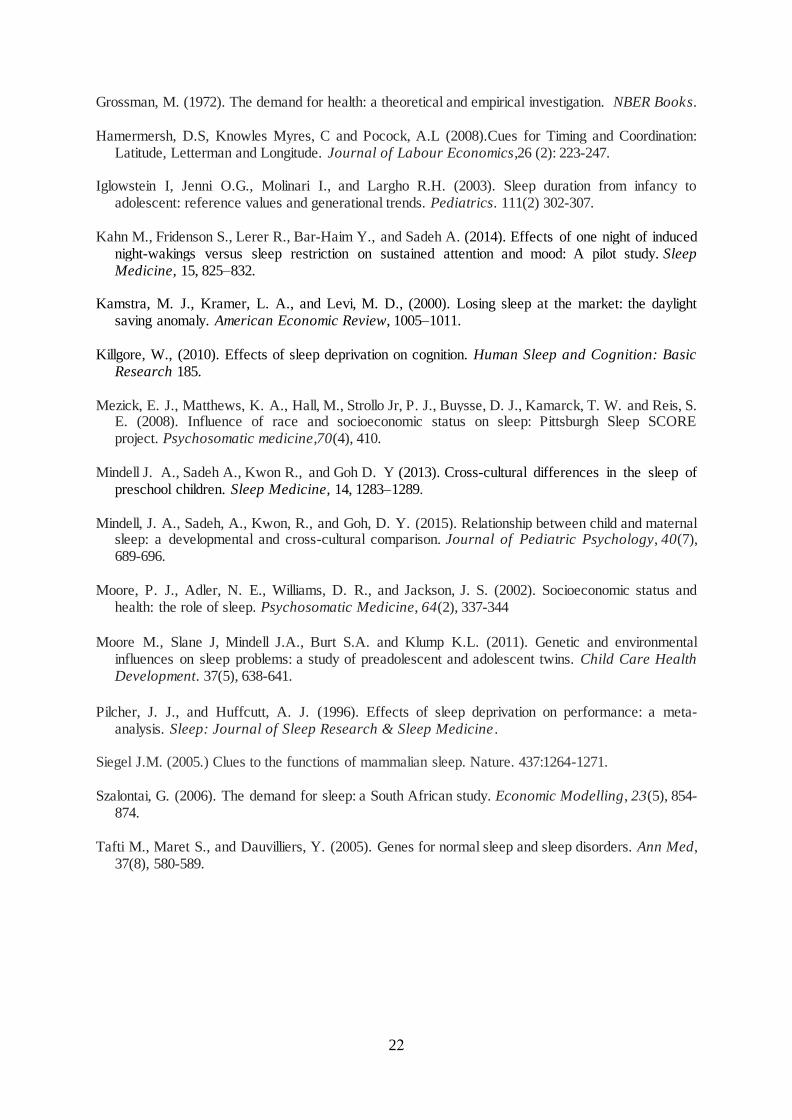
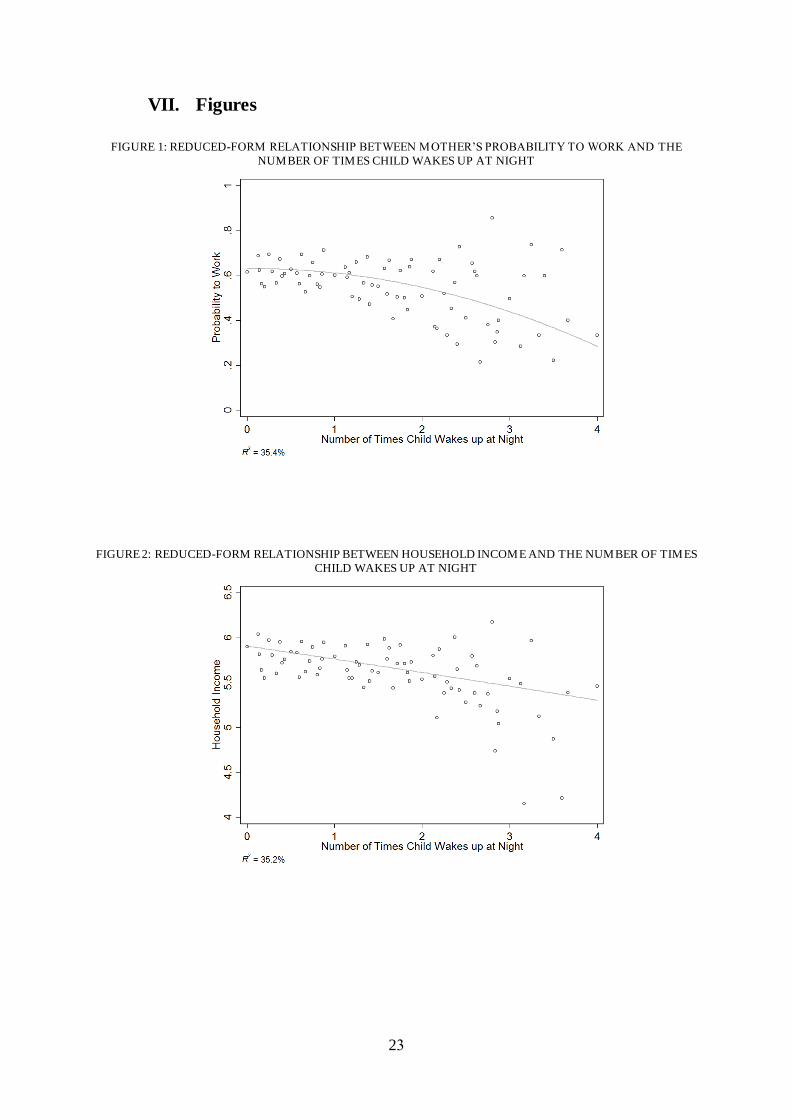
employment outcomes. Figures 1 and 2 display the association between two employment
outcomes (both the probability of mother’s employment and her household income) on the
number of times the child wakes up at night for a sample of 10,000 children (see below for
data details). In both cases, the Figures show a strong negative relationship. The resulting
message is that mothers who have children suffering from sleep disorders are significantly
less likely to work and to have low income than mothers with children with normal sleep
routines.
Our preferred explanation is that this relationship reflects the effect of child sleep
quality affecting employment outcomes by altering maternal sleep quality. To test our
explanation, we condition mother’s employment decisions on mother's sleep duration, and
instrument the latter by child sleep duration and the number of times the child wakes up at
night alongside a number of other controls. Since our focus is on sleep disruption, we use the
number of times the child wakes up at night as the main proxy for child sleep quality. There
is a strong (first stage) relationship between the number of times the child wakes up at night
and the mother’s sleep duration. We find that a one-unit increase in the number of times a
child wakes up at night leads to a reduction in the mother’s average duration of sleep by 30
minutes per night. Controlling for child fixed effects, we also document that lower quality of
child sleep reduces the probability of both maternal and parental sleep duration, although the
effect on maternal sleep is more than twice that on paternal sleep.
Our main finding confirms that the relationship between sleep and employment
outcomes works through the channels we consider: (i) child sleep quality is a major driver of
parental sleep quality; and (ii) parental sleep quality is strongly correlated with parental
employment and working-time decisions. Our two-stage least squares estimates of the effect
of parental sleep on economic performance are substantial. We find that improving the
mother’s average nightly sleep duration by one hour increases employment by 4 percentage
points, the number of hours worked by 7 percent, household income by 10-11 percent and job
satisfaction by 0.01 points.
The exclusion restriction implied by our instrumental variable regression is that,
conditional on regression controls, the quality of child sleep exerts no direct effect on
parental employment and working-time decisions, other than its effect through parental sleep
deprivation. The major concern with this exclusion restriction is that the quality of child sleep
6
could be correlated with omitted factors, which may have a direct effect on parental
economic performance. In this case, our two-stage least squares estimates may be attributing
the effect of these omitted factors of employment decisions to sleep quality. To address this
issue, we further investigate whether parental sleep quality has a comparable effect on
economic performance, once we control for a number of variables potentially correlated with
child sleep quality and economic outcomes. We find that none of these overturn our results:
the estimates appear to change remarkably little when we include controls for parenting style,
how a mother is organised, the presence of a new partner, the presence of a new child,
whether the child shares the bed or the bedroom with someone else, and the type of childcare
used. Furthermore, the results are also robust to the inclusion of controls for environmental
triggers of sleep quality (e.g. noise). These results suggest that the exclusion restriction
required for our instrument-variables estimates is reasonable.
The general message of this analysis is that sleep is a major determinant of
employment outcomes that needs attention in designing employment policies. The estimated
effect of sleep in our study can be attributed to changes in child sleep quality. To our
knowledge, this is the first paper that finds a link between child sleep quality and parental
economic performance. The current economics literature on sleep is at its infancy. Drawing
in the tradition of Becker (1965) and Grossman (1972) on allocation of time and demand for
health respectively, a seminal work by Biddle and Hamermesh (1990) developed an optimal
model of time allocation including sleep. They use a cross section of time use survey data and
estimate that a one-hour increase in paid work reduces sleep by 10 minutes, and more
generally they reveal the effect of opportunity cost of sleep on wages. Hamermesh et al
(2008) examine how cues such as TV programs and sunlight affect sleep and coordination.
Other economic influences on sleep include the effect of income and education: one would
expect that they influence the opportunity costs of sleep, but especially sleep efficiency.
Indeed, more affluent individuals appear to take longer to get to sleep, but are more efficient
in their sleep (Gardner et al., 2010). Similarly, Kamstra et al, (2000) find an influence of
sleep on financial market performance. However, income differences in sleep problems no
longer appear significant when health and other characteristics are adjusted. Szalatonai
(2006) examines the effect of income on sleep in South Africa and Brochu et al. (2012) use
data from Canada to estimate the impact of changes in wages on sleep time. Using time use
data, Bonke (2012) attempts to identify circadian rhythms to examine it impact on
productivity. Two other papers using American Time Use survey data find an effect of sleep
7
on wages and employment. Antillon et al (2014) examine the effect of unemployment on
sleep, and find evidence of sleep to be countercyclical. However, unlike Antillon et al (2014),
Ásgeirsdóttir and Ólafsson (2015) find a relationship between sleep duration and
employment. Gibson and Shrader (2015) estimate the short-term effect of a reduction of one-
hour sleep on wages to be 1.5 percent and the long-term effect to be 5 percent. Ásgeirsdóttir
and Ólafsson (2015) find an inverse relationship between wages and sleep, where a 1 percent
increase in wages is associated with a 9 second reduction in sleep duration. Nevertheless, this
literature does not develop the link between child sleep quality and parental sleep quality.
Our paper is also related to the literature on the relationship between socio-economic
characteristics and household derived sleep deprivation. Arber et al. (2009) find that women
report more sleeping problems compared to men. Children from lower socio-economic
groups also tend to have less efficient sleep than wealthier children, which can partially
explain the gap in academic performance. Moore et al. (2012) find that sleep quality can
mediate in the association of socio-economic status and both physical and mental health.
Partnered individuals exhibit better sleep quality (Gardner et al., 2010) and the social
situation at work is strongly linked to disturbed sleep and impaired awakening (Mezick et al.,
2008).
Finally, our work is most closely related to previous attempts to capture the causal
link between sleep quality and economic performance. Only one paper deals with the
endogeneity of sleep quality by using instrumental variables approach as we do here. Gibson
and Shrader (2015) instrument for sleep quality by using the short and long-term sunset time.
The problem with this study is that they rely on location-level variations. Their estimates,
therefore, should not be interpreted as individual effects. They potentially include spillovers
across people who live in the same location. The advantage of our approach is that we exploit
individual variations in sleep quality, due to changes in child sleep duration and the number
of times a child wakes up at night. Unlike previous sleep studies, we rely on micro-
longitudinal data, and we do not employ cross-sectional time-use surveys. The existing
literature has focused on between-person findings. However, between-person findings do not
provide any information on whether individuals’ economic performance fluctuates as a
function of variation in sleep quality. By way of contrast, micro-longitudinal data can capture
the effects of exogenous variations in sleep quality and economic performance.
The rest of this paper has the following structure. The next section presents the data.
Section III reports OLS regressions of parental economic performance on our measures of
parental sleep quality. Section IV describes our key instrument for parental sleep quality, the
8
child sleep quality and presents our main results. Section V investigates the robustness checks
of our results, and Section VI concludes.
II. The ALSPAC Data
We use a unique dataset, the ALSPAC data, which has followed more than 14,000
families from child birth to age 25. This is a near-census English cohort study, which was
primarily designed to investigate environment, genetic, and socio-economic influences on
health and development over the life course.1 The study recruited 14,541 pregnant women
residing in the Avon area of the UK with expected delivery dates between April 1, 1991 and
December 31, 1992.2 This corresponds to roughly 70% of the eligible pregnancies in the area.
The sample is broadly representative of the national population of mothers with children less
than 12 months old, although higher socio-economic status groups as well as people of white
ethnicity are over-represented compared to the national population (Boyd et al, 2012). The
study includes rich information on the parents’ characteristics and family background as well
as indicators of child wellbeing and cognitive skills. In particular, the dataset provides precise
information on parental and child sleep quality over time. In addition, it contains various
variables on employment, working-time decisions, income and job satisfaction, for our
purposes.
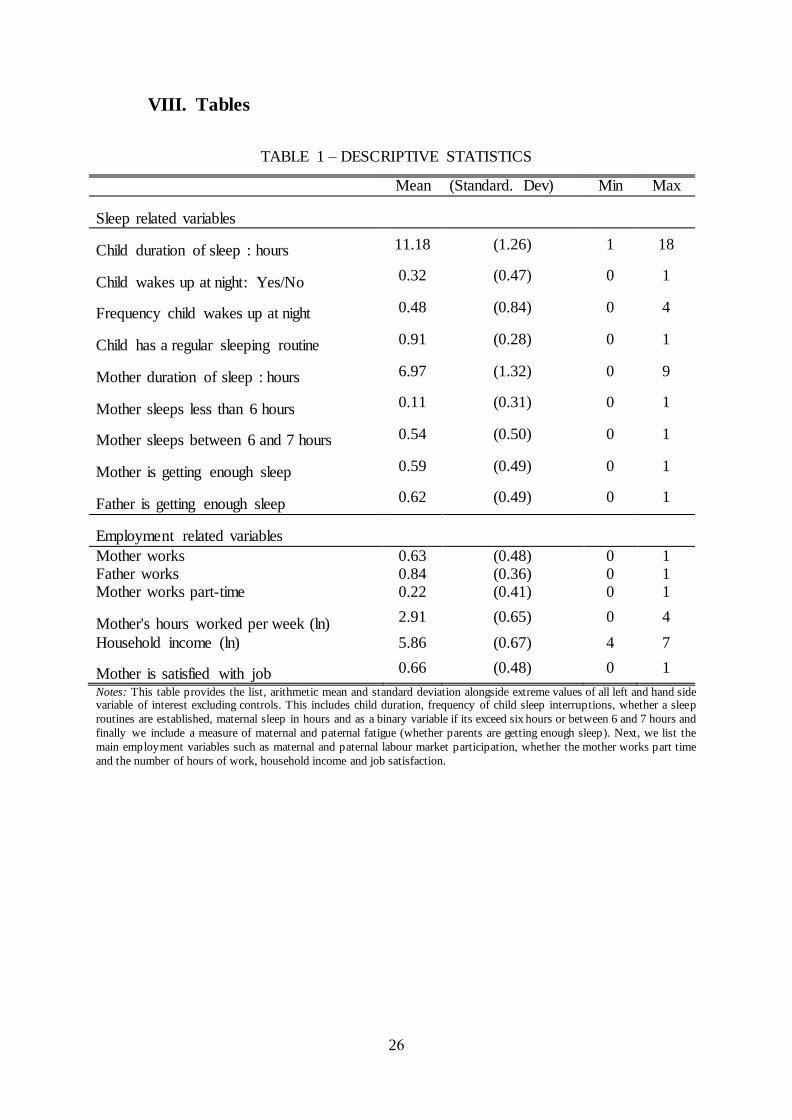
Table 1 provides the descriptive statistics for the key variables of interest distinguishing
employment related and sleep related variables. The sample is restricted to families with
children under the age of 12 (for which we have information on child sleep quality). This
gives us a sample size of 10,000 families. After age 12, the survey questions on child sleep
quality are no longer available. There are large variations in child average duration of sleep
and the probability that the child wakes up at night in our sample. The standard deviation is
1.26 for a child's average duration of sleep and 0.5 for the probability that the child wakes up
1Please note that the study website contains details for all the data that is available through a full searchable data
dictionary: http://www.bris.ac.uk/alspac/reseachers/data-access/data-dictionary/ 2 14,541 is the initial number of pregnancies for which the mother enrolled in the ALSPAC study and had either
returned at least one questionnaire or attended a “Children in Focus” clinic by 19/07/99. Of these initial
pregnancies, there was a total of 14,676 fetuses, resulting in 14,062 live births and 13,988 children who were
alive at 1 year of age.
9
at night. In rows 3 and 4, we also document the number of times a child wakes up at night
and whether the child has a regular sleeping routine as alternative measures of child sleep
quality. One might prefer these measures since they explicitly refer to sleep disruption. On
the other hand, they may be noisier measures of child sleep quality than the probability that
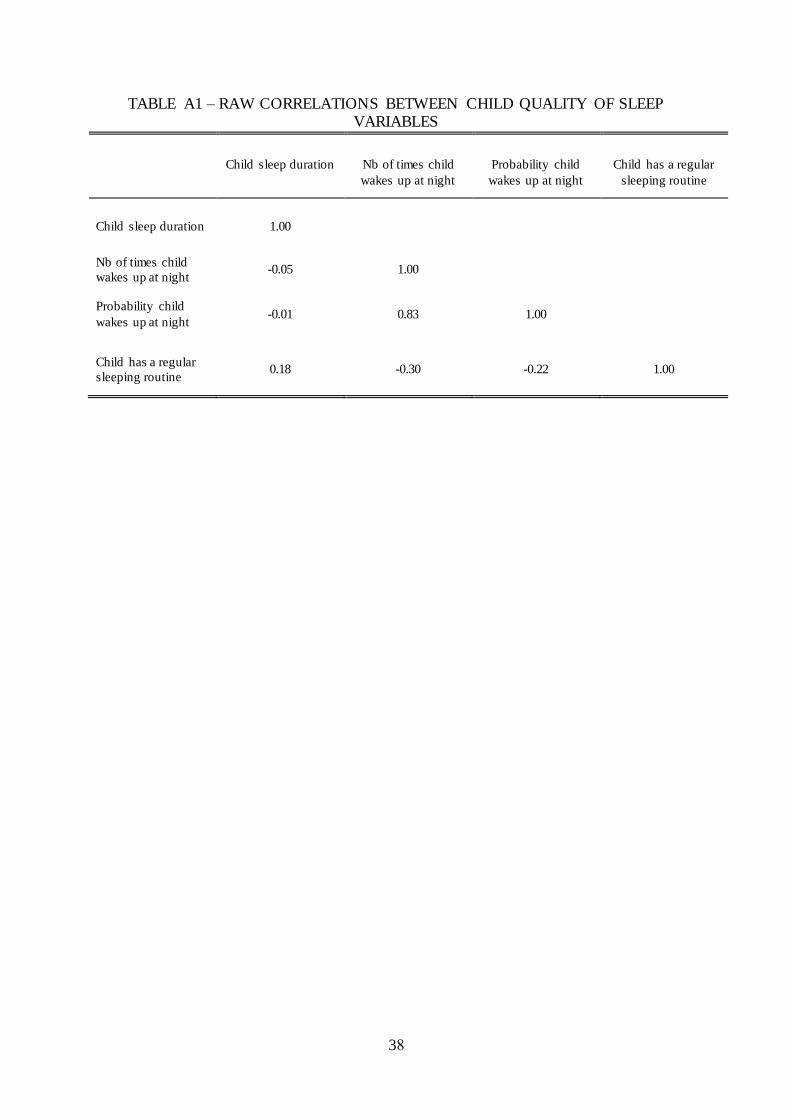
the child wakes up at night. Table A1 in the Appendix also examines the correlation between
the different measures of child sleep quality used in this paper. Overall we find consistent
correlations whereby waking up reduce sleep duration and having a sleep routine increases it.
We use several variables to capture parental sleep quality. Our main variable, reported
in the fifth row, is an average of mother's sleep duration. On average, mothers sleep about 7
hours per night. We use the average value for our main specifications. However, one might
also want to consider different categories: whether the mother sleeps less than 6 hours,
between 6 and 7 hours or more than 7 hours per night. These categories are appropriate for
our purposes since the focus here is on differences in economic performance originating from
sleep deprivation. We want to know if the mother has enough sleep in order to be productive
and not only how many hours the mother sleeps. The next row gives an alternative relevant
measure, which is whether the mother/father feels she has enough sleep (from 0 to 1). We
expect our notion of getting enough sleep to correspond to the number of hours slept, but the
threshold may differ across individuals. Therefore, it is interesting to consider both self-
reported and objective measures of sleep quality.
The next six rows report measures of parents’ employment outcomes, which we use
for measuring economic performance. The first is a measure of employment status (whether
the mother/father works) and the second is a measure of part-time versus full-time jobs. In
our sample, 63 percent of the mother’s work and 83 percent of the father’s work. 22 percent
of the mother’s work part-time. Interestingly, this information is also available at 8 weeks of
pregnancy. This allows us to control for any endogeneity issue related to the probability to
work, which is partly related to other factors than child sleep patterns. In addition, we are
comparing individuals for whom having children is a choice. Hence, we expect individuals in
our sample to be more comparable to the extent that they are all parents. In the following
rows, we give the mean and the standard deviation of the number of hours worked as an
alternative measure of work productivity. The second-to-last row gives information on the
logarithm of household income. The final row gives a measure of job satisfaction, reported on
a 0-1 scale, which is our measure of wellbeing at work. In our sample, 66 percent of the
mother’s report being satisfied at work.
10
III. Maternal Sleep and Economic Performance: Reduced Form
The first empirical exercise we perform attempts to investigate the reduced form
effects of parental sleep on a number of employment outcomes including labour market
participation, working-time decisions, income and job satisfaction drawing on ordinary least
squares. The empirical specification we estimate in the first instance is represented in the
following equation:
(1) Yit = α + β PSit + Xit γ + μi + εi
where Yit is employment status, or the number of hours worked, household income, and job
satisfaction of parent of child i, PSit is the parent quality of sleep, Xit is a vector of other
covariates, and μi is a family/child fixed-effect.3 The coefficient of interest throughout the
paper is β, the effect of parental sleep quality on economic performance.
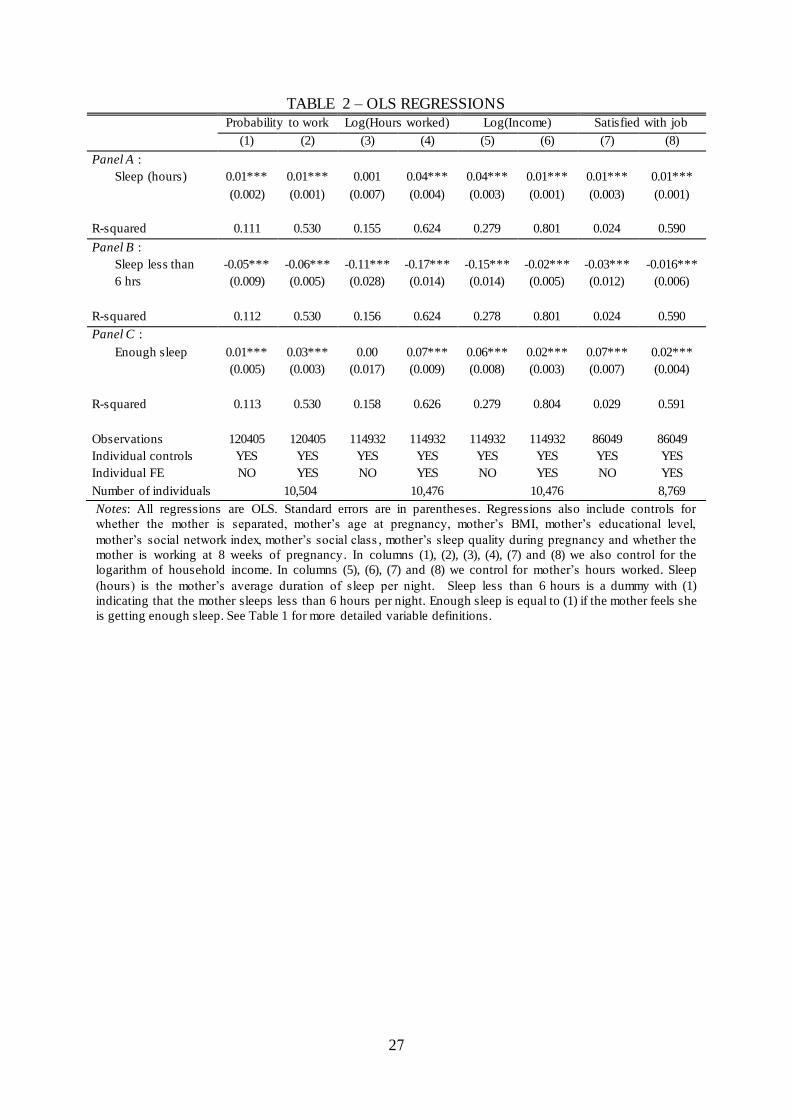
Table 2 reports the results of equation (1) with and without family fixed-effect for the
three different measures of sleep quality (displayed in three different panels). Column (1)
shows that in our sample, there is a robust and significant relationship between our different
measures of mother sleep quality and the mother’s employment probability, which suggests
that maternal sleep (sleep deprivation) increases (decreases) labour market participation.
Measures of sleep deprivation is found to be more sensitive to the inclusion of individual
fixed effects. Indeed, column (2) reports that the effect of maternal sleep (sleep deprivation)
on employment is slightly increased once we control for family fixed-effects. To get a sense
of the magnitude of the effect of sleep quality on the probability to work, the estimate in
column (1), Panel A, 0.01, indicates that a one-hour increase in mother sleep duration
increases employment by 1 percentage point. We also find that in column (1), Panel B,
sleeping less than 6 hours per night decreases the probability to work by a little more than 5
percentage points. Part-time work is more prevalent among women with children and many
women working part-time choose part time work because it provides them the flexibility to
manage their work and their family life. Working mothers, in particular, give up leisure and
3 Note that we cannot include sibling fixed effects as only one child per family is observed in the ALSPAC data.
11
sleep, compared to mothers not in the labour force, to meet the demands of childcare and
jobs.
To test the effect of mother’s sleep quality on the number of hours worked, we run
similar regressions for equation (1) with the logarithm of hours worked as dependent
variable. Although the coefficient on mother's average sleep duration is not significant
(column 3), which is consistent with the idea of a counterbalancing effect (working mothers
give up sleep to manage their work and their family life), when family fixed-effects are
included, the coefficient is now positive and significant, indicating that an expansion of
maternal sleep quality increases her number of hours worked.
We then repeat our same basic regressions using the log of household income as the
dependent variable. The coefficients on mother’s sleep quality are statistically significant.
The estimate in column (5), 0.04, indicates that a one-hour increase in mother’s sleep
duration increases household income by 4 percent (1 percent in time series). This is
consistent and in line with estimates from previous studies (Gibson and Shrader, 2015).
Finally, in columns (7) and (8), we look at the effect of mother’s sleep quality on mother’s
satisfaction with job (which we expect to pick up potential work-life balance effects of sleep
deprivation that are not necessarily reflected in participation, hours worked and income
effects). Again, the effects are statistically significant. The estimate in column (7), 0.01,
indicates that a one-hour increase in mother’s sleep duration increases her job satisfaction by
1 percent.
Overall, the results in Table 2 are consistent with the existence of a relationship
between mother’s quality of sleep and mother’s employment outcomes including
employment, working-time decisions, income and job satisfaction. However, there are a
number of reasons for not interpreting this relationship as causal. First, working mothers
sleep less than non-working mothers which could raise a reverse causality question. Such
reverse causality problem would create attenuation bias, and hence bias the OLS estimates
downwards. Arguably, there are a number of other potentially omitted determinants of
employment and working-time decisions (e.g., time efficiency, ability among others) that
could correlate with sleep patterns. In addition, given that the measures of mother’s sleep
quality are reported by the mother herself, she might have a natural bias in reporting that she
has enough sleep when she is satisfied with her job. That matter in practice can introduce a
positive bias in the OLS estimates. We argue that such biases could be corrected if we have
an instrument for mother’s sleep quality. Such an instrument should be theoretically and
empirically valid, and hence we should be able to observe it as a major determinant of
12
mother’s sleep quality. At the same time, it should not have a direct effect on mother’s
employment, working-time decisions, income and job satisfaction, except through maternal
sleep. We argue that variation in child sleep quality during the first 12 years of life is a
plausible instrument.
IV. Child Sleep Quality
A. Descriptive Statistics
In this subsection, we briefly describe the measures and estimates of both quantity and
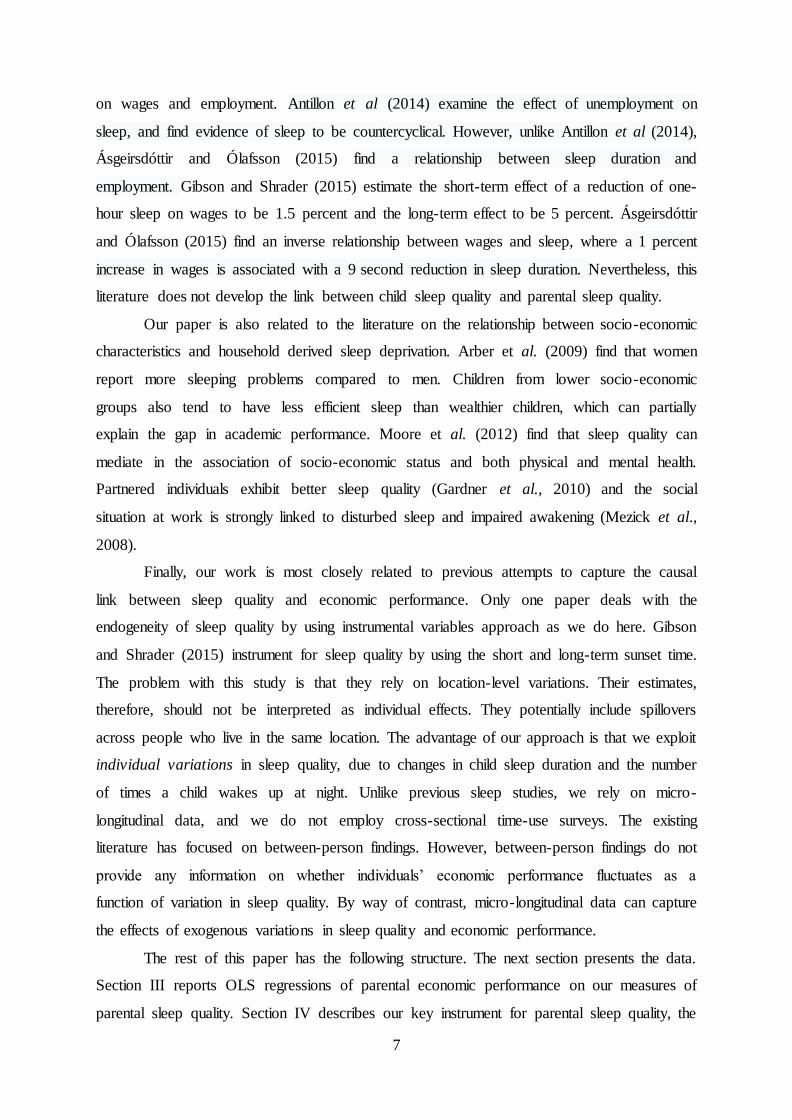
quality of child sleep in our sample. The standard measure we rely on refers to the average
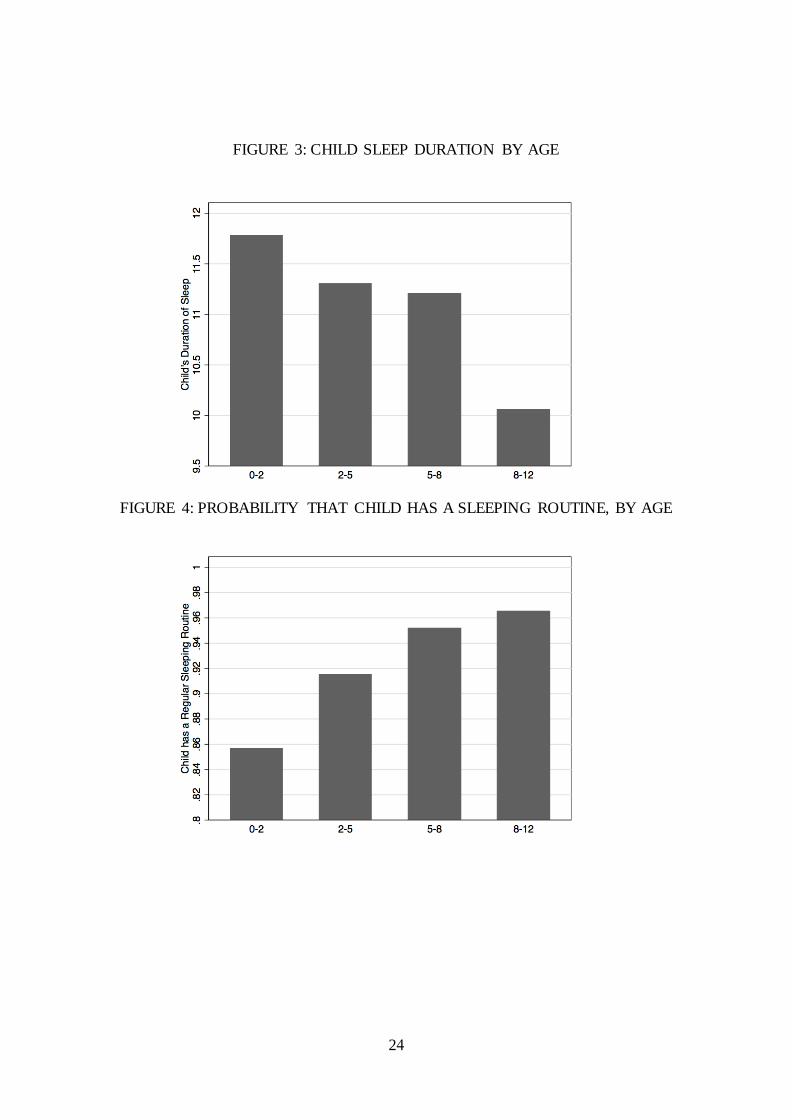
duration of child sleep. Figure 3 shows that on average, children between 0 and 24 months
sleep on average a little more than 11 hours. This figure decreases over time and by age 8,
children sleep about 10 hours every 24 hours.
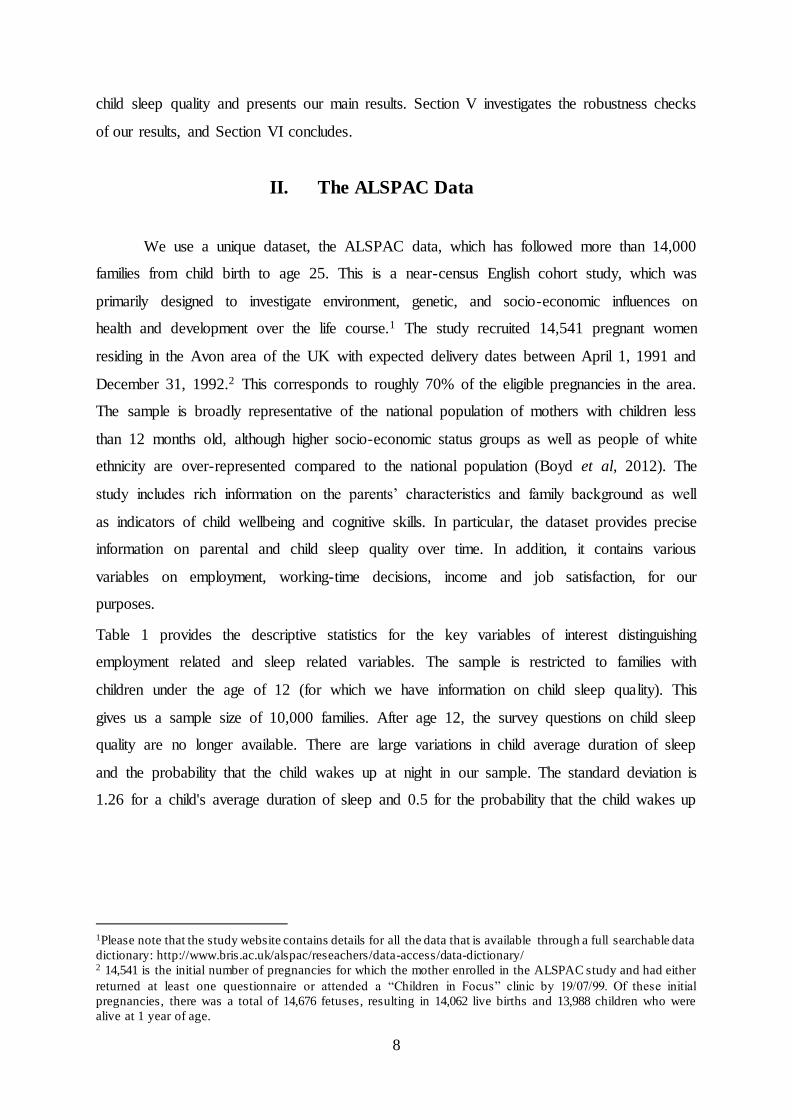
As expected, we also find in Figure 4 that over time children are more likely to adjust
to a sleeping routine and by age 8, 96% of children already have a sleeping routine. However,
sleep routine does not always imply no maternal sleep disruption. To examine this, our data
contains information on the probability that a child wakes up at night and the number of times
the child wakes up at night. Arguably, this is a better estimate of sleep disruption, because
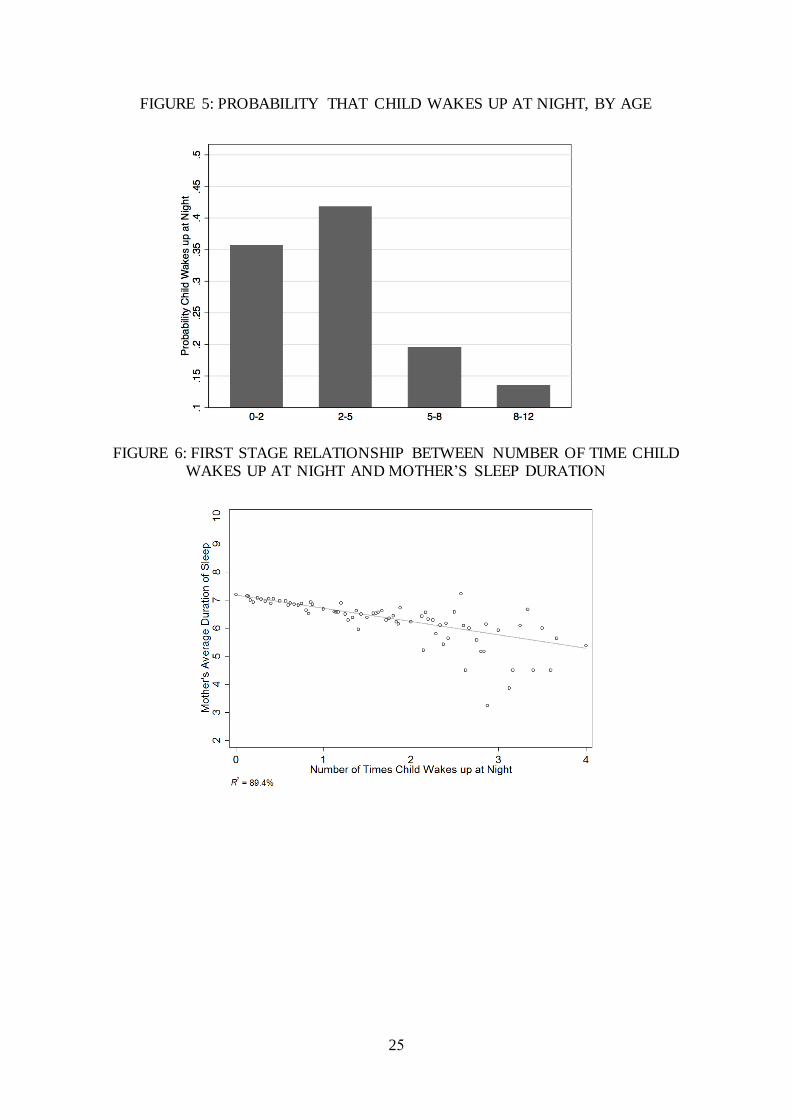
parents have to wake up and take care of the child during these awakening episodes. Indeed,
Figure 5 reports the probability of wake-up times at night by child age. We find a spike in
sleep deprivation between 2-5 years of age which is in line with findings of a recent review of
observational studies (Galland et al, 2012).
Variations in sleep quality are found to be highly uncertain and determined by the so-
called “luck of the genetic draw”. A review of previous literature on sleep quality in adults
(using twin studies) reveals a moderate contribution of genes (approximately 30%) for sleep
duration and little effect of shared environmental factors (Tafti et al., 2005). In children, there
13
have been very few studies of sleep and results appear relatively inconsistent. Some studies
find that heritability explains the greater proportion of the variance in day/night sleep ratio at
6 months (e.g. Touchette et al., 2013), while other studies show a strong contribution of
shared environmental factors for both night time sleep duration and daytime sleep with a
moderate contribution of genes (Dionne et al., 2011). Finally, other twin studies conclude
that the genetic contributions to sleep patterns and sleep disruption of pre-adolescents and
adolescents are close to those found in adults (Gehrman et al., 2011; Moore et al., 2011).
Overall substantial individual variation remains at all ages (Inglowstein et al, 2003;
Acebo et al., 2005) and most of the variations are unexplained. These considerations,
together with the data we have on sleep quality, lead us to believe that child sleep patterns are
a plausible instrument for parental sleep: child sleep patterns affect parental sleep duration,
but are orthogonal to parents’ economic performance.
B. Sleep Quality and Economic Performance: Instrumental Regressions
Determinants of Parental Sleep Quality
Equation (1) documents the relationship between parental sleep quality and economic
outcomes. However, as mentioned before, there are reasons to believe that the association is
not causal, which would result in estimates being biased. Hence, we define an instrumental
variable strategy to address the problem, which exploits child duration of sleep and the
number of times the child wakes up at night as instruments for maternal quality of sleep.
Child sleep is found in several studies to be associated with maternal sleep. Specifically night
time awakenings can be detrimental. They diminish both sleep duration and cause
fragmentation, which impacts on mood and attention (Kahn et al, 2014). Specifically, we
estimate the effect of child sleep on maternal sleep as follows:
(2) PSit = δ + μ CSit + Zit λ + ρi + ui
where PSit is the measure of parental sleep quality of child i. CS it is our measure of
child sleep quality. Zit is a vector of covariates that affect all variables and ρi are family fixed-
effects. The identification strategy is to use CSit (i.e. child sleep duration and the number of
times the child wakes up at night) as instruments for PSit. The exclusion restriction of this
instrumental approach is that CSit is uncorrelated with εi – that is, child sleep quality has no
14
effect on parental employment and working-time decisions other than through its impact on
parents’ sleep quality. We argued above that this exclusion restriction is reasonable.
Figure 6 describes the relationship between child sleep quality and parents’ sleep
quality. We use the number of times a child wakes up at night and mother’s average duration
of sleep as instruments. Consistent with our hypothesis, there is a strong relationship between
the number of times a child wakes up at night and the mother’s average duration of sleep.
This indicates that mothers who have a child with good sleeping routines and who seldom
wakes up at night, sleep longer on average than mothers who have a child with sleeping
problems. We find that the association is more heterogeneous after the first wake up given
that the reason and duration of each night time wake-up becomes more varied after the first
awakening (e.g., sickness, nightmares, sleep problems, toileting, etc).
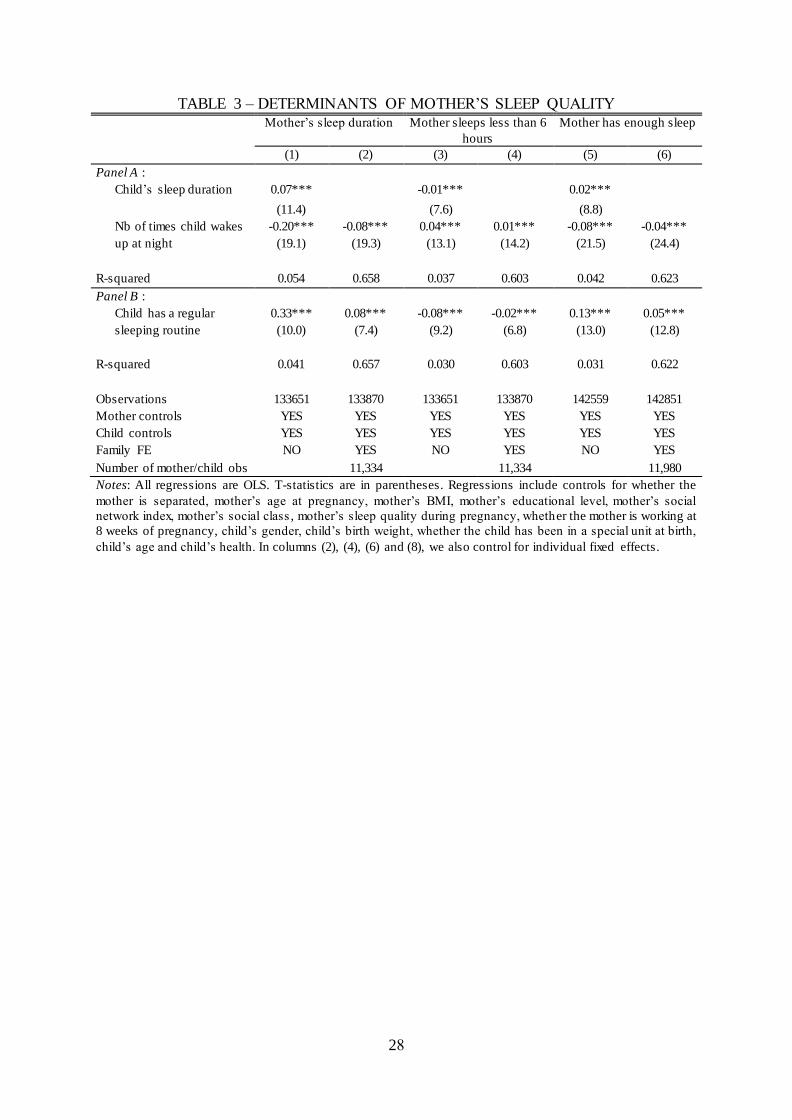
In Table 3, we report the estimates of the relationship between child and maternal
sleep and examine whether the association works through the channels considered. More
specifically, we report OLS regressions of equations (2). These specifications will be the first
stages for our main two-stage least squares estimates (2SLS). Columns (1) and (3) use
mother’s hours slept as the dependent variable and show that there is a strong correlation
between a child's duration of sleep and the mother’s average duration of sleep. For example, a
one-hour increase in the child's duration of sleep increases the mother’s hours slept by 0.07
(12 minutes). A one-unit increase in the number of times a child wakes up at night decreases
the mother’s hours slept by 0.20 (30 minutes) and increases the probability of sleeping less
than 6 hours per night by 4 percentage points. Columns (2) and (4) add the family fixed
effects, which reduce the estimates by 2.5. The magnitude of the estimates indicates that a
one-unit increase in the number of times a child wakes up at night decreases the mother’s
hours slept by 0.08 (13 minutes) and increases the probability of sleeping less than 6 hours
per night by 1 percentage point. Both average mother’s duration of sleep and dummies for
mother’s duration of sleep, are quantitative measures of sleep quality, and do not provide
information about whether the mother feels restful. In columns (5) and (6), we propose an
alternative approach and use a qualitative measure of mother’s sleep – that is, whether the
15
mother feels she is getting enough sleep. This has little effect on the estimates and indicates
that when a child sleeps longer, the mother is more likely to feel that she is getting enough
sleep. Similarly, when a child wakes up at night, the mother is more likely to feel that she is
not getting enough sleep.
Parental Sleep Quality and Economic Outcomes; IV regressions
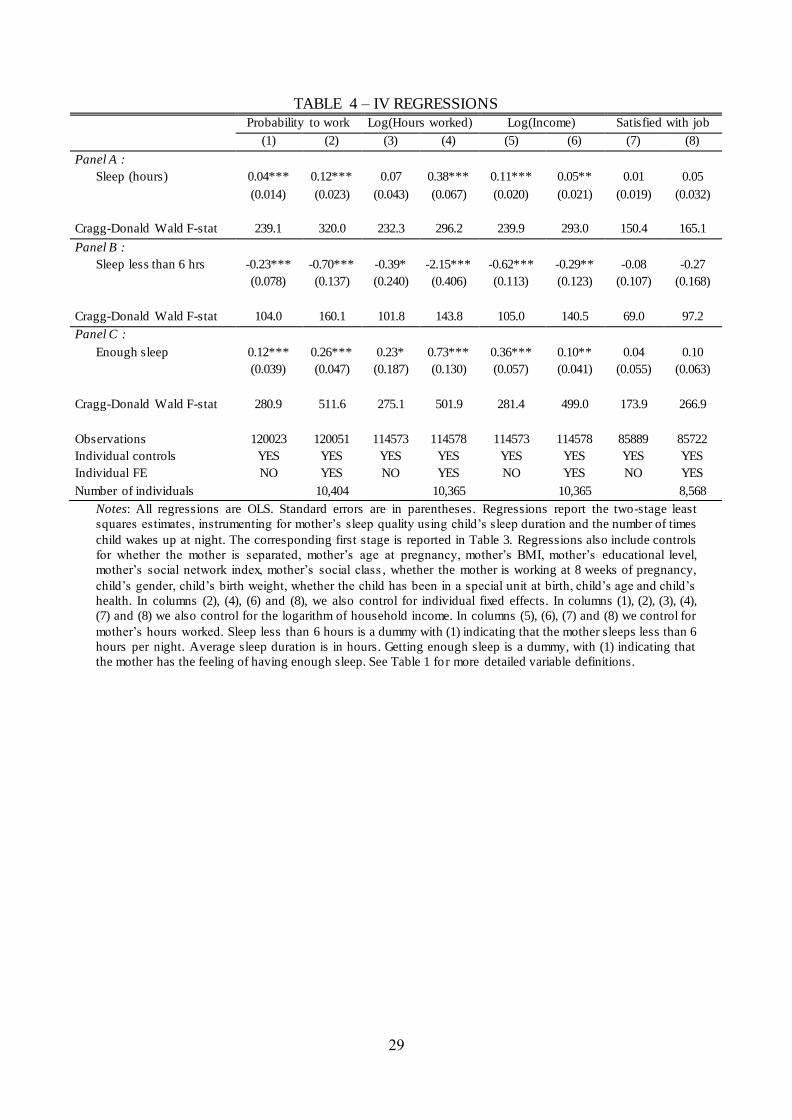
Equations (1) and (2) are estimated jointly as 2SLS model in Table 4. Parental sleep
quality is treated as endogenous and modelled as in equation (2). The exclusion restriction is
that there is no correlation between the instrument and the error term in equation (1).
Panel A of Table 4 reports 2SLS estimates of the coefficient of interest, β from
equation (1), in which mother’s average sleep duration is treated as endogenous and Panel B
and C give the corresponding equations in which the probability that the mother sleeps less
than 6 hours, and whether the mother is getting enough sleep are treated as endogenous. F-
tests (Cragg-Donald Statistics) reject the hypothesis of weak instruments for all regressions.
The corresponding 2SLS estimates indicate that one extra hour of sleep increases
employment by 4 percentage points (12 percentage points with family fixed effect), the
number of hours worked by 7 percent (38 percent with family fixed effects), and increases
household income by 11 percent (5 percent with family fixed effects). We find no effect on
job satisfaction unlike in the OLS estimates.
Similarly, sleeping less than six hours produces consistent estimates.4 Finally, our
qualitative measure of sleep satisfaction, consistently with prior results, increases labour
market participation by 26 percentage points, the number of hours of work by 23 percent, and
income by 10 percent but consistently does not affect job satisfaction. These estimates are
larger than the OLS estimates reported in Table 2. Hence the OLS estimates were downward
biased. This suggests that reverse causality that creates attenuation bias is likely to be very
important in all these relationships.
4Note the existence of non-linearity effects. The effects of sleep quality are larger at the lowest level of hours
slept.
16
Does the 2SLS estimate make quantitative sense? Does it imply that parental sleep
quality variations can explain a significant fraction of economic performance changes over
time? Let’s consider two mothers, one who sleeps 6 hours per night and another who sleeps 7
hours per night. Our 2SLS estimate, 0.04, implies that the one hour difference in sleep
duration between these two mothers should translate into a 4 percentage point difference in
the probability to work. Similarly, it should translate into a 7 percent difference in the number
of hours worked, an 11 percent difference in household income and 1 percentage point
difference in job satisfaction. In practice, the presence of measurement error complicates this
interpretation. Therefore, the estimates are upper bounds. In any case, the estimates imply a
not implausibility large effect of sleep deprivation on economic performance. In the rest of
the paper, we investigate the robustness of these results.
V. Robustness Checks
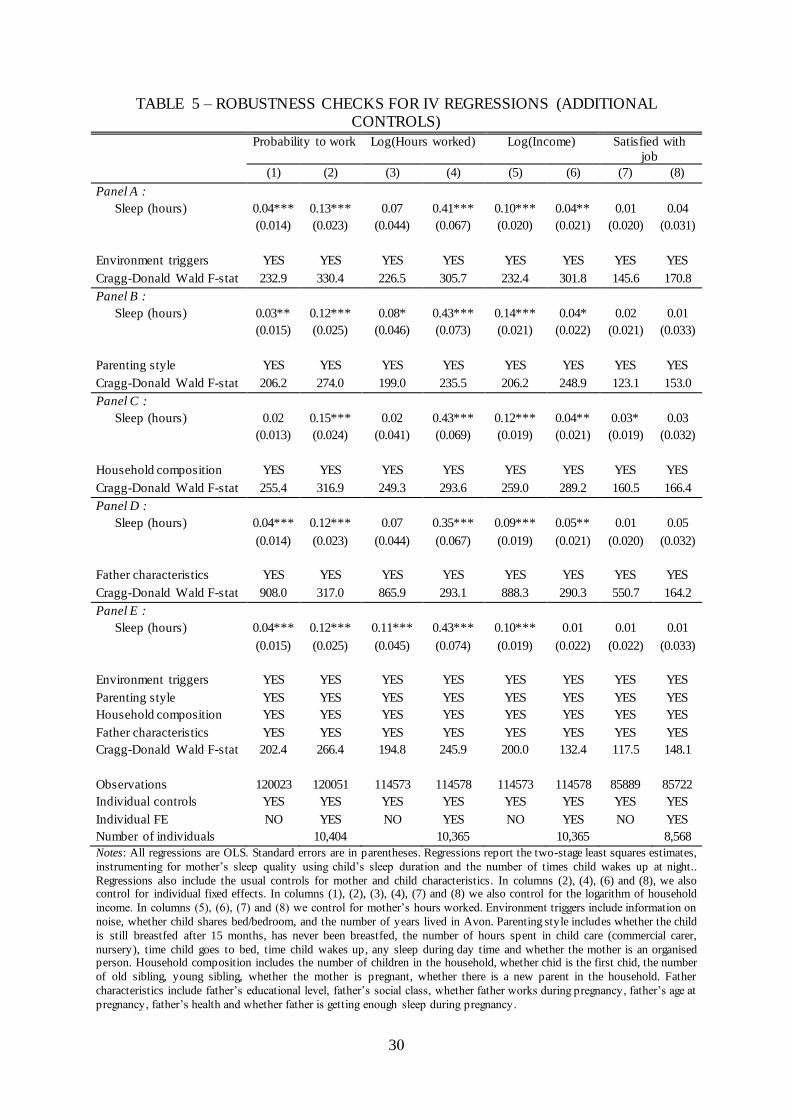
Additional controls
Given that the identification of the causal effect of sleep quality on employment
outcomes can be blurred by a number of other effects we consider the inclusion of
determinants which we classify as environmental factors influencing child sleep, parenting
style, household composition and father's characteristics. Overall, we find that our results
change remarkably little with the inclusion of these variables.
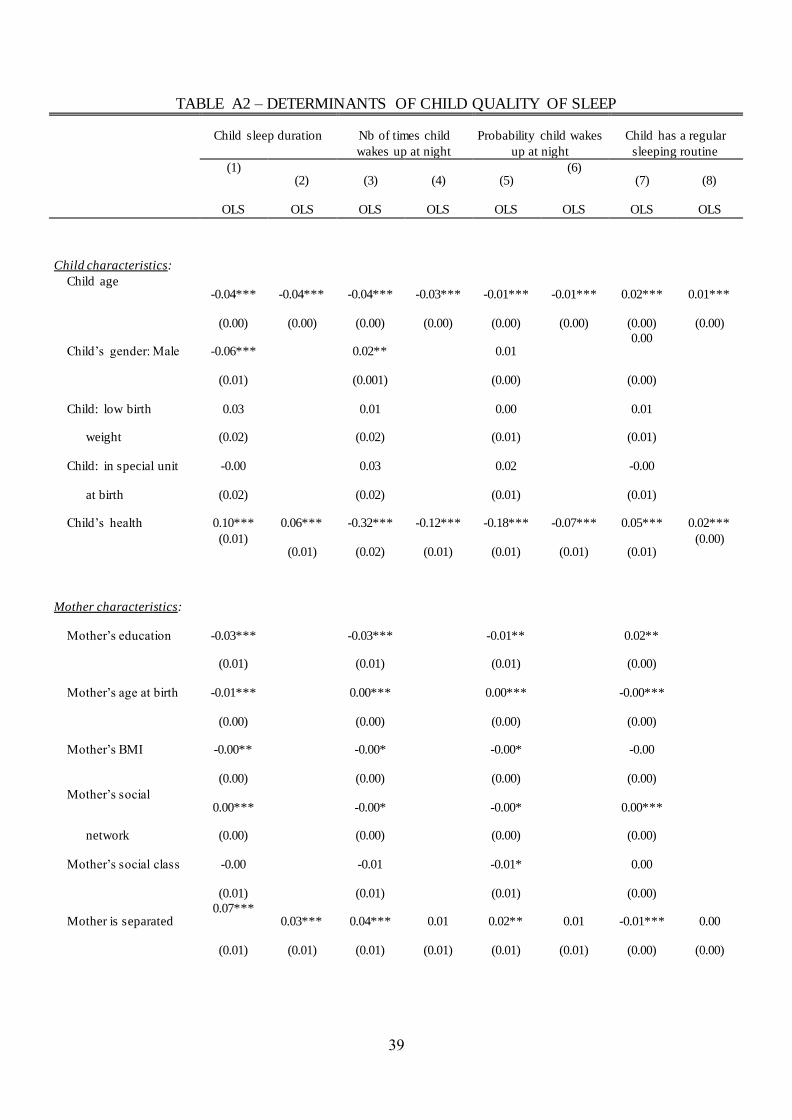
Table A2 in the Appendix investigates the effects of different covariates potentially
influencing the child's quality of sleep. Consistent with the literature, sleep duration declines
with age (Mindell et al, 2015), and boys sleep less and wake up more frequently. As
expected, sickness is a major determinant of child sleep patterns. Some maternal
characteristics are important: children of younger and low-skilled mothers sleep less, while
children with mothers who slept fine during the pregnancy, sleep more. We already account
for this in the main specification.
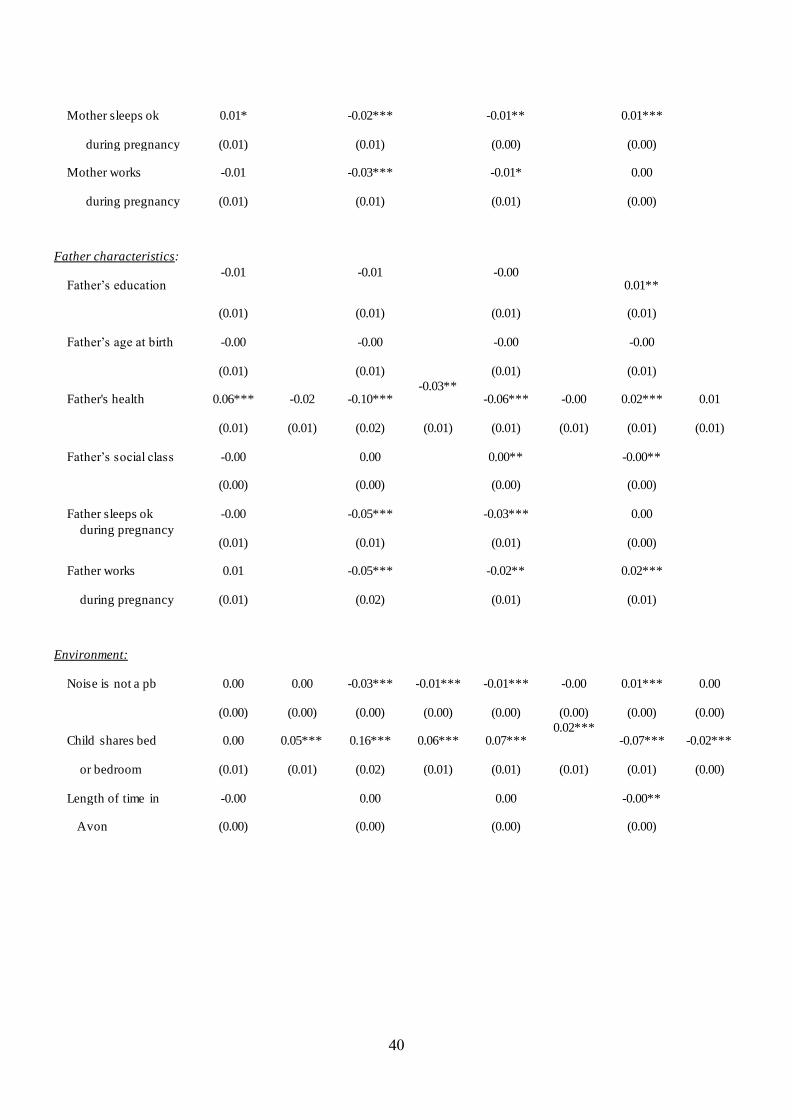
In addition, noise in the house and sharing a room increase the number and the
probability of waking up as well as decrease the probability of sleeping routine. The quality
of the sleep environment also matters because it is directly correlated with parental sleep
quality. In Panel A of Table 5, we add three variables to control for this: (i) whether noise is a
problem, (ii) where the child shares a bed/bedroom, and (iii) the number of years lived in
17
Avon. This has little effect on our 2SLS estimates. For example, the estimate of the effect of
sleep duration on employment is 0.04 (s.e. = 0.014) without controlling for environmental
triggers and again 0.04 (s.e. = 0.014) with environmental triggers. Therefore, it appears that
parental sleep quality is affected by child sleep quality, but the effect is not driven by
environmental factors, such as noise and sleep environment quality.
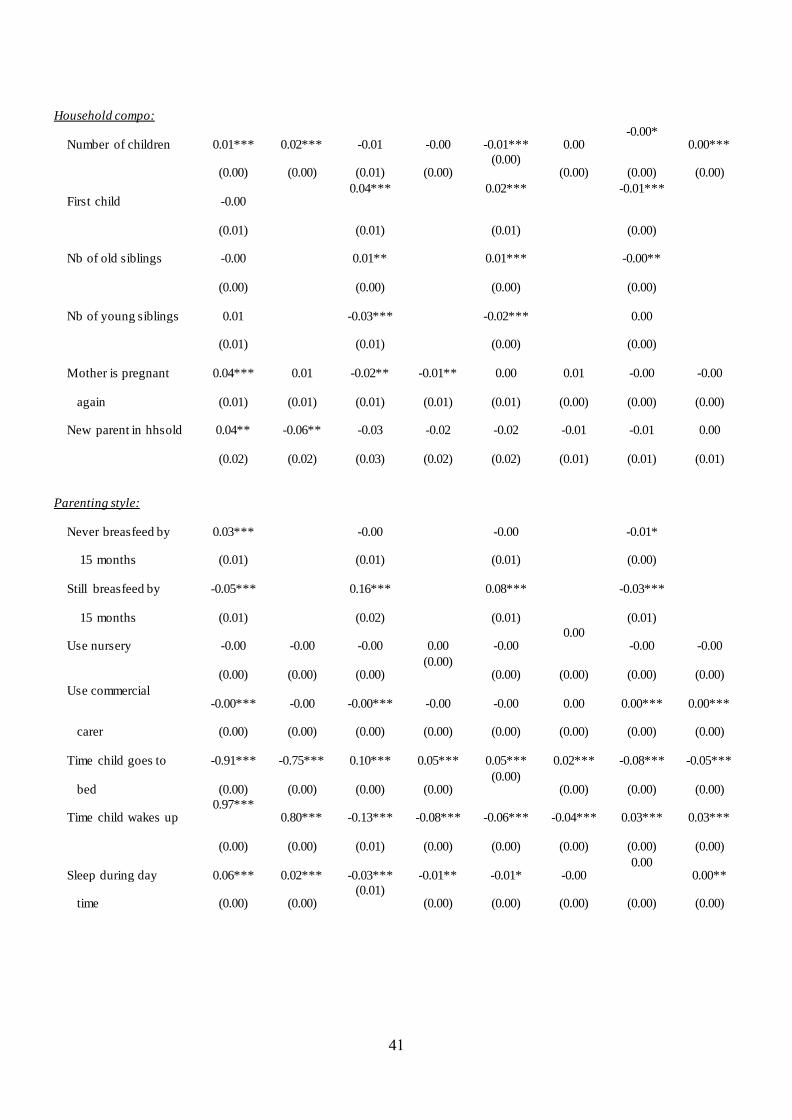
Parenting style is also argued to be important for sleep quality (Mindell et al., 2013).
Table A2 shows for instance that bed time and wake up times as well as day sleep
significantly influence child sleep. In Panel B, we control for the following variables: (i)
whether the child is still breastfed after 15 months, (ii) has never been breastfed, (iii) the
number of hours spent in child care (commercial carer and nursery), (iv) time the child goes
to bed, (v) time the child wakes up, (vi) whether there is any sleep during day time, and (vii)
whether the mother is an organised person. Our estimates of the effect of sleep duration on
economic performance are slightly affected.
Another argument is that the presence of other children can be a key determinant of
child sleep quality, parental sleep quality and parental economic performance. To control for
this, in Panel C, we add (i) the number of children in the household, (ii) whether the child is
the first child, (iii) the number of older siblings, (iv) the number of younger siblings, (v)
whether the mother is pregnant, (vi) whether there is a new parent in the household. Again,
these controls have very little effect on our main estimates.
Finally, in Panel D, we investigate whether our instrument could be capturing any
effect related to father's characteristics. One might argue that child sleep quality would affect
mother's sleep quality differently according to father's behaviour. Controlling for (i) the
father’s educational level, (ii) social class, (iii) whether the father works during the mother’s
pregnancy, (iv) the father's age at pregnancy, (v) health and (vi) whether the father is getting
enough sleep, barely change our results. The coefficient of employment is again 4 percentage
points. The coefficient of the number of hours worked is now estimated to be somewhat
higher, 11 percent instead of 7 percent in Table 4. Further, the effect on income is 10 percent,
instead of 11 percent.
Overall, the main deviation for our previous 2SLS estimates is that when including
environmental triggers, parenting style, household composition and father's characteristics all
together (Panel E), the effect of sleep on the probability to work and the number of hours
worked is estimated to be slightly higher, while the effect of sleep on income is estimated to
be a bit smaller. (Yet the difference between the two coefficients (for income) is not
statistically different). Nonetheless, it appears that the results are consistent with sleep being
18
a significant determinant of economic performance, with little effect from environmental
triggers, parenting style, household composition and father's characteristics. Irrespective of
the inclusion of such estimates, we also find no significant effect on job satisfaction.
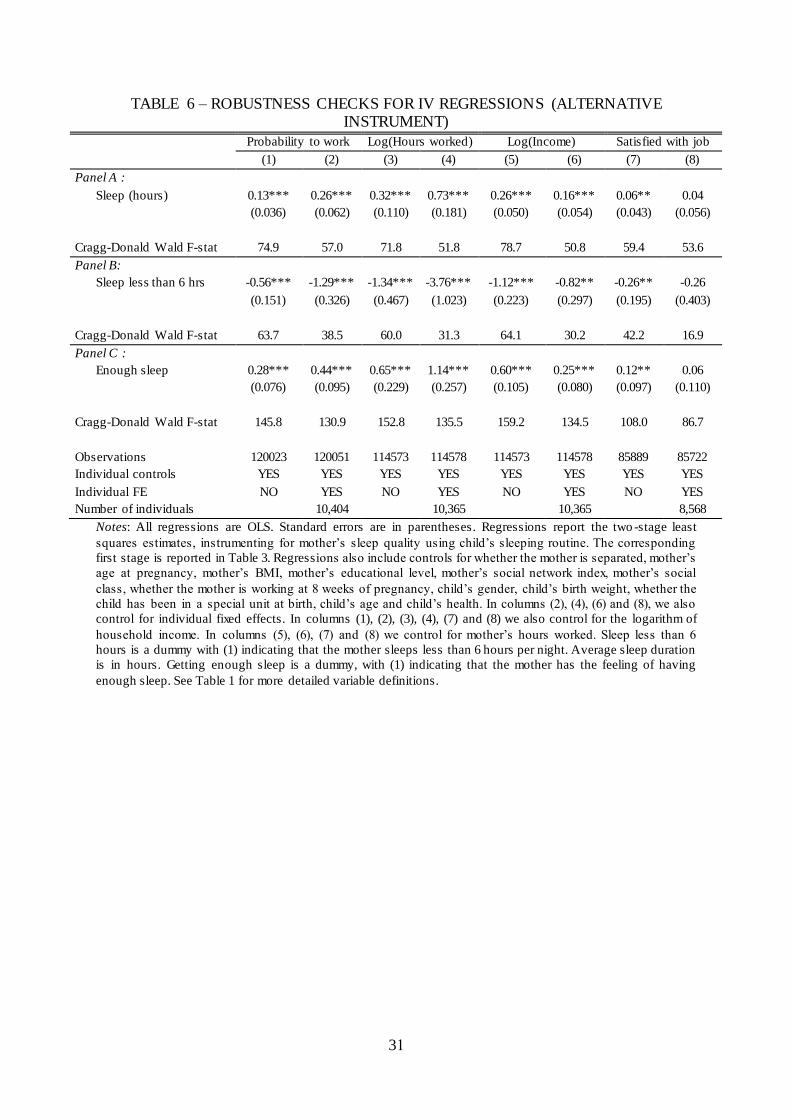
Alternative instrument
Given that previous estimates are highly dependent on how child sleep quality is
measured, namely the child’s sleep duration and the number of times the child wakes up a
night, we can investigate the validity of our approach by using an alternative instrument,
namely whether the child has a sleep routine. This approach is useful since it is a direct test of
whether our previous estimates are affected by measurement errors. Table 6 reports the
results. The first stages reveal strong relationships between child sleeping routine and
mother's sleep quality, although the magnitude of the F-tests are smaller than before. In
addition, compared to Table 4, we find that the 2SLS estimates are consistent, although the
use of this new instrument does lead to larger coefficients than before. This can result from
lower precision of the new instrument: the child's sleeping routine, which is reported by the
mother using a dummy variable. Overall, this gives us additional confidence that child sleep
quality can be used as an instrument to estimate the effect of parental sleep on economic
performance.
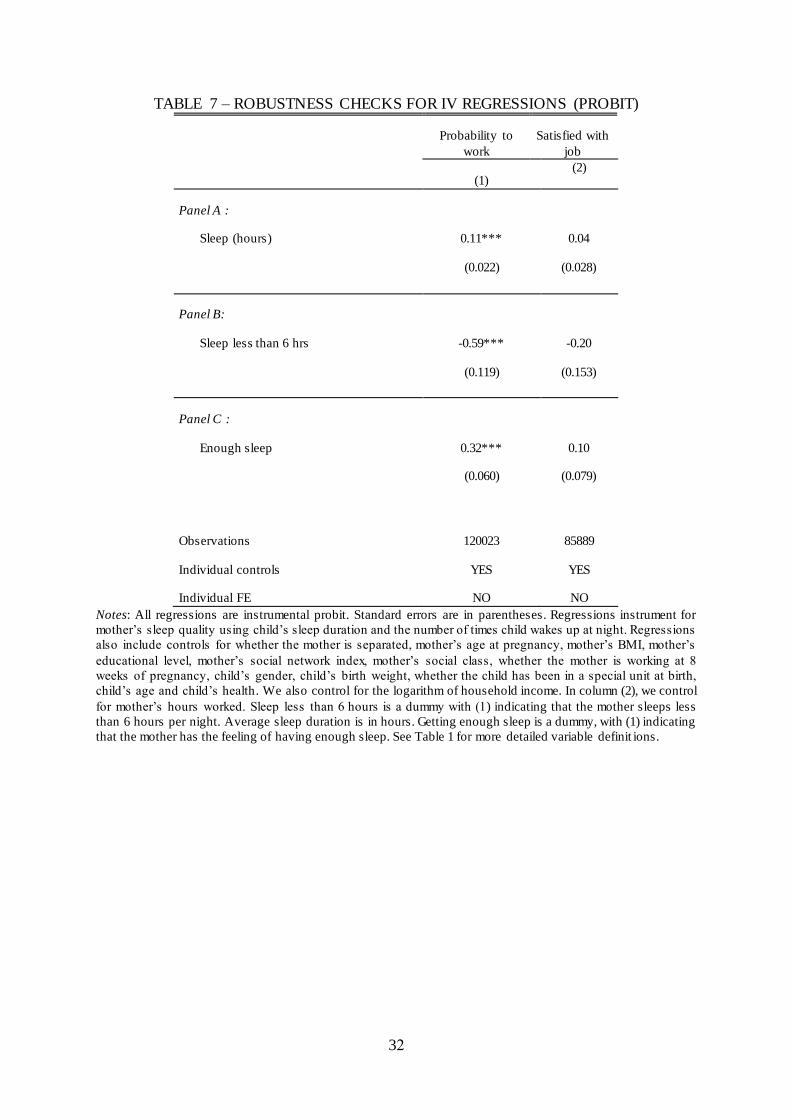
Probit estimates
Another concern with our previous 2SLS estimates is the use of linear probability
models to estimate the effect of sleep on employment for instance. We can investigate the
validity of our approach by using probit instrumental regressions, instead of OLS to capture
the effect of sleep on the probability to work and job satisfaction (0-1). Table 7 indicates that
our previous estimates are robust to the use of probit regressions. The coefficients remain
positive and statistically significant on the probability to work. Further, the effect of sleep on
job satisfaction is again not significant.
19
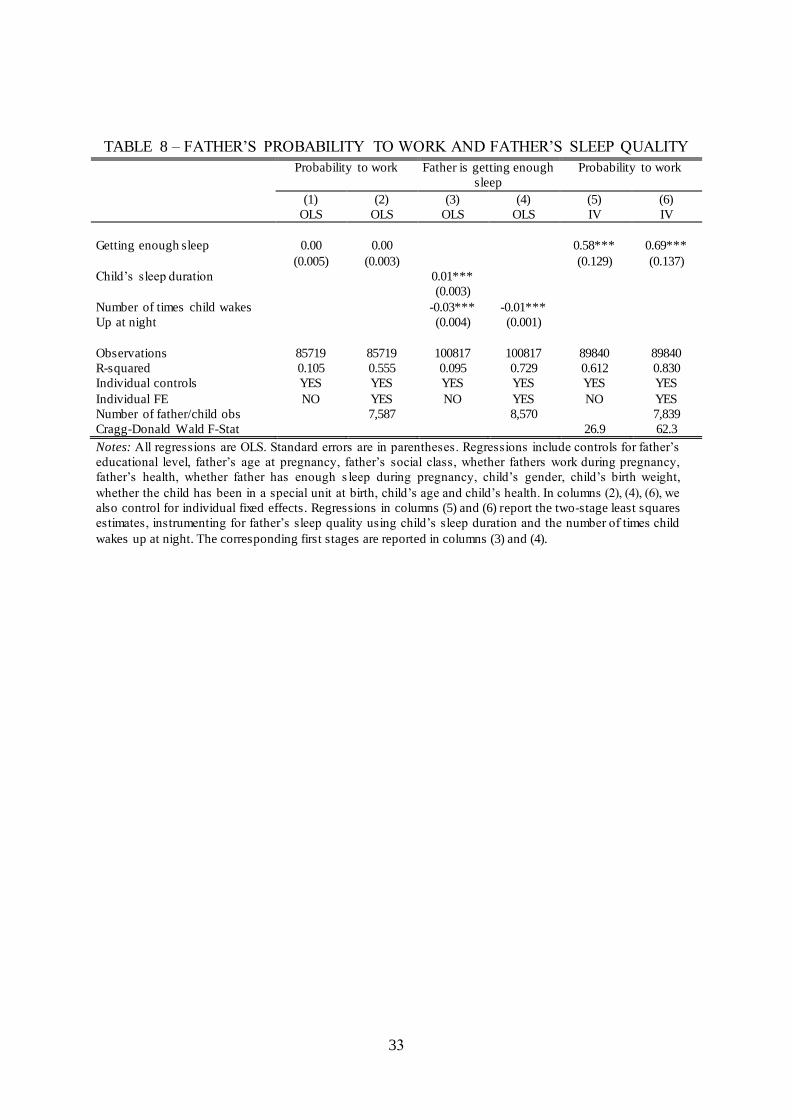
Father's Sleep Quality and Economic Outcomes
So far we have not considered the effect of child sleep quality on father’s sleep and
economic performance. It might be interesting to look at whether there is any heterogeneous
effect of sleep on economic performance considering father's outcomes as well. Table 8
reports both OLS and 2SLS estimates for the effect of father's sleep on the father’s
employment and the related first stages. Information on the father’s hours worked and job
satisfaction are not available in the ALSPAC data.
Importantly, the OLS estimates do not suggest evidence of an effect of father's sleep
quality on employment. As with the mother, we find that child sleep duration (number of
times the child wakes up) increases (reduces) the probability of the father getting enough
sleep. Yet, the effect on paternal sleep is half the effect on maternal sleep, when comparing
with Table 2. This is consistent with idea that fathers are less affected when a child wakes up
at night.
Note, however, that IV estimates do suggest evidence of an effect of father sleep on
the employment, instrumenting father's sleep by child's sleep. Further, the effect sizes appear
to be stronger than those of the mother. Yet such estimates may be biased by measurement
errors where father's quality of sleep is less precisely measured and child sleep quality is less
correlated with father's sleep quality. The magnitude of the F-tests, still significant, are much
smaller.
Heterogeneous Effects
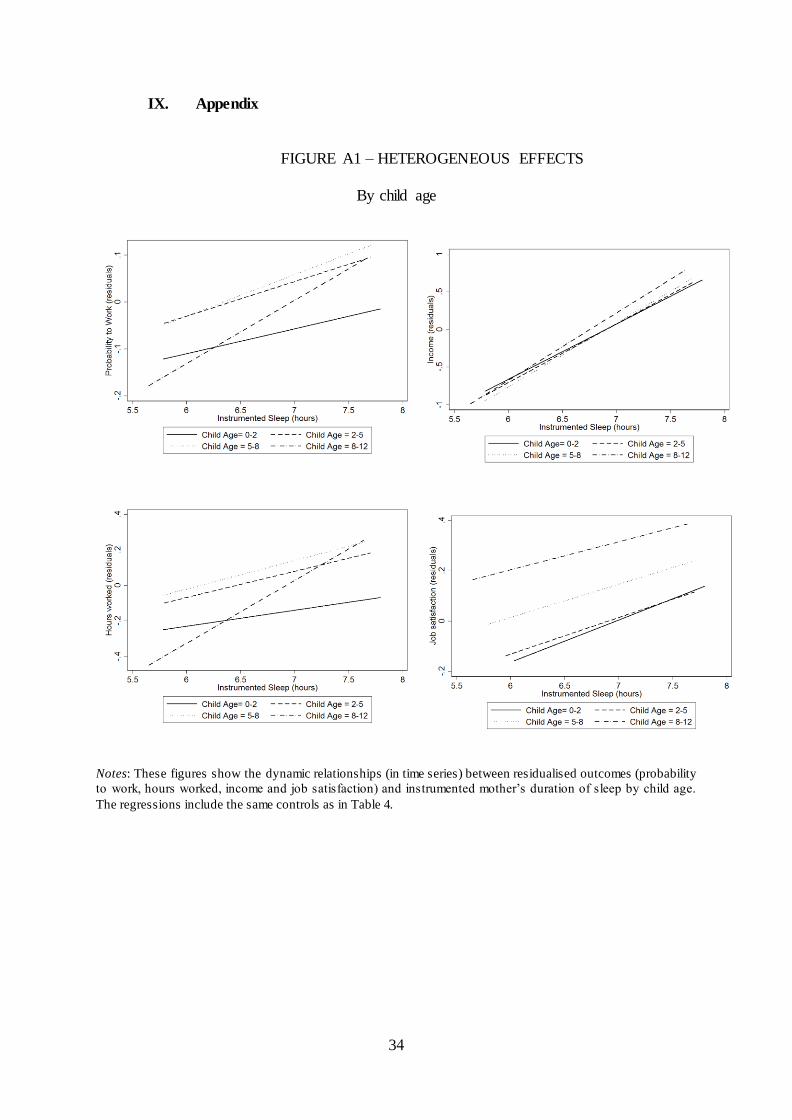
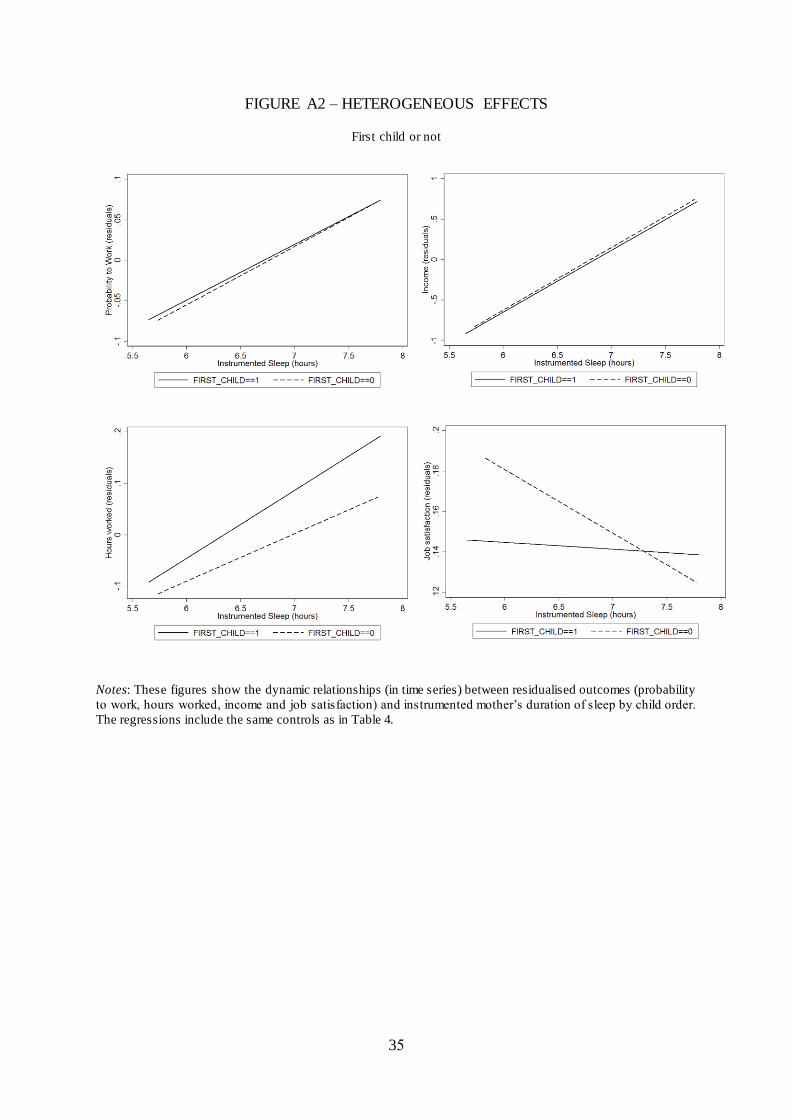
Figures A1, A2, A3 and A4 in the Appendix show some evidence of heterogeneous
effects of parental sleep on employment outcomes based (i) on children’s age, (ii) whether
the child is the first or not, (iii) mother’s educational level and (iv) mother’s ability to
organise herself. Figure A1 suggests that the effect on labour market participation, the
number of hours worked and job satisfaction seem to be steeper for older children, whilst the

20
effect on income is independent of child age. Figure A2 indicates no heterogeneity on income
and labour market participation based on the child being the first, whilst first children seem to
have an effect on the association between sleep and hours worked and job satisfaction.
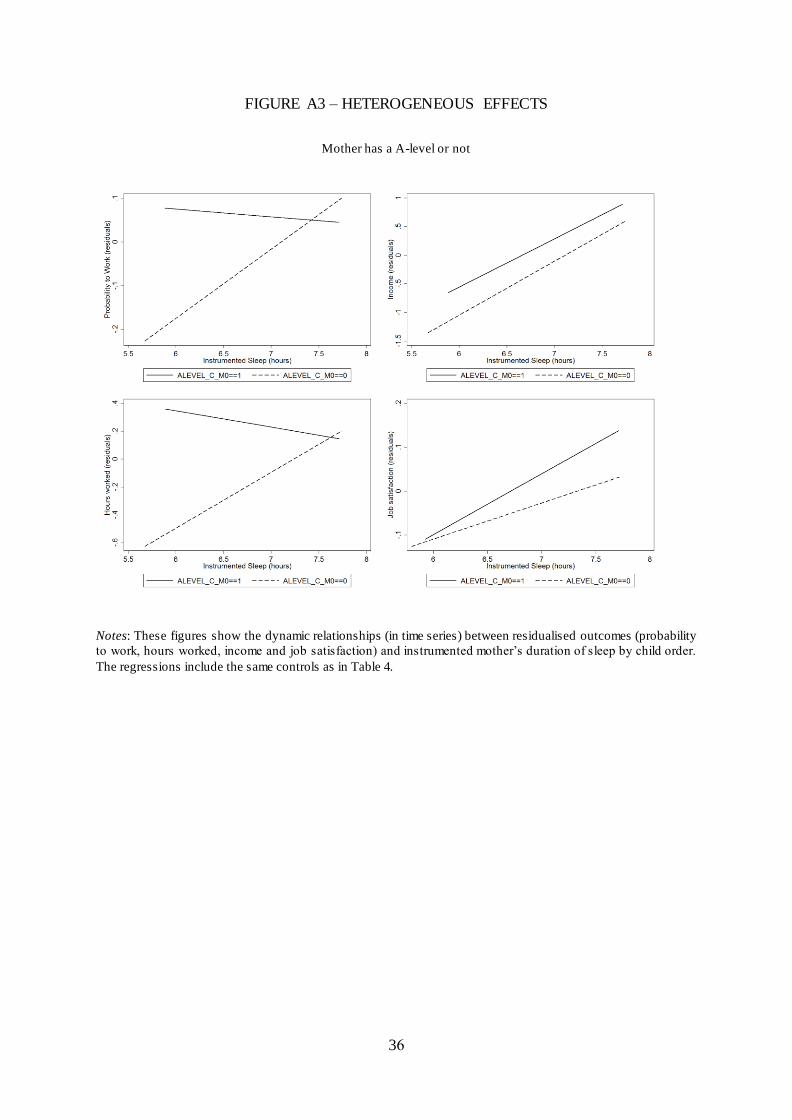
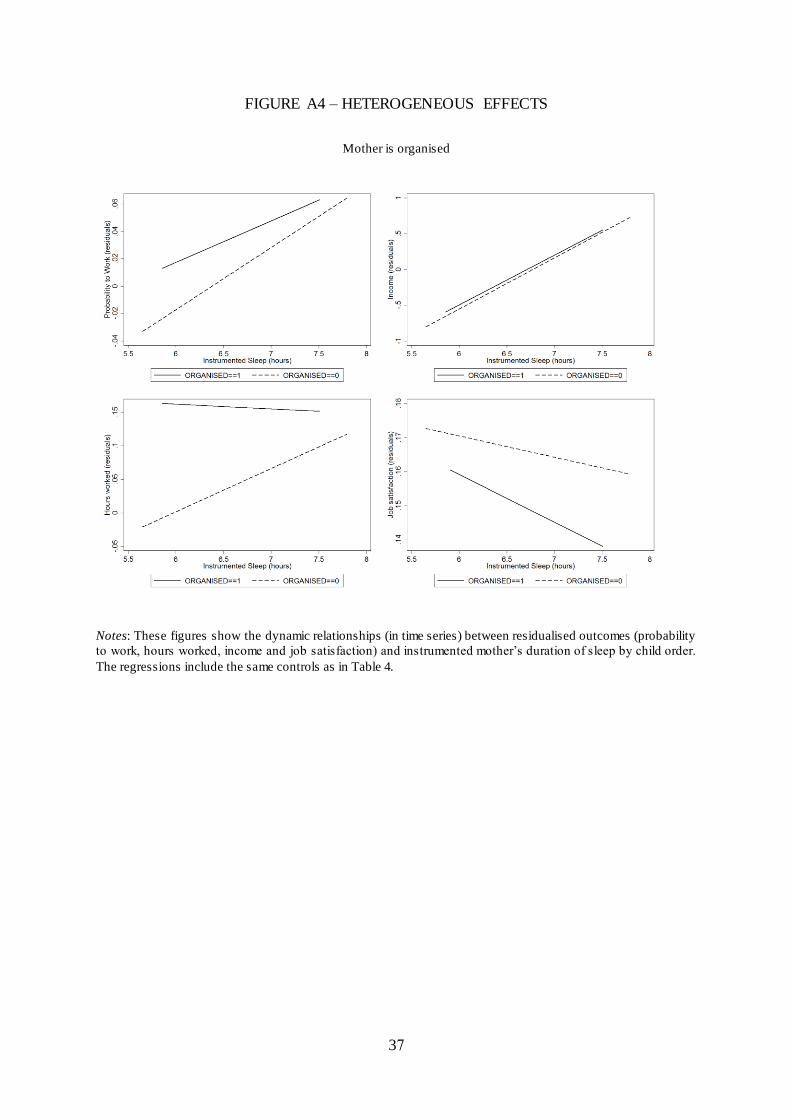
Finally, Figures A3 and A4 reveal heterogeneous effects among low-skilled and high-skilled
mothers, and organised and less organised mothers: the effect of sleep on the probability to
work and the number of hours of work is stronger for low-skilled mothers, while the effect is
almost zero for high-skilled mothers and mothers who report leading an organised life. By
way of contrast, there is no heterogeneity on income and job satisfaction based on the
mother’s educational level.
VI. Concluding Remarks
Many economists and social scientists have studied how people allocate time.
However, they have largely ignored the time spent sleeping and its impact on economic
activity. In this paper, we have argued that differences in time spent sleeping give rise to
significant differences in economic outcomes. We have taken advantage of a unique dataset
that contains rich data on sleep quality for both parents and their children. The data has
allowed us to draw upon a credible instrumental variable approach where changes in maternal
sleep are instrumented by changes in child sleep.
We have shown that: (1) child sleep patterns have substantial effects on parents’
sleep. (2) Using child sleep as a source of variation, sleep duration significantly influences
the probability of maternal labour market participation, alongside the number of hours
worked and the resulting household income. However, we did not find an effect on job
satisfaction. (3) The average effects mask substantial heterogeneity: fathers are somewhat
less affected by child sleep problems; similarly, the probability of high-skilled mothers
working is not affected when children wake up at night. Low-skilled mothers instead
experience a large decrease in employment and the number of hours worked when facing
sleep deprivation.
The results suggest that sleep quality should be a significant variable to consider in
the design of employment policies. Our upper bound estimates indicate that one hour
difference in sleep duration increases employment by 4 percent, the number of hours worked
by 7 percent, household income by 11 percent and job satisfaction by 1 percent. If labour
market productivity depends on sleep, it might appear counterproductive to expand working
time beyond a certain threshold.
21
References
Acebo C., Sadeh, A., Seifer, R., Tzischinsky, O. Hafer A., and Carskadon M.A. (2005) Sleep/wake patterns derived from activity monitoring and maternal report for healthy 1to 5-year old children. Sleep. 28(12). 1568-1577.
Antillón, M., D.S. Lauderdale, and Mullahy J. (2014). Sleep behavior and unemployment conditions. Economics & Human Biology, 14 (2014), pp. 22–32.
Arber, S., Bote, M., and Meadows, R. (2009). Gender and socio-economic patterning of self-reported sleep problems in Britain. Social Science & Medicine, 68(2), 281-289.
Ásgeirsdóttir, T. L., and Ólafsson, S. P. (2015). An empirical analysis of the demand for sleep: Evidence from the american time use survey. Economics & Human Biology, 19, 265-274.
Barclay, N. L., Eley, T. C., Buysse, D. J., Rijsdijk, F. V., and Gregory, A. M. (2010). Genetic and environmental influences on different components of the Pittsburgh Sleep Quality Index and their overlap. Sleep, 33(5), 659.
Becker, G.S (1965). A Theory of the Allocation of Time. Economic Journal, 75: 493-517.
Biddle, J and D. Hamermesh (1990) Sleep and the Allocation of Time. Journal of Political Economy, 98 (5), pp. 922–943.
Bonke, J. (2012). Do morning-type people earn more than evening-type people? How chronotypes influence income. Annals of Economics and Statistics, 55-72.
Boyd, A., Golding, J., Macleod, J., Lawlor, D. A., Fraser, A., Henderson, J. , and Smith, G. D. (2012). Cohort profile: the ‘children of the 90s’—the index offspring of the Avon Longitudinal Study of Parents and Children. International Journal of Epidemiology, dys064.
Brochu, P., Armstrong, C. D., and Morin, L. P. (2012). The ‘trendiness’ of sleep: an empirical investigation into the cyclical nature of sleep time. Empirical Economics, 43(2), 891-913.
Dionne G., Touchette, E., and Forget-Dubois, N. (2011). Association between sleep-wake consolidation and language development in early childhood: a longitudinal twin study. Sleep 34(8), 987-995.
Frank M.G. (2006). The mystery of sleep function: current perspectives and future directions. Reviews in the Neurosciences. 17:375-39.
Galland, B. C., Taylor, B. J., Elder, D. E., and Herbison, P. (2012). Normal sleep patterns in infants and children: a systematic review of observational studies. Sleep Medicine Reviews, 16(3), 213-222.
Gibson, M., and Shrader, J., (2014). Time use and productivity: the wage returns to sleep. URL http://econweb.ucsd.edu/~magibson/pdfs/sleep_productivity.pdf
Gehrmann P.R., Meltzer I.J., and Moore M.. (2011). Heritability of insomnia symptoms in youth and their relationship to depression and anxiety. Sleep. 34(12). 1641-1646.
Grandner, M. A., Patel, N. P., Gehrman, P. R., Xie, D., Sha, D., Weaver, T., and Gooneratne, N. (2010). Who gets the best sleep? Ethnic and socioeconomic factors related to sleep complaints. Sleep Medicine, 11(5), 470-478.
22
Grossman, M. (1972). The demand for health: a theoretical and empirical investigation. NBER Books.
Hamermersh, D.S, Knowles Myres, C and Pocock, A.L (2008).Cues for Timing and Coordination: Latitude, Letterman and Longitude. Journal of Labour Economics,26 (2): 223-247.
Iglowstein I, Jenni O.G., Molinari I., and Largho R.H. (2003). Sleep duration from infancy to adolescent: reference values and generational trends. Pediatrics. 111(2) 302-307.
Kahn M., Fridenson S., Lerer R., Bar-Haim Y., and Sadeh A. (2014). Effects of one night of induced night-wakings versus sleep restriction on sustained attention and mood: A pilot study. Sleep Medicine, 15, 825–832.
Kamstra, M. J., Kramer, L. A., and Levi, M. D., (2000). Losing sleep at the market: the daylight saving anomaly. American Economic Review, 1005–1011.
Killgore, W., (2010). Effects of sleep deprivation on cognition. Human Sleep and Cognition: Basic Research 185.
Mezick, E. J., Matthews, K. A., Hall, M., Strollo Jr, P. J., Buysse, D. J., Kamarck, T. W. and Reis, S. E. (2008). Influence of race and socioeconomic status on sleep: Pittsburgh Sleep SCORE project. Psychosomatic medicine,70(4), 410.
Mindell J. A., Sadeh A., Kwon R., and Goh D. Y (2013). Cross-cultural differences in the sleep of preschool children. Sleep Medicine, 14, 1283–1289.
Mindell, J. A., Sadeh, A., Kwon, R., and Goh, D. Y. (2015). Relationship between child and maternal sleep: a developmental and cross-cultural comparison. Journal of Pediatric Psychology, 40(7), 689-696.
Moore, P. J., Adler, N. E., Williams, D. R., and Jackson, J. S. (2002). Socioeconomic status and health: the role of sleep. Psychosomatic Medicine, 64(2), 337-344
Moore M., Slane J, Mindell J.A., Burt S.A. and Klump K.L. (2011). Genetic and environmental influences on sleep problems: a study of preadolescent and adolescent twins. Child Care Health Development. 37(5), 638-641.
Pilcher, J. J., and Huffcutt, A. J. (1996). Effects of sleep deprivation on performance: a meta-analysis. Sleep: Journal of Sleep Research & Sleep Medicine .
Siegel J.M. (2005.) Clues to the functions of mammalian sleep. Nature. 437:1264-1271.
Szalontai, G. (2006). The demand for sleep: a South African study. Economic Modelling, 23(5), 854-874.
Tafti M., Maret S., and Dauvilliers, Y. (2005). Genes for normal sleep and sleep disorders. Ann Med, 37(8), 580-589.
23
VII. Figures
FIGURE 1: REDUCED-FORM RELATIONSHIP BETWEEN MOTHER’S PROBABILITY TO WORK AND THE
NUMBER OF TIMES CHILD WAKES UP AT NIGHT
FIGURE 2: REDUCED-FORM RELATIONSHIP BETWEEN HOUSEHOLD INCOME AND THE NUMBER OF TIMES
CHILD WAKES UP AT NIGHT
24
FIGURE 3: CHILD SLEEP DURATION BY AGE
FIGURE 4: PROBABILITY THAT CHILD HAS A SLEEPING ROUTINE, BY AGE
25
FIGURE 5: PROBABILITY THAT CHILD WAKES UP AT NIGHT, BY AGE
FIGURE 6: FIRST STAGE RELATIONSHIP BETWEEN NUMBER OF TIME CHILD WAKES UP AT NIGHT AND MOTHER’S SLEEP DURATION
26
VIII. Tables
TABLE 1 – DESCRIPTIVE STATISTICS
Mean (Standard. Dev) Min Max
Sleep related variables
Child duration of sleep : hours 11.18 (1.26) 1 18
Child wakes up at night: Yes/No 0.32 (0.47) 0 1
Frequency child wakes up at night 0.48 (0.84) 0 4
Child has a regular sleeping routine 0.91 (0.28) 0 1
Mother duration of sleep : hours 6.97 (1.32) 0 9
Mother sleeps less than 6 hours 0.11 (0.31) 0 1
Mother sleeps between 6 and 7 hours 0.54 (0.50) 0 1
Mother is getting enough sleep 0.59 (0.49) 0 1
Father is getting enough sleep 0.62 (0.49) 0 1
Employment related variables
Mother works 0.63 (0.48) 0 1 Father works 0.84 (0.36) 0 1 Mother works part-time 0.22 (0.41) 0 1
Mother's hours worked per week (ln) 2.91 (0.65) 0 4
Household income (ln) 5.86 (0.67) 4 7
Mother is satisfied with job 0.66 (0.48) 0 1
Notes: This table provides the list, arithmetic mean and standard deviation alongside extreme values of all left and hand side variable of interest excluding controls. This includes child duration, frequency of child sleep interruptions, whether a sleep
routines are established, maternal sleep in hours and as a binary variable if its exceed six hours or between 6 and 7 hours and
finally we include a measure of maternal and paternal fatigue (whether parents are getting enough sleep). Next, we list the
main employment variables such as maternal and paternal labour market participation, whether the mother works part time
and the number of hours of work, household income and job satisfaction.
27
TABLE 2 – OLS REGRESSIONS Probability to work Log(Hours worked) Log(Income) Satisfied with job
(1) (2) (3) (4) (5) (6) (7) (8)
Panel A :
Sleep (hours) 0.01*** 0.01*** 0.001 0.04*** 0.04*** 0.01*** 0.01*** 0.01***
(0.002) (0.001) (0.007) (0.004) (0.003) (0.001) (0.003) (0.001)
R-squared 0.111 0.530 0.155 0.624 0.279 0.801 0.024 0.590
Panel B :
Sleep less than -0.05*** -0.06*** -0.11*** -0.17*** -0.15*** -0.02*** -0.03*** -0.016***
6 hrs (0.009) (0.005) (0.028) (0.014) (0.014) (0.005) (0.012) (0.006)
R-squared 0.112 0.530 0.156 0.624 0.278 0.801 0.024 0.590
Panel C :
Enough sleep 0.01*** 0.03*** 0.00 0.07*** 0.06*** 0.02*** 0.07*** 0.02***
(0.005) (0.003) (0.017) (0.009) (0.008) (0.003) (0.007) (0.004)
R-squared 0.113 0.530 0.158 0.626 0.279 0.804 0.029 0.591
Observations 120405 120405 114932 114932 114932 114932 86049 86049
Individual controls YES YES YES YES YES YES YES YES
Individual FE NO YES NO YES NO YES NO YES
Number of individuals 10,504 10,476 10,476 8,769
Notes: All regressions are OLS. Standard errors are in parentheses. Regressions also include controls for
whether the mother is separated, mother’s age at pregnancy, mother’s BMI, mother’s educational level,
mother’s social network index, mother’s social class , mother’s sleep quality during pregnancy and whether the
mother is working at 8 weeks of pregnancy. In columns (1), (2), (3), (4), (7) and (8) we also control for the
logarithm of household income. In columns (5), (6), (7) and (8) we control for mother’s hours worked. Sleep
(hours) is the mother’s average duration of sleep per night. Sleep less than 6 hours is a dummy with (1)
indicating that the mother sleeps less than 6 hours per night. Enough sleep is equal to (1) if the mother feels she
is getting enough sleep. See Table 1 for more detailed variable definitions.
28
TABLE 3 – DETERMINANTS OF MOTHER’S SLEEP QUALITY Mother’s sleep duration Mother sleeps less than 6
hours
Mother has enough sleep
(1) (2) (3) (4) (5) (6)
Panel A :
Child’s sleep duration 0.07*** -0.01*** 0.02***
(11.4) (7.6) (8.8)
Nb of times child wakes -0.20*** -0.08*** 0.04*** 0.01*** -0.08*** -0.04***
up at night (19.1) (19.3) (13.1) (14.2) (21.5) (24.4)
R-squared 0.054 0.658 0.037 0.603 0.042 0.623
Panel B :
Child has a regular 0.33*** 0.08*** -0.08*** -0.02*** 0.13*** 0.05***
sleeping routine (10.0) (7.4) (9.2) (6.8) (13.0) (12.8)
R-squared 0.041 0.657 0.030 0.603 0.031 0.622
Observations 133651 133870 133651 133870 142559 142851
Mother controls YES YES YES YES YES YES
Child controls YES YES YES YES YES YES
Family FE NO YES NO YES NO YES
Number of mother/child obs 11,334 11,334 11,980
Notes: All regressions are OLS. T-statistics are in parentheses. Regressions include controls for whether the
mother is separated, mother’s age at pregnancy, mother’s BMI, mother’s educational level, mother’s social
network index, mother’s social class , mother’s sleep quality during pregnancy, whether the mother is working at
8 weeks of pregnancy, child’s gender, child’s birth weight, whether the child has been in a special unit at birth,
child’s age and child’s health. In columns (2), (4), (6) and (8), we also control for individual fixed effects.
29
TABLE 4 – IV REGRESSIONS Probability to work Log(Hours worked) Log(Income) Satisfied with job
(1) (2) (3) (4) (5) (6) (7) (8)
Panel A :
Sleep (hours) 0.04*** 0.12*** 0.07 0.38*** 0.11*** 0.05** 0.01 0.05
(0.014) (0.023) (0.043) (0.067) (0.020) (0.021) (0.019) (0.032)
Cragg-Donald Wald F-stat 239.1 320.0 232.3 296.2 239.9 293.0 150.4 165.1
Panel B :
Sleep less than 6 hrs -0.23*** -0.70*** -0.39* -2.15*** -0.62*** -0.29** -0.08 -0.27
(0.078) (0.137) (0.240) (0.406) (0.113) (0.123) (0.107) (0.168)
Cragg-Donald Wald F-stat 104.0 160.1 101.8 143.8 105.0 140.5 69.0 97.2
Panel C :
Enough sleep 0.12*** 0.26*** 0.23* 0.73*** 0.36*** 0.10** 0.04 0.10
(0.039) (0.047) (0.187) (0.130) (0.057) (0.041) (0.055) (0.063)
Cragg-Donald Wald F-stat 280.9 511.6 275.1 501.9 281.4 499.0 173.9 266.9
Observations 120023 120051 114573 114578 114573 114578 85889 85722
Individual controls YES YES YES YES YES YES YES YES
Individual FE NO YES NO YES NO YES NO YES
Number of individuals 10,404 10,365 10,365 8,568
Notes: All regressions are OLS. Standard errors are in parentheses. Regressions report the two-stage least
squares estimates, instrumenting for mother’s sleep quality using child’s sleep duration and the number of times
child wakes up at night. The corresponding first stage is reported in Table 3. Regressions also include controls
for whether the mother is separated, mother’s age at pregnancy, mother’s BMI, mother’s educational level,
mother’s social network index, mother’s social class , whether the mother is working at 8 weeks of pregnancy,
child’s gender, child’s birth weight, whether the child has been in a special unit at birth, child’s age and child’s
health. In columns (2), (4), (6) and (8), we also control for individual fixed effects. In columns (1), (2), (3), (4),
(7) and (8) we also control for the logarithm of household income. In columns (5), (6), (7) and (8) we control for
mother’s hours worked. Sleep less than 6 hours is a dummy with (1) indicating that the mother sleeps less than 6
hours per night. Average sleep duration is in hours. Getting enough sleep is a dummy, with (1) indicating that
the mother has the feeling of having enough sleep. See Table 1 for more detailed variable definitions.
30
TABLE 5 – ROBUSTNESS CHECKS FOR IV REGRESSIONS (ADDITIONAL CONTROLS)
Probability to work Log(Hours worked) Log(Income) Satisfied with
job
(1) (2) (3) (4) (5) (6) (7) (8)
Panel A :
Sleep (hours) 0.04*** 0.13*** 0.07 0.41*** 0.10*** 0.04** 0.01 0.04
(0.014) (0.023) (0.044) (0.067) (0.020) (0.021) (0.020) (0.031)
Environment triggers YES YES YES YES YES YES YES YES
Cragg-Donald Wald F-stat 232.9 330.4 226.5 305.7 232.4 301.8 145.6 170.8
Panel B :
Sleep (hours) 0.03** 0.12*** 0.08* 0.43*** 0.14*** 0.04* 0.02 0.01
(0.015) (0.025) (0.046) (0.073) (0.021) (0.022) (0.021) (0.033)
Parenting style YES YES YES YES YES YES YES YES
Cragg-Donald Wald F-stat 206.2 274.0 199.0 235.5 206.2 248.9 123.1 153.0
Panel C :
Sleep (hours) 0.02 0.15*** 0.02 0.43*** 0.12*** 0.04** 0.03* 0.03
(0.013) (0.024) (0.041) (0.069) (0.019) (0.021) (0.019) (0.032)
Household composition YES YES YES YES YES YES YES YES
Cragg-Donald Wald F-stat 255.4 316.9 249.3 293.6 259.0 289.2 160.5 166.4
Panel D :
Sleep (hours) 0.04*** 0.12*** 0.07 0.35*** 0.09*** 0.05** 0.01 0.05
(0.014) (0.023) (0.044) (0.067) (0.019) (0.021) (0.020) (0.032)
Father characteristics YES YES YES YES YES YES YES YES
Cragg-Donald Wald F-stat 908.0 317.0 865.9 293.1 888.3 290.3 550.7 164.2
Panel E :
Sleep (hours) 0.04*** 0.12*** 0.11*** 0.43*** 0.10*** 0.01 0.01 0.01
(0.015) (0.025) (0.045) (0.074) (0.019) (0.022) (0.022) (0.033)
Environment triggers YES YES YES YES YES YES YES YES
Parenting style YES YES YES YES YES YES YES YES
Household composition YES YES YES YES YES YES YES YES
Father characteristics YES YES YES YES YES YES YES YES
Cragg-Donald Wald F-stat 202.4 266.4 194.8 245.9 200.0 132.4 117.5 148.1
Observations 120023 120051 114573 114578 114573 114578 85889 85722
Individual controls YES YES YES YES YES YES YES YES
Individual FE NO YES NO YES NO YES NO YES
Number of individuals 10,404 10,365 10,365 8,568
Notes: All regressions are OLS. Standard errors are in parentheses. Regressions report the two-stage least squares estimates,
instrumenting for mother’s sleep quality using child’s sleep duration and the number of times child wakes up at night..
Regressions also include the usual controls for mother and child characteristics. In columns (2), (4), (6) and (8), we also control for individual fixed effects. In columns (1), (2), (3), (4), (7) and (8) we also control for the logarithm of household
income. In columns (5), (6), (7) and (8) we control for mother’s hours worked. Environment triggers include information on
noise, whether child shares bed/bedroom, and the number of years lived in Avon. Parenting style includes whether the child
is still breastfed after 15 months, has never been breastfed, the number of hours spent in child care (commercial carer,
nursery), time child goes to bed, time child wakes up, any sleep during day time and whether the mother is an organised person. Household composition includes the number of children in the household, whether chid is the first chid, the number
of old sibling, young sibling, whether the mother is pregnant, whether there is a new parent in the household. Father
characteristics include father’s educational level, father’s social class, whether father works during pregnancy, father’s age at
pregnancy, father’s health and whether father is getting enough sleep during pregnancy.
31
TABLE 6 – ROBUSTNESS CHECKS FOR IV REGRESSIONS (ALTERNATIVE INSTRUMENT)
Probability to work Log(Hours worked) Log(Income) Satisfied with job
(1) (2) (3) (4) (5) (6) (7) (8)
Panel A :
Sleep (hours) 0.13*** 0.26*** 0.32*** 0.73*** 0.26*** 0.16*** 0.06** 0.04
(0.036) (0.062) (0.110) (0.181) (0.050) (0.054) (0.043) (0.056)
Cragg-Donald Wald F-stat 74.9 57.0 71.8 51.8 78.7 50.8 59.4 53.6
Panel B:
Sleep less than 6 hrs -0.56*** -1.29*** -1.34*** -3.76*** -1.12*** -0.82** -0.26** -0.26
(0.151) (0.326) (0.467) (1.023) (0.223) (0.297) (0.195) (0.403)
Cragg-Donald Wald F-stat 63.7 38.5 60.0 31.3 64.1 30.2 42.2 16.9
Panel C :
Enough sleep 0.28*** 0.44*** 0.65*** 1.14*** 0.60*** 0.25*** 0.12** 0.06
(0.076) (0.095) (0.229) (0.257) (0.105) (0.080) (0.097) (0.110)
Cragg-Donald Wald F-stat 145.8 130.9 152.8 135.5 159.2 134.5 108.0 86.7
Observations 120023 120051 114573 114578 114573 114578 85889 85722
Individual controls YES YES YES YES YES YES YES YES
Individual FE NO YES NO YES NO YES NO YES
Number of individuals 10,404 10,365 10,365 8,568
Notes: All regressions are OLS. Standard errors are in parentheses. Regressions report the two -stage least
squares estimates, instrumenting for mother’s sleep quality using child’s sleeping routine. The corresponding
first stage is reported in Table 3. Regressions also include controls for whether the mother is separated, mother’s
age at pregnancy, mother’s BMI, mother’s educational level, mother’s social network index, mother’s social
class, whether the mother is working at 8 weeks of pregnancy, child’s gender, child’s birth weight, whether the
child has been in a special unit at birth, child’s age and child’s health. In columns (2), (4), (6) and (8), we also
control for individual fixed effects. In columns (1), (2), (3), (4), (7) and (8) we also control for the logarithm of
household income. In columns (5), (6), (7) and (8) we control for mother’s hours worked. Sleep less than 6
hours is a dummy with (1) indicating that the mother sleeps less than 6 hours per night. Average sleep duration
is in hours. Getting enough sleep is a dummy, with (1) indicating that the mother has the feeling of having
enough sleep. See Table 1 for more detailed variable definitions.
32
TABLE 7 – ROBUSTNESS CHECKS FOR IV REGRESSIONS (PROBIT)
Probability to
work
Satisfied with
job
(1) (2)
Panel A :
Sleep (hours) 0.11*** 0.04
(0.022) (0.028)
Panel B:
Sleep less than 6 hrs -0.59*** -0.20
(0.119) (0.153)
Panel C :
Enough sleep 0.32*** 0.10
(0.060) (0.079)
Observations 120023 85889
Individual controls YES YES
Individual FE NO NO
Notes: All regressions are instrumental probit. Standard errors are in parentheses. Regressions instrument for
mother’s sleep quality using child’s sleep duration and the number of times child wakes up at night. Regressions
also include controls for whether the mother is separated, mother’s age at pregnancy, mother’s BMI, mother’s
educational level, mother’s social network index, mother’s social class, whether the mother is working at 8
weeks of pregnancy, child’s gender, child’s birth weight, whether the child has been in a special unit at birth,
child’s age and child’s health. We also control for the logarithm of household income. In column (2), we control
for mother’s hours worked. Sleep less than 6 hours is a dummy with (1) indicating that the mother sleeps less
than 6 hours per night. Average sleep duration is in hours. Getting enough sleep is a dummy, with (1) indicating
that the mother has the feeling of having enough sleep. See Table 1 for more detailed variable definit ions.
33
TABLE 8 – FATHER’S PROBABILITY TO WORK AND FATHER’S SLEEP QUALITY
Notes: All regressions are OLS. Standard errors are in parentheses. Regressions include controls for father’s
educational level, father’s age at pregnancy, father’s social class, whether fathers work during pregnancy,
father’s health, whether father has enough s leep during pregnancy, child’s gender, child’s birth weight,
whether the child has been in a special unit at birth, child’s age and child’s health. In columns (2), (4), (6), we
also control for individual fixed effects. Regressions in columns (5) and (6) report the two-stage least squares
estimates, instrumenting for father’s sleep quality using child’s sleep duration and the number of times child
wakes up at night. The corresponding first stages are reported in columns (3) and (4).
Probability to work Father is getting enough
sleep
Probability to work
(1) (2) (3) (4) (5) (6)
OLS OLS OLS OLS IV IV
Getting enough sleep 0.00 0.00 0.58*** 0.69***
(0.005) (0.003) (0.129) (0.137)
Child’s sleep duration 0.01***
(0.003)
Number of times child wakes -0.03*** -0.01***
Up at night (0.004) (0.001)
Observations 85719 85719 100817 100817 89840 89840
R-squared 0.105 0.555 0.095 0.729 0.612 0.830
Individual controls YES YES YES YES YES YES
Individual FE NO YES NO YES NO YES
Number of father/child obs 7,587 8,570 7,839
Cragg-Donald Wald F-Stat 26.9 62.3
34
IX. Appendix
FIGURE A1 – HETEROGENEOUS EFFECTS
By child age
Notes: These figures show the dynamic relationships (in time series) between residualised outcomes (probability
to work, hours worked, income and job satisfaction) and instrumented mother’s duration of sleep by child age.
The regressions include the same controls as in Table 4.
35
FIGURE A2 – HETEROGENEOUS EFFECTS
First child or not
Notes: These figures show the dynamic relationships (in time series) between residualised outcomes (probability
to work, hours worked, income and job satisfaction) and instrumented mother’s duration of sleep by child order.
The regressions include the same controls as in Table 4.
36
FIGURE A3 – HETEROGENEOUS EFFECTS
Mother has a A-level or not
Notes: These figures show the dynamic relationships (in time series) between residualised outcomes (probability
to work, hours worked, income and job satisfaction) and instrumented mother’s duration of sleep by child order.
The regressions include the same controls as in Table 4.
37
FIGURE A4 – HETEROGENEOUS EFFECTS
Mother is organised
Notes: These figures show the dynamic relationships (in time series) between residualised outcomes (probability
to work, hours worked, income and job satisfaction) and instrumented mother’s duration of sleep by child order.
The regressions include the same controls as in Table 4.
38
TABLE A1 – RAW CORRELATIONS BETWEEN CHILD QUALITY OF SLEEP VARIABLES
Child sleep duration Nb of times child
wakes up at night
Probability child
wakes up at night
Child has a regular
sleeping routine
Child sleep duration 1.00
Nb of times child
wakes up at night -0.05 1.00
Probability child
wakes up at night -0.01 0.83 1.00
Child has a regular
sleeping routine 0.18 -0.30 -0.22 1.00
39
TABLE A2 – DETERMINANTS OF CHILD QUALITY OF SLEEP
Child sleep duration Nb of times child
wakes up at night
Probability child wakes
up at night
Child has a regular
sleeping routine
(1) (2) (3) (4) (5)
(6) (7) (8)
OLS OLS OLS OLS OLS OLS OLS OLS
Child characteristics:
Child age -0.04*** -0.04*** -0.04*** -0.03*** -0.01*** -0.01*** 0.02*** 0.01***
(0.00) (0.00) (0.00) (0.00) (0.00) (0.00) (0.00) (0.00)
Child’s gender: Male -0.06*** 0.02** 0.01 0.00
(0.01) (0.001) (0.00) (0.00)
Child: low birth 0.03 0.01 0.00 0.01
weight (0.02) (0.02) (0.01) (0.01)
Child: in special unit -0.00 0.03 0.02 -0.00
at birth (0.02) (0.02) (0.01) (0.01)
Child’s health 0.10*** 0.06*** -0.32*** -0.12*** -0.18*** -0.07*** 0.05*** 0.02***
(0.01) (0.01) (0.02) (0.01) (0.01) (0.01) (0.01)
(0.00)
Mother characteristics:
Mother’s education -0.03*** -0.03*** -0.01** 0.02**
(0.01) (0.01) (0.01) (0.00)
Mother’s age at birth -0.01*** 0.00*** 0.00*** -0.00***
(0.00) (0.00) (0.00) (0.00)
Mother’s BMI -0.00** -0.00* -0.00* -0.00
(0.00) (0.00) (0.00) (0.00)
Mother’s social 0.00*** -0.00* -0.00* 0.00***
network (0.00) (0.00) (0.00) (0.00)
Mother’s social class -0.00 -0.01 -0.01* 0.00
(0.01) (0.01) (0.01) (0.00)
Mother is separated 0.07***
0.03*** 0.04*** 0.01 0.02** 0.01 -0.01*** 0.00
(0.01) (0.01) (0.01) (0.01) (0.01) (0.01) (0.00) (0.00)
40
Mother sleeps ok 0.01* -0.02*** -0.01** 0.01***
during pregnancy (0.01) (0.01) (0.00) (0.00)
Mother works -0.01 -0.03*** -0.01* 0.00
during pregnancy (0.01) (0.01) (0.01) (0.00)
Father characteristics:
Father’s education -0.01 -0.01 -0.00
0.01**
(0.01) (0.01) (0.01) (0.01)
Father’s age at birth -0.00 -0.00 -0.00 -0.00
(0.01) (0.01) (0.01) (0.01)
Father's health 0.06*** -0.02 -0.10*** -0.03**
-0.06*** -0.00 0.02*** 0.01
(0.01) (0.01) (0.02) (0.01) (0.01) (0.01) (0.01) (0.01)
Father’s social class -0.00 0.00 0.00** -0.00**
(0.00) (0.00) (0.00) (0.00)
Father sleeps ok -0.00 -0.05*** -0.03*** 0.00
during pregnancy (0.01) (0.01) (0.01) (0.00)
Father works 0.01 -0.05*** -0.02** 0.02***
during pregnancy (0.01) (0.02) (0.01) (0.01)
Environment:
Noise is not a pb 0.00 0.00 -0.03*** -0.01*** -0.01*** -0.00 0.01*** 0.00
(0.00) (0.00) (0.00) (0.00) (0.00) (0.00) (0.00) (0.00)
Child shares bed 0.00 0.05*** 0.16*** 0.06*** 0.07*** 0.02***
-0.07*** -0.02***
or bedroom (0.01) (0.01) (0.02) (0.01) (0.01) (0.01) (0.01) (0.00)
Length of time in -0.00 0.00 0.00 -0.00**
Avon (0.00) (0.00) (0.00) (0.00)
41
Household compo:
Number of children 0.01*** 0.02*** -0.01 -0.00 -0.01*** 0.00 -0.00*
0.00***
(0.00) (0.00) (0.01) (0.00) (0.00)
(0.00) (0.00) (0.00)
First child -0.00 0.04*** 0.02*** -0.01***
(0.01) (0.01) (0.01) (0.00)
Nb of old siblings -0.00 0.01** 0.01*** -0.00**
(0.00) (0.00) (0.00) (0.00)
Nb of young siblings 0.01 -0.03*** -0.02*** 0.00
(0.01) (0.01) (0.00) (0.00)
Mother is pregnant 0.04*** 0.01 -0.02** -0.01** 0.00 0.01 -0.00 -0.00
again (0.01) (0.01) (0.01) (0.01) (0.01) (0.00) (0.00) (0.00)
New parent in hhsold 0.04** -0.06** -0.03 -0.02 -0.02 -0.01 -0.01 0.00
(0.02) (0.02) (0.03) (0.02) (0.02) (0.01) (0.01) (0.01)
Parenting style:
Never breasfeed by 0.03*** -0.00 -0.00 -0.01*
15 months (0.01) (0.01) (0.01) (0.00)
Still breasfeed by -0.05*** 0.16*** 0.08*** -0.03***
15 months (0.01) (0.02) (0.01) (0.01)
Use nursery -0.00 -0.00 -0.00 0.00 -0.00 0.00
-0.00 -0.00
(0.00) (0.00) (0.00) (0.00)
(0.00) (0.00) (0.00) (0.00)
Use commercial -0.00*** -0.00 -0.00*** -0.00 -0.00 0.00 0.00*** 0.00***
carer (0.00) (0.00) (0.00) (0.00) (0.00) (0.00) (0.00) (0.00)
Time child goes to -0.91*** -0.75*** 0.10*** 0.05*** 0.05*** 0.02*** -0.08*** -0.05***
bed (0.00) (0.00) (0.00) (0.00) (0.00)
(0.00) (0.00) (0.00)
Time child wakes up 0.97***
0.80*** -0.13*** -0.08*** -0.06*** -0.04*** 0.03*** 0.03***
(0.00) (0.00) (0.01) (0.00) (0.00) (0.00) (0.00) (0.00)
Sleep during day 0.06*** 0.02*** -0.03*** -0.01** -0.01* -0.00 0.00
0.00**
time (0.00) (0.00) (0.01)
(0.00) (0.00) (0.00) (0.00) (0.00)

42
Observations 132,381 132,381 132,243 132,243 132,243 132,243 132,540 132,540
R-squared 0.660 0.701 0.093 0.102
0.089 0.106 0.086 0.052
Fixed effects NO YES NO YES NO YES NO
YES
Number of ID 12,904 12,799 12,799 12,863
Notes: All regressions are OLS. Standard errors are in parentheses. In columns (2), (4), (6) and (8), we also
control for individual fixed effects.

CENTRE FOR ECONOMIC PERFORMANCE Recent Discussion Papers
1466 Jo Blanden Stephen Machin
Home Ownership and Social Mobility
1465 Decio Coviello Stefano Gagliarducci
Tenure in Office and Public Procurement
1464 Claudia Olivetti Barbara Petrongolo
The Economic Consequences of Family Policies: Lessons from a Century of Legislation in High-Income Countries
1463 Claudia Hupkau Marion Leturcq
Fertility and Mothers' Labor Supply: New Evidence Using Time-to-Conception
1462 Clement Bellet The Paradox of the Joneses: Superstar Houses and Mortgage Frenzy in Suburban America
1461 Georg Graetz Guy Michaels
Is Modern Technology Responsible for Jobless Recoveries?
1460 Thomas Breda Alan Manning
Diversity and Social Capital within the Workplace: Evidence from Britain
1459 Monica Langella Alan Manning
Diversity and Neighbourhood Satisfaction
1458 Giordano Mion Luca David Opromolla Alessandro Sforza
The Diffusion of Knowledge via Managers’ Mobility
1457 Kristian Behrens Giordano Mion Yasusada Murata Jens Suedekum
Distorted Monopolistic Competition
1456 Tony Beatton Michael P. Kidd Stephen Machin Dipa Sarkar
Larrikin Youth: New Evidence on Crime and Schooling

1455 Andrew Eyles Stephen Machin Sandra McNally
Unexpected School Reform: Academisation of Primary Schools in England
1454 Rabah Arezki Thiemo Fetzer Frank Pisch
On the Comparative Advantage of U.S. Manufacturing: Evidence from the Shale Gas Revolution
1453 Randolph Bruno Nauro Campos Saul Estrin Meng Tian
Foreign Direct Investment and the Relationship Between the United Kingdom and the European Union
1452 Stephen J. Redding Esteban Rossi-Hansberg
Quantitative Spatial Economics
1451 Elias Einiö The Loss of Production Work: Evidence from Quasi-Experimental Identification of Labour Demand Functions
1450 Marcus Biermann Trade and the Size Distribution of Firms: Evidence from the German Empire
1449 Alessandro Gavazza Simon Mongey Giovanni L. Violante
Aggregate Recruiting Intensity
1448 Emmanuel Amissah Spiros Bougheas Fabrice Defever Rod Falvey
Financial System Architecture and the Patterns of International Trade
1447 Christian Fons-Rosen Vincenzo Scrutinio Katalin Szemeredi
Colocation and Knowledge Diffusion: Evidence from Million Dollar Plants
1446 Grace Lordan Jörn-Steffen Pischke
Does Rosie Like Riveting? Male and Female Occupational Choices
The Centre for Economic Performance Publications Unit Tel 020 7955 7673
Email [email protected] Web site http://cep.lse.ac.uk