Embed Size (px)
Citation preview
CEO Investment Cycles
Yihui Pan
University of Utah
Tracy Yue Wang
University of Minnesota
Michael S. Weisbach
Ohio State University, NBER, and SIFR
March 6, 2014
Abstract
This paper documents the existence of a CEO Investment Cycle, in which firms disinvest early in a CEO’s
tenure and increase investment subsequently, leading to “cyclical” firm growth in assets as well as in
employment over CEO tenure. The CEO investment cycle is present for both firings and non-performance
related CEO turnovers, and its magnitude is substantial: The estimated difference in investment rate
between the first three years of a CEO’s tenure and subsequent years is close to the differences caused by
business cycles or financial constraints. This investment cycle appears to be best explained by agency-
based arguments. Early in his tenure the CEO disinvests poorly performing assets that his predecessors
established and was unwilling to sell. Subsequently, the CEO overinvests when he gains more control
over his board. When the CEO eventually steps down, the process is repeated by the next CEO. There is
no evidence that the investment cycles occur because of shifting CEO skill or productivity shocks.
Overall, the results imply that public corporations’ investments deviate from the first-best, and that
governance-related factors internal to the firm are as important as economy-wide factors in explaining
firms’ investments.
JEL classification: G32, G34, M12, M51
Key words: Investment, disinvestment, non-performance motivated CEO turnover, CEO control of the
board, overinvestment.
Contact information: Yihui Pan, Department of Finance, David Eccles School of Business, University of Utah, email: [email protected]; Tracy Yue Wang, Department of Finance, Carlson School of Management University
of Minnesota: email: [email protected]; Michael S. Weisbach, Department of Finance, Fisher College of
Business, Ohio State University, Columbus, OH 43210, email: [email protected]. We would like to thank
Shan Ge and Jongsik Park for excellent research assistance and Murillo Campello, Sergey Chernenko, John Core,
Ran Duchin, Charlie Hadlock, Brandon Julio, Kathy Kahle, Jonathan Leonard, Karl Lins, Merih Sevilir, Andrei
Shleifer, Daniel Wolfenzon, as well as seminar participants at Berkeley, Harvard Business School, Minnesota, MIT
Sloan, Ohio State, Stanford, Utah, the 2013 FMA Meeting, the 2013 Conference on Financial Economics and
Accounting, the 2013 China International Conference on Finance, the 2014 ASU Sonoran Winter Finance
Conference, and the 2014 ASSA annual meeting for helpful comments.
1
1. Introduction
Much of what we study in business schools concerns the role of the CEO and his management
team. Yet, there is still substantial uncertainty about the right economic model for understanding the role
of the CEO. The literature has adopted a variety of viewpoints, ranging from a first-best world in which
the CEO always picks value-maximizing projects, to a principal-agent framework that allows for a variety
of types of agency concerns.1 It is unclear what is the right way to view the role of CEOs in firms, or even
how one would go about addressing this issue. Moreover, while the popular press typically ascribes many
important actions firms take to CEOs, it is difficult to verify systematically the extent to which top
management actually matters.
One way to measure the extent to which CEOs make a difference is to estimate the way in which
firms’ activities vary over their time in office. While there are numerous differences across CEOs and
firms, a CEO’s incentives and power inside the firm vary systematically over his career, so systematic
differences in firm behavior over CEO tenure are likely to reflect these changes. In this paper, we
document striking patterns in corporate investment and disinvestment activities over the “CEO cycle” in a
large sample of publicly traded U.S. firms. Disinvestments are fairly common in the early years of a
CEO's tenure and decrease over time. Investments, on the other hand, are relatively low in the early years
of a CEO’s tenure and increase over time. The overall effect is “cyclical” firm growth in assets as well as
in employment over CEO tenure, with the firm growth rate being lower in early years of a CEO’s tenure
than in his later years. Both disinvestment and investment vary systematically over the CEO cycle
irrespective of the way we measure them, using information from firm-level financial statements,
corporate announcements, acquisition data, or segment-level data.
The magnitude of the changes in firm investment and growth over the CEO cycle is substantial.
For example, the annual investment rate (investment-to-capital-stock ratio) tends to be about 6 percentage
1 In the literature on principal-agent problems, CEOs have been accused of providing too little effort, overinvesting,
underinvesting, enjoying the “quiet life”, investing in projects that maximize their own human capital, delaying
recognition of mistakes, building empires that maximize their utility rather than firm value, etc. See Jensen and
Murphy (1990), Jensen and Meckling (1976), Myers (1977), Bertrand and Mullinathan (2003), Shleifer and Vishny
(1989), Boot (1992), Yermack (1999), and Bebchuk and Fried (2004).
2
points lower and the asset growth rate tends to be 3.2 percentage points lower in the first three years of a
CEO’s tenure than in his later years in office. Given that the median investment rate in our sample is 24%
and the median asset growth rate is 7.6%, the differences in investment and growth between the earlier
and the later parts of the CEO cycle are clearly non-trivial. The effect of CEO cycle on investment is of
the same order of magnitude as the effects of other factors known to influence investment such as the
business cycle, political uncertainty, and financial constraints.
The CEO investment cycle does not appear to be a consequence of the endogenous timing of
CEO turnovers. We estimate our equation on a number of subsamples for which it is unlikely that the
change of CEO coincides with high disinvestment and low investment that would have occurred
regardless of the identity of the CEO: when the CEO leaves due to death or illness, when the CEO retires
following above-median stock return performance, when there is no top management shakeup other than
the change of CEO, and when the CEO leaves following above industry median stock and accounting
returns together with below median stock return volatility. CEO investment cycles exist in each of these
subsamples and are of comparable magnitude as in the full sample. Further, the CEO investment cycles
are present regardless of the new CEO’s succession origin, the CEO’s time in office, the time period, and
the industry conditions at the time of turnover. The existence of the CEO investment cycle regardless of
the circumstances under which the incoming CEO takes office or his background suggests that this
cyclical behavior of investment is a general phenomenon in publicly traded corporations.
We argue that the cyclical behavior of investment over CEO tenure is best understood through an
agency-based explanation. When a CEO takes office, he has incentives to divest poorly performing assets
that the previous CEO established and was unwilling to abandon. For many reasons, CEOs usually prefer
their firms to grow, potentially at the expense of shareholder value maximization. The board of directors
is an important constraint on CEOs’ ability to deviate from the shareholders’ interest. However, as the
CEO becomes more powerful in the firm over time, he will have more sway over his board and will be
able to undertake investments that maximize his utility. Eventually, when the CEO steps down, the
process is repeated by the next CEO.
3
We test a number of predictions of this agency explanation of the CEO investment cycle. First, if
the incremental disinvestments early in a CEO’s career reflect bad decisions made by the outgoing CEO,
then the disinvested assets should be poor performers, and their performance should not be caused by
exogenous productivity shocks. Using segment-level data, we document that the unusually large
disinvestment rate in the first three years of a CEO’s tenure is made up of segments established by the
previous CEO and in the bottom 10% of the distribution when ranked in terms of operating performance,
after controlling for productivity shocks. Second, any residual influence the outgoing management has
subsequent to the turnover should negatively affect the post-turnover disinvestment intensity. Our
estimates indicate that the tendency of CEOs to disinvest poorly performing assets acquired by their
predecessors is lower when the incoming CEO had a role in the outgoing management, or if the prior
management maintains a strong presence on the board of directors after turnover.
Third, since an uncaptured board of directors is an important factor that limits the CEO’s ability
to overinvest, the agency explanation implies that more direct measures of the CEO’s control over the
board should be more powerful at explaining the investment increases than the CEO’s tenure in office.
We measure the CEO’s capture of the board by the fraction of the board that is appointed during his
tenure, and find that the increasing CEO influence on the board over his tenure explains the positive
relation between CEO tenure and investment, even when instrumented using the exogenous variation in
director turnovers. In addition, we find that the quality of a firm’s investments, measured by the market
reaction to acquisition announcements, decreases with CEO tenure and is more likely to be negative
during the later portion of his time in office. This deteriorating investment quality also appears to be a
function of the CEO’s control of the board. Further, segments established in the later years of a CEO’s
tenure are significantly more likely than those established in early years to be divested immediately after
CEO turnover. These findings suggest that the increases in the quantity and the decreases in the quality of
investments over the CEO cycle occur because the CEO acquires more control over his board over time.
An alternative explanation for the existence of CEO investment cycles is that changes in
investment over the CEO tenure are efficient at all times. Efficient changes in investment could occur
4
following turnovers if they reflect the match between the new CEO’s skills and firm assets. In contrast to
this view, we find that the magnitudes of the CEO investment cycles are similar in situations in which the
new CEO’s skills are more likely to fit the firm’s asset structure (e.g., when single-segment firms hire an
insider CEO) and in situations in which they are less likely (e.g., in multi-divisional firms, CEO turnovers
preceded by industry productivity shocks).
In addition, a CEO’s tenure could be a function of his ability (either innate or learned on the job)
or his firm’s investment opportunities, both of which could be positively related to the firm’s investments.
However, this explanation is not consistent with the deteriorating investment quality over CEO tenure. In
addition, the instrumental variable estimates imply that the CEO’s control of the board due to director
retirement, which is likely to be exogenous to the CEO’s ability or the firm’s investment opportunities,
explains both the increase in investment level and the decrease in investment quality over tenure.
Consequently, it appears that the CEO investment cycle is not driven by CEO tenure reflecting CEO
ability or the firm’s growth opportunities.
The existence of an economically meaningful CEO investment cycle has a number of important
implications. First, there has been much work on external factors that affect investment, such as the
business cycle, political uncertainty, and conditions of the financial markets. Our results suggest that
governance-related factors internal to the firm are equally important. Second, the existence of the CEO
investment cycle together with the additional tests presented in this paper suggests that investment in
publicly-traded corporations deviates from the first-best level in important ways. Movement towards the
first-best investment is likely one reason why private equity partnerships can pay large premiums to
acquire public companies and nonetheless offer high returns to their investors. Third, our results provide
insights on the types of agency problems that affect firms’ investment decisions; they suggest that the
empire-building preference plus the unwillingness to re-optimize on past investment decisions are
important factors leading to investment inefficiencies in public companies. Fourth, the results imply that a
policy of regular management turnover in public corporations potentially can be valuable. Such a policy
will likely minimize overinvestment resulting from a CEO’s growing capture of his board, and facilitate
5
correction of errors he is unwilling to acknowledge. Finally, since some asset pricing theories predict that
investment is an important determinant of expected equity returns, our results suggest that there could be
CEO cycles in expected equity returns (see Liu, Whited, and Zhang (2009))
More broadly, this study contributes to the on-going debate about whether managers have
systematic influences on firm policies and firm value, and more generally the implication for the role of
management in the firm. Particularly important related work is the literature on whether CEO-specific
styles affect firm policies (see Bertrand and Schoar (2003), Bamber, Jiang, and Wang (2010), and Fee,
Hadlock and Pierce (2013)). The literature also has drawn inferences about the value of CEOs based on
rare events such as CEO death (Johnson et al. 1985, Bennedsen et al. 2007) and hospitalization
(Bennedsen et al. 2012). Finally, using an approach based on systematic changes in stock return volatility
after the CEO takes office, Pan, Wang, and Weisbach (2013) estimate that CEOs contribute a nontrival
amount to firm values. Documenting the way in which firm policies vary over the CEO cycle is an
alternative approach to identify potential systematic managerial effects.
Using an earlier sample, Murphy and Zimmerman (1993) document systematic changes in a number of
accounting variables around CEO turnover. These authors argue that changes around turnovers are mainly
driven by poor firm performance. Another closely related study is Weisbach (1995), which considers a
sample of large acquisitions, and finds that the likelihood of divesting poorly performing deals to be
unusually high immediately following CEO turnover.2 Our study complements these earlier studies,
documenting systematic patterns in disinvestment and investment over the CEO cycle, and provides
additional evidence on the reasons why this cycle occurs.
2. Data
2.1. CEO Turnover and Tenure
2 Even though it was an abnormally high rate of divestitures, Weisbach (1995) had only 10 deals that were divested
subsequent to turnovers (see Table 7 of Weisbach (1995)).

6
Our sample includes 5,420 CEO turnovers in 2,991 firms between 1980 and 2009. We identify
CEOs based on the information in the ExecuComp database. We use the information on job title, the year
becoming CEO, and the CEO annual flag provided in ExecuComp to identify CEOs at the firm-year level.
For each firm, we compare the designated CEO in each fiscal year with the CEO in the previous year to
identify whether there is a CEO turnover in that year.
Panel A of Table 1 describes the distribution of turnovers over time. Although ExecComp’s
coverage starts in 1992, some of the CEOs in the database took office before 1992, leading to some CEO
turnovers from the 1980s being in our sample. For each new CEO, the variable “Tenure” equals 0 for the
fiscal year in which the CEO takes office, and increases with each year the CEO is in office. The average
CEO tenure length (including the turnover year) is about seven years and the median is six years. The
average age of the incoming CEO at the time of turnover is 51.
To interpret the relation between firm investment (disinvestment, growth) and CEO tenure, it is
important for us to understand the reasons for CEO turnovers. It is usually not possible to know the
reason for any particular departure with complete certainty. However, we can still identify turnovers that
are likely to be regular, “exogenous” turnovers, which, according to the interviews in Vancil (1987) (p.
82-83), constitute the vast majority of turnovers. One group of turnovers that are likely to be exogenously
occurring is those caused by illness, death, or retirement of the departing CEOs. We use Factiva news
search to identify such a subsample of likely exogenous turnovers. 3 To mitigate the incidence of
“suspicious retirements”, we additionally require that the firm’s stock performance in the year prior to the
turnover be above the industry-year median for the turnover to be classified as due to retirement.
A second group of turnovers that are likely to be exogenously occurring are those for which the
CEO change is not accompanied by any shakeup in the top management team. Therefore, we consider the
subsample for which the top four most highly paid non-CEO executives do not change in the year when
the CEO is changed. Third, because forced turnovers tend to be preceded by high stock return volatility or
3 We thank Edward Fee, Charles Hadlock, and Joshua Pierce for kindly providing us with the classification of
illness, death related, and outright forced turnovers.
7
poor stock and accounting performances, we consider turnovers that are preceded by both good
performance (both stock return and ROA above industry-year median) as well as low idiosyncratic
volatility (below industry-year median). Finally, we use the Factiva news search to identify turnovers that
appear to be overtly forced (e.g., Factiva reported that the CEO was forced to leave or left under pressure).
Panel A of Table 1 reports the number of turnovers in each subsample. We have 130 turnovers
occurring because of death or health issues of outgoing CEOs, 211 because of death or health issues or
retirements following good performance, 1032 turnovers that are not accompanied by top management
shakeups, and 880 turnovers preceded by good performance and low volatility. The union of these
subsamples accounts for 34% of the entire turnover sample. Pan, Wang, and Weisbach (2013) document
that there is no abnormal performance or return volatility prior to these subsamples of turnovers. In
contrast, outright forced turnovers (319 of them) represent only 6% of the turnover sample, and exhibit
significantly lower industry-adjusted return as well as higher industry-adjusted return volatility in the 12
months prior to the turnover. The turnovers that do not fall into any one of the “likely exogenous”
subsamples or the outright forced subsample comprise the remaining 60% of the sample; Pan, Wang, and
Weisbach (2013) show that in terms of pre-turnover stock performance and volatility, these turnovers are
more similar to the turnovers that we have identified as unlikely to be performance-driven than to the
turnovers identified as forced.
2.2. Corporate Disinvestment
To identify corporate disinvestment activities in a given fiscal year, we use data on both
discontinued operations from COMPUSTAT and asset sales from SDC Platinum Mergers & Acquisitions
Database. We consider the firm to have discontinued operations (“I{discontinued operations>0}”=1) if the firm
reports income or loss from discontinued operations ( “DO” in COMPUSTAT), and asset sales (“I{asset
sales>0}”=1) if the firm is indicated by SDC as the target company in transactions of “Acquisitions of Assets”
or “Acquisitions of Certain Assets”. Panel B of Table 1 reports that about 9% of the firm-year
8
observations have asset sales, about 16% have discontinued operations, and 21% have at least one of
these types of disinvestment activities.4
An alternative way to identify disinvestment activities is to use corporate announcements
obtained from the “Key Developments” database from the Capital IQ database (coverage starting in
2001): “Event 1” contains announcements of “Seeking to Sell/Divest” and “Event 21” captures
announcements related to “Discontinued Operation/Downsizing”.5 Based on the announcement date of
each event provided by Capital IQ, we define a monthly disinvestment indicator variable I{ downsizing
announcement(s) in the month} that equals one if the company announces either Event 1 or Event 21 or both in a
month. Panel B of Table 1 documents that 4% of firm-months contain disinvestment announcements.
Further, we use information from COMPUSTAT “historical segment” data to measure the
divestiture or discontinuation of investments at the segment level. We start with all operating/business
segments with positive sales over the sample period, and track them through time using the unique
segment ID provided by COMPUSTAT. We identify divestitures or discontinuations of segments (I{ segment
termination}=1) when a distinct segment ID disappears in a particular year and does not reappear in the
sample subsequently. The likelihood a segment will be terminated in a particular years is about 10%. We
measure segment performance using segment-year level operating profit/loss scaled by sales.6
2.3. Corporate Investment
We consider two major forms of corporate investment: capital expenditures and acquisitions.
Since firms always have some investment in every year, we focus on the magnitude of investment rather
than its existence. We define Capx Rate as capital expenditures scaled by the net value of the firm’s
property, plants, and equipment (PP&E) at the beginning of the year, and Acquisition Rate as the value of
acquisitions scaled by the net value of PP&E at the beginning of the year. Acquisitions include completed
4 In a previous draft we also measure the magnitude of disinvestment as the sum of the value of asset sales and the
value of discontinued operations scaled by lagged PP&E. Conditional on disinvestment occurring, the average
disinvestment rate is 23%, and the median is 5%. 5 Both Event 1 and Event 21 appear to capture ongoing or intended disinvestment activities. Sample headlines for
these events: “ADC Telecommunications to close LeSueur facility”; “BSQUARE Corp. intends to close its
information division in San Diego”. 6 The COMPUSTAT segment data has its limitations (see Maksimovic and Philips (2007)). However, these
limitations are unlikely to be systematically correlated with CEO tenure.
9
deals covered in the SDC database, either acquisition of assets or equity interests. For each sample firm,
we include both domestic and international acquisitions with disclosed transaction values above $1
million over the sample period.7 Investment Rate is defined to be the sum of Capx Rate and Acquisition
Rate. Panel B of Table 1 reports that the average Capx Rate is 33% (median 20%), the average
Acquisition Rate is 34% (median 0%), the average total Investment Rate is 67% (median 24%).
We also examine the intensity of corporate announcements about expansion or acquisition over
CEO tenure. The business expansion news includes “Event 3” (“Seeking Acquisitions/ Investment”) and
“Event 31” (“Business Expansion”) from the “Key Developments” database from Capital IQ. We further
augment these announcements with the acquisition announcements from the SDC Platinum. Based on the
announcement date of each event, we define a monthly investment indicator variable I{ investment announcement(s)
in the month} that equals one if the company has either expansion or acquisition announcements in the month.
Panel B of Table 1 documents that 8% of firm-months contain investment announcements.
Further, we identify new business units by examining whether a new segment ID appears in a
given year (provided it is not the first year the company appears in the segment data base) and exists for at
least 2 years. About 16% of our firm-segment-year observations consist of newly initiated segments.
We also measure the combined effect of disinvestment and investment on a firm. Since both
disinvestment and investment can affect the size of the firm’s physical asset and labor, we construct Asset
Growth Rate as the annual growth rate of the firm’s book assets and Employment Growth Rate as the
annual growth rate in the number of employees. The average Asset Growth Rate is about 20%, although
the median is only 7.6%. The average Employment Growth Rate is 9.4%, and the median is 3%.
2.4. Other Firm Characteristics
To control for other factors that potentially affect investment or disinvestment intensity, we also
include a set of firm characteristics in our econometric specifications. Panel C of Table 1 contains
summary statistics of these variables. The average firm in our sample is about 19 years old, has book
7 We exclude leveraged buyouts, exchange offers, repurchases, spinoffs, minority stake purchases, recapitalizations,
self-tenders, and privatizations.
10
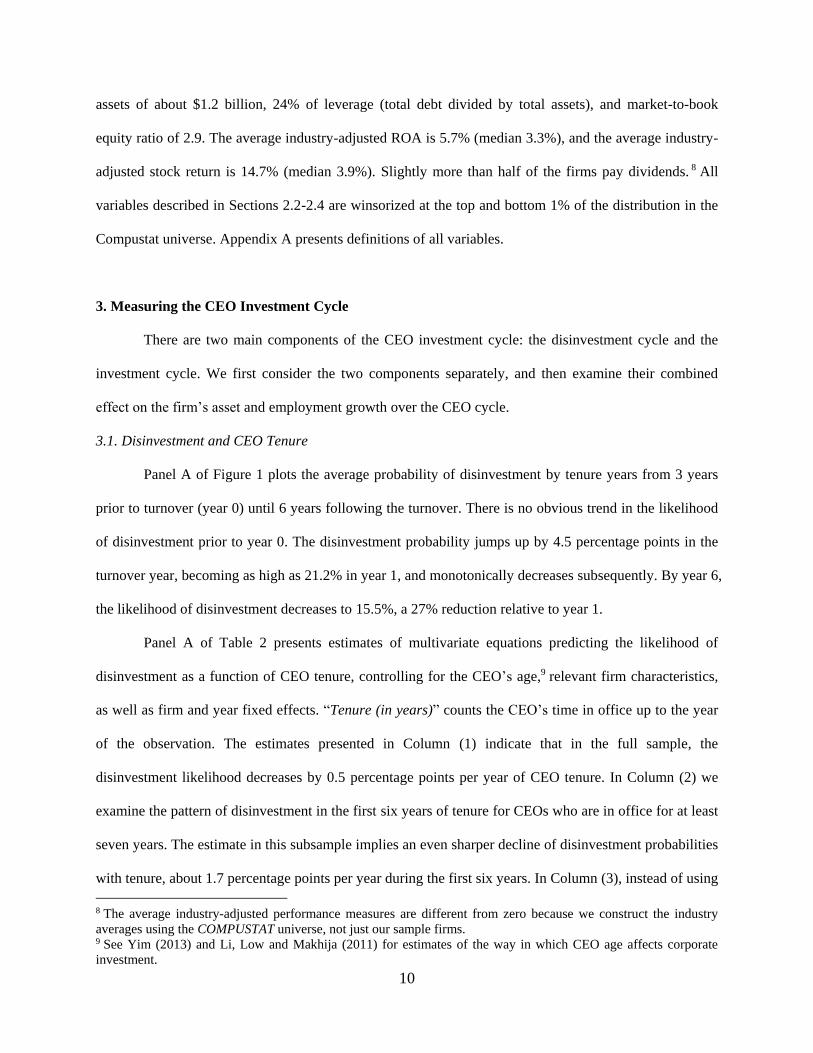
assets of about $1.2 billion, 24% of leverage (total debt divided by total assets), and market-to-book
equity ratio of 2.9. The average industry-adjusted ROA is 5.7% (median 3.3%), and the average industry-
adjusted stock return is 14.7% (median 3.9%). Slightly more than half of the firms pay dividends. 8 All
variables described in Sections 2.2-2.4 are winsorized at the top and bottom 1% of the distribution in the
Compustat universe. Appendix A presents definitions of all variables.
3. Measuring the CEO Investment Cycle
There are two main components of the CEO investment cycle: the disinvestment cycle and the
investment cycle. We first consider the two components separately, and then examine their combined
effect on the firm’s asset and employment growth over the CEO cycle.
3.1. Disinvestment and CEO Tenure
Panel A of Figure 1 plots the average probability of disinvestment by tenure years from 3 years
prior to turnover (year 0) until 6 years following the turnover. There is no obvious trend in the likelihood
of disinvestment prior to year 0. The disinvestment probability jumps up by 4.5 percentage points in the
turnover year, becoming as high as 21.2% in year 1, and monotonically decreases subsequently. By year 6,
the likelihood of disinvestment decreases to 15.5%, a 27% reduction relative to year 1.
Panel A of Table 2 presents estimates of multivariate equations predicting the likelihood of
disinvestment as a function of CEO tenure, controlling for the CEO’s age,9 relevant firm characteristics,
as well as firm and year fixed effects. “Tenure (in years)” counts the CEO’s time in office up to the year
of the observation. The estimates presented in Column (1) indicate that in the full sample, the
disinvestment likelihood decreases by 0.5 percentage points per year of CEO tenure. In Column (2) we
examine the pattern of disinvestment in the first six years of tenure for CEOs who are in office for at least
seven years. The estimate in this subsample implies an even sharper decline of disinvestment probabilities
with tenure, about 1.7 percentage points per year during the first six years. In Column (3), instead of using
8 The average industry-adjusted performance measures are different from zero because we construct the industry
averages using the COMPUSTAT universe, not just our sample firms. 9 See Yim (2013) and Li, Low and Makhija (2011) for estimates of the way in which CEO age affects corporate
investment.
11
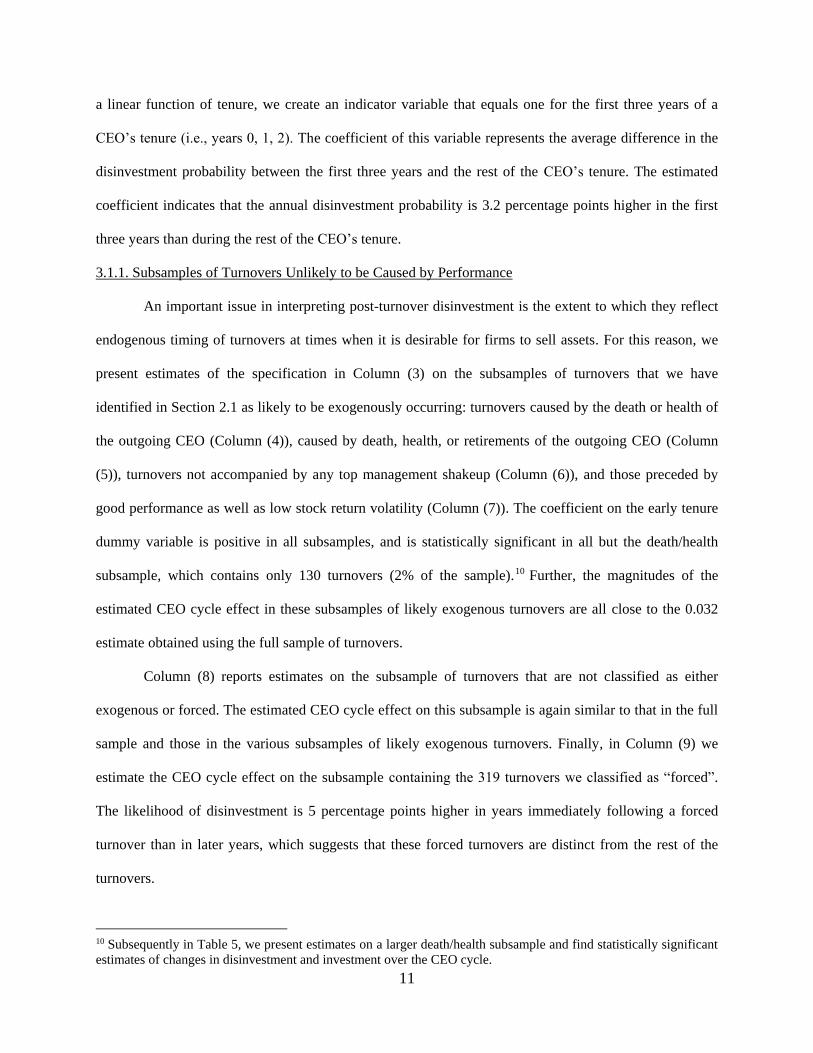
a linear function of tenure, we create an indicator variable that equals one for the first three years of a
CEO’s tenure (i.e., years 0, 1, 2). The coefficient of this variable represents the average difference in the
disinvestment probability between the first three years and the rest of the CEO’s tenure. The estimated
coefficient indicates that the annual disinvestment probability is 3.2 percentage points higher in the first
three years than during the rest of the CEO’s tenure.
3.1.1. Subsamples of Turnovers Unlikely to be Caused by Performance
An important issue in interpreting post-turnover disinvestment is the extent to which they reflect
endogenous timing of turnovers at times when it is desirable for firms to sell assets. For this reason, we
present estimates of the specification in Column (3) on the subsamples of turnovers that we have
identified in Section 2.1 as likely to be exogenously occurring: turnovers caused by the death or health of
the outgoing CEO (Column (4)), caused by death, health, or retirements of the outgoing CEO (Column
(5)), turnovers not accompanied by any top management shakeup (Column (6)), and those preceded by
good performance as well as low stock return volatility (Column (7)). The coefficient on the early tenure
dummy variable is positive in all subsamples, and is statistically significant in all but the death/health
subsample, which contains only 130 turnovers (2% of the sample).10 Further, the magnitudes of the
estimated CEO cycle effect in these subsamples of likely exogenous turnovers are all close to the 0.032
estimate obtained using the full sample of turnovers.
Column (8) reports estimates on the subsample of turnovers that are not classified as either
exogenous or forced. The estimated CEO cycle effect on this subsample is again similar to that in the full
sample and those in the various subsamples of likely exogenous turnovers. Finally, in Column (9) we
estimate the CEO cycle effect on the subsample containing the 319 turnovers we classified as “forced”.
The likelihood of disinvestment is 5 percentage points higher in years immediately following a forced
turnover than in later years, which suggests that these forced turnovers are distinct from the rest of the
turnovers.
10 Subsequently in Table 5, we present estimates on a larger death/health subsample and find statistically significant
estimates of changes in disinvestment and investment over the CEO cycle.

12
Overall, these results suggest that changes in investment over the CEO cycle are unlikely to be
driven by the endogenous timing of CEO turnovers.
3.1.2. Alternative measures of disinvestment
We next estimate the likelihood of corporate disinvestment using two different data sources:
corporate announcements of downsizing and segment termination. The results using corporate
announcements are presented in Columns (1) and (2) of Panel B of Table 2, and are consistent with the
results reported in Panel A using financial statement information. The likelihood of a company
announcing a disinvestment in a particular month is about 1 percentage point higher on average in the
first 24 months than during the rest of the tenure. The same pattern holds after turnovers due to death,
illness or retirement of the outgoing CEO.
In Columns (3) and (4) of Panel B of Table 2, we estimate the likelihood that a segment is
terminated in a particular year. In addition to firm-level controls, we also include a set of segment-level
controls such as a measure of segment performance (whether the segment operating profit/loss over sales
is in the bottom 10% of the sample distribution), the number of segments in the firm, and the segment age.
Consistent with the earlier findings, the probability of terminating a segment is significantly higher in the
early years of a CEO’s tenure than in his later years.
3.2. Investment and CEO Tenure
We next consider the way in which corporate investment varies with CEO tenure. Panel B of
Figure 1 reports the median investment rate by tenure year. Again, this figure suggests that there is no
obvious declining trend in the investment rate prior to the CEO turnover. During the turnover year,
however, the investment rate drops by more than three percentage points and increases over CEO tenure.
The total investment rate, which is defined as the sum of capital expenditures and acquisition values
divided by the lagged capital stock, increases from 20.5% in year 0 to 25.5% in year 6, a 24.4% increase.
In Panel A of Table 3, we estimate equations predicting the investment rate as a function of CEO
tenure, controlling for firm characteristics that potentially affect investment. We first include tenure
linearly and use the full sample of turnovers in Column (1), and then the first 6 years for CEOs that stayed
13
on the job for at least 7 years in Column (2). In each case, the coefficient on tenure is positive and
statistically significant, implying that investment increases over the CEO’s tenure. The coefficient is
substantially larger for long-term CEOs in Column (2), suggesting that the result is not driven by CEOs
who invest little initially and then are soon out of office.
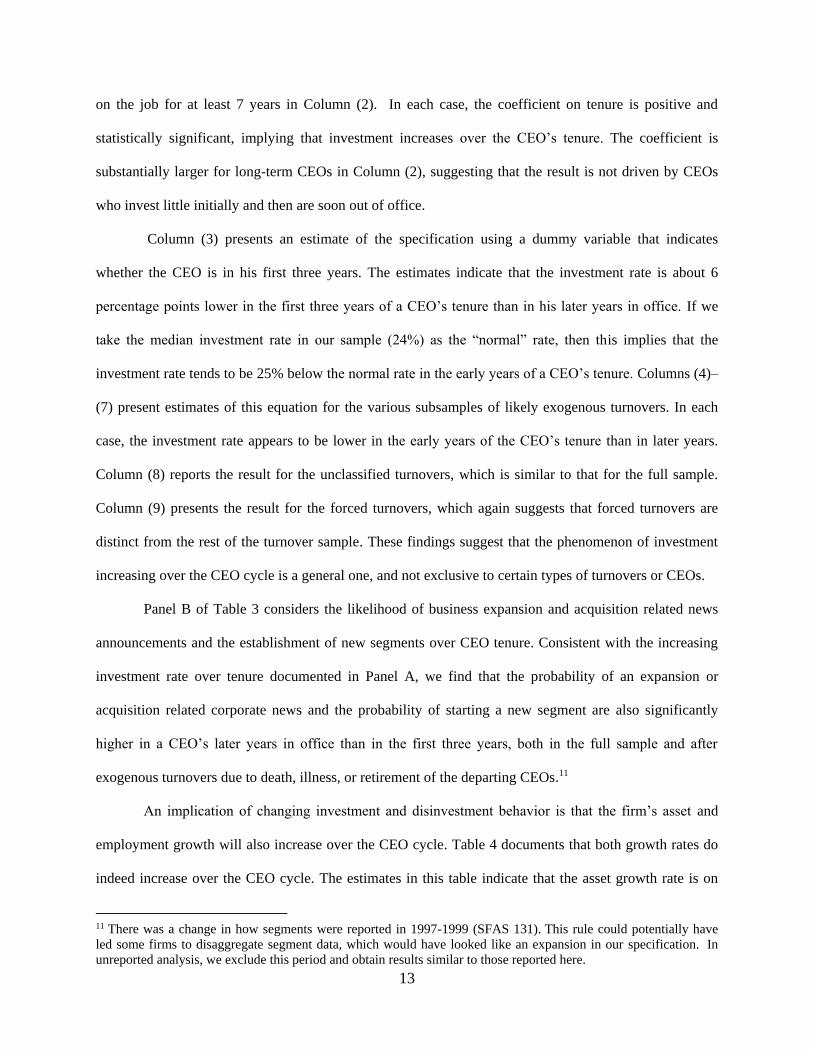
Column (3) presents an estimate of the specification using a dummy variable that indicates
whether the CEO is in his first three years. The estimates indicate that the investment rate is about 6
percentage points lower in the first three years of a CEO’s tenure than in his later years in office. If we
take the median investment rate in our sample (24%) as the “normal” rate, then this implies that the
investment rate tends to be 25% below the normal rate in the early years of a CEO’s tenure. Columns (4)–
(7) present estimates of this equation for the various subsamples of likely exogenous turnovers. In each
case, the investment rate appears to be lower in the early years of the CEO’s tenure than in later years.
Column (8) reports the result for the unclassified turnovers, which is similar to that for the full sample.
Column (9) presents the result for the forced turnovers, which again suggests that forced turnovers are
distinct from the rest of the turnover sample. These findings suggest that the phenomenon of investment
increasing over the CEO cycle is a general one, and not exclusive to certain types of turnovers or CEOs.
Panel B of Table 3 considers the likelihood of business expansion and acquisition related news
announcements and the establishment of new segments over CEO tenure. Consistent with the increasing
investment rate over tenure documented in Panel A, we find that the probability of an expansion or
acquisition related corporate news and the probability of starting a new segment are also significantly
higher in a CEO’s later years in office than in the first three years, both in the full sample and after
exogenous turnovers due to death, illness, or retirement of the departing CEOs.11
An implication of changing investment and disinvestment behavior is that the firm’s asset and
employment growth will also increase over the CEO cycle. Table 4 documents that both growth rates do
indeed increase over the CEO cycle. The estimates in this table indicate that the asset growth rate is on
11 There was a change in how segments were reported in 1997-1999 (SFAS 131). This rule could potentially have
led some firms to disaggregate segment data, which would have looked like an expansion in our specification. In
unreported analysis, we exclude this period and obtain results similar to those reported here.
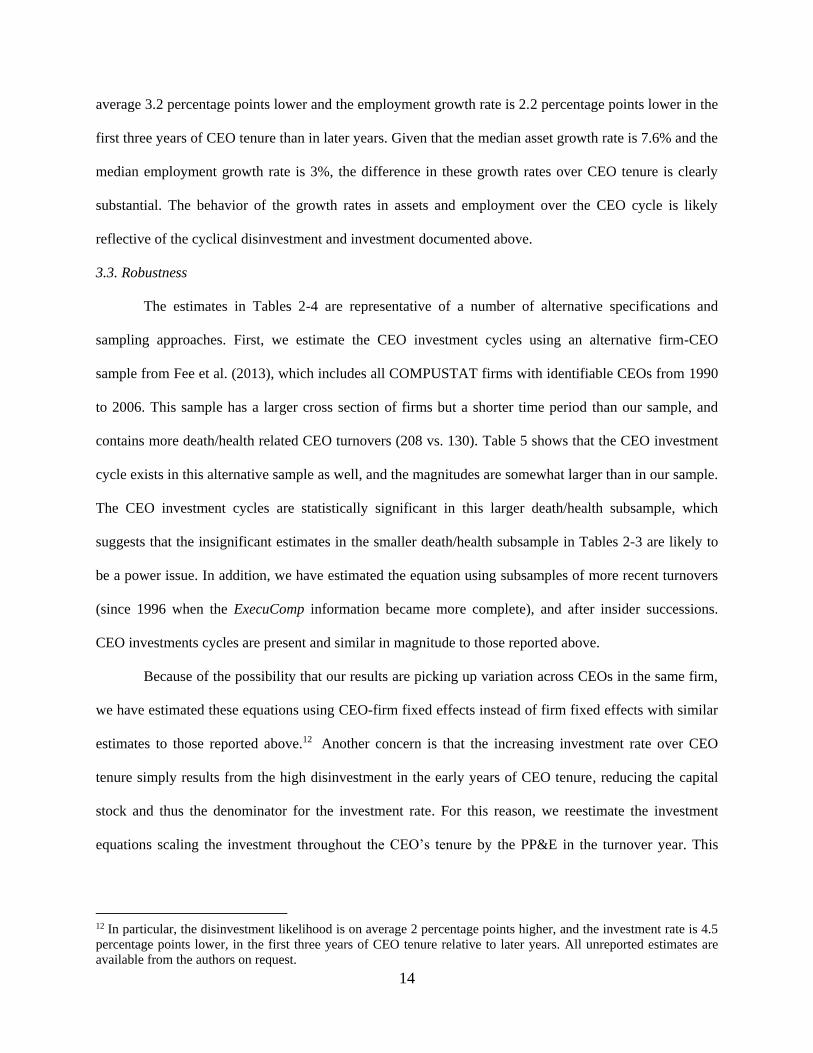
14
average 3.2 percentage points lower and the employment growth rate is 2.2 percentage points lower in the
first three years of CEO tenure than in later years. Given that the median asset growth rate is 7.6% and the
median employment growth rate is 3%, the difference in these growth rates over CEO tenure is clearly
substantial. The behavior of the growth rates in assets and employment over the CEO cycle is likely
reflective of the cyclical disinvestment and investment documented above.
3.3. Robustness
The estimates in Tables 2-4 are representative of a number of alternative specifications and
sampling approaches. First, we estimate the CEO investment cycles using an alternative firm-CEO
sample from Fee et al. (2013), which includes all COMPUSTAT firms with identifiable CEOs from 1990
to 2006. This sample has a larger cross section of firms but a shorter time period than our sample, and
contains more death/health related CEO turnovers (208 vs. 130). Table 5 shows that the CEO investment
cycle exists in this alternative sample as well, and the magnitudes are somewhat larger than in our sample.
The CEO investment cycles are statistically significant in this larger death/health subsample, which
suggests that the insignificant estimates in the smaller death/health subsample in Tables 2-3 are likely to
be a power issue. In addition, we have estimated the equation using subsamples of more recent turnovers
(since 1996 when the ExecuComp information became more complete), and after insider successions.
CEO investments cycles are present and similar in magnitude to those reported above.
Because of the possibility that our results are picking up variation across CEOs in the same firm,
we have estimated these equations using CEO-firm fixed effects instead of firm fixed effects with similar
estimates to those reported above.12 Another concern is that the increasing investment rate over CEO
tenure simply results from the high disinvestment in the early years of CEO tenure, reducing the capital
stock and thus the denominator for the investment rate. For this reason, we reestimate the investment
equations scaling the investment throughout the CEO’s tenure by the PP&E in the turnover year. This
12 In particular, the disinvestment likelihood is on average 2 percentage points higher, and the investment rate is 4.5
percentage points lower, in the first three years of CEO tenure relative to later years. All unreported estimates are
available from the authors on request.

15
specification leads to an investment level that increases at a faster rate over the CEO cycle than the
estimates reported above.
3.4. Benchmarking the Magnitude of the CEO Investment Cycle
The CEO investment cycle leads to variation in investment likely caused by forces internal to the
firm. As a benchmark to assess the magnitude of the CEO investment cycle, it is useful to compare its
size to estimates of other factors that are known to affect investment. In particular, the literature has
argued that external factors such as the business cycle, political uncertainty due to the election cycle and
financial constraints can affect a firm’s investment. Appendix B surveys estimates of the extent to which
these factors affect investment. To estimate the effect of business cycles on investment, we re-estimate
equations from Tables 2-4, including an indicator variable for recession years. These estimates are
presented in Appendix Table B. For estimates of the effect of political uncertainty on investment, we rely
on Julio and Yook (2012), and for estimates of the effect of financial constraints on investment, on Ball,
Hoberg and Maksimovic (2013). The detailed discussion is in Appendix B.
Because each of the comparison studies normalizes investment differently, we re-estimate the
CEO cycle effect using three different definitions of investment rate: capital expenditures over lagged
PPE, over lagged book assets, and over sales, and then compare the effect of the CEO cycle to these other
factors. The estimates are summarized in Table 6. They indicate that the incremental effect on investment
from being in a CEO’s first 3 years is approximately the same as being in recession or facing financial
constraints during the latest financial crisis, and more than twice the effect of being in an election year.
These numbers suggest that the effect of the CEO investment cycle is substantial in magnitude,
comparable to other factors that are commonly accepted to be important determinants of investment.
4. Potential Reasons for the CEO Investment Cycle
Because the CEO investment cycle is substantial in magnitude and present in public firms
regardless of the circumstances of the turnover, it is important to consider the alternative theories that
could explain the existence of this cycle and to distinguish between them empirically. One view that
16
clearly does not explain the CEO investment cycle is the traditional economic view of the firm as a
collection of physical assets that always chooses profit-maximizing actions. Since management plays no
role, this view implies that firm investment and growth should not depend on the CEO’s time in office.
To explain the CEO investment cycle, one must incorporate an explicit role for management, and
the CEO in particular. There are two main ways in which one could do so: first, management can be
thought of as being entrusted by the owners to make the decisions about the firm’s activities. However,
since managers are themselves self-interested, CEO will sometimes make decisions that maximize his
utility rather than firm value. As we discuss below, such non-value-maximization leads naturally to an
agency-based explanation for the CEO investment cycle. Second, the manager himself can be viewed as
an asset, who provides skills to the firm that can be used to maximize profits. If a new CEO arrives with a
different set of skills than his predecessor, it could be optimal for the firm to change its assets so as to
better complement the new CEO’s skills. These views are not mutually exclusive and both probably are
relevant to some extent. To evaluate their relative importance, we discuss the implications of each for the
CEO investment cycle and test these predictions on our sample.
4.1. Management as a Decision-Making Agent: Implications for the CEO Investment Cycle
One explanation for high disinvestment shortly after turnover is that post-turnover divestitures
reflect the departing CEOs’ reluctance to divest bad investments that they have made. There are several
reasons why a CEO would knowingly hold onto poorly performing assets that they personally were
responsible for establishing. First, the CEO could extract private benefits from these assets at the expense
of the shareholders.13 Second, a divestiture could be viewed as essentially an admission of a mistake and
reflect poorly on the CEO (e.g., Kanodia, Bushman, and Dickhaut (1989) and Boot (1992)). When
management changes, the new managers do not necessarily enjoy the same private benefits from these
assets and are less averse to admitting their predecessors’ mistakes.
13 Discussion of private benefits of control goes back at least to Berle and Means (1932) and private benefits have
become a key element of many models of corporate governance (see Tirole (2006), pp. 16-17 for example).
17
In addition, it is possible that the incoming managers could sell assets that are generating losses,
even if they are worth more to the firm than to a potential buyer, so as to attribute blame for the asset’s
poor performance on the outgoing management. This phenomenon is commonly referred to in the
accounting literature as the “Big Bath” hypothesis, and implies that the agency problem is with the
incoming rather than the outgoing managers.14
These agency-based explanations for post-turnover divestitures predict that the new management
is likely to sell poorly performing assets at a higher rate than the incumbent management, even if the
incumbent CEO leaves for reasons unrelated to performance. There are two additional testable
implications of the agency view of post-turnover disinvestment:
Implication 1: Performance of divested assets. The assets that are sold after turnover should have
performed poorly, and the poor performance should be due to mismanagement or a bad fit with the firm
rather than exogenous productivity shocks.
Implication 2: Influence of outgoing management. The influence that the old management has on
the new CEO after turnover should affect his willingness to sell the assets subsequent to the turnover.
When outgoing management has more influence on the new CEO, there should be fewer divestitures
following CEO turnover.
The view of management as a decision-making agent also has implications for the latter part of
the CEO Cycle, in which investment increases. For many reasons, CEOs usually prefer to grow their
firms rather than to shrink them. CEOs’ pay and prestige are generally positively correlated with firm size,
adding units that diversify their firms can lower the risk of their personal financial positions in the firm
and their human capital, they can purchase “glamorous” divisions that are fun to manage, they can create
new positions for favorite employees through growth, or they could have “hubris” and overestimate their
14 Observationally equivalent to the agency interpretation of these patterns is a behavioral one. In particular,
outgoing management could have a “sunk cost fallacy” or “escalation of commitment bias” and refuse to recognize
that their investments are not performing well. This behavioral bias has been used to explain the increased write-off
of bad loans after loan officer turnovers (Staw et al. (1997)) and the increased sale of poorly-performing stocks after
mutual fund manager turnovers (Jin and Scherbina (2011)).
18
ability to add value to a line of business.15 These arguments imply that a CEO’s preferences for growth
could differ from those of the shareholders. Consequently, the factors that constrain management from
taking as many investments as it wants are important contractual elements of the firm. For example,
Jensen (1986) focuses on the role of debt in constraining managers’ propensity to overinvest. Another
source of constraints on management’s ability to invest as it chooses is the board of directors.
The board of directors is particularly relevant for understanding CEO investment cycles, since the
CEO’s influence over the board is likely to increase over time. As emphasized by Hermalin and Weisbach
(1998), so long as a CEO is infra-marginal relative to a potential replacement, he will have some
influence over the director selection process and will have incentives to use this influence to appoint
directors who are less likely to oppose his will. Over time, boards will evolve towards ones that are loyal
to the CEOs that appoint them, and thus less likely to constrain the CEOs from undertaking whichever
investments they want. Therefore, the dynamics of the board and its loyalty to the CEO, together with the
CEO’s preference for investments even if they are not value-maximizing, could potentially lead to the
increase in investment with CEO tenure that we document in Table 3.
Implication 3: CEO power and investment. Holding other factors constant, the increase in
investment over CEO tenure should come through the CEO’s control over the board of directors.
Therefore, controlling for the CEO’s influence on the board should lessen the estimated effect of CEO
tenure on investment. In addition, the agency argument predicts that the quality of firms’ investments
should decrease with the CEO’s tenure, and also be related to the CEO’s control of the board.
This view of the CEO as a decision-making agent who sometimes puts his personal agenda ahead
of the firm’s, can therefore explain both portions of the CEO investment cycle. When a new CEO takes
office, he will tend to disinvest poorly performing assets established by the predecessor. As the CEO
become more powerful over time, he will have more sway over his board and will be able to undertake
15 The literature arguing that managers tend to build “empires” is enormous and dates back to Baumol (1959),
Marris (1964), Williamson (1964), and Donaldson (1984). See also Roll (1986), Morck, Shleifer and Vishny (1990),
and Jensen (1993).
19
investments that maximize his own utility, which will be more likely than other investments to be
divested by the next CEO.
A related behavioral managerial explanation for the increase in investment over tenure comes
from the idea that, instead of having preferences that are different from the shareholders’, the manager’s
misperceptions could change over his tenure. In particular, it has been argued that a CEO’s
overconfidence is likely to grow over time (see Gervais and Odean (2001)). This explanation predicts that
the quantity of a firm’s investments will increase with tenure and the quality will decrease, similar to the
agency arguments. To differentiate this hypothesis from the agency hypothesis, we utilize exogenous
variation in the CEO’s control of the board, which is unlikely to be related to the CEO’s overconfidence.
4.2. Management as an Asset: Implications for the CEO investment Cycle
In contrast to agency-based reasons, a model such as Maksimovic and Phillips (2002) provides a
skill-based explanation for the high disinvestment rate following management changes in which
investment is always at the first-best level. In this model, conglomerate firms choose their asset structure
based on the relative productivity of its business segments, which in turn depends on the CEO’s relative
skill in managing assets in different industries. In such a world, if the CEO changes and the incoming
CEO has different skills from the outgoing one, then it is possible that the optimal set of assets the firm
should own will change, leading to divestitures.
The skill-based arguments do not predict that divested units should have unusually bad
performance beyond being hit by negative shocks outside of the management’s control, because the firm
should be the optimal owner of the asset prior to the CEO change. Instead, these arguments imply that
post-turnover divestitures reflect the change in the skills of the outgoing and incoming CEOs. Therefore,
the prior performance of the divested assets, once productivity shocks are controlled for, provides a way
to distinguish between the explanations for the post-turnover disinvestment. Further, the Maksimovic and
Phillips (2002) model also does not predict that the residual influence of the old CEO on the new CEO
should matter for the firm’s asset structure choice after the turnover. Instead, applying the Maksimovic
and Phillips (2002) logic to CEO turnover has the following implication:
20
Implication 4: Fit of the new CEO’s skill to firm assets. Holding other factors constant, the more
that the new CEO’s skills differ from the firm’s current asset structure, the more divestitures will be
observed after CEO turnover.
In contrast to the agency arguments, the arguments based on differing CEO skills do not predict
increasing investment over CEO tenure, nor do they predict that the CEO’s control of the board should
explain the investment over CEO tenure. They do predict that a new CEO will increase investment in
segments that he has comparative advantage in managing, but not that the quantity of investment should
increase and the quality decrease over his career. Because the existing skill-based theories are static, they
have no predictions about the dynamics of investment and growth over the entire CEO career.
In addition, there are also several other non-agency-based reasons that potentially explain the
observed increase in investment over CEO tenure. First, the CEO’s time in office could reflect the CEO’s
ability (either innate or learned on the job) or the firm’s prospects. Second, it is possible that investors are
reluctant to provide capital to a firm for which they know little about the firm’s new management (like a
new asset), and such reluctance decreases as the CEO and his team stay in office for longer time. A way
to differentiate these alternative explanations from the agency explanation described above is to examine
the quality of the firm’s investments over time: The agency explanation predicts that the firm’s
investment quality should decline over CEO tenure, while these alternative explanations predict that it
should be increasing (or at least non-decreasing) with the CEO’s tenure.
5. Distinguishing between Explanations for CEO Investment Cycles
5.1. Performance of Divested Assets After Turnover
To evaluate the performance of the divested assets, we rely on COMPUSTAT (historical) segment
data, which offers two advantages over other potential data sources. First, these data allow us to identify
the CEO and year when a segment is established and when it is divested or discontinued. Second, they
allow us to capture industry- or firm-specific shocks that could affect disinvestment intensity by including
(segment) industry-year or firm-year fixed effects. The inclusion of these fixed effects implies that any
21
measured segment underperformance does not occur because of industry-wide or firm-specific economic
shocks, but instead reflects (idiosyncratic) decisions by the previous management.
The agency explanation for disinvestment implies that the post-turnover divestiture is
concentrated in assets with very poor performance, i.e., assets that likely reflect mistakes by the prior
leadership. For this reason, we define “Underperforming Segment” to be an indicator variable equal to
one if a segment has lagged industry-adjusted profitability in the bottom 10% of the sample distribution.16
In addition, “Original CEO Replaced” is an indicator variable that equals one for all firm-year
observations after the CEO who established the segment steps down. We use these two indicator variables
as well as their interaction to predict the likelihood that a given segment is terminated in a given year. We
also control for the segment’s age and the segment’s industry shocks or firm-specific shocks by including
industry-year or firm-year fixed effects. This specification allows us to evaluate Implication 1, which
suggests that the coefficient on the interaction term should be positive. In contrast, the skill-based
arguments imply that the main predictor of segment termination should be the direct effect of CEO
turnover and not the interaction effect with segment performance.
Panel A of Table 7 contains estimates of this equation both for the full sample and the subsample
of turnovers due to death, illness, or retirement of the departing CEOs. The results indicate that CEO
turnover and unusually poor segment performance do not lead to higher disinvestment individually, but
the interaction of the two does. This positive coefficient implies that CEO turnover facilitates the
disinvestment of poorly performing units established by the previous leadership. Since only substantially
underperforming segments established by the previous management are divested at an abnormally high
rate following CEO turnover, post-turnover disinvestment does not appear to reflect the change in the
CEOs’ skill. In addition, because we control for industry-specific shocks in Columns (1) and (3) and firm-
specific shocks in Columns (2) and (4), the poor segment performance likely reflects mismanagement by
the previous leadership rather than exogenous shocks to segment productivity.
16 The results are similar under different threshold choices such as the bottom 5% or bottom 15%.

22
5.2. The Influence of the Outgoing Management
To evaluate Implication 2, we construct four measures of the residual influence of the previous
CEO (or management) on the new CEO. We define “Old CEO Stays As Chairman” to be a dummy
variable equaling one if the outgoing CEO serves as the Chairman of the Board during the first year of the
new CEO’s tenure,“% of Old Mgmt. On Board” as the fraction of the four most highly paid non-CEO
executives under the previous management who sit on the board after turnover, “Outsider New CEO” as
a dummy variable equaling one if the new CEO comes from outside the company,17 and “Staggered
Board” as a dummy variable equaling one if the company has a staggered board.
We estimate the extent to which these variables affect the likelihood that the underperforming
segments established by the departing CEO get terminated in the first three years of the new CEO’s
tenure. Panel B of Table 7 reports estimates of these equations. The results suggest that when there is a
strong residual influence from the prior leadership -- the old CEO stays as the chairman of the board,
when more executives from the previous leadership remain on the board, when the new CEO is an insider,
and when the firm has a staggered board -- there is less disinvestment after the new CEO takes office. The
decisions as to how many executives from the outgoing management team remain on the board, and
whether the company chooses an outside CEO are all endogenously determined and are often related to
firm performance. However, using the segment data allows us to control for industry and firm-specific
performance shocks that potentially affect both disinvestment intensity and segment performance. In
addition, the existence of staggered board is determined historically, rather than at the discretion of the
current management. Thus, the cross-sectional variation in Staggered Board provides relatively
exogenous variation in the residual influence from prior management.
5.3. CEO Power and Investment
5.3.1. The CEO’s Capture of the Board and Investment
17 We classify CEOs who have been with the firm for less than two years when becoming CEO as outsider CEOs,
and the rest as insider CEOs. Based on this classification, about 32% of new CEOs in our sample are considered as
outsider CEOs.

23
To test Implication 3, that the increase in investment over CEO tenure is a function of the CEO’s
growing power over his board, we construct a variable that is likely to be highly correlated with the
CEO’s power over the board as well as his tenure, and evaluate the extent to which this variable explains
the relation between CEO tenure and corporate investment. Specifically, we calculate the fraction of “co-
opted” directors, who are appointed after the CEO takes office (“% of New Directors”). The idea,
formalized in Hermalin and Weisbach (1998), is that the CEO will use his influence to ensure that the
firm appoints directors who are unlikely to oppose any actions he wishes to take. Existing empirical
studies also provide evidence that co-opted boards are indeed associated with less board monitoring.18
We construct this variable using data from RiskMetrics, which provides the starting and ending
years for each director in the S&P 1500 firms during 1996 to 2011. For each firm-year in our sample, we
count the number of directors who start their directorship since the current CEO took office, and scale it
by the total number of directors on the board in that year. By construction, % of New Directors is highly
correlated with the CEO’s time in office: The correlation between the two is 0.68, which is much higher
than the correlations between CEO tenure and other proxies of CEO power (e.g., 0.22 with CEO
ownership, and 0.20 with CEO being Chairman).
In Panel A of Table 8, we test Implication 3 by including % of New Directors in our investment
and disinvestment equations. Even though tenure and % of New Directors are highly correlated with one
another, % of New Directors directly reflects the CEO’s control over the board. Therefore, if the effect of
tenure on investment occurs because of the fact that tenure is correlated with the CEO’s power inside the
firm, then the tenure effect should be picked up by % of New Directors. Alternatively, if there is some
other reason why tenure is related to investment, then estimates of the effect of tenure on investment
should be relatively unaffected by including % of New Directors into the equation.
Columns (1)-(4) of Panel A of Table 8 show that % of New Directors is positively related to both
capital expenditures and acquisitions, and also the asset growth rate. The effect of % of New Directors is
18 Morse et al. (2011) and Coles et al. (2013) document that board cooption is associated with a higher level of
managerial pay, but less incentives provided to managers, and a lower level of turnover-performance sensitivity. In
addition, similar to some of the results reported below, Coles et al. independently find that a firm’s capital
expenditures rate is increasing with the level of the board’s cooption.
24
much stronger on acquisition (0.27) than on capital expenditures (0.07). Large and non-recurring
investments such as acquisitions are more subject to the board scrutiny than routine capital expenditures,
so the larger coefficient on acquisitions suggests that our measure indeed reflects the CEO’s capture of
the board. More important, once we control for % of New Directors, CEO tenure no longer has any effect
on investment, suggesting that the channel through which CEO tenure affects investment is indeed
through the control over the board that the CEO acquires over time.19
In contrast, Columns (5) and (6) show that controlling for % of New Directors does not mitigate
the effect of CEO tenure on the employment growth rate or on disinvestment intensity. The result on
employment growth is puzzling, since the CEO’s preference for growing the firm is likely to be reflected
in the size of both physical capital and labor. One potential explanation is that corporate hiring could be
subject to less board scrutiny than corporate investment. The fact that the increasing CEO capture of the
board over time does not explain the CEO disinvestment cycle is consistent with our hypothesis that the
disinvestment cycle is explained by CEO turnover facilitating error correction and re-optimization than
the CEO’s preference for firm size and growth.20
5.3.2. Instrumental Variable Estimates
So far we have established that the increase in the CEO’s capture of the board explains the
increase in investment over the CEO tenure. One potential concern is that our measure of the CEO’s
capture of the board is endogenous and could depend on the CEO’s ability, or the firm’s performance,
which could be correlated with the level of investment. To address this concern, we follow Fracassi and
Tate (2012) and use the retirement of directors to identify the demand for new directors that is not a
function of the firm’s conditions. Most companies have a mandatory retirement age of 72 for outside
directors (see, e.g., Larcker 2011), and inside directors’ mandatory retirement age is usually around 65.
19 This result is not due to a change of sample period. In the sample with non-missing observations of % of New
Directors, the CEO tenure effect is still significant if we do not control for % of New Directors. 20 In unreported analysis, we find that CEO ownership or CEO being the chairman of the board does not explain the
effect of CEO tenure on investment and disinvestment. We also include all three measures of CEO power in one
equation, and obtain results similar to those reported in Panel A of Table 8. These findings suggest that measures of
growing CEO power over time can better explain the CEO investment cycles than other more static/dichotomous
measures of CEO power.
25
Using these conventions, we count a director departure as retirement if the departing director is an outside
director and is at least 72 years old or is an inside director and is at least 65. Fracassi and Tate (2012)
provide a battery of validity tests for this identification strategy. In particular, they find that director
retirement does not appear to be correlated with firm performance and investment opportunities.21 Our
instrument for % of New Directors is the cumulative number of retired directors since the current CEO
takes office scaled by the board size (“Retired Directors”). The average value of the instrument is 12.4%.
Panel B of Table 8 reports estimates of the instrumental variable specification. The first stage
results as well as the F-statistics indicate that our instrument is positively and significantly related to the
endogenous variable % of New Directors. The second stage results suggest that the exogenous variation
in % of New Directors due to director retirements still leads to more corporate investment and higher firm
growth rate. Consequently, there appears to be a causal effect of growing CEO capture of the board over
time on investment and growth. This result favors the agency-based explanations over the behavioral ones,
because the exogenous variation in CEO’s power over the board should matter for investment in the
agency-based explanations but not behavioral ones.
5.4. Investment Quality over CEO Tenure
An important implication of the agency-based interpretation of the CEO investment cycle is that
the quality of the firm’s investments decreases over the CEO cycle. In Section 5.1, we document that the
segments that are likely to be terminated immediately after CEO turnovers tend to be the bottom
performers in the segments’ industries. The probability of being divested by the new CEO immediately
after turnover provides useful information about the segment’s quality. Panel A of Table 9 documents that
segments established in the later years of a CEO’s tenure are significantly more likely than those
established in the first three years to contribute to post-turnover divestiture (13% vs. 8%). This pattern is
consistent with the argument that investments made in the later years have lower quality than those made
in the earlier years.
21 Larcker (2011) also documents that directors tend to retire voluntarily, and only 2% of director departures occur
because of dismissals or failure to be re-elected.
26
A more direct measure of the quality of the firm’s investments is the stock market reaction to
announcements to the firm’s acquisitions. The quality of acquisitions is relevant to our tests of the agency
hypothesis for two reasons. First, the acquisition rate doubles in the first eight years of CEO tenure,
accounting for a large fraction of the investment increases over the CEO cycle. Second, the existing
literature documents that corporate mergers and acquisitions are often motivated by non-value
maximizing incentives (e.g., Jensen (1993), Grinstein and Hribar (2004), Harford and Li (2007)).
Panel A of Table 9 documents the fraction of acquisitions with negative three-day cumulative
market-adjusted returns around acquisition announcements. During the first 3 years of a CEO’s tenure,
39% of acquisitions have negative announcement returns, while during the later years of his tenure, 58%
do. This pattern suggests that the quality of acquisitions declines with CEO tenure, and more of the deals
made in the later part of the tenure are likely to be non-value maximizing.
Panel B of Table 9 tests this idea more formally, presenting equations predicting the three-day
market-adjusted return to acquisition announcements. The estimates in Column (1) imply that acquisition
returns are on average 20 basis points higher if the acquisition is announced in the first three years of a
CEO’s tenure than in later years, after controlling for deal and firm characteristics. Column (2) shows that
the market reaction is negatively associated with % of New Directors, suggesting that the CEO’s growing
influence over the board is associated with deteriorating acquisition quality. The estimate suggests that if
% of New Directors changes from 0 to 1, then the acquisition announcement return decreases by about 1
percentage point. This drop implies a value decline of $105 million for the average acquirer in our sample
with a market capitalization of $10.5 billion. In Column (3) we include firm-CEO fixed effects, and in
Column (4) we restrict the sample to long-term CEOs who were in office for at least six years. In each
case, the estimated effect of CEO’s control of the board on acquisition announcement returns becomes
even stronger. Column (5) uses Retired Directors as an instrument for the percent of new directors, and
the result suggests the CEO’s growing capture of the board drives the deterioration in the acquisition
quality.
27
Overall, the results in subsections 5.3 and 5.4 are consistent with the view that as a CEO’s power
grows in a firm, he will tend to increase his investment, and that the incremental investments will tend to
be of lower quality. This increase appears to be more related to a direct measure of the CEO’s control of
the board than simply his time in office. The deteriorating investment quality over CEO tenure is not
consistent with the non-agency based views in which a CEO’s time in office reflects the firm’s investment
opportunity, the CEO’s ability, or a potential financing constraint caused by the change of leadership.
CEO overconfidence that increases with tenure is consistent with the quality of investments declining
over tenure, but not with the decrease in quality occurring through the CEO’s control of the board,
particularly the control gained through director retirements.
5.5. The Fit of the New CEO’s Skills with the Firm’s Assets
The evidence so far favor the agency-based explanation for the CEO investment cycles, and are
inconsistent with the skill-based explanation. In this section, we examine a direct implication of the skill-
based explanation that the more that the new CEO’s skills differ from the firm’s current asset structure,
the more divestitures will be observed after CEO turnover.
Ideally, to test Implication 4, one should observe the incoming CEO’s human capital and measure
the extent to which it fits with the firm’s asset structure. However, such a measure requires detailed
information about the CEO’s background and its fit with the firm’s assets. Instead, our approach is to
identify situations in which the new CEO’s skills likely fit (or do not fit) the firm’s assets, and compare
the magnitude of the post-turnover disinvestment in these situations with that in the full sample.
First, CEO departures due to the death, illness, and retirement are likely to be followed by new
CEOs with similar skills as the departing CEOs. This is because by revealed preference the board was
satisfied with the departing CEO and there would be no reason to change the presumably desirable CEO
skills. The fact that we find a similar disinvestment cycle after these turnovers as in the full sample
suggests that the changing management skills are not a main driver of the disinvestment cycle.
Second, unlike conglomerates, single-segment firms provide little opportunity for the new CEO
to divest assets that do not match his skills, since incoming and outgoing CEOs are likely to have

28
relatively similar skill sets (at least relative to conglomerates). Further, if a single-segment firm hires a
company insider or industry insider CEO who possesses firm- or industry-specific skills that match the
current assets, the need to change the asset structure to match the CEO’s skills is likely to be even smaller.
Therefore, Implication 4 suggests that there should be less post-turnover disinvestment in single-segment
firms and even less if these firms hire firm or industry insiders as CEOs.
We classify firms as single-segment using information in the COMPUSTAT historical segment
database. Table 10 presents estimates of the equations from Tables 2 and 3 using the subsample of single-
segment firms. The estimates in Columns (1) and (2) confirm statistically significant CEO investment
cycles for single segment firms, with the cycles’ magnitudes comparable to those for the full sample.
Columns (3) and (4) further restrict the sample to be single-segment firms that hired company or industry
insiders.22 Again, the estimated magnitudes of the CEO investment cycles are similar to those in Columns
(1) and (2) and to those in the full sample. These results are inconsistent with Implication 4 and therefore
the skill-based explanation for the CEO investment cycles.
A variant of the idea in Maksimovic and Phillips (2002) is presented by Eisfeldt and Kuhnen
(2013). In this model, a shock to the productivity of physical capital may change the desired managerial
skills, leading to management turnovers. Thus, CEO turnovers that follow significant industry shocks are
more likely to have incoming CEOs possessing different skills from outgoing CEOs, and are also more
likely to be followed by significant changes in investment and disinvestment. Consequently, this
argument predicts that there should be larger CEO investment cycles when CEO turnovers follow
industry shocks.
However, this argument cannot explain the existence of the CEO investment cycles after
exogenous CEO turnovers, which are unlikely to coincide with industry productivity shocks. We further
provide direct tests of the impact of industry productivity shocks on the magnitudes of the CEO cycles in
22 The data on industry backgrounds of CEOs is taken from Camelia Kuhnen’s website, http://public.kenan-
flagler.unc.edu/faculty/kuhnenc/.
29
Appendix C. These tests suggest that the existence and the magnitudes of the CEO investment cycles are
not sensitive to the industry conditions at the time when new CEOs take office.
6. Summary and Implications
One of the most important things we study in business schools is the role of management in
public companies. Much of what we teach presumes that managerial decisions make a difference, and that
firms in reality are not in the “first-best” world described by many economic models. Yet, identifying
systematic influences of management empirically is challenging because of heterogeneity across CEOs
and firms, as well as the endogenous matching between CEOs and firms.
Our paper addresses this issue by documenting a systematic relation between CEO tenure and the
firm’s investment and growth, which we refer to as the CEO Investment Cycle. Shortly after a new CEO
takes office, the firm’s disinvestment rate rises sharply and investment is relatively low. As the CEO’s
tenure lengthens, the disinvestment rate declines while the investment rate, especially of acquisitions,
increases substantially. The cyclical pattern of investment over CEO tenure exists regardless of the
reasons for the predecessor CEO’s departure, and regardless of the background of the incoming CEO. The
CEO cycle effect on investment is of the same order of magnitude as the effects of other well-known
factors such as the business cycle, political uncertainty, and financial constraints.
We then examine the nature and quality of assets divested in the early years and acquired in the
later years, and argue that agency issues are likely to be an important driver of the CEO investment cycle:
First, CEOs are reluctant to divest or re-optimize on bad investments that they have made due to private
benefits or career concerns. It often takes a new CEO to enforce optimal disinvestment, leading to high
disinvestment intensity shortly after CEO turnover. Second, CEOs have many reasons to prefer more
investment than is optimal from a value-maximization perspective. As the CEO acquires more influence
over the board, his ability to overinvest increases, leading to increasing investment quantity but
decreasing quality over the CEO’s tenure. Eventually, when the CEO steps down, the process is repeated
by the next CEO.
30
In contrast, arguments based on differing CEO skills, productivity shocks, or CEO tenure
endogenously reflecting the firm’s investment opportunities do not explain the nature and magnitude of
the CEO investment cycles. It is not clear that one can definitively rule out definitively that investment
changes over the CEO cycle could occur in some firms because the first-best set of investments varies
systematically with the identity and tenure of the CEO. However, all the evidence presented in this paper
favors the view that in most firms, the change in investment over the CEO cycle occurs because of agency
problems.
The evidence in this paper implies that factors internal to the firm appear to affect investment in a
consequential way. Much attention in the economics literature has been paid to the effect of economy-
wide variables such as tax policies, business cycles, and financial constraints on firms’ investments. Yet,
the governance-related effects that we document in this paper are of the same order of magnitude as these
often-studied external factors. While much attention has been given in the academic literature to corporate
governance lately, its impact on investment likely has been understated, and should be incorporated into
models of investment.
Analysis of changes in investment over the CEO cycle provides a way to identify the role of
management in corporations. While the results we present here favor agency-based explanations for
investment, much more remains to be done. It is likely that whatever inefficiencies implied by the
existence of the CEO investment cycle understate the inefficiencies due to agency problems. Our analysis
focuses mainly on the quantity and quality of investment, ignoring other factors as its risk, horizon, etc.
There are a number of theories that characterize the manner in which principal-agent problems can lead to
distortions away from the first-best investments along these dimensions. Quantifying the nature of these
distortions is likely to be a fruitful direction for future research. In addition, more sophisticated theories in
which management cycles interact with productivity could lead to different empirical interpretations,
potentially reconciling the results presented here with first-best investment, or with other types of agency
problems. The existence of large changes in investment over the CEO cycle is an empirical regularity
likely to stimulate much more research.
31
References
Ball, Christopher, Gerard Hoberg, and Vojislav Maksimovic, 2013, “Redefining Financial Constraints: A
Text-Based Analysis,” Working Paper.
Bamber, Linda, John Jiang, and Isabel Wang, 2010, “What’s My Style? The Influence of Top Managers
on Voluntary Corporate Financial Disclosure,” The Accounting Review 85(4), 1131-1162.
Baumol, William J., 1959, “Business Behavior, Value and Growth,” The Macmillan Company, London.
Bebchuk, Lucian and Jesse Fried, 2004, “Pay without Performance: The Unfilled Promise of Executive
Compensation,” Harvard University Press, Cambridge, MA.
Bennedsen, Morten, Francisco Pérez-González, Kasper Nielsen, and Daniel Wolfenzon, 2007, “Inside the
Family Firm: The Role of Families in Succession Decisions and Performance,” Quarterly Journal of
Economics, 122 (2), 647‐691.
Bennedsen, Morten, Francisco Pérez-González, and Daniel Wolfenzon, 2012, “Estimating the Value of
the Boss: Evidence from CEO Hospitalization Events,” Working Paper.
Berle, Adolf and Gardiner Means, 1932, “The Modern Corporation and Private Property,” Macmillan,
New York.
Bertrand, Marianne and Sendhil Mullainathan, 2003, “Enjoying the Quiet Life? Corporate Governance
and Managerial Preferences,” Journal of Political Economy, 111(5), 1043-1075.
Bertrand, Marianne and Antoinette Schoar, 2003, “Managing with Style: The Effect of Managers on Firm
Policies,” Quarterly Journal of Economics, 118(4), 1169-1208.
Boot, Arnoud W.A., 1992, “Why Hang on to Losers? Divestitures and Takeovers,” Journal of Finance,
47, 1401-1423.
Coles, Jeffrey, Naveen Daniel and Lalitha Naveen, 2013, “Co-opted Boards: Costs, Benefits, Causes and
Consequences,” Review of Financial Studies, forthcoming.
Donaldson, Gordon, 1984, “Managing Corporate Wealth,” Praeger Publishers, New York.
Eisfeldt, Andrea and Camilia M. Kuhnen, 2012, “CEO Turnover in a Competitive Assignment
Framework,” Journal of Financial Economics, forthcoming.
Fee, C. Edward, Charles J. Hadlock, and Joshua R. Pierce, 2013, “Managers Who Lack Style: Evidence
from Exogenous CEO Changes,” Review of Financial Studies, 26 (3), 567-601..
Fracassi, Cesare and Geoffrey Tate, 2012, “External Networking and Internal Firm Governance,” The
Journal of Finance, 67(1), 153-194.
Gervais, Simon and Terrance Odean, 2001, “Learning to Be Overconfident,” Review of Financial Studies,
14(1), 1-27.
Grinstein, Yaniv and Paul Hribar, 2004, “CEO Compensation and Incentives: Evidence from M&A
Bonus,” Journal of Financial Economics, 73, 119–143.
32
Harford, Jarrad and Kai Li, 2007, “Decoupling CO Wealth and Firm Performance: The Case of Acquiring
CEOs,” Journal of Finance, 62(2), 917-949.
Hermalin, Benjamin E. and Michael S. Weisbach, 1988, “The Determinants of Board Composition,”
Rand Journal of Economics, 19, 589-606.
Hermalin, Benjamin E. and Michael S. Weisbach, 1998, “Endogenously Chosen Boards of Directors and
their Monitoring of the CEO,” American Economic Review, 88, 96-118.
Jensen, Michael C., 1986, “The Agency Costs of Free Cash Flow: Corporate Finance and Takeovers,”
American Economic Review, 76(2), 323-29.
Jensen, Michael C., 1993, “The Modern Industrial Revolution, Exit and the Failure of Internal Control
Systems,” The Journal of Finance, 48(3), 831-880.
Jensen, Michael C. and Meckling, William H., 1976, “Theory of the Firm: Managerial Behavior, Agency
Costs and Ownership Structure,” Journal of Financial Economics, 3(4), 305-360.
Jensen, Michael C and Murphy, Kevin J, 1990, “Performance Pay and Top-Management Incentives,"
Journal of Political Economy, 98 (2), 225-64.
Jin, Li, and Anna Scherbina, 2011, “Inheriting Losers,” Review of Financial Studies, 24 (3), 786-820.
Johnson, Bruce W., Robert Magee, Nandu Nagarajan, and Herry Newman, 1985, “An Analysis of the
Stock Price Reaction to Sudden Executive Death: Implications for the Management Labor Market,”
Journal of Accounting and Economics, 7, 151–174.
Jorgenson, Dale and and Zvi Griliches, 1967, “The Explanation of Productivity Change,” Review of
Economic Studies 34(3), 249-280.
Julio, Brandon and Youngsuk Yook, 2012, “Political Uncertainty and Corporate Investment Cycle,”
Journal of Finance, 67(1), 45-84.
Kanodia, Chandra, Robert Bushman, and John Dickhaut, 1989, “Escalation Errors and the Sunk Cost
Effect: An Explanation Based on Reputation and Information Asymmetries,” Journal of Accounting
Research, 27(1), 59-77.
Larcker, David, 2011, “Board of Directors: Selection, Compensation, and Removal,” Working Paper.
Li, Xiaoyang, Angie Low, and Anil K. Makhija, 2011, “Career Concerns and the Busy Life of Young
CEOs”, Working Paper.
Liu, Laura, Toni Whited, and Lu Zhang (2009), “Investment Based Stock Returns,” Journal of Political
Economy, 117, 1105-1139.
Maksimovic, Vojislav and Gordon Phillips, 2002, “Do Conglomerate Firms Allocate Resources
Inefficiently Across Industries? Theory and Evidence,” The Journal of Finance, 67, 721-767.
33
Maksimovic, Vojislav and Gordon Phillips, 2007, “Conglomerate Firms and Internal Capital Markets,”
Handbook of Corporate Finance: Empirical Corporate Finance, ed. B. Espen Eckbo, Handbooks in
Finance Series, Elsevier/North-Holland.
Marris, R., 1964, “The Economic Theory of Managerial Capitalism,” Free Press of Glencoe, Glencoe, IL.
Morck, R., A. Shleifer and R. Vishny, 1990, “Do Managerial Objectives Drive Bad Acquisitions?” The
Journal of Finance, 45(1), 31-48.
Morse, Adair, Vikram Nanda and Amit Seru, 2011, "Are Incentive Contracts Rigged by Powerful
CEOs?" The Journal of Finance, 1779-1821
Myers, Stewart C., 1977, “Determinants of Corporate Borrowing,” Journal of Financial Economics, 5,
147−175.
Murphy, Kevin J. and Jerold L. Zimmerman, 1993. “Financial performance surrounding CEO turnover,”
Journal of Accounting and Economics, 16, 273-315.
Pan, Yihui, Tracy Yue Wang, and Michael S. Weisbach, 2013, “Learning about CEO Ability and Stock
Return Volatility,” Working Paper.
Parrino, Robert, 1997, “CEO Turnover and Outside Succession: A Cross-sectional Analysis,” Journal of
Financial Economics, 46, 165-197.
Roll, Richard, 1986, “The Hubris Hypothesis of Corporate Takeovers,” Journal of Business, 59, 197-216.
Sheifer, Andrei and Robert W. Vishny, 1989, “Management Entrenchment: The Case of Manager-specific
Investments,” Journal of Financial Economics, 25(1), 123-139.
Staw, B. M., S. Barsade and K. Koput, 1997, "Escalation and the Credit Window: A Longitudinal Study
of Bank Executives' Recognition and Write-Off of Problem Loans," Journal of Applied Psychology 82
(1997): 130-142.
Tirole, Jean, 2006, “The Theory of Corporate Finance,” Princeton University Press, Princeton, 2006.
Vancil, Richard, 1987, Passing the Baton: Managing the Process of CEO Succession, Boston: Harvard
Business School Press.
Weisbach, Michael S., 1995, “CEO Turnover and the Firm’s Investment Decisions,” Journal of Financial
Economics, 37, 155-188.
Williamson, Oliver E., 1964, “The Economics of Discretionary Behavior: Managerial Objectives in a
Theory of the Firm,” Prentice-Hall, Englewood Cliff.
Yermack, David and Anil Shivdasani, 1999, “CEO Involvement in the Selection of New Board Members:
An Empirical Analysis,” Journal of Finance, 54, 1829-1853.
Yim, Soojin, 2013, “The Acquisition of Youth: CEO Age and Acquisition Behavior”, Journal of
Financial Economics, Forthcoming.
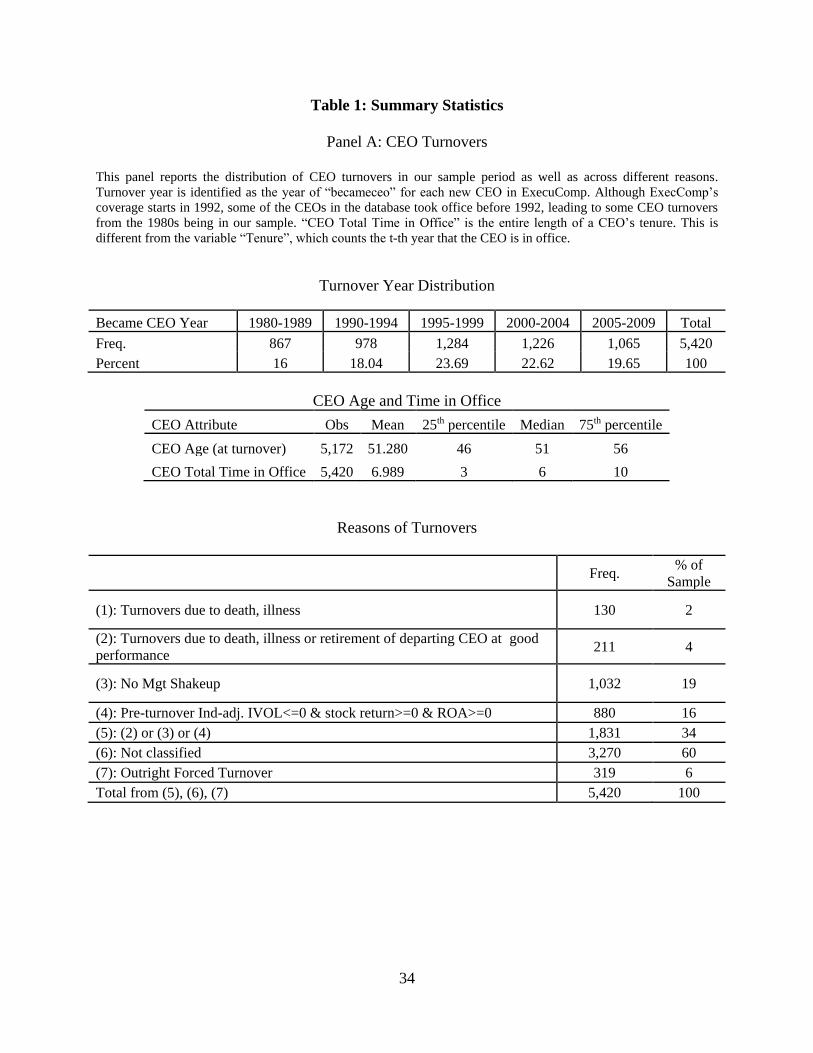
34
Table 1: Summary Statistics
Panel A: CEO Turnovers
This panel reports the distribution of CEO turnovers in our sample period as well as across different reasons.
Turnover year is identified as the year of “becameceo” for each new CEO in ExecuComp. Although ExecComp’s
coverage starts in 1992, some of the CEOs in the database took office before 1992, leading to some CEO turnovers
from the 1980s being in our sample. “CEO Total Time in Office” is the entire length of a CEO’s tenure. This is
different from the variable “Tenure”, which counts the t-th year that the CEO is in office.
Turnover Year Distribution
Became CEO Year 1980-1989 1990-1994 1995-1999 2000-2004 2005-2009 Total
Freq. 867 978 1,284 1,226 1,065 5,420
Percent 16 18.04 23.69 22.62 19.65 100
CEO Age and Time in Office
CEO Attribute Obs Mean 25th percentile Median 75th percentile
CEO Age (at turnover) 5,172 51.280 46 51 56
CEO Total Time in Office 5,420 6.989 3 6 10
Reasons of Turnovers
Freq.
% of
Sample
(1): Turnovers due to death, illness 130 2
(2): Turnovers due to death, illness or retirement of departing CEO at good
performance 211 4
(3): No Mgt Shakeup 1,032 19
(4): Pre-turnover Ind-adj. IVOL<=0 & stock return>=0 & ROA>=0 880 16
(5): (2) or (3) or (4) 1,831 34
(6): Not classified 3,270 60
(7): Outright Forced Turnover 319 6
Total from (5), (6), (7) 5,420 100
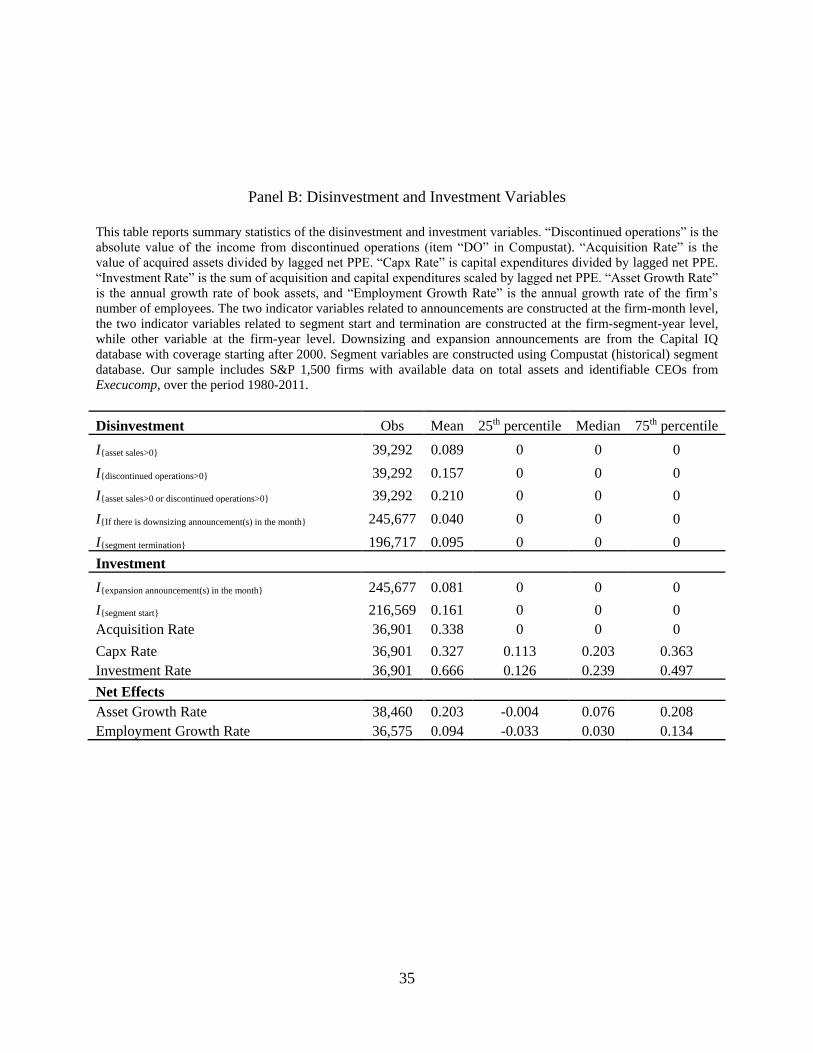
35
Panel B: Disinvestment and Investment Variables
This table reports summary statistics of the disinvestment and investment variables. “Discontinued operations” is the
absolute value of the income from discontinued operations (item “DO” in Compustat). “Acquisition Rate” is the
value of acquired assets divided by lagged net PPE. “Capx Rate” is capital expenditures divided by lagged net PPE.
“Investment Rate” is the sum of acquisition and capital expenditures scaled by lagged net PPE. “Asset Growth Rate”
is the annual growth rate of book assets, and “Employment Growth Rate” is the annual growth rate of the firm’s
number of employees. The two indicator variables related to announcements are constructed at the firm-month level,
the two indicator variables related to segment start and termination are constructed at the firm-segment-year level,
while other variable at the firm-year level. Downsizing and expansion announcements are from the Capital IQ
database with coverage starting after 2000. Segment variables are constructed using Compustat (historical) segment
database. Our sample includes S&P 1,500 firms with available data on total assets and identifiable CEOs from
Execucomp, over the period 1980-2011.
Disinvestment Obs Mean 25th percentile Median 75th percentile
I{asset sales>0} 39,292 0.089 0 0 0
I{discontinued operations>0} 39,292 0.157 0 0 0
I{asset sales>0 or discontinued operations>0} 39,292 0.210 0 0 0
I{If there is downsizing announcement(s) in the month} 245,677 0.040 0 0 0
I{segment termination} 196,717 0.095 0 0 0
Investment
I{expansion announcement(s) in the month} 245,677 0.081 0 0 0
I{segment start} 216,569 0.161 0 0 0
Acquisition Rate 36,901 0.338 0 0 0
Capx Rate 36,901 0.327 0.113 0.203 0.363
Investment Rate 36,901 0.666 0.126 0.239 0.497
Net Effects
Asset Growth Rate 38,460 0.203 -0.004 0.076 0.208
Employment Growth Rate 36,575 0.094 -0.033 0.030 0.134
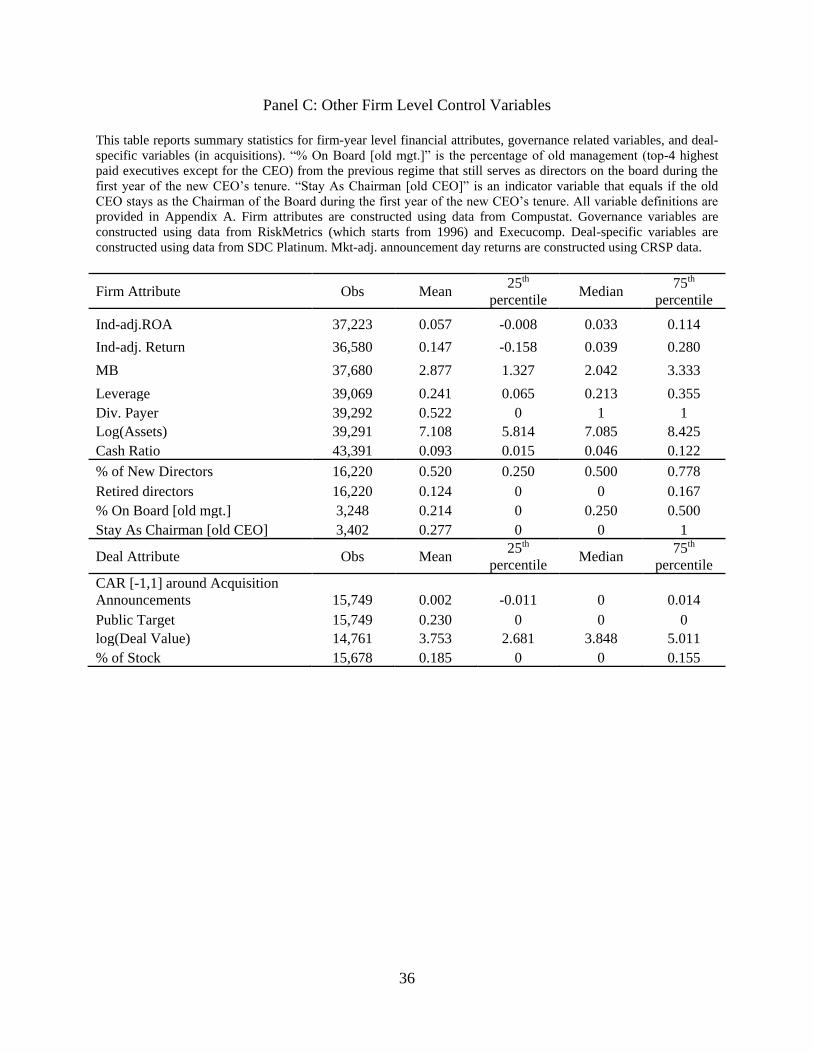
36
Panel C: Other Firm Level Control Variables
This table reports summary statistics for firm-year level financial attributes, governance related variables, and deal-
specific variables (in acquisitions). “% On Board [old mgt.]” is the percentage of old management (top-4 highest
paid executives except for the CEO) from the previous regime that still serves as directors on the board during the
first year of the new CEO’s tenure. “Stay As Chairman [old CEO]” is an indicator variable that equals if the old
CEO stays as the Chairman of the Board during the first year of the new CEO’s tenure. All variable definitions are
provided in Appendix A. Firm attributes are constructed using data from Compustat. Governance variables are
constructed using data from RiskMetrics (which starts from 1996) and Execucomp. Deal-specific variables are
constructed using data from SDC Platinum. Mkt-adj. announcement day returns are constructed using CRSP data.
Firm Attribute Obs Mean 25th
percentile Median
75th
percentile
Ind-adj.ROA 37,223 0.057 -0.008 0.033 0.114
Ind-adj. Return 36,580 0.147 -0.158 0.039 0.280
MB 37,680 2.877 1.327 2.042 3.333
Leverage 39,069 0.241 0.065 0.213 0.355
Div. Payer 39,292 0.522 0 1 1
Log(Assets) 39,291 7.108 5.814 7.085 8.425
Cash Ratio 43,391 0.093 0.015 0.046 0.122
% of New Directors 16,220 0.520 0.250 0.500 0.778
Retired directors 16,220 0.124 0 0 0.167
% On Board [old mgt.] 3,248 0.214 0 0.250 0.500
Stay As Chairman [old CEO] 3,402 0.277 0 0 1
Deal Attribute Obs Mean 25th
percentile Median
75th
percentile
CAR [-1,1] around Acquisition
Announcements 15,749 0.002 -0.011 0 0.014
Public Target 15,749 0.230 0 0 0
log(Deal Value) 14,761 3.753 2.681 3.848 5.011
% of Stock 15,678 0.185 0 0 0.155
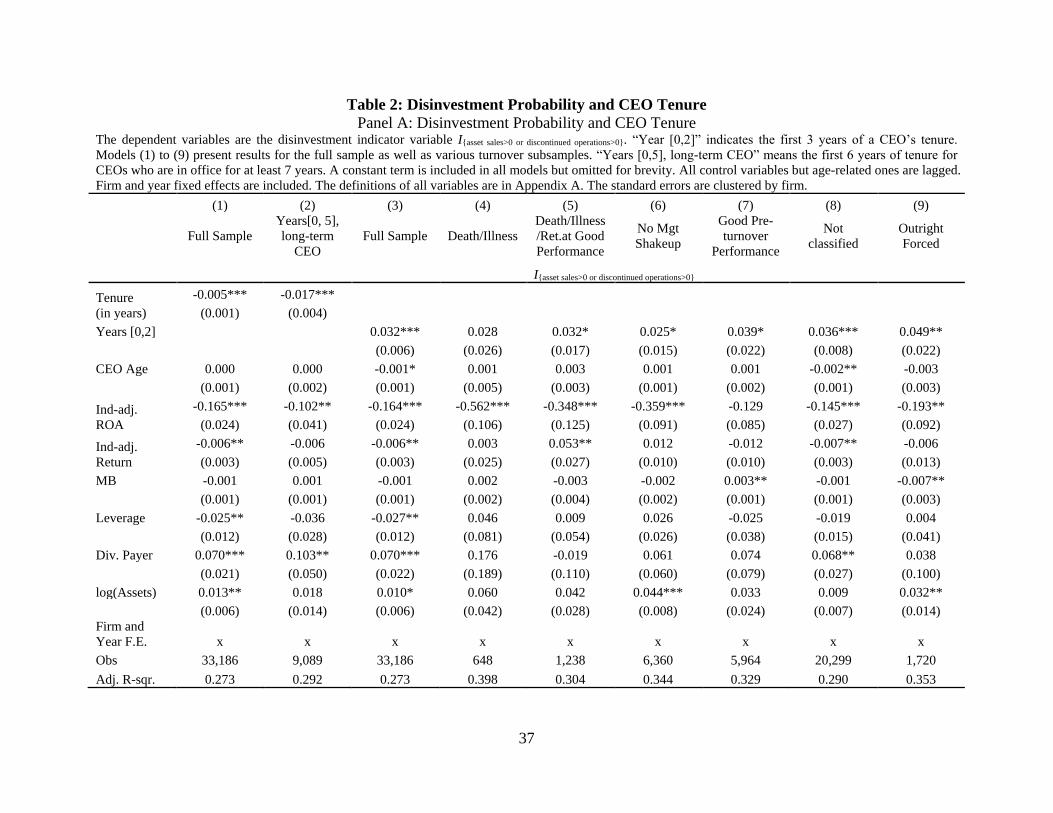
37
Table 2: Disinvestment Probability and CEO Tenure
Panel A: Disinvestment Probability and CEO Tenure The dependent variables are the disinvestment indicator variable I{asset sales>0 or discontinued operations>0}. “Year [0,2]” indicates the first 3 years of a CEO’s tenure.
Models (1) to (9) present results for the full sample as well as various turnover subsamples. “Years [0,5], long-term CEO” means the first 6 years of tenure for
CEOs who are in office for at least 7 years. A constant term is included in all models but omitted for brevity. All control variables but age-related ones are lagged.
Firm and year fixed effects are included. The definitions of all variables are in Appendix A. The standard errors are clustered by firm.
(1) (2) (3) (4) (5) (6) (7) (8) (9)
Full Sample
Years[0, 5],
long-term
CEO
Full Sample Death/Illness
Death/Illness
/Ret.at Good
Performance
No Mgt
Shakeup
Good Pre-
turnover
Performance
Not
classified
Outright
Forced
I{asset sales>0 or discontinued operations>0}
Tenure
(in years)
-0.005*** -0.017***
(0.001) (0.004)
Years [0,2]
0.032*** 0.028 0.032* 0.025* 0.039* 0.036*** 0.049**
(0.006) (0.026) (0.017) (0.015) (0.022) (0.008) (0.022)
CEO Age 0.000 0.000 -0.001* 0.001 0.003 0.001 0.001 -0.002** -0.003
(0.001) (0.002) (0.001) (0.005) (0.003) (0.001) (0.002) (0.001) (0.003)
Ind-adj.
ROA
-0.165*** -0.102** -0.164*** -0.562*** -0.348*** -0.359*** -0.129 -0.145*** -0.193**
(0.024) (0.041) (0.024) (0.106) (0.125) (0.091) (0.085) (0.027) (0.092)
Ind-adj.
Return
-0.006** -0.006 -0.006** 0.003 0.053** 0.012 -0.012 -0.007** -0.006
(0.003) (0.005) (0.003) (0.025) (0.027) (0.010) (0.010) (0.003) (0.013)
MB -0.001 0.001 -0.001 0.002 -0.003 -0.002 0.003** -0.001 -0.007**
(0.001) (0.001) (0.001) (0.002) (0.004) (0.002) (0.001) (0.001) (0.003)
Leverage -0.025** -0.036 -0.027** 0.046 0.009 0.026 -0.025 -0.019 0.004
(0.012) (0.028) (0.012) (0.081) (0.054) (0.026) (0.038) (0.015) (0.041)
Div. Payer 0.070*** 0.103** 0.070*** 0.176 -0.019 0.061 0.074 0.068** 0.038
(0.021) (0.050) (0.022) (0.189) (0.110) (0.060) (0.079) (0.027) (0.100)
log(Assets) 0.013** 0.018 0.010* 0.060 0.042 0.044*** 0.033 0.009 0.032**
(0.006) (0.014) (0.006) (0.042) (0.028) (0.008) (0.024) (0.007) (0.014)
Firm and
Year F.E. x x x x x x x x x
Obs 33,186 9,089 33,186 648 1,238 6,360 5,964 20,299 1,720
Adj. R-sqr. 0.273 0.292 0.273 0.398 0.304 0.344 0.329 0.290 0.353
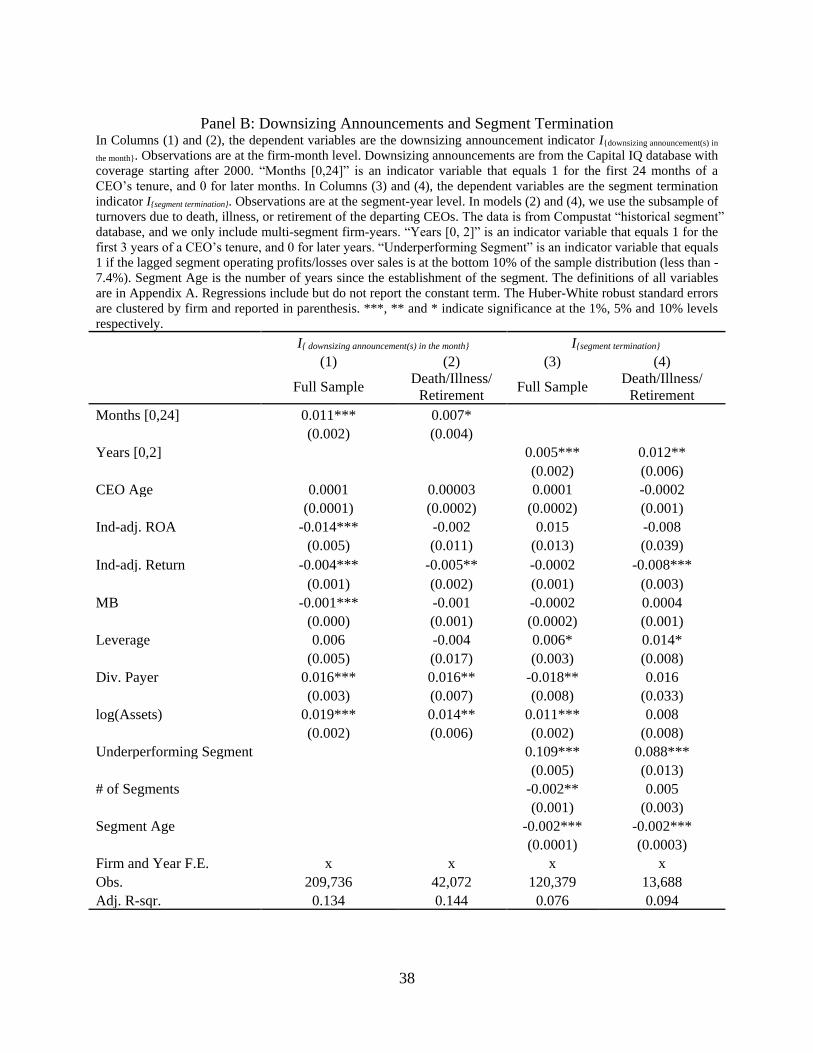
38
Panel B: Downsizing Announcements and Segment Termination In Columns (1) and (2), the dependent variables are the downsizing announcement indicator I{downsizing announcement(s) in
the month}. Observations are at the firm-month level. Downsizing announcements are from the Capital IQ database with
coverage starting after 2000. “Months [0,24]” is an indicator variable that equals 1 for the first 24 months of a
CEO’s tenure, and 0 for later months. In Columns (3) and (4), the dependent variables are the segment termination
indicator I{segment termination}. Observations are at the segment-year level. In models (2) and (4), we use the subsample of
turnovers due to death, illness, or retirement of the departing CEOs. The data is from Compustat “historical segment”
database, and we only include multi-segment firm-years. “Years [0, 2]” is an indicator variable that equals 1 for the
first 3 years of a CEO’s tenure, and 0 for later years. “Underperforming Segment” is an indicator variable that equals
1 if the lagged segment operating profits/losses over sales is at the bottom 10% of the sample distribution (less than -
7.4%). Segment Age is the number of years since the establishment of the segment. The definitions of all variables
are in Appendix A. Regressions include but do not report the constant term. The Huber-White robust standard errors
are clustered by firm and reported in parenthesis. ***, ** and * indicate significance at the 1%, 5% and 10% levels
respectively.
I{ downsizing announcement(s) in the month} I{segment termination}
(1) (2) (3) (4)
Full Sample
Death/Illness/
Retirement Full Sample
Death/Illness/
Retirement
Months [0,24] 0.011*** 0.007*
(0.002) (0.004)
Years [0,2] 0.005*** 0.012**
(0.002) (0.006)
CEO Age 0.0001 0.00003 0.0001 -0.0002
(0.0001) (0.0002) (0.0002) (0.001)
Ind-adj. ROA -0.014*** -0.002 0.015 -0.008
(0.005) (0.011) (0.013) (0.039)
Ind-adj. Return -0.004*** -0.005** -0.0002 -0.008***
(0.001) (0.002) (0.001) (0.003)
MB -0.001*** -0.001 -0.0002 0.0004
(0.000) (0.001) (0.0002) (0.001)
Leverage 0.006 -0.004 0.006* 0.014*
(0.005) (0.017) (0.003) (0.008)
Div. Payer 0.016*** 0.016** -0.018** 0.016
(0.003) (0.007) (0.008) (0.033)
log(Assets) 0.019*** 0.014** 0.011*** 0.008
(0.002) (0.006) (0.002) (0.008)
Underperforming Segment
0.109*** 0.088***
(0.005) (0.013)
# of Segments -0.002** 0.005
(0.001) (0.003)
Segment Age -0.002*** -0.002***
(0.0001) (0.0003)
Firm and Year F.E. x x x x
Obs. 209,736 42,072 120,379 13,688
Adj. R-sqr. 0.134 0.144 0.076 0.094
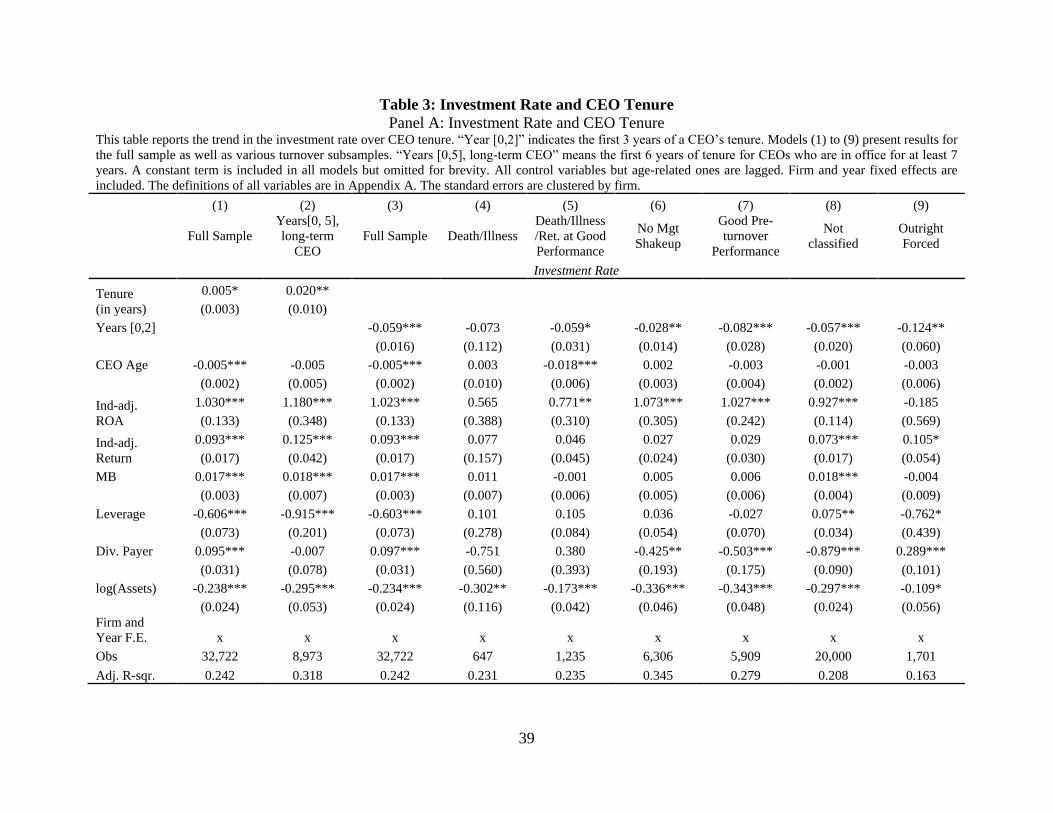
39
Table 3: Investment Rate and CEO Tenure
Panel A: Investment Rate and CEO Tenure This table reports the trend in the investment rate over CEO tenure. “Year [0,2]” indicates the first 3 years of a CEO’s tenure. Models (1) to (9) present results for
the full sample as well as various turnover subsamples. “Years [0,5], long-term CEO” means the first 6 years of tenure for CEOs who are in office for at least 7
years. A constant term is included in all models but omitted for brevity. All control variables but age-related ones are lagged. Firm and year fixed effects are
included. The definitions of all variables are in Appendix A. The standard errors are clustered by firm.
(1) (2) (3) (4) (5) (6) (7) (8) (9)
Full Sample
Years[0, 5],
long-term
CEO
Full Sample Death/Illness
Death/Illness
/Ret. at Good
Performance
No Mgt
Shakeup
Good Pre-
turnover
Performance
Not
classified
Outright
Forced
Investment Rate
Tenure
(in years)
0.005* 0.020**
(0.003) (0.010)
Years [0,2]
-0.059*** -0.073 -0.059* -0.028** -0.082*** -0.057*** -0.124**
(0.016) (0.112) (0.031) (0.014) (0.028) (0.020) (0.060)
CEO Age -0.005*** -0.005 -0.005*** 0.003 -0.018*** 0.002 -0.003 -0.001 -0.003
(0.002) (0.005) (0.002) (0.010) (0.006) (0.003) (0.004) (0.002) (0.006)
Ind-adj.
ROA
1.030*** 1.180*** 1.023*** 0.565 0.771** 1.073*** 1.027*** 0.927*** -0.185
(0.133) (0.348) (0.133) (0.388) (0.310) (0.305) (0.242) (0.114) (0.569)
Ind-adj.
Return
0.093*** 0.125*** 0.093*** 0.077 0.046 0.027 0.029 0.073*** 0.105*
(0.017) (0.042) (0.017) (0.157) (0.045) (0.024) (0.030) (0.017) (0.054)
MB 0.017*** 0.018*** 0.017*** 0.011 -0.001 0.005 0.006 0.018*** -0.004
(0.003) (0.007) (0.003) (0.007) (0.006) (0.005) (0.006) (0.004) (0.009)
Leverage -0.606*** -0.915*** -0.603*** 0.101 0.105 0.036 -0.027 0.075** -0.762*
(0.073) (0.201) (0.073) (0.278) (0.084) (0.054) (0.070) (0.034) (0.439)
Div. Payer 0.095*** -0.007 0.097*** -0.751 0.380 -0.425** -0.503*** -0.879*** 0.289***
(0.031) (0.078) (0.031) (0.560) (0.393) (0.193) (0.175) (0.090) (0.101)
log(Assets) -0.238*** -0.295*** -0.234*** -0.302** -0.173*** -0.336*** -0.343*** -0.297*** -0.109*
(0.024) (0.053) (0.024) (0.116) (0.042) (0.046) (0.048) (0.024) (0.056)
Firm and
Year F.E. x x x x x x x x x
Obs 32,722 8,973 32,722 647 1,235 6,306 5,909 20,000 1,701
Adj. R-sqr. 0.242 0.318 0.242 0.231 0.235 0.345 0.279 0.208 0.163
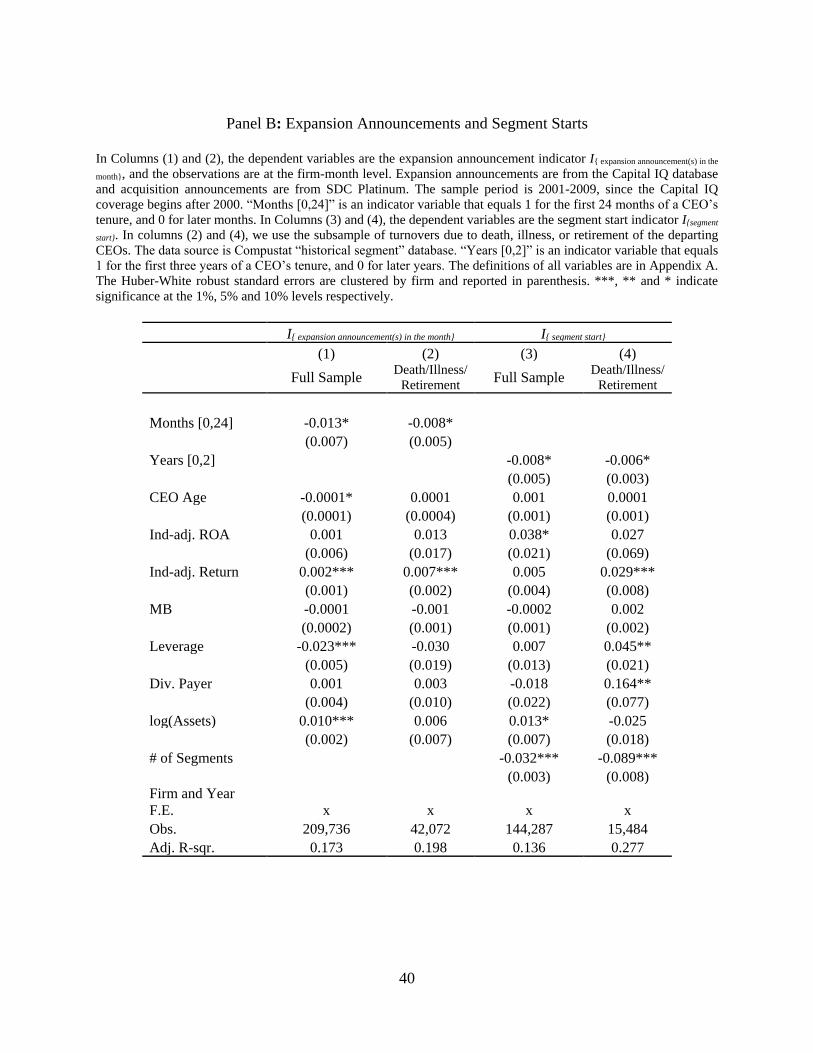
40
Panel B: Expansion Announcements and Segment Starts
In Columns (1) and (2), the dependent variables are the expansion announcement indicator I{ expansion announcement(s) in the
month}, and the observations are at the firm-month level. Expansion announcements are from the Capital IQ database
and acquisition announcements are from SDC Platinum. The sample period is 2001-2009, since the Capital IQ
coverage begins after 2000. “Months [0,24]” is an indicator variable that equals 1 for the first 24 months of a CEO’s
tenure, and 0 for later months. In Columns (3) and (4), the dependent variables are the segment start indicator I{segment
start}. In columns (2) and (4), we use the subsample of turnovers due to death, illness, or retirement of the departing
CEOs. The data source is Compustat “historical segment” database. “Years [0,2]” is an indicator variable that equals
1 for the first three years of a CEO’s tenure, and 0 for later years. The definitions of all variables are in Appendix A.
The Huber-White robust standard errors are clustered by firm and reported in parenthesis. ***, ** and * indicate
significance at the 1%, 5% and 10% levels respectively.
I{ expansion announcement(s) in the month} I{ segment start}
(1) (2) (3) (4)
Full Sample
Death/Illness/
Retirement Full Sample
Death/Illness/
Retirement
Months [0,24] -0.013* -0.008*
(0.007) (0.005)
Years [0,2] -0.008* -0.006*
(0.005) (0.003)
CEO Age -0.0001* 0.0001 0.001 0.0001
(0.0001) (0.0004) (0.001) (0.001)
Ind-adj. ROA 0.001 0.013 0.038* 0.027
(0.006) (0.017) (0.021) (0.069)
Ind-adj. Return 0.002*** 0.007*** 0.005 0.029***
(0.001) (0.002) (0.004) (0.008)
MB -0.0001 -0.001 -0.0002 0.002
(0.0002) (0.001) (0.001) (0.002)
Leverage -0.023*** -0.030 0.007 0.045**
(0.005) (0.019) (0.013) (0.021)
Div. Payer 0.001 0.003 -0.018 0.164**
(0.004) (0.010) (0.022) (0.077)
log(Assets) 0.010*** 0.006 0.013* -0.025
(0.002) (0.007) (0.007) (0.018)
# of Segments -0.032*** -0.089***
(0.003) (0.008)
Firm and Year
F.E. x x x x
Obs. 209,736 42,072 144,287 15,484
Adj. R-sqr. 0.173 0.198 0.136 0.277
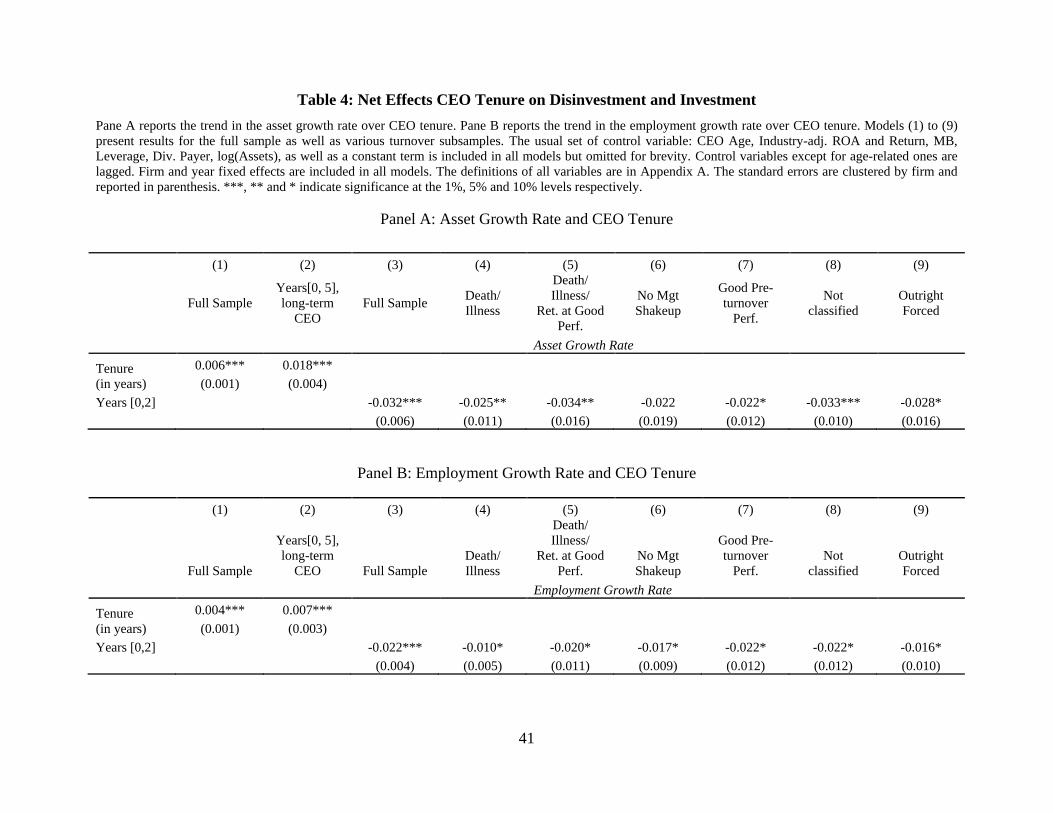
41
Table 4: Net Effects CEO Tenure on Disinvestment and Investment
Pane A reports the trend in the asset growth rate over CEO tenure. Pane B reports the trend in the employment growth rate over CEO tenure. Models (1) to (9)
present results for the full sample as well as various turnover subsamples. The usual set of control variable: CEO Age, Industry-adj. ROA and Return, MB,
Leverage, Div. Payer, log(Assets), as well as a constant term is included in all models but omitted for brevity. Control variables except for age-related ones are
lagged. Firm and year fixed effects are included in all models. The definitions of all variables are in Appendix A. The standard errors are clustered by firm and
reported in parenthesis. ***, ** and * indicate significance at the 1%, 5% and 10% levels respectively.
Panel A: Asset Growth Rate and CEO Tenure
(1) (2) (3) (4) (5) (6) (7) (8) (9)
Full Sample
Years[0, 5],
long-term
CEO
Full Sample Death/
Illness
Death/
Illness/
Ret. at Good
Perf.
No Mgt
Shakeup
Good Pre-
turnover
Perf.
Not
classified
Outright
Forced
Asset Growth Rate
Tenure
(in years)
0.006*** 0.018***
(0.001) (0.004)
Years [0,2]
-0.032*** -0.025** -0.034** -0.022 -0.022* -0.033*** -0.028*
(0.006) (0.011) (0.016) (0.019) (0.012) (0.010) (0.016)
Panel B: Employment Growth Rate and CEO Tenure
(1) (2) (3) (4) (5) (6) (7) (8) (9)
Full Sample
Years[0, 5],
long-term
CEO Full Sample
Death/
Illness
Death/
Illness/
Ret. at Good
Perf.
No Mgt
Shakeup
Good Pre-
turnover
Perf.
Not
classified
Outright
Forced
Employment Growth Rate
Tenure
(in years)
0.004*** 0.007***
(0.001) (0.003)
Years [0,2]
-0.022*** -0.010* -0.020* -0.017* -0.022* -0.022* -0.016*
(0.004) (0.005) (0.011) (0.009) (0.012) (0.012) (0.010)
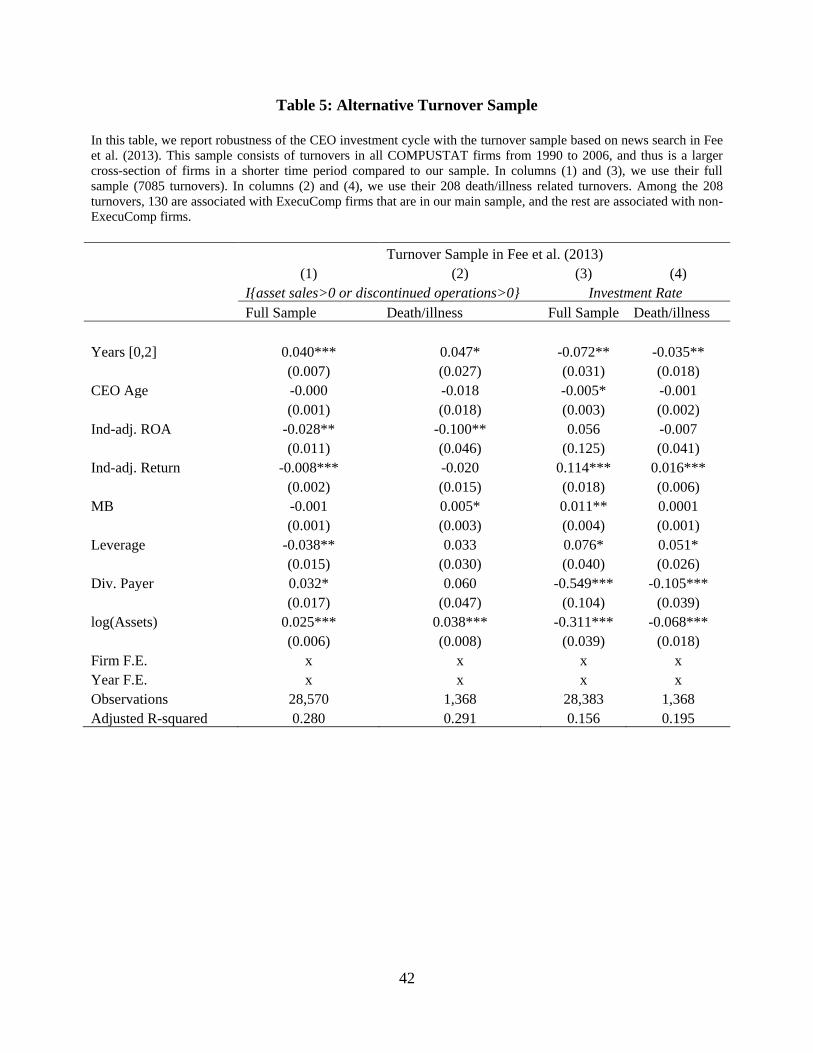
42
Table 5: Alternative Turnover Sample
In this table, we report robustness of the CEO investment cycle with the turnover sample based on news search in Fee
et al. (2013). This sample consists of turnovers in all COMPUSTAT firms from 1990 to 2006, and thus is a larger
cross-section of firms in a shorter time period compared to our sample. In columns (1) and (3), we use their full
sample (7085 turnovers). In columns (2) and (4), we use their 208 death/illness related turnovers. Among the 208
turnovers, 130 are associated with ExecuComp firms that are in our main sample, and the rest are associated with non-
ExecuComp firms.
Turnover Sample in Fee et al. (2013)
(1) (2) (3) (4)
I{asset sales>0 or discontinued operations>0} Investment Rate
Full Sample Death/illness Full Sample Death/illness
Years [0,2] 0.040*** 0.047* -0.072** -0.035**
(0.007) (0.027) (0.031) (0.018)
CEO Age -0.000 -0.018 -0.005* -0.001
(0.001) (0.018) (0.003) (0.002)
Ind-adj. ROA -0.028** -0.100** 0.056 -0.007
(0.011) (0.046) (0.125) (0.041)
Ind-adj. Return -0.008*** -0.020 0.114*** 0.016***
(0.002) (0.015) (0.018) (0.006)
MB -0.001 0.005* 0.011** 0.0001
(0.001) (0.003) (0.004) (0.001)
Leverage -0.038** 0.033 0.076* 0.051*
(0.015) (0.030) (0.040) (0.026)
Div. Payer 0.032* 0.060 -0.549*** -0.105***
(0.017) (0.047) (0.104) (0.039)
log(Assets) 0.025*** 0.038*** -0.311*** -0.068***
(0.006) (0.008) (0.039) (0.018)
Firm F.E. x x x x
Year F.E. x x x x
Observations 28,570 1,368 28,383 1,368
Adjusted R-squared 0.280 0.291 0.156 0.195
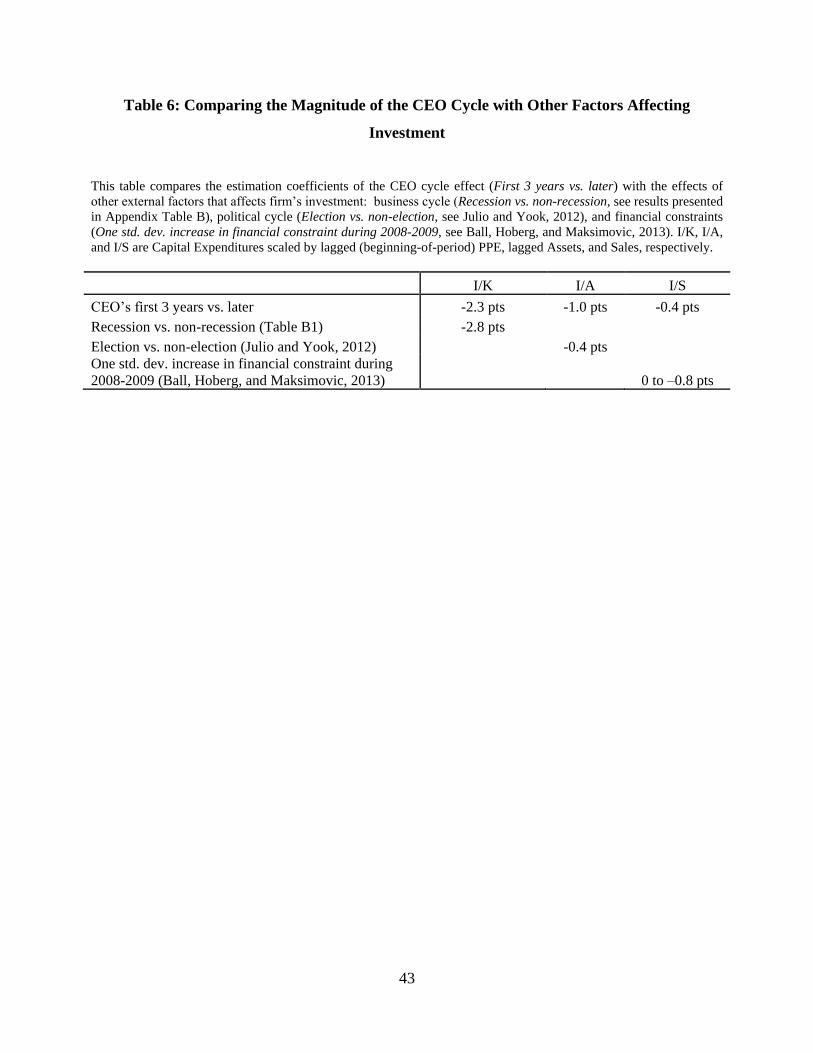
43
Table 6: Comparing the Magnitude of the CEO Cycle with Other Factors Affecting
Investment
This table compares the estimation coefficients of the CEO cycle effect (First 3 years vs. later) with the effects of
other external factors that affects firm’s investment: business cycle (Recession vs. non-recession, see results presented
in Appendix Table B), political cycle (Election vs. non-election, see Julio and Yook, 2012), and financial constraints
(One std. dev. increase in financial constraint during 2008-2009, see Ball, Hoberg, and Maksimovic, 2013). I/K, I/A,
and I/S are Capital Expenditures scaled by lagged (beginning-of-period) PPE, lagged Assets, and Sales, respectively.
I/K I/A I/S
CEO’s first 3 years vs. later -2.3 pts -1.0 pts -0.4 pts
Recession vs. non-recession (Table B1) -2.8 pts
Election vs. non-election (Julio and Yook, 2012)
-0.4 pts
One std. dev. increase in financial constraint during
2008-2009 (Ball, Hoberg, and Maksimovic, 2013) 0 to –0.8 pts
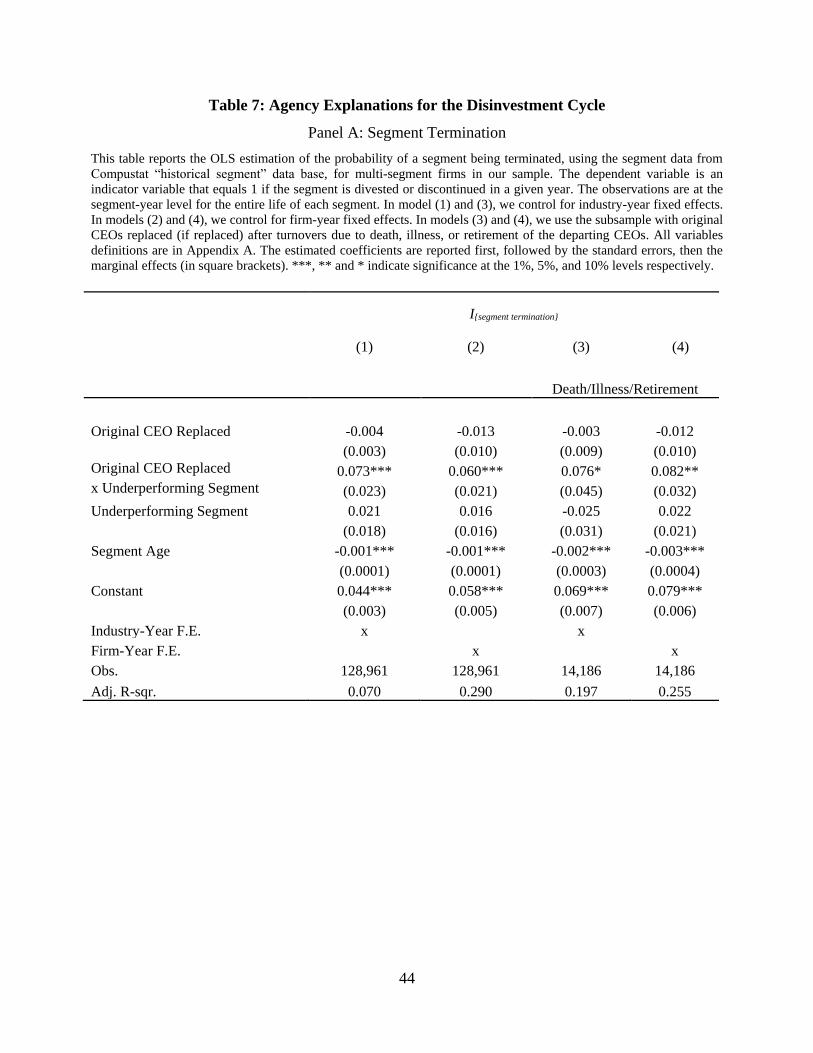
44
Table 7: Agency Explanations for the Disinvestment Cycle
Panel A: Segment Termination
This table reports the OLS estimation of the probability of a segment being terminated, using the segment data from
Compustat “historical segment” data base, for multi-segment firms in our sample. The dependent variable is an
indicator variable that equals 1 if the segment is divested or discontinued in a given year. The observations are at the
segment-year level for the entire life of each segment. In model (1) and (3), we control for industry-year fixed effects.
In models (2) and (4), we control for firm-year fixed effects. In models (3) and (4), we use the subsample with original
CEOs replaced (if replaced) after turnovers due to death, illness, or retirement of the departing CEOs. All variables
definitions are in Appendix A. The estimated coefficients are reported first, followed by the standard errors, then the
marginal effects (in square brackets). ***, ** and * indicate significance at the 1%, 5%, and 10% levels respectively.
I{segment termination}
(1) (2) (3) (4)
Death/Illness/Retirement
Original CEO Replaced -0.004 -0.013 -0.003 -0.012
(0.003) (0.010) (0.009) (0.010)
Original CEO Replaced 0.073*** 0.060*** 0.076* 0.082**
x Underperforming Segment (0.023) (0.021) (0.045) (0.032)
Underperforming Segment 0.021 0.016 -0.025 0.022
(0.018) (0.016) (0.031) (0.021)
Segment Age -0.001*** -0.001*** -0.002*** -0.003***
(0.0001) (0.0001) (0.0003) (0.0004)
Constant 0.044*** 0.058*** 0.069*** 0.079***
(0.003) (0.005) (0.007) (0.006)
Industry-Year F.E. x
x
Firm-Year F.E.
x
x
Obs. 128,961 128,961 14,186 14,186
Adj. R-sqr. 0.070 0.290 0.197 0.255
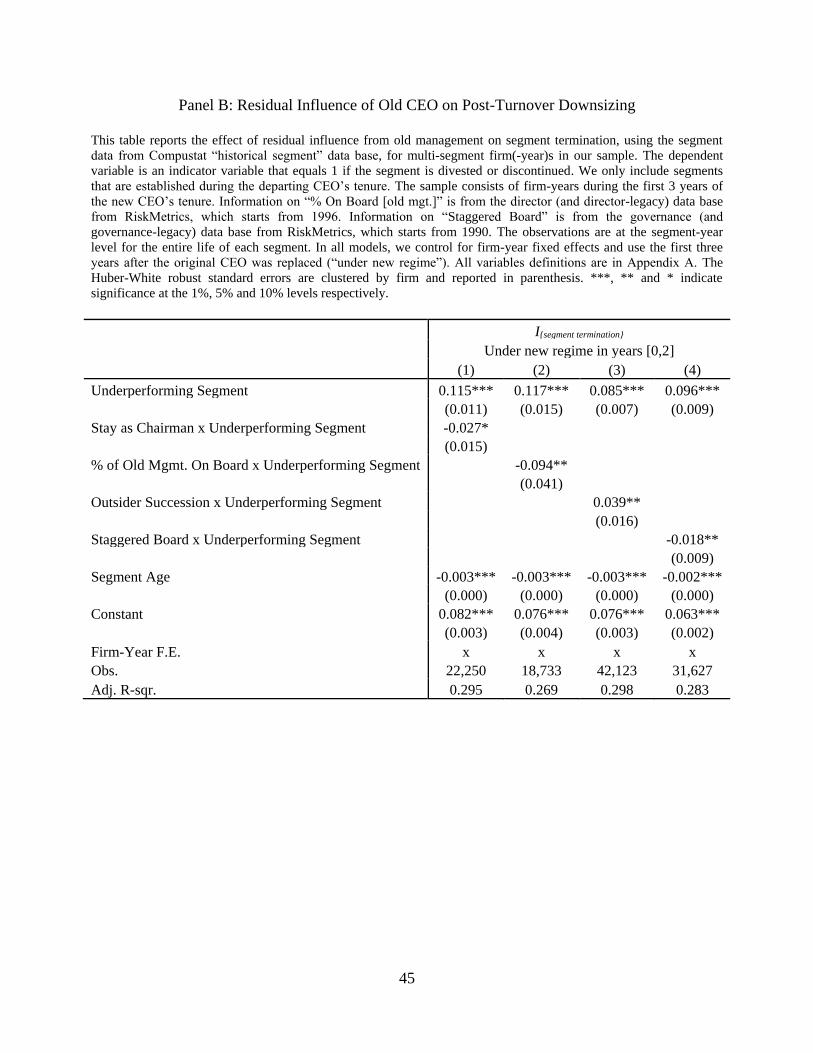
45
Panel B: Residual Influence of Old CEO on Post-Turnover Downsizing
This table reports the effect of residual influence from old management on segment termination, using the segment
data from Compustat “historical segment” data base, for multi-segment firm(-year)s in our sample. The dependent
variable is an indicator variable that equals 1 if the segment is divested or discontinued. We only include segments
that are established during the departing CEO’s tenure. The sample consists of firm-years during the first 3 years of
the new CEO’s tenure. Information on “% On Board [old mgt.]” is from the director (and director-legacy) data base
from RiskMetrics, which starts from 1996. Information on “Staggered Board” is from the governance (and
governance-legacy) data base from RiskMetrics, which starts from 1990. The observations are at the segment-year
level for the entire life of each segment. In all models, we control for firm-year fixed effects and use the first three
years after the original CEO was replaced (“under new regime”). All variables definitions are in Appendix A. The
Huber-White robust standard errors are clustered by firm and reported in parenthesis. ***, ** and * indicate
significance at the 1%, 5% and 10% levels respectively.
I{segment termination}
Under new regime in years [0,2]
(1) (2) (3) (4)
Underperforming Segment 0.115*** 0.117*** 0.085*** 0.096***
(0.011) (0.015) (0.007) (0.009)
Stay as Chairman x Underperforming Segment -0.027*
(0.015)
% of Old Mgmt. On Board x Underperforming Segment
-0.094**
(0.041)
Outsider Succession x Underperforming Segment
0.039**
(0.016)
Staggered Board x Underperforming Segment
-0.018**
(0.009)
Segment Age -0.003*** -0.003*** -0.003*** -0.002***
(0.000) (0.000) (0.000) (0.000)
Constant 0.082*** 0.076*** 0.076*** 0.063***
(0.003) (0.004) (0.003) (0.002)
Firm-Year F.E. x x x x
Obs. 22,250 18,733 42,123 31,627
Adj. R-sqr. 0.295 0.269 0.298 0.283
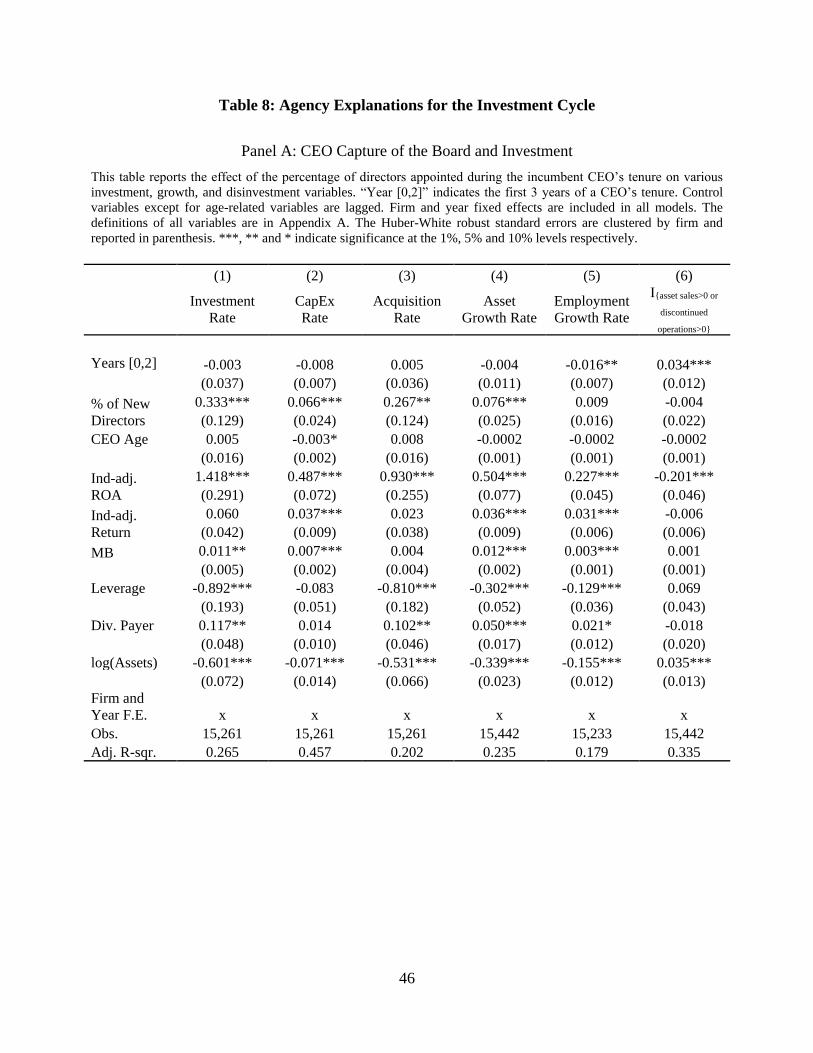
46
Table 8: Agency Explanations for the Investment Cycle
Panel A: CEO Capture of the Board and Investment
This table reports the effect of the percentage of directors appointed during the incumbent CEO’s tenure on various
investment, growth, and disinvestment variables. “Year [0,2]” indicates the first 3 years of a CEO’s tenure. Control
variables except for age-related variables are lagged. Firm and year fixed effects are included in all models. The
definitions of all variables are in Appendix A. The Huber-White robust standard errors are clustered by firm and
reported in parenthesis. ***, ** and * indicate significance at the 1%, 5% and 10% levels respectively.
(1) (2) (3) (4) (5) (6)
Investment
Rate
CapEx
Rate
Acquisition
Rate
Asset
Growth Rate
Employment
Growth Rate
I{asset sales>0 or
discontinued
operations>0}
Years [0,2] -0.003 -0.008 0.005 -0.004 -0.016** 0.034***
(0.037) (0.007) (0.036) (0.011) (0.007) (0.012)
% of New
Directors
0.333*** 0.066*** 0.267** 0.076*** 0.009 -0.004
(0.129) (0.024) (0.124) (0.025) (0.016) (0.022)
CEO Age 0.005 -0.003* 0.008 -0.0002 -0.0002 -0.0002
(0.016) (0.002) (0.016) (0.001) (0.001) (0.001)
Ind-adj.
ROA
1.418*** 0.487*** 0.930*** 0.504*** 0.227*** -0.201***
(0.291) (0.072) (0.255) (0.077) (0.045) (0.046)
Ind-adj.
Return
0.060 0.037*** 0.023 0.036*** 0.031*** -0.006
(0.042) (0.009) (0.038) (0.009) (0.006) (0.006)
MB
0.011** 0.007*** 0.004 0.012*** 0.003*** 0.001
(0.005) (0.002) (0.004) (0.002) (0.001) (0.001)
Leverage -0.892*** -0.083 -0.810*** -0.302*** -0.129*** 0.069
(0.193) (0.051) (0.182) (0.052) (0.036) (0.043)
Div. Payer 0.117** 0.014 0.102** 0.050*** 0.021* -0.018
(0.048) (0.010) (0.046) (0.017) (0.012) (0.020)
log(Assets) -0.601*** -0.071*** -0.531*** -0.339*** -0.155*** 0.035***
(0.072) (0.014) (0.066) (0.023) (0.012) (0.013)
Firm and
Year F.E. x x x x x x
Obs. 15,261 15,261 15,261 15,442 15,233 15,442
Adj. R-sqr. 0.265 0.457 0.202 0.235 0.179 0.335
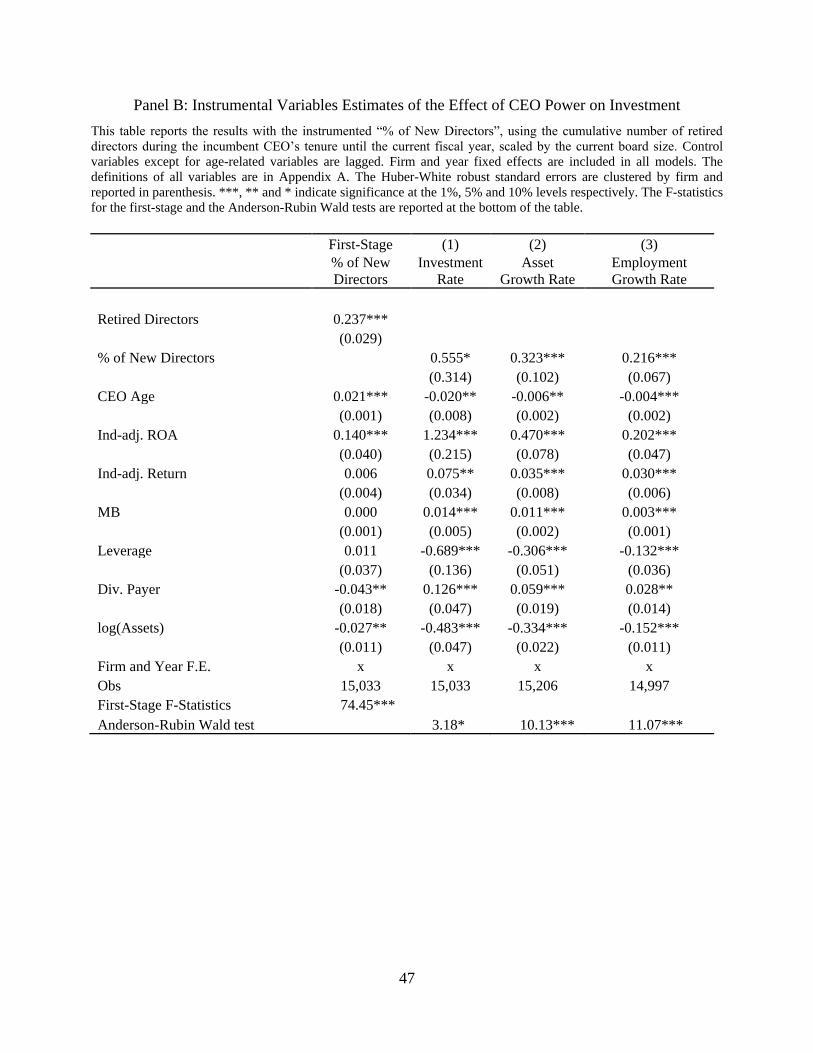
47
Panel B: Instrumental Variables Estimates of the Effect of CEO Power on Investment
This table reports the results with the instrumented “% of New Directors”, using the cumulative number of retired
directors during the incumbent CEO’s tenure until the current fiscal year, scaled by the current board size. Control
variables except for age-related variables are lagged. Firm and year fixed effects are included in all models. The
definitions of all variables are in Appendix A. The Huber-White robust standard errors are clustered by firm and
reported in parenthesis. ***, ** and * indicate significance at the 1%, 5% and 10% levels respectively. The F-statistics
for the first-stage and the Anderson-Rubin Wald tests are reported at the bottom of the table.
First-Stage (1) (2) (3)
% of New
Directors
Investment
Rate
Asset
Growth Rate
Employment
Growth Rate
Retired Directors 0.237***
(0.029)
% of New Directors 0.555* 0.323*** 0.216***
(0.314) (0.102) (0.067)
CEO Age 0.021*** -0.020** -0.006** -0.004***
(0.001) (0.008) (0.002) (0.002)
Ind-adj. ROA 0.140*** 1.234*** 0.470*** 0.202***
(0.040) (0.215) (0.078) (0.047)
Ind-adj. Return 0.006 0.075** 0.035*** 0.030***
(0.004) (0.034) (0.008) (0.006)
MB 0.000 0.014*** 0.011*** 0.003***
(0.001) (0.005) (0.002) (0.001)
Leverage 0.011 -0.689*** -0.306*** -0.132***
(0.037) (0.136) (0.051) (0.036)
Div. Payer -0.043** 0.126*** 0.059*** 0.028**
(0.018) (0.047) (0.019) (0.014)
log(Assets) -0.027** -0.483*** -0.334*** -0.152***
(0.011) (0.047) (0.022) (0.011)
Firm and Year F.E. x x x x
Obs 15,033 15,033 15,206 14,997
First-Stage F-Statistics 74.45***
Anderson-Rubin Wald test 3.18* 10.13*** 11.07***

48
Table 9: Investment Quality
Panel A: Quality and Timing of Investment
The top panel of this table reports the % of segments divested during the first three years of a new CEO’s regime
among all segments established in the previous CEO’s first three years, vs. among those established in the later part of
previous CEO’s tenure. The bottom panel reports the % of negative announcement abnormal returns for deals made in
the first three years of a CEO’s tenure vs. in later years. ***, ** and * indicate significance at the 1%, 5% and 10%
levels respectively.
Segment estab. in years[0,2] Segment estab. after years[0, 2] Difference
% of segments divested
by next CEO in years[0,2] 8% 13% -5%**
Deals made in years[0,2] Deals made after years[0, 2]
% of CAR [-1, 1] around
Acq. Announcements<0 39% 58% -19%**
Panel B: Market Reaction to Acquisitions and CEO Power
This table reports the effect of CEO power on the three-day cumulative market-adjusted return around acquisition
announcements. The market return is constructed using the value-weighted market portfolio. “Year [0,2]” indicates
the first 3 years of a CEO’s tenure. Models (1) and (2) report the results for the full sample. Models (3) and (4) report
the results for cash deals only. Model (5) reports the 2nd stage results of the instrumental variable approach, in which
the measure for CEO power (% of New Director) is instrumented using the cumulative number of retired directors
during the incumbent CEO’s tenure until the current fiscal year, scaled by the current board size. Control variables
include deal-specific variables (deal size, % of stock as the source of the fund, and an indicator variable for public
target) and firm-specific variables (cash ratio, M/B, firm size) which are lagged. Year fixed effects and a constant term
are included in all models. The Huber-White robust standard errors are clustered by firm and reported in parenthesis.
CAR [-1, 1] around Acquisition Announcements
Full Sample Long-term CEO IV 2nd Stage
(1) (2) (3) (4) (5)
Years [0,2] 0.002**
(0.001)
% of New Directors
-0.009** -0.016* -0.012** -0.043*
(0.004) (0.009) (0.006) (0.023)
Public Target -0.008*** -0.004** -0.004* -0.004* -0.004**
(0.001) (0.002) (0.002) (0.002) (0.002)
log(Deal value) 0.001*** 0.0002 0.000 0.000 0.001*
(0.0003) (0.0005) (0.001) (0.001) (0.0003)
% of stock -0.008*** -0.015*** -0.014*** -0.015*** -0.006
(0.002) (0.004) (0.004) (0.004) (0.005)
Cash Ratio -0.006 0.006 0.014 0.008 0.003
(0.008) (0.014) (0.017) (0.016) (0.013)
MB 0.0003 0.0002 0.000 0.000 0.0003
(0.0002) (0.0003) (0.000) (0.000) (0.0002)
log(Assets) -0.004*** -0.008*** -0.008** -0.008*** -0.004***
(0.0004) (0.003) (0.003) (0.003) (0.001)
Firm-CEO F.E.
x
Obs. 14,846 8,533 8,533 6,188 8,533
Adj. R-sqr. 0.029 0.044 0.127 0.053
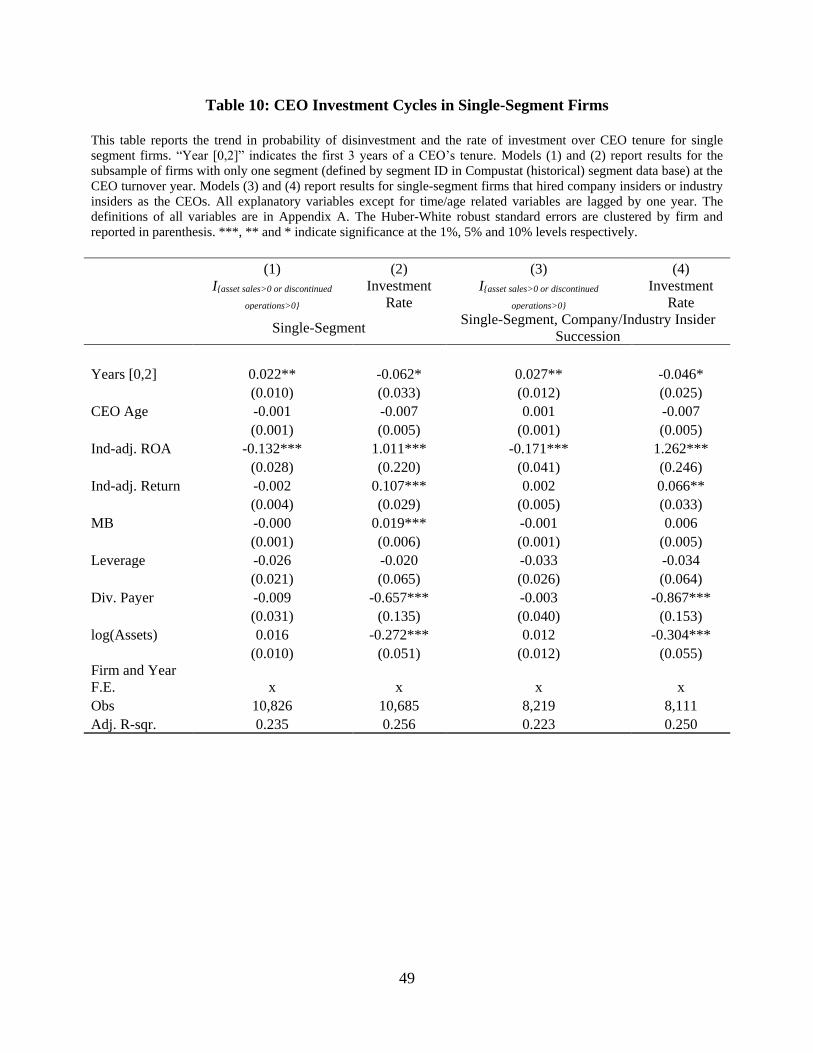
49
Table 10: CEO Investment Cycles in Single-Segment Firms
This table reports the trend in probability of disinvestment and the rate of investment over CEO tenure for single
segment firms. “Year [0,2]” indicates the first 3 years of a CEO’s tenure. Models (1) and (2) report results for the
subsample of firms with only one segment (defined by segment ID in Compustat (historical) segment data base) at the
CEO turnover year. Models (3) and (4) report results for single-segment firms that hired company insiders or industry
insiders as the CEOs. All explanatory variables except for time/age related variables are lagged by one year. The
definitions of all variables are in Appendix A. The Huber-White robust standard errors are clustered by firm and
reported in parenthesis. ***, ** and * indicate significance at the 1%, 5% and 10% levels respectively.
(1) (2) (3) (4)
I{asset sales>0 or discontinued
operations>0}
Investment
Rate
I{asset sales>0 or discontinued
operations>0}
Investment
Rate
Single-Segment
Single-Segment, Company/Industry Insider
Succession
Years [0,2] 0.022** -0.062* 0.027** -0.046*
(0.010) (0.033) (0.012) (0.025)
CEO Age -0.001 -0.007 0.001 -0.007
(0.001) (0.005) (0.001) (0.005)
Ind-adj. ROA -0.132*** 1.011*** -0.171*** 1.262***
(0.028) (0.220) (0.041) (0.246)
Ind-adj. Return -0.002 0.107*** 0.002 0.066**
(0.004) (0.029) (0.005) (0.033)
MB -0.000 0.019*** -0.001 0.006
(0.001) (0.006) (0.001) (0.005)
Leverage -0.026 -0.020 -0.033 -0.034
(0.021) (0.065) (0.026) (0.064)
Div. Payer -0.009 -0.657*** -0.003 -0.867***
(0.031) (0.135) (0.040) (0.153)
log(Assets) 0.016 -0.272*** 0.012 -0.304***
(0.010) (0.051) (0.012) (0.055)
Firm and Year
F.E. x x x x
Obs 10,826 10,685 8,219 8,111
Adj. R-sqr. 0.235 0.256 0.223 0.250
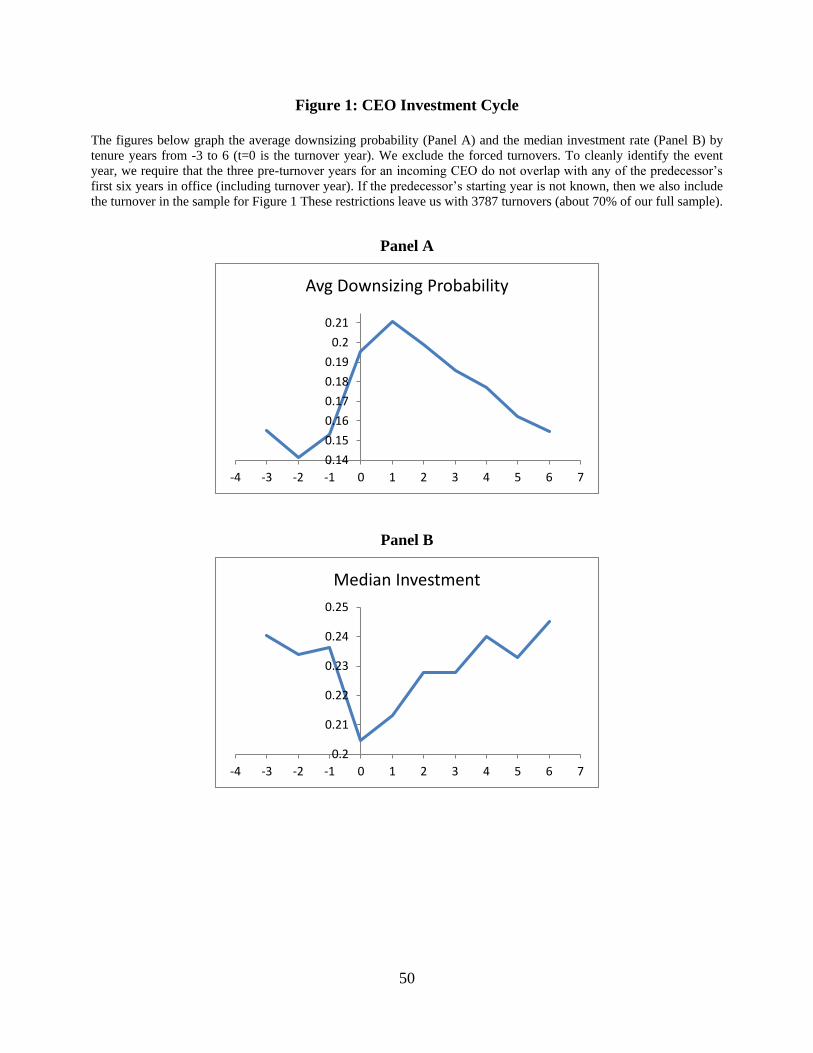
50
Figure 1: CEO Investment Cycle
The figures below graph the average downsizing probability (Panel A) and the median investment rate (Panel B) by
tenure years from -3 to 6 (t=0 is the turnover year). We exclude the forced turnovers. To cleanly identify the event
year, we require that the three pre-turnover years for an incoming CEO do not overlap with any of the predecessor’s
first six years in office (including turnover year). If the predecessor’s starting year is not known, then we also include
the turnover in the sample for Figure 1 These restrictions leave us with 3787 turnovers (about 70% of our full sample).
Panel A
Panel B
0.14
0.15
0.16
0.17
0.18
0.19
0.2
0.21
-4 -3 -2 -1 0 1 2 3 4 5 6 7
Avg Downsizing Probability
0.2
0.21
0.22
0.23
0.24
0.25
-4 -3 -2 -1 0 1 2 3 4 5 6 7
Median Investment
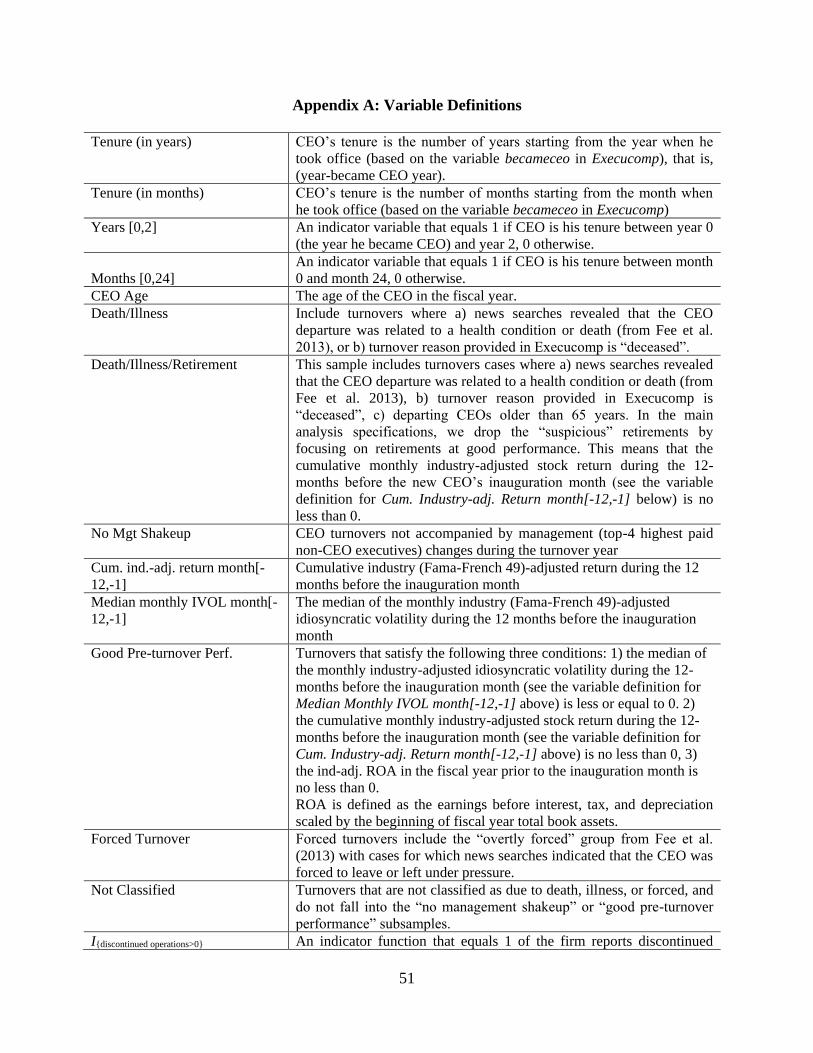
51
Appendix A: Variable Definitions
Tenure (in years) CEO’s tenure is the number of years starting from the year when he
took office (based on the variable becameceo in Execucomp), that is,
(year-became CEO year).
Tenure (in months) CEO’s tenure is the number of months starting from the month when
he took office (based on the variable becameceo in Execucomp)
Years [0,2] An indicator variable that equals 1 if CEO is his tenure between year 0
(the year he became CEO) and year 2, 0 otherwise.
Months [0,24]
An indicator variable that equals 1 if CEO is his tenure between month
0 and month 24, 0 otherwise.
CEO Age The age of the CEO in the fiscal year.
Death/Illness Include turnovers where a) news searches revealed that the CEO
departure was related to a health condition or death (from Fee et al.
2013), or b) turnover reason provided in Execucomp is “deceased”.
Death/Illness/Retirement This sample includes turnovers cases where a) news searches revealed
that the CEO departure was related to a health condition or death (from
Fee et al. 2013), b) turnover reason provided in Execucomp is
“deceased”, c) departing CEOs older than 65 years. In the main
analysis specifications, we drop the “suspicious” retirements by
focusing on retirements at good performance. This means that the
cumulative monthly industry-adjusted stock return during the 12-
months before the new CEO’s inauguration month (see the variable
definition for Cum. Industry-adj. Return month[-12,-1] below) is no
less than 0.
No Mgt Shakeup CEO turnovers not accompanied by management (top-4 highest paid
non-CEO executives) changes during the turnover year
Cum. ind.-adj. return month[-
12,-1]
Cumulative industry (Fama-French 49)-adjusted return during the 12
months before the inauguration month
Median monthly IVOL month[-
12,-1]
The median of the monthly industry (Fama-French 49)-adjusted
idiosyncratic volatility during the 12 months before the inauguration
month
Good Pre-turnover Perf. Turnovers that satisfy the following three conditions: 1) the median of
the monthly industry-adjusted idiosyncratic volatility during the 12-
months before the inauguration month (see the variable definition for
Median Monthly IVOL month[-12,-1] above) is less or equal to 0. 2)
the cumulative monthly industry-adjusted stock return during the 12-
months before the inauguration month (see the variable definition for
Cum. Industry-adj. Return month[-12,-1] above) is no less than 0, 3)
the ind-adj. ROA in the fiscal year prior to the inauguration month is
no less than 0.
ROA is defined as the earnings before interest, tax, and depreciation
scaled by the beginning of fiscal year total book assets.
Forced Turnover Forced turnovers include the “overtly forced” group from Fee et al.
(2013) with cases for which news searches indicated that the CEO was
forced to leave or left under pressure.
Not Classified Turnovers that are not classified as due to death, illness, or forced, and
do not fall into the “no management shakeup” or “good pre-turnover
performance” subsamples.
I{discontinued operations>0} An indicator function that equals 1 of the firm reports discontinued
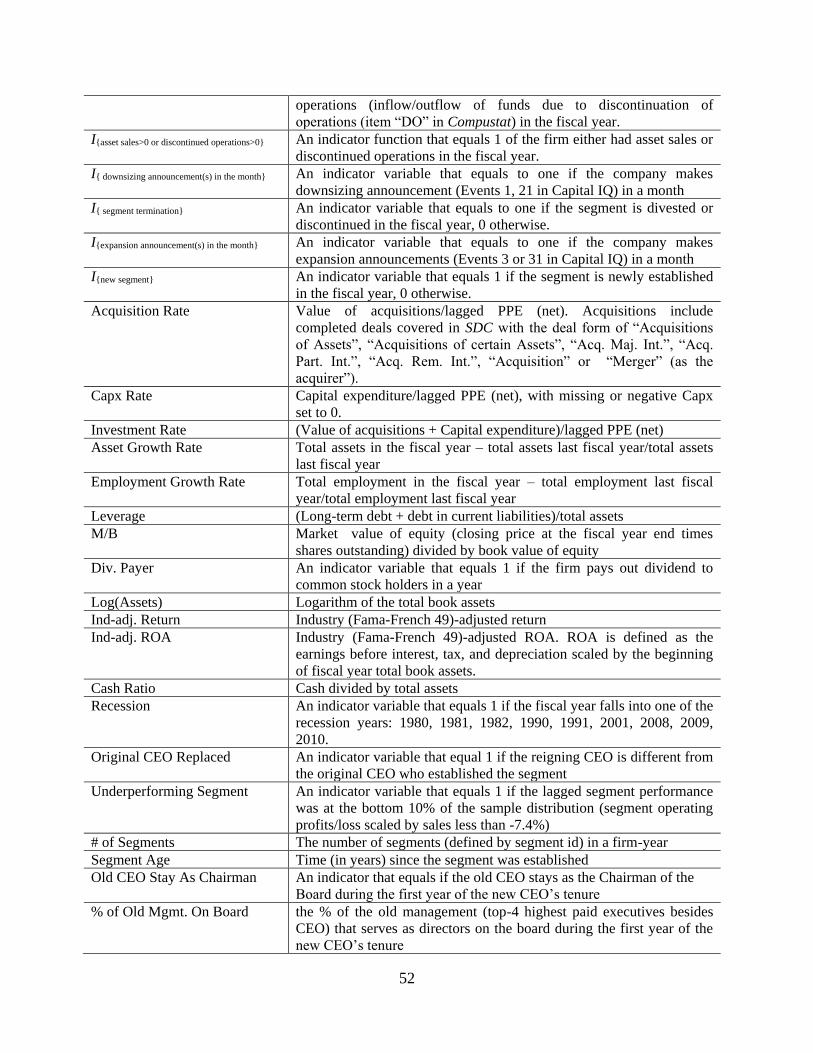
52
operations (inflow/outflow of funds due to discontinuation of
operations (item “DO” in Compustat) in the fiscal year.
I{asset sales>0 or discontinued operations>0} An indicator function that equals 1 of the firm either had asset sales or
discontinued operations in the fiscal year.
I{ downsizing announcement(s) in the month} An indicator variable that equals to one if the company makes
downsizing announcement (Events 1, 21 in Capital IQ) in a month
I{ segment termination} An indicator variable that equals to one if the segment is divested or
discontinued in the fiscal year, 0 otherwise.
I{expansion announcement(s) in the month} An indicator variable that equals to one if the company makes
expansion announcements (Events 3 or 31 in Capital IQ) in a month
I{new segment} An indicator variable that equals 1 if the segment is newly established
in the fiscal year, 0 otherwise.
Acquisition Rate Value of acquisitions/lagged PPE (net). Acquisitions include
completed deals covered in SDC with the deal form of “Acquisitions
of Assets”, “Acquisitions of certain Assets”, “Acq. Maj. Int.”, “Acq.
Part. Int.”, “Acq. Rem. Int.”, “Acquisition” or “Merger” (as the
acquirer”).
Capx Rate Capital expenditure/lagged PPE (net), with missing or negative Capx
set to 0.
Investment Rate (Value of acquisitions + Capital expenditure)/lagged PPE (net)
Asset Growth Rate Total assets in the fiscal year – total assets last fiscal year/total assets
last fiscal year
Employment Growth Rate Total employment in the fiscal year – total employment last fiscal
year/total employment last fiscal year
Leverage (Long-term debt + debt in current liabilities)/total assets
M/B Market value of equity (closing price at the fiscal year end times
shares outstanding) divided by book value of equity
Div. Payer An indicator variable that equals 1 if the firm pays out dividend to
common stock holders in a year
Log(Assets) Logarithm of the total book assets
Ind-adj. Return Industry (Fama-French 49)-adjusted return
Ind-adj. ROA Industry (Fama-French 49)-adjusted ROA. ROA is defined as the
earnings before interest, tax, and depreciation scaled by the beginning
of fiscal year total book assets.
Cash Ratio Cash divided by total assets
Recession An indicator variable that equals 1 if the fiscal year falls into one of the
recession years: 1980, 1981, 1982, 1990, 1991, 2001, 2008, 2009,
2010.
Original CEO Replaced An indicator variable that equal 1 if the reigning CEO is different from
the original CEO who established the segment
Underperforming Segment An indicator variable that equals 1 if the lagged segment performance
was at the bottom 10% of the sample distribution (segment operating
profits/loss scaled by sales less than -7.4%)
# of Segments The number of segments (defined by segment id) in a firm-year
Segment Age Time (in years) since the segment was established
Old CEO Stay As Chairman An indicator that equals if the old CEO stays as the Chairman of the
Board during the first year of the new CEO’s tenure
% of Old Mgmt. On Board the % of the old management (top-4 highest paid executives besides
CEO) that serves as directors on the board during the first year of the
new CEO’s tenure
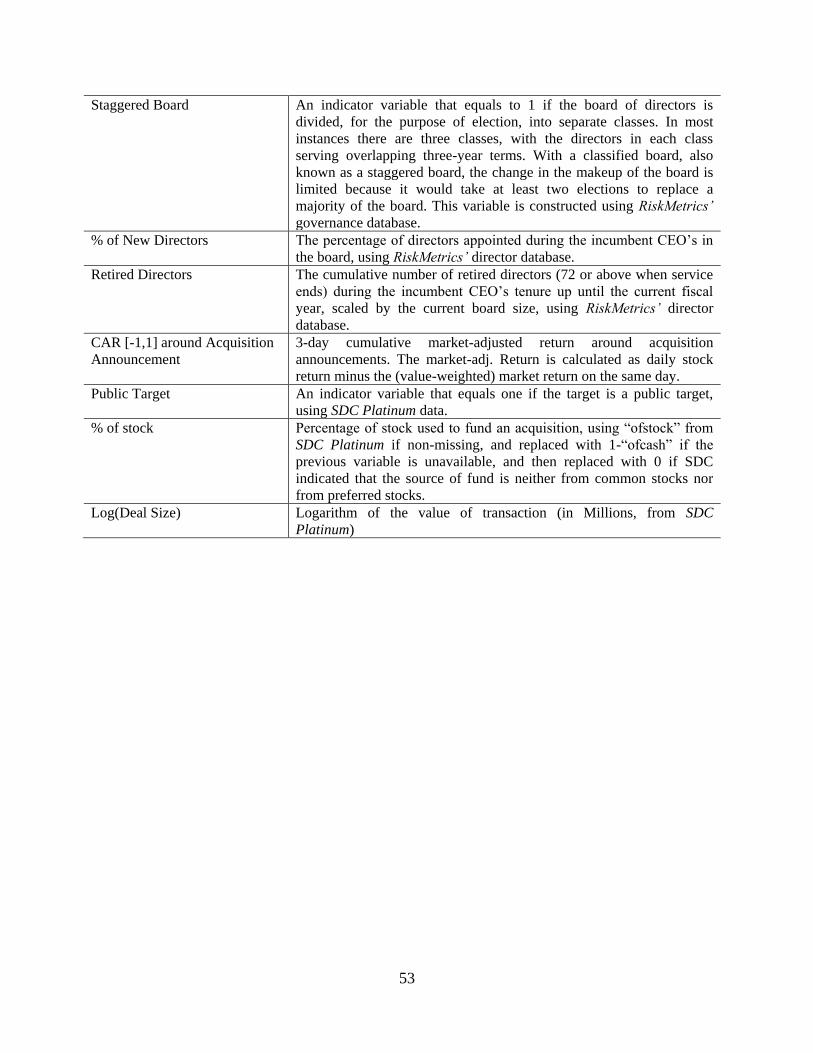
53
Staggered Board An indicator variable that equals to 1 if the board of directors is
divided, for the purpose of election, into separate classes. In most
instances there are three classes, with the directors in each class
serving overlapping three-year terms. With a classified board, also
known as a staggered board, the change in the makeup of the board is
limited because it would take at least two elections to replace a
majority of the board. This variable is constructed using RiskMetrics’
governance database.
% of New Directors The percentage of directors appointed during the incumbent CEO’s in
the board, using RiskMetrics’ director database.
Retired Directors The cumulative number of retired directors (72 or above when service
ends) during the incumbent CEO’s tenure up until the current fiscal
year, scaled by the current board size, using RiskMetrics’ director
database.
CAR [-1,1] around Acquisition
Announcement
3-day cumulative market-adjusted return around acquisition
announcements. The market-adj. Return is calculated as daily stock
return minus the (value-weighted) market return on the same day.
Public Target An indicator variable that equals one if the target is a public target,
using SDC Platinum data.
% of stock Percentage of stock used to fund an acquisition, using “ofstock” from
SDC Platinum if non-missing, and replaced with 1-“ofcash” if the
previous variable is unavailable, and then replaced with 0 if SDC
indicated that the source of fund is neither from common stocks nor
from preferred stocks.
Log(Deal Size) Logarithm of the value of transaction (in Millions, from SDC
Platinum)
54
Appendix B: Comparing the CEO Investment Cycle with Other Investment Determinants
Business cycles: Firm level and aggregate corporate investment rates tend to vary substantially
between expansions and recessions. In Appendix Table B1, we compare the magnitude of the business
cycle effect to the CEO cycle effect. To do so, we define Recession as an indicator variable that equals one
for years 1980-1982, 1990-1991, 2001, 2008-2010 and include this variable into the specification
predicting changes in disinvestment, investment, and firm growth. Columns (1) and (2) of Appendix Table
B show that disinvestment is actually less likely to occur in recession years than in expansion years, and
thus the business cycle effect on disinvestment intensity is very different from the CEO cycle effect.
Columns (3)-(5) show that the corporate investment rate is much lower in recession years than in non-
recession years. The CEO cycle effect on investment is about half the magnitude of the effect of the
business cycle: the total investment rate is 13 percentage points lower in recessions than in other years, and
it is about 6 percentage points lower in early CEO tenure years than in later years (42% of the recession
effect). Columns (6)-(7) show that the effects of CEO tenure and the business cycle on asset growth and
employment growth are comparable in magnitude. The CEO cycle effect on corporate investment is non-
trivial compared to the effect of the business cycle.
Political uncertainty: Julio and Yook (2012) estimate the extent to which corporate investment
varies over the political election cycle. These authors find that the corporate investment rate (capital
expenditures scaled by the beginning-of-year book assets) is on average 0.4 percentage point lower in
national election years than in non-election years, or a 5% reduction relative to the sample median rate
(=5.1%). If we use the same definition of investment rate as in their study, then our estimates indicate that
the investment rate is 1.0 percentage point lower in early CEO tenure years than in later years, an almost
20% reduction relative to the sample median of 5.2%. This estimate is more than double the election cycle
effect documented by Julio and Yook (2012).
Financial constraints: If firms face financial constraints, meaning that their cost of finance
exceeds the appropriate risk-adjusted rate of return, then firms’ investment is likely to be reduced. Using a
text-based approach to measure the existence of financial constraints, Ball, Hoberg and Maksimovic (2013)
estimate that during the 2008-2009 Financial Crisis, a one standard-deviation increase in financial
constraint is associated with a decrease in the annual corporate investment rate (CAPX scaled by sales) in
the range of 0% to 0.8%, depending on the measure of financial constraint they use. In other years, the
estimated effect of financial constraints on investment is smaller than during the Financial Crisis. If we
convert our estimates to comparable units, our estimates imply that the difference in investment rate
between early and late years of the CEO cycle is about 0.4%, in the range that Ball, Hoberg and
Maksimovic find for the Financial Crisis and larger than what they find in other periods.23
23 A previous draft of this paper included estimates of increases to corporate income taxes on investment; we dropped
this discussion because the estimates differed so dramatically. For example, contrast the very large estimates of taxes
on investments in Summers et al. (1980) with the much smaller ones in Desai and Goolsbee (2004).
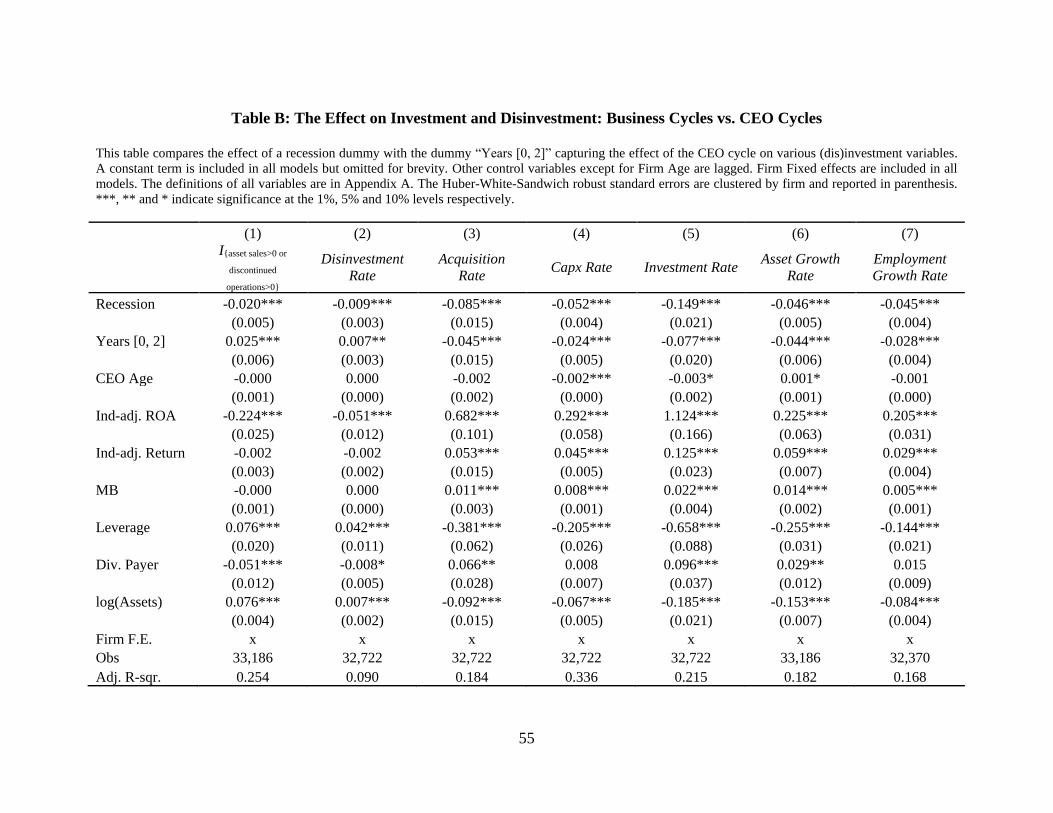
55
Table B: The Effect on Investment and Disinvestment: Business Cycles vs. CEO Cycles
This table compares the effect of a recession dummy with the dummy “Years [0, 2]” capturing the effect of the CEO cycle on various (dis)investment variables.
A constant term is included in all models but omitted for brevity. Other control variables except for Firm Age are lagged. Firm Fixed effects are included in all
models. The definitions of all variables are in Appendix A. The Huber-White-Sandwich robust standard errors are clustered by firm and reported in parenthesis.
***, ** and * indicate significance at the 1%, 5% and 10% levels respectively.
(1) (2) (3) (4) (5) (6) (7)
I{asset sales>0 or
discontinued
operations>0}
Disinvestment
Rate
Acquisition
Rate Capx Rate Investment Rate
Asset Growth
Rate
Employment
Growth Rate
Recession -0.020*** -0.009*** -0.085*** -0.052*** -0.149*** -0.046*** -0.045***
(0.005) (0.003) (0.015) (0.004) (0.021) (0.005) (0.004)
Years [0, 2] 0.025*** 0.007** -0.045*** -0.024*** -0.077*** -0.044*** -0.028***
(0.006) (0.003) (0.015) (0.005) (0.020) (0.006) (0.004)
CEO Age -0.000 0.000 -0.002 -0.002*** -0.003* 0.001* -0.001
(0.001) (0.000) (0.002) (0.000) (0.002) (0.001) (0.000)
Ind-adj. ROA -0.224*** -0.051*** 0.682*** 0.292*** 1.124*** 0.225*** 0.205***
(0.025) (0.012) (0.101) (0.058) (0.166) (0.063) (0.031)
Ind-adj. Return -0.002 -0.002 0.053*** 0.045*** 0.125*** 0.059*** 0.029***
(0.003) (0.002) (0.015) (0.005) (0.023) (0.007) (0.004)
MB -0.000 0.000 0.011*** 0.008*** 0.022*** 0.014*** 0.005***
(0.001) (0.000) (0.003) (0.001) (0.004) (0.002) (0.001)
Leverage 0.076*** 0.042*** -0.381*** -0.205*** -0.658*** -0.255*** -0.144***
(0.020) (0.011) (0.062) (0.026) (0.088) (0.031) (0.021)
Div. Payer -0.051*** -0.008* 0.066** 0.008 0.096*** 0.029** 0.015
(0.012) (0.005) (0.028) (0.007) (0.037) (0.012) (0.009)
log(Assets) 0.076*** 0.007*** -0.092*** -0.067*** -0.185*** -0.153*** -0.084***
(0.004) (0.002) (0.015) (0.005) (0.021) (0.007) (0.004)
Firm F.E. x x x x x x x
Obs 33,186 32,722 32,722 32,722 32,722 33,186 32,370
Adj. R-sqr. 0.254 0.090 0.184 0.336 0.215 0.182 0.168
56
Appendix C: Industry Productivity Shocks and CEO Investment Cycles
In Appendix Table C, we examine the impact of industry productivity shocks on the magnitudes of
the CEO investment cycles. We use a variety of measures to capture the changes in industry conditions as
of the CEO turnover year. We examine changes in the industry median of ROA, sales growth rate,
employment growth rate, and in the industry total factor productivity. The industry total factor productivity
is constructed following Jorgenson and Griliches (1976). 24 For each industry shock measure, we also
capture the changes over different horizons: year-to-year changes and three-year cumulative changes. Then
we classify the nature of the shock by dividing turnover-year industry conditions into negative, neutral, or
positive shocks based on the tercile distribution (bottom, middle, top) of each industry shock measure. This
procedure generates 24 categories of industry conditions at the time of CEO turnover: 4 (performance
measures) * 2 (horizons) * 3 (types) =24. Finally, within each of the 24 categories, we estimate the
magnitudes of the CEO disinvestment cycle (Panel A) and the investment cycle (Panel B) using the
baseline regressions in Tables 2 and 3. We report the coefficient estimate for the “Years [0,2]” indicator
variable and its standard error under each category.
The results in Table C show that both the CEO disinvestment cycle and the investment cycle exist
regardless of the industry condition in which the CEO takes office. Moreover, even the magnitudes of the
cycles are similar across industry conditions. These results suggest that the CEO cycle does not occur
because of productivity shocks coinciding with the CEO changes.
24 Dale Jorgenson provides data on industry input and output for 35 sectors (see ind.comm.detail.doc) for 1960 –
2005. In this data set, he provides the price and quantity of industry output, as well as the price and quantity of inputs,
including capital, labor, (intermediate use of) energy, materials, agriculture, metallic materials, non-metallic
materials, services materials, textile-apparel, wood paper, other services, Fab-other metals, machinery materials, and
equipment.
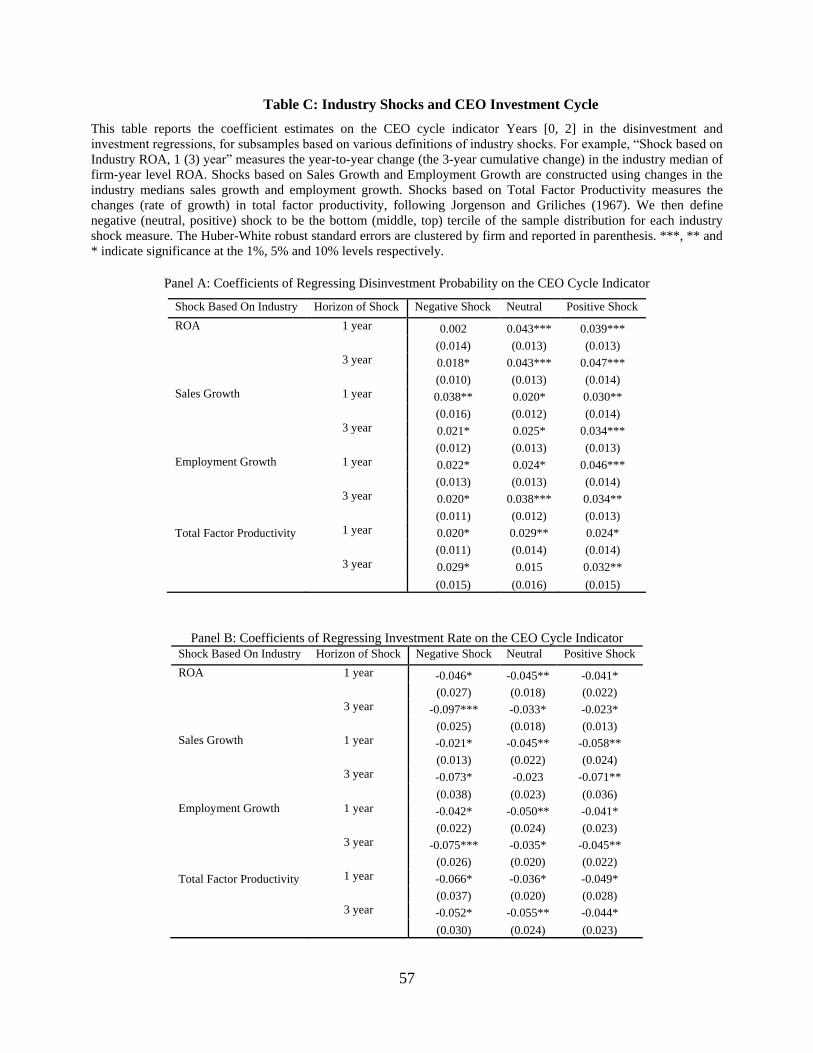
57
Table C: Industry Shocks and CEO Investment Cycle
This table reports the coefficient estimates on the CEO cycle indicator Years [0, 2] in the disinvestment and
investment regressions, for subsamples based on various definitions of industry shocks. For example, “Shock based on
Industry ROA, 1 (3) year” measures the year-to-year change (the 3-year cumulative change) in the industry median of
firm-year level ROA. Shocks based on Sales Growth and Employment Growth are constructed using changes in the
industry medians sales growth and employment growth. Shocks based on Total Factor Productivity measures the
changes (rate of growth) in total factor productivity, following Jorgenson and Griliches (1967). We then define
negative (neutral, positive) shock to be the bottom (middle, top) tercile of the sample distribution for each industry
shock measure. The Huber-White robust standard errors are clustered by firm and reported in parenthesis. ***, ** and
* indicate significance at the 1%, 5% and 10% levels respectively.
Panel A: Coefficients of Regressing Disinvestment Probability on the CEO Cycle Indicator
Panel B: Coefficients of Regressing Investment Rate on the CEO Cycle Indicator
Shock Based On Industry Horizon of Shock Negative Shock Neutral Positive Shock
ROA 1 year 0.002 0.043*** 0.039***
(0.014) (0.013) (0.013)
3 year 0.018* 0.043*** 0.047***
(0.010) (0.013) (0.014)
Sales Growth 1 year 0.038** 0.020* 0.030**
(0.016) (0.012) (0.014)
3 year 0.021* 0.025* 0.034***
(0.012) (0.013) (0.013)
Employment Growth 1 year 0.022* 0.024* 0.046***
(0.013) (0.013) (0.014)
3 year 0.020* 0.038*** 0.034**
(0.011) (0.012) (0.013)
Total Factor Productivity 1 year 0.020* 0.029** 0.024*
(0.011) (0.014) (0.014)
3 year 0.029* 0.015 0.032**
(0.015) (0.016) (0.015)
Shock Based On Industry Horizon of Shock Negative Shock Neutral Positive Shock
ROA 1 year -0.046* -0.045** -0.041*
(0.027) (0.018) (0.022)
3 year -0.097*** -0.033* -0.023*
(0.025) (0.018) (0.013)
Sales Growth 1 year -0.021* -0.045** -0.058**
(0.013) (0.022) (0.024)
3 year -0.073* -0.023 -0.071**
(0.038) (0.023) (0.036)
Employment Growth 1 year -0.042* -0.050** -0.041*
(0.022) (0.024) (0.023)
3 year -0.075*** -0.035* -0.045**
(0.026) (0.020) (0.022)
Total Factor Productivity 1 year -0.066* -0.036* -0.049*
(0.037) (0.020) (0.028)
3 year -0.052* -0.055** -0.044*
(0.030) (0.024) (0.023)