Embed Size (px)
Citation preview

August 25, 2015 1
Investor Presentation
For the Quarter Ended – July 31, 2015
August 25, 2015
15Q3
August 25, 2015 2
Caution Regarding Forward-Looking Statements
Bank of Montreal’s public communications often include written or oral forward-looking statements. Statements of this type are included in this document, and may be included in other filings with Canadian securities regulators or the U.S. Securities and Exchange Commission, or in other communications. All such statements are made pursuant to the “safe harbor” provisions of, and are intended to be forward-looking statements under, the United States Private Securities Litigation Reform Act of 1995 and any applicable Canadian securities legislation. Forward-looking statements may involve, but are not limited to, comments with respect to our objectives and priorities for 2015 and beyond, our strategies or future actions, our targets, expectations for our financial condition or share price, and the results of or outlook for our operations or for the Canadian, U.S. and international economies.
By their nature, forward-looking statements require us to make assumptions and are subject to inherent risks and uncertainties. There is significant risk that predictions, forecasts, conclusions or projections will not prove to be accurate, that our assumptions may not be correct and that actual results may differ materially from such predictions, forecasts, conclusions or projections. We caution readers of this document not to place undue reliance on our forward-looking statements as a number of factors could cause actual future results, conditions, actions or events to differ materially from the targets, expectations, estimates or intentions expressed in the forward-looking statements.
The future outcomes that relate to forward-looking statements may be influenced by many factors, including but not limited to: general economic and market conditions in the countries in which we operate; weak, volatile or illiquid capital and/or credit markets; interest rate and currency value fluctuations; changes in monetary, fiscal, tax or economic policy; the degree of competition in the geographic and business areas in which we operate; changes in laws or in supervisory expectations or requirements, including capital, interest rate and liquidity requirements and guidance; judicial or regulatory proceedings; the accuracy and completeness of the information we obtain with respect to our customers and counterparties; our ability to execute our strategic plans and to complete and integrate acquisitions, including obtaining regulatory approvals; critical accounting estimates and the effect of changes to accounting standards, rules and interpretations on these estimates; operational and infrastructure risks; changes to our credit ratings; general political conditions; global capital markets activities; the possible effects on our business of war or terrorist activities; disease or illness that affects local, national or international economies; natural disasters and disruptions to public infrastructure, such as transportation, communications, power or water supply; technological changes; and our ability to anticipate and effectively manage risks associated with all of the foregoing factors.
We caution that the foregoing list is not exhaustive of all possible factors. Other factors and risks could adversely affect our results. For more information, please see the Enterprise-Wide Risk Management section on pages 77 to 105 of BMO’s 2014 Annual MD&A, which outlines in detail certain key factors and risks that may affect Bank of Montreal’s future results. When relying on forward-looking statements to make decisions with respect to Bank of Montreal, investors and others should carefully consider these factors and risks, as well as other uncertainties and potential events, and the inherent uncertainty of forward-looking statements. Bank of Montreal does not undertake to update any forward-looking statements, whether written or oral, that may be made from time to time by the organization or on its behalf, except as required by law. The forward-looking information contained in this document is presented for the purpose of assisting our shareholders in understanding our financial position as at and for the periods ended on the dates presented, as well as our strategic priorities and objectives, and may not be appropriate for other purposes.
Assumptions about the performance of the Canadian and U.S. economies, as well as overall market conditions and their combined effect on our business, are material factors we consider when determining our strategic priorities, objectives and expectations for our business. In determining our expectations for economic growth, both broadly and in the financial services sector, we primarily consider historical economic data provided by the Canadian and U.S. governments and their agencies. See the Economic Review and Outlook section of our Third Quarter 2015 Report to Shareholders.
Non-GAAP Measures
Bank of Montreal uses both GAAP and non-GAAP measures to assess performance. Readers are cautioned that earnings and other measures adjusted to a basis other than GAAP do not have standardized meanings under GAAP and are unlikely to be comparable to similar measures used by other companies. Reconciliations of GAAP to non-GAAP measures as well as the rationale for their use can be found in Bank of Montreal’s Third Quarter 2015 Report to Shareholders and BMO’s 2014 Annual Report, all of which are available on our website at www.bmo.com/investorrelations.
Examples of non-GAAP amounts or measures include: efficiency and leverage ratios; revenue and other measures presented on a taxable equivalent basis (teb); amounts presented net of applicable taxes; adjusted net income, revenues, non-interest expenses, earnings per share, effective tax rate, ROE, efficiency ratio and other adjusted measures which exclude the impact of certain items such as, acquisition integration costs, amortization of acquisition-related intangible assets, decrease (increase) in collective allowance for credit losses and restructuring costs.
Bank of Montreal provides supplemental information on combined business segments to facilitate comparisons to peers.
Forward looking statements & non-GAAP measures
August 25, 2015 3
Strategic Highlights
For the Quarter Ended – July 31, 2015
August 25, 2015
Bill DowneChief Executive Officer
15Q3
Strategic Highlights August 25, 2015 4
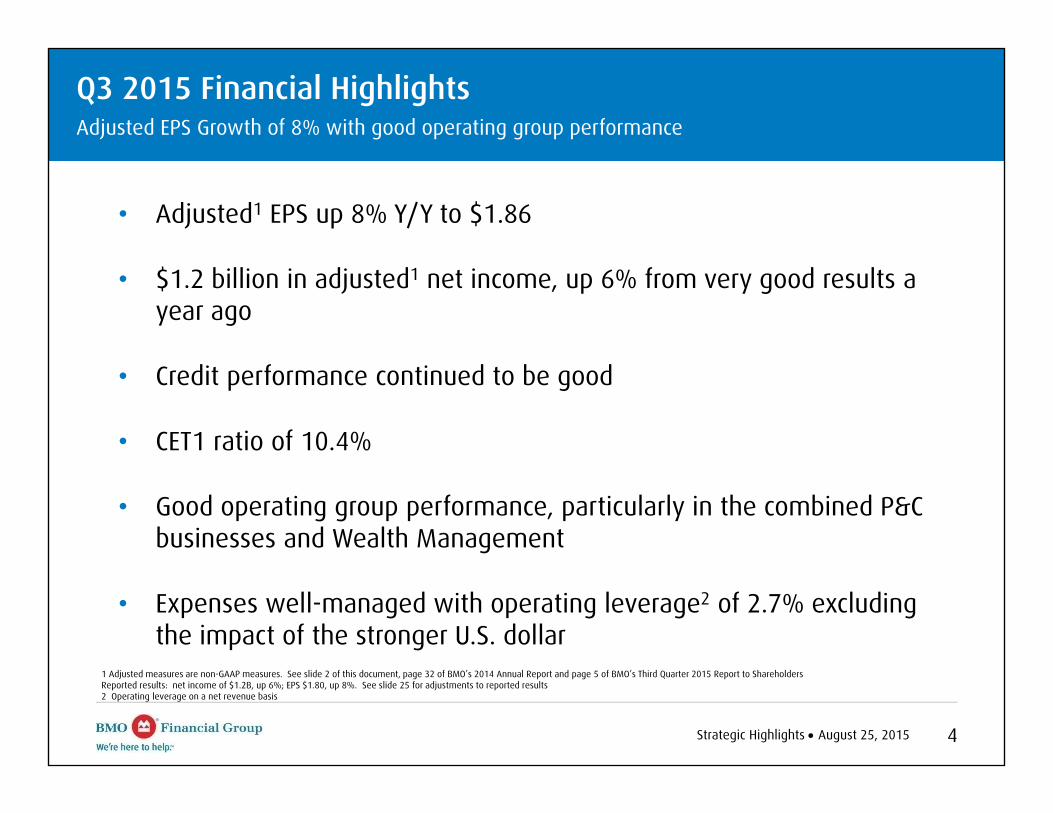
• Adjusted1 EPS up 8% Y/Y to $1.86
• $1.2 billion in adjusted1 net income, up 6% from very good results a year ago
• Credit performance continued to be good
• CET1 ratio of 10.4%
• Good operating group performance, particularly in the combined P&C businesses and Wealth Management
• Expenses well-managed with operating leverage2 of 2.7% excluding the impact of the stronger U.S. dollar
Q3 2015 Financial HighlightsAdjusted EPS Growth of 8% with good operating group performance
1 Adjusted measures are non-GAAP measures. See slide 2 of this document, page 32 of BMO’s 2014 Annual Report and page 5 of BMO’s Third Quarter 2015 Report to ShareholdersReported results: net income of $1.2B, up 6%; EPS $1.80, up 8%. See slide 25 for adjustments to reported results2 Operating leverage on a net revenue basis
Strategic Highlights August 25, 2015 5
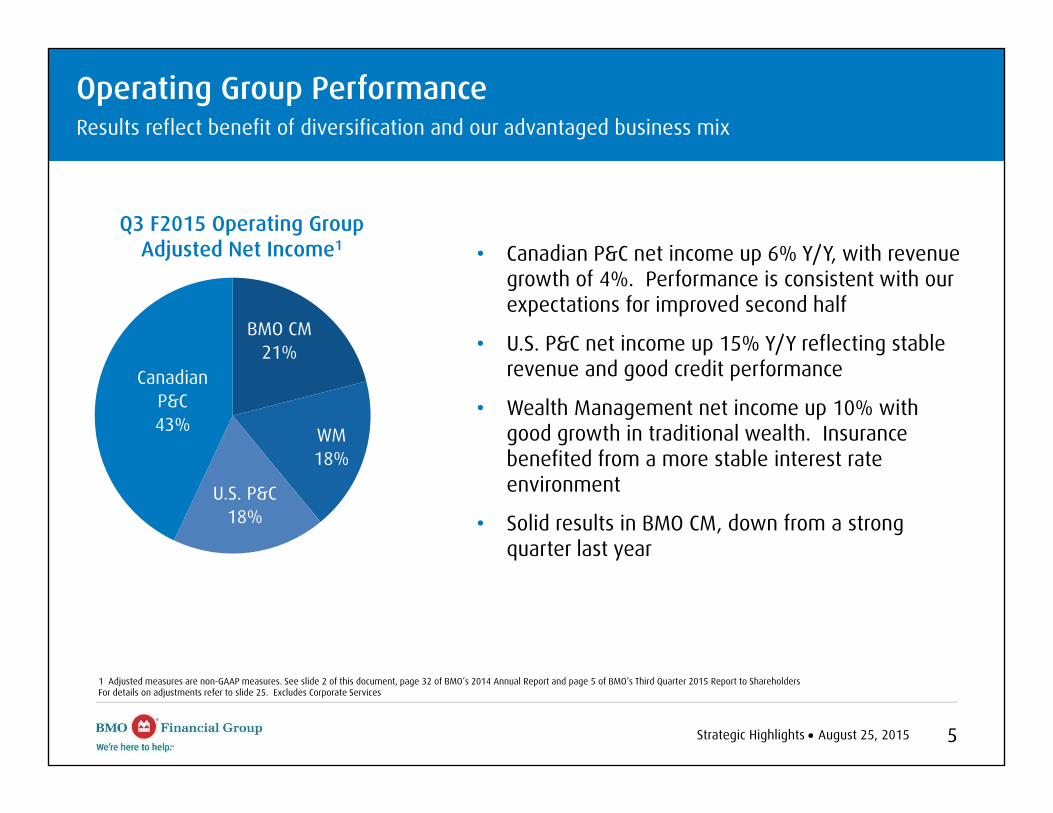
• Canadian P&C net income up 6% Y/Y, with revenue growth of 4%. Performance is consistent with our expectations for improved second half
• U.S. P&C net income up 15% Y/Y reflecting stable revenue and good credit performance
• Wealth Management net income up 10% with good growth in traditional wealth. Insurance benefited from a more stable interest rate environment
• Solid results in BMO CM, down from a strong quarter last year
Operating Group Performance Results reflect benefit of diversification and our advantaged business mix
Q3 F2015 Operating GroupAdjusted Net Income1
Wealth Management
19%
1 Adjusted measures are non-GAAP measures. See slide 2 of this document, page 32 of BMO’s 2014 Annual Report and page 5 of BMO’s Third Quarter 2015 Report to ShareholdersFor details on adjustments refer to slide 25. Excludes Corporate Services
BMO CM21%
WM18%
U.S. P&C18%
Canadian P&C43%
Strategic Highlights August 25, 2015 6
Expand strategically in select global markets to create future growth.
12345
Achieve industry-leading customer loyalty by delivering on our brand promise.
Enhance productivity to drive performance and shareholder value.
Leverage our consolidated North American platform to deliver quality earnings growth.
Ensure our strength in risk management underpins everything we do for our customers.
Clear and Consistent Strategy
Financial Results Month xx, 2015 7
Financial ResultsFor the Quarter Ended – July 31, 2015
August 25, 2015
Tom FlynnChief Financial Officer
15Q3
Financial Results August 25, 2015 8
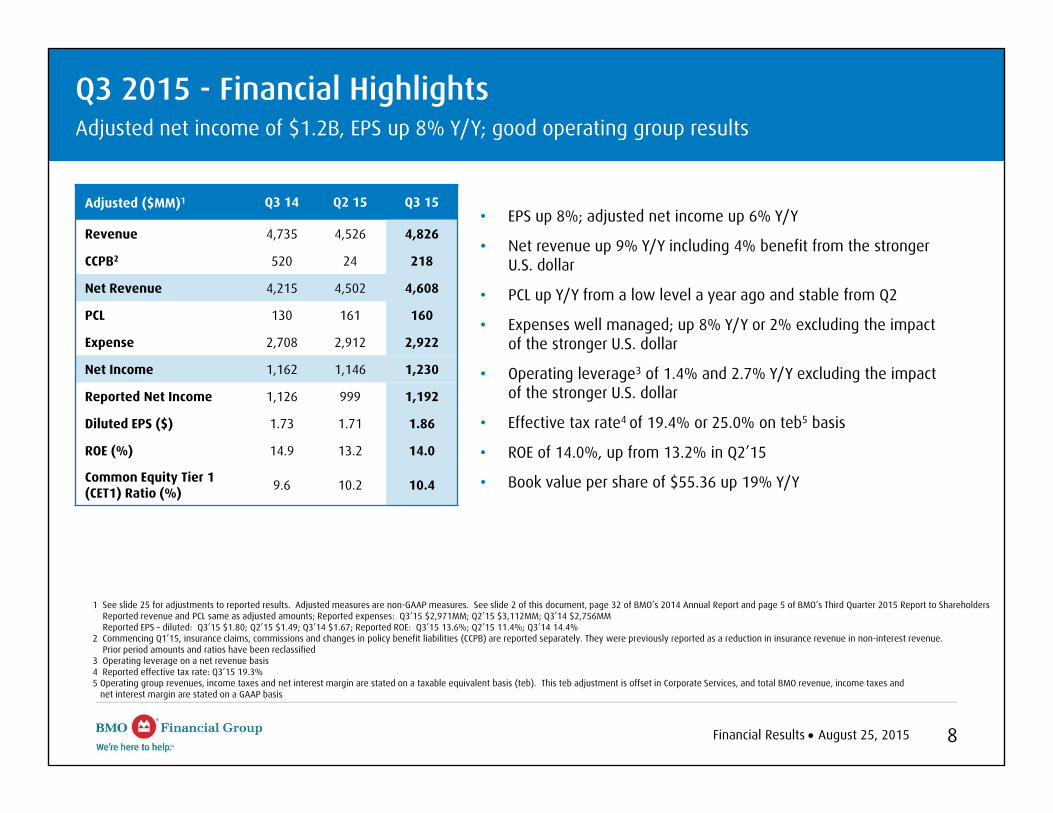
Adjusted ($MM)1 Q3 14 Q2 15 Q3 15
Revenue 4,735 4,526 4,826
CCPB2 520 24 218
Net Revenue 4,215 4,502 4,608
PCL 130 161 160
Expense 2,708 2,912 2,922
Net Income 1,162 1,146 1,230
Reported Net Income 1,126 999 1,192
Diluted EPS ($) 1.73 1.71 1.86
ROE (%) 14.9 13.2 14.0
Common Equity Tier 1 (CET1) Ratio (%) 9.6 10.2 10.4
• EPS up 8%; adjusted net income up 6% Y/Y
• Net revenue up 9% Y/Y including 4% benefit from the stronger U.S. dollar
• PCL up Y/Y from a low level a year ago and stable from Q2
• Expenses well managed; up 8% Y/Y or 2% excluding the impact of the stronger U.S. dollar
• Operating leverage3 of 1.4% and 2.7% Y/Y excluding the impact of the stronger U.S. dollar
• Effective tax rate4 of 19.4% or 25.0% on teb5 basis
• ROE of 14.0%, up from 13.2% in Q2’15
• Book value per share of $55.36 up 19% Y/Y
Q3 2015 - Financial HighlightsAdjusted net income of $1.2B, EPS up 8% Y/Y; good operating group results
1 See slide 25 for adjustments to reported results. Adjusted measures are non-GAAP measures. See slide 2 of this document, page 32 of BMO’s 2014 Annual Report and page 5 of BMO’s Third Quarter 2015 Report to ShareholdersReported revenue and PCL same as adjusted amounts; Reported expenses: Q3’15 $2,971MM; Q2’15 $3,112MM; Q3’14 $2,756MMReported EPS – diluted: Q3’15 $1.80; Q2’15 $1.49; Q3’14 $1.67; Reported ROE: Q3’15 13.6%; Q2’15 11.4%; Q3’14 14.4%
2 Commencing Q1’15, insurance claims, commissions and changes in policy benefit liabilities (CCPB) are reported separately. They were previously reported as a reduction in insurance revenue in non-interest revenue. Prior period amounts and ratios have been reclassified
3 Operating leverage on a net revenue basis4 Reported effective tax rate: Q3’15 19.3%5 Operating group revenues, income taxes and net interest margin are stated on a taxable equivalent basis (teb). This teb adjustment is offset in Corporate Services, and total BMO revenue, income taxes and
net interest margin are stated on a GAAP basis
Financial Results August 25, 2015 9
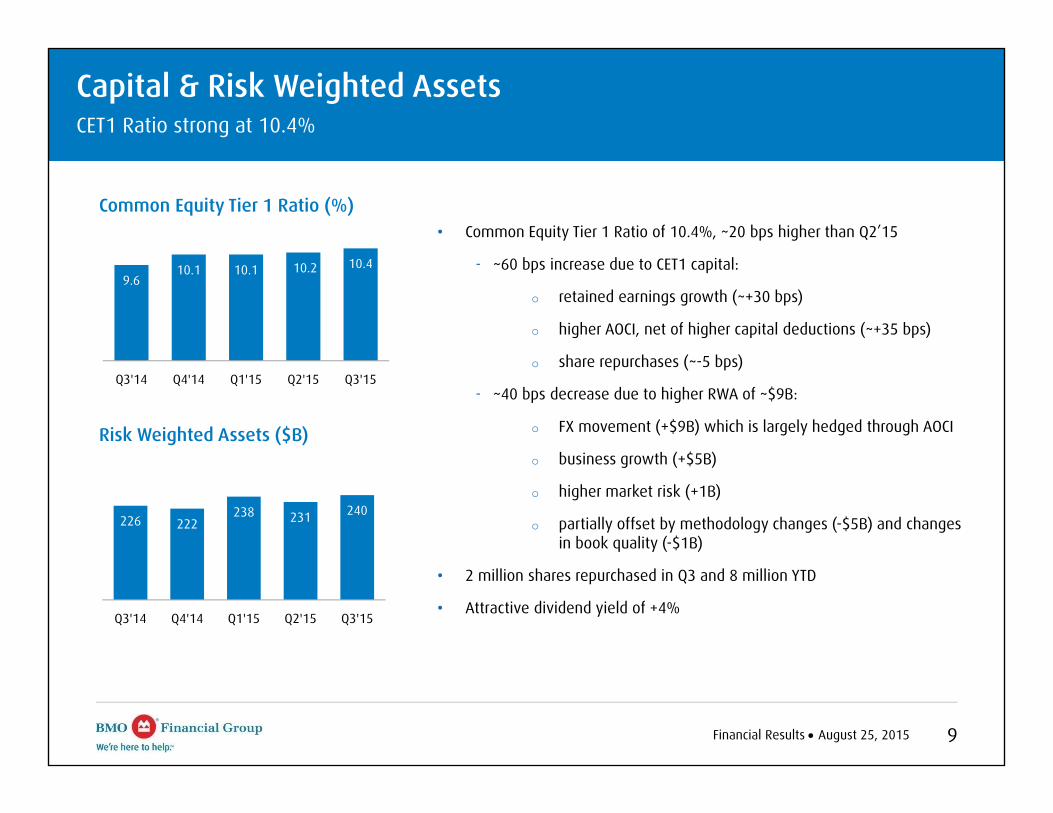
Capital & Risk Weighted AssetsCET1 Ratio strong at 10.4%
9.610.1 10.1 10.2 10.4
Q3'14 Q4'14 Q1'15 Q2'15 Q3'15
Common Equity Tier 1 Ratio (%)
226 222238 231 240
Q3'14 Q4'14 Q1'15 Q2'15 Q3'15
Risk Weighted Assets ($B)
• Common Equity Tier 1 Ratio of 10.4%, ~20 bps higher than Q2’15
- ~60 bps increase due to CET1 capital:
o retained earnings growth (~+30 bps)
o higher AOCI, net of higher capital deductions (~+35 bps)
o share repurchases (~-5 bps)
- ~40 bps decrease due to higher RWA of ~$9B:
o FX movement (+$9B) which is largely hedged through AOCI
o business growth (+$5B)
o higher market risk (+1B)
o partially offset by methodology changes (-$5B) and changes in book quality (-$1B)
• 2 million shares repurchased in Q3 and 8 million YTD
• Attractive dividend yield of +4%
Financial Results August 25, 2015 10
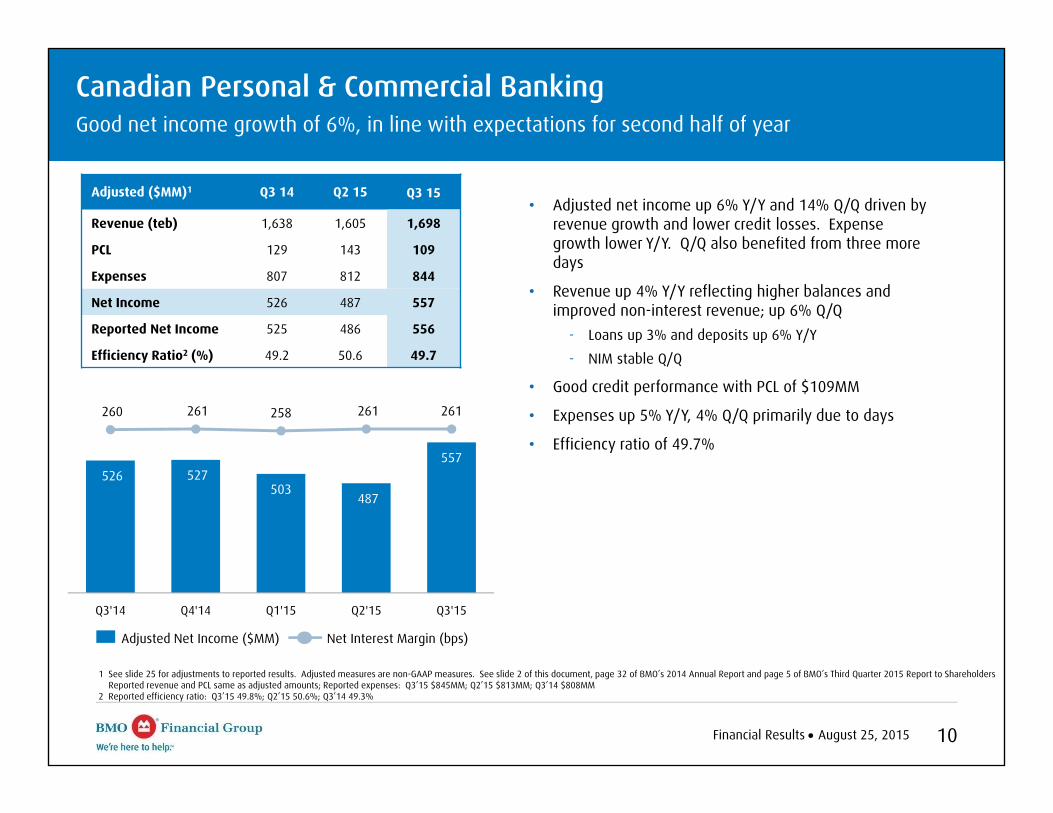
Canadian Personal & Commercial BankingGood net income growth of 6%, in line with expectations for second half of year
526 527 503
487
557
260 261 258 261 261
Q3'14 Q4'14 Q1'15 Q2'15 Q3'15
Adjusted Net Income ($MM) Net Interest Margin (bps)
• Adjusted net income up 6% Y/Y and 14% Q/Q driven by revenue growth and lower credit losses. Expense growth lower Y/Y. Q/Q also benefited from three more days
• Revenue up 4% Y/Y reflecting higher balances and improved non-interest revenue; up 6% Q/Q
- Loans up 3% and deposits up 6% Y/Y
- NIM stable Q/Q
• Good credit performance with PCL of $109MM
• Expenses up 5% Y/Y, 4% Q/Q primarily due to days
• Efficiency ratio of 49.7%
1 See slide 25 for adjustments to reported results. Adjusted measures are non-GAAP measures. See slide 2 of this document, page 32 of BMO’s 2014 Annual Report and page 5 of BMO’s Third Quarter 2015 Report to ShareholdersReported revenue and PCL same as adjusted amounts; Reported expenses: Q3’15 $845MM; Q2’15 $813MM; Q3’14 $808MM
2 Reported efficiency ratio: Q3’15 49.8%; Q2’15 50.6%; Q3’14 49.3%
Adjusted ($MM)1 Q3 14 Q2 15 Q3 15
Revenue (teb) 1,638 1,605 1,698
PCL 129 143 109
Expenses 807 812 844
Net Income 526 487 557
Reported Net Income 525 486 556
Efficiency Ratio2 (%) 49.2 50.6 49.7
Financial Results August 25, 2015 11
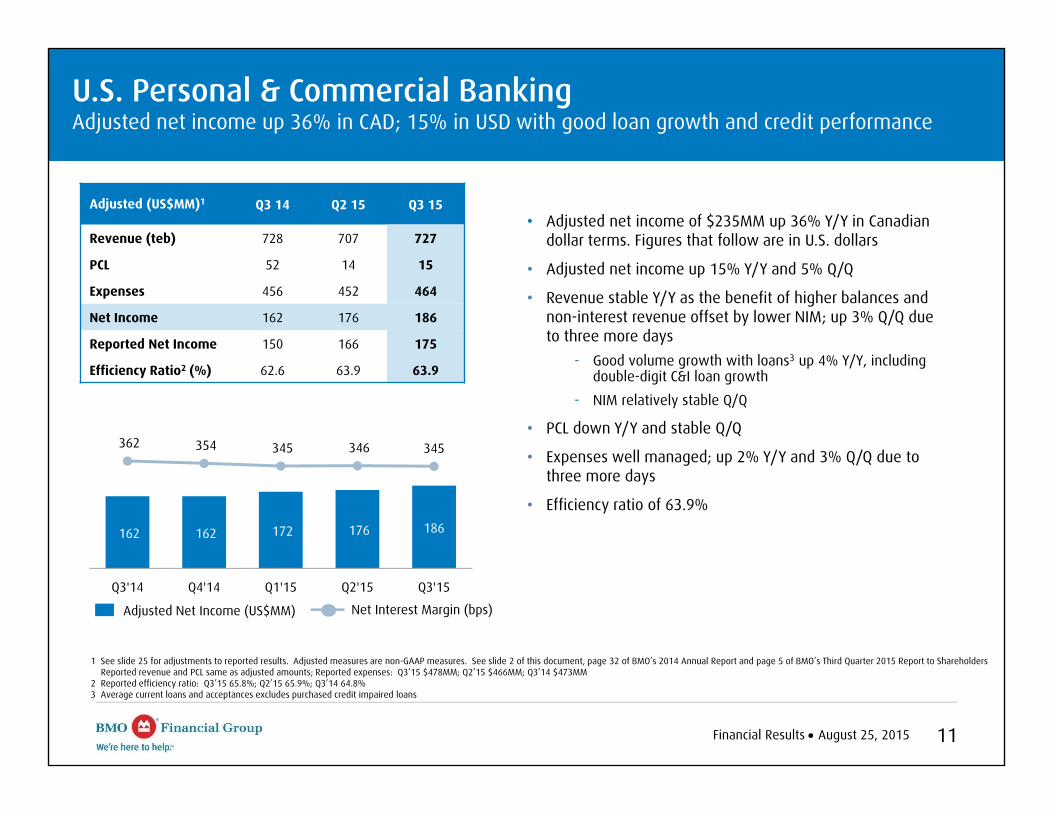
162 162 172 176 186
362 354 345 346 345
Q3'14 Q4'14 Q1'15 Q2'15 Q3'15
Net Interest Margin (bps)
Adjusted (US$MM)1 Q3 14 Q2 15 Q3 15
Revenue (teb) 728 707 727
PCL 52 14 15
Expenses 456 452 464
Net Income 162 176 186
Reported Net Income 150 166 175
Efficiency Ratio2 (%) 62.6 63.9 63.9
Adjusted Net Income (US$MM)
U.S. Personal & Commercial BankingAdjusted net income up 36% in CAD; 15% in USD with good loan growth and credit performance
1 See slide 25 for adjustments to reported results. Adjusted measures are non-GAAP measures. See slide 2 of this document, page 32 of BMO’s 2014 Annual Report and page 5 of BMO’s Third Quarter 2015 Report to ShareholdersReported revenue and PCL same as adjusted amounts; Reported expenses: Q3’15 $478MM; Q2’15 $466MM; Q3’14 $473MM
2 Reported efficiency ratio: Q3’15 65.8%; Q2’15 65.9%; Q3’14 64.8%3 Average current loans and acceptances excludes purchased credit impaired loans
• Adjusted net income of $235MM up 36% Y/Y in Canadian dollar terms. Figures that follow are in U.S. dollars
• Adjusted net income up 15% Y/Y and 5% Q/Q
• Revenue stable Y/Y as the benefit of higher balances and non-interest revenue offset by lower NIM; up 3% Q/Q due to three more days
- Good volume growth with loans3 up 4% Y/Y, including double-digit C&I loan growth
- NIM relatively stable Q/Q
• PCL down Y/Y and stable Q/Q
• Expenses well managed; up 2% Y/Y and 3% Q/Q due to three more days
• Efficiency ratio of 63.9%
Financial Results August 25, 2015 12
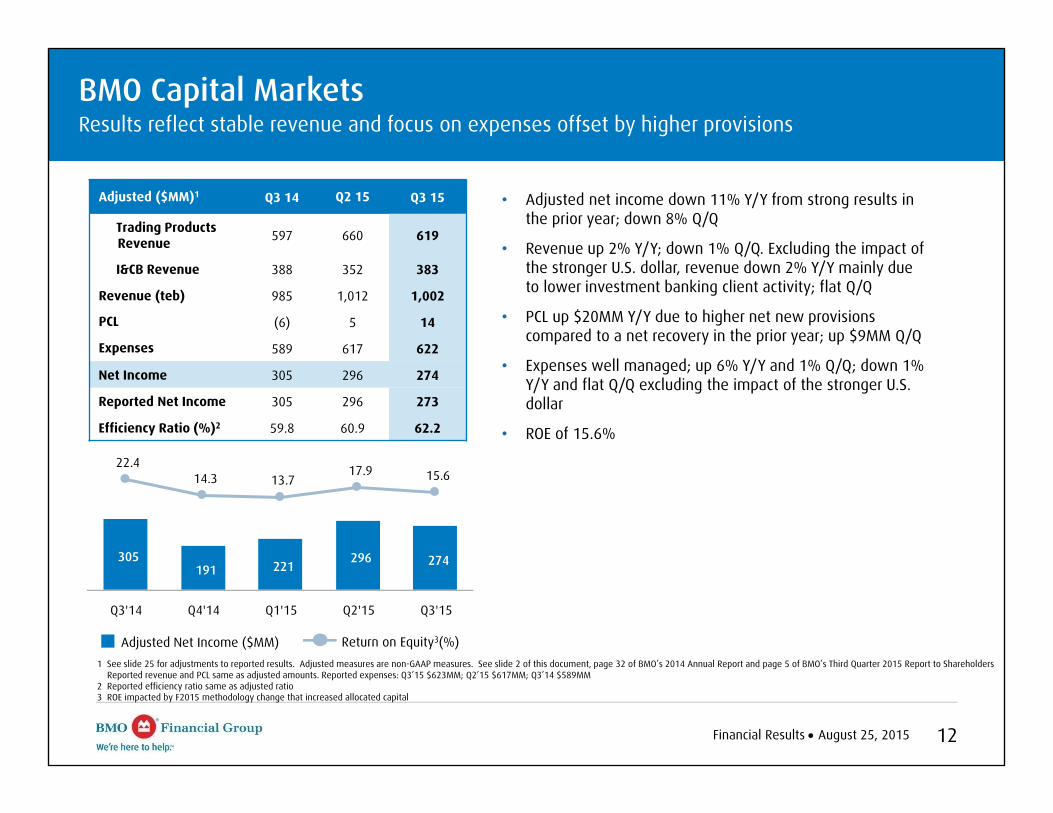
305 191 221
296 274
22.4 14.3 13.7
17.9 15.6
Q3'14 Q4'14 Q1'15 Q2'15 Q3'15
Adjusted Net Income ($MM) Return on Equity3(%)
BMO Capital MarketsResults reflect stable revenue and focus on expenses offset by higher provisions
• Adjusted net income down 11% Y/Y from strong results in the prior year; down 8% Q/Q
• Revenue up 2% Y/Y; down 1% Q/Q. Excluding the impact of the stronger U.S. dollar, revenue down 2% Y/Y mainly due to lower investment banking client activity; flat Q/Q
• PCL up $20MM Y/Y due to higher net new provisions compared to a net recovery in the prior year; up $9MM Q/Q
• Expenses well managed; up 6% Y/Y and 1% Q/Q; down 1% Y/Y and flat Q/Q excluding the impact of the stronger U.S. dollar
• ROE of 15.6%
Adjusted ($MM)1 Q3 14 Q2 15 Q3 15
Trading Products Revenue 597 660 619
I&CB Revenue 388 352 383
Revenue (teb) 985 1,012 1,002
PCL (6) 5 14
Expenses 589 617 622
Net Income 305 296 274
Reported Net Income 305 296 273
Efficiency Ratio (%)2 59.8 60.9 62.2
1 See slide 25 for adjustments to reported results. Adjusted measures are non-GAAP measures. See slide 2 of this document, page 32 of BMO’s 2014 Annual Report and page 5 of BMO’s Third Quarter 2015 Report to ShareholdersReported revenue and PCL same as adjusted amounts. Reported expenses: Q3’15 $623MM; Q2’15 $617MM; Q3’14 $589MM
2 Reported efficiency ratio same as adjusted ratio3 ROE impacted by F2015 methodology change that increased allocated capital
Financial Results August 25, 2015 13
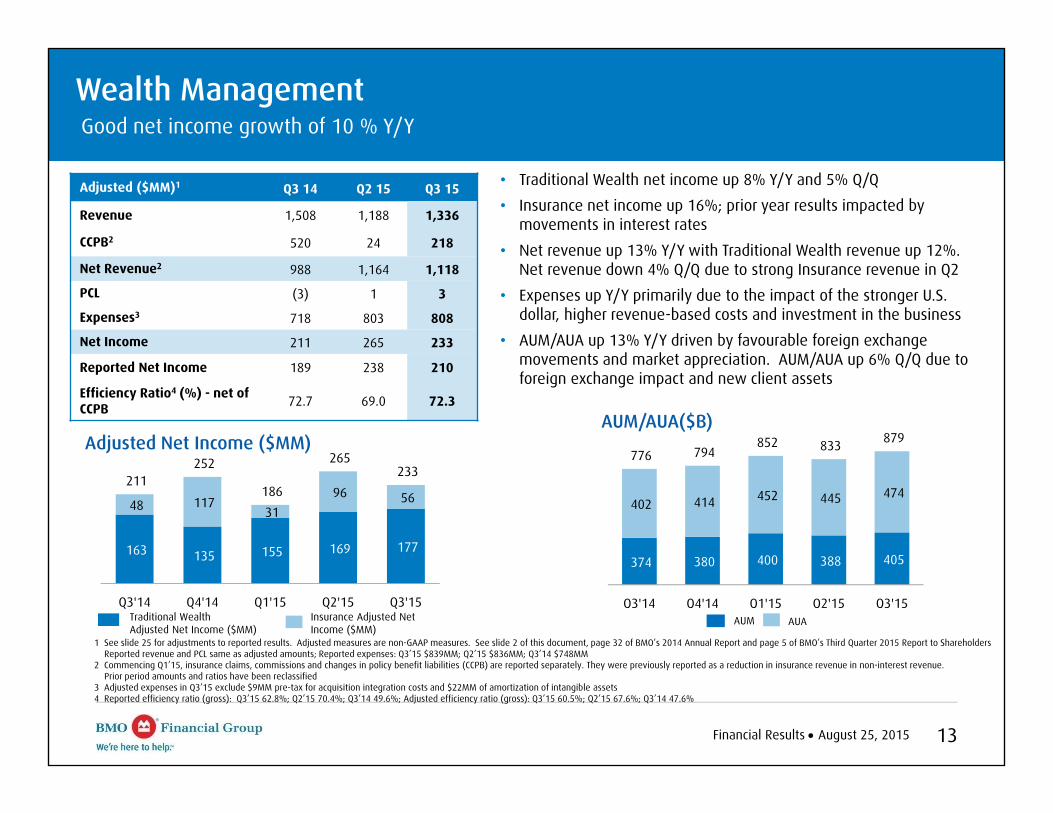
374 380 400 388 405
402 414 452 445 474
776 794 852 833 879
Q3'14 Q4'14 Q1'15 Q2'15 Q3'15Insurance Adjusted Net Income ($MM)
Traditional WealthAdjusted Net Income ($MM)
Adjusted ($MM)1 Q3 14 Q2 15 Q3 15
Revenue 1,508 1,188 1,336
CCPB2 520 24 218
Net Revenue2 988 1,164 1,118
PCL (3) 1 3
Expenses3 718 803 808
Net Income 211 265 233
Reported Net Income 189 238 210
Efficiency Ratio4 (%) - net of CCPB 72.7 69.0 72.3
Wealth ManagementGood net income growth of 10 % Y/Y
AUA AUM
Adjusted Net Income ($MM)
163 135 155 169 177
48 117 31
96 56 211
252
186
265 233
Q3'14 Q4'14 Q1'15 Q2'15 Q3'15
AUM/AUA($B)
• Traditional Wealth net income up 8% Y/Y and 5% Q/Q• Insurance net income up 16%; prior year results impacted by
movements in interest rates• Net revenue up 13% Y/Y with Traditional Wealth revenue up 12%.
Net revenue down 4% Q/Q due to strong Insurance revenue in Q2• Expenses up Y/Y primarily due to the impact of the stronger U.S.
dollar, higher revenue-based costs and investment in the business• AUM/AUA up 13% Y/Y driven by favourable foreign exchange
movements and market appreciation. AUM/AUA up 6% Q/Q due to foreign exchange impact and new client assets
1 See slide 25 for adjustments to reported results. Adjusted measures are non-GAAP measures. See slide 2 of this document, page 32 of BMO’s 2014 Annual Report and page 5 of BMO’s Third Quarter 2015 Report to ShareholdersReported revenue and PCL same as adjusted amounts; Reported expenses: Q3’15 $839MM; Q2’15 $836MM; Q3’14 $748MM
2 Commencing Q1’15, insurance claims, commissions and changes in policy benefit liabilities (CCPB) are reported separately. They were previously reported as a reduction in insurance revenue in non-interest revenue. Prior period amounts and ratios have been reclassified
3 Adjusted expenses in Q3’15 exclude $9MM pre-tax for acquisition integration costs and $22MM of amortization of intangible assets4 Reported efficiency ratio (gross): Q3’15 62.8%; Q2’15 70.4%; Q3’14 49.6%; Adjusted efficiency ratio (gross): Q3’15 60.5%; Q2’15 67.6%; Q3’14 47.6%
Financial Results August 25, 2015 14
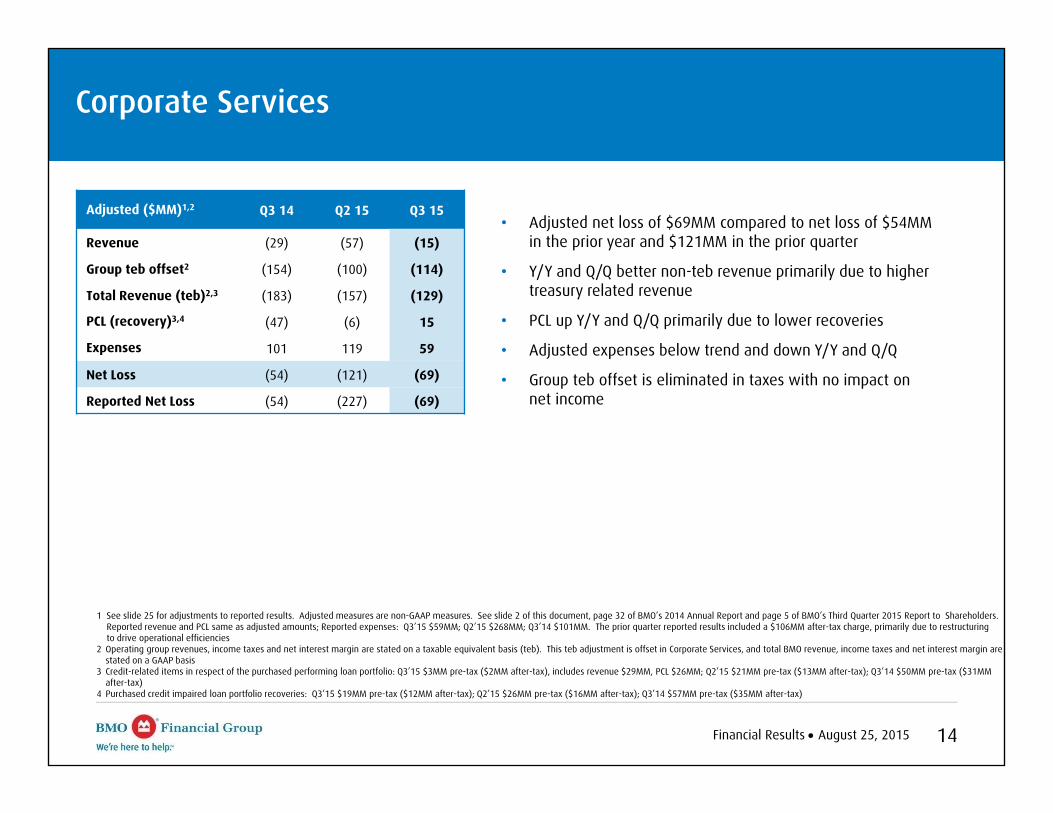
Corporate Services
• Adjusted net loss of $69MM compared to net loss of $54MM in the prior year and $121MM in the prior quarter
• Y/Y and Q/Q better non-teb revenue primarily due to higher treasury related revenue
• PCL up Y/Y and Q/Q primarily due to lower recoveries
• Adjusted expenses below trend and down Y/Y and Q/Q
• Group teb offset is eliminated in taxes with no impact on net income
Adjusted ($MM)1,2 Q3 14 Q2 15 Q3 15
Revenue (29) (57) (15)
Group teb offset2 (154) (100) (114)
Total Revenue (teb)2,3 (183) (157) (129)
PCL (recovery)3,4 (47) (6) 15
Expenses 101 119 59
Net Loss (54) (121) (69)
Reported Net Loss (54) (227) (69)
1 See slide 25 for adjustments to reported results. Adjusted measures are non-GAAP measures. See slide 2 of this document, page 32 of BMO’s 2014 Annual Report and page 5 of BMO’s Third Quarter 2015 Report to Shareholders.Reported revenue and PCL same as adjusted amounts; Reported expenses: Q3’15 $59MM; Q2’15 $268MM; Q3’14 $101MM. The prior quarter reported results included a $106MM after-tax charge, primarily due to restructuring to drive operational efficiencies
2 Operating group revenues, income taxes and net interest margin are stated on a taxable equivalent basis (teb). This teb adjustment is offset in Corporate Services, and total BMO revenue, income taxes and net interest margin are stated on a GAAP basis
3 Credit-related items in respect of the purchased performing loan portfolio: Q3’15 $3MM pre-tax ($2MM after-tax), includes revenue $29MM, PCL $26MM; Q2’15 $21MM pre-tax ($13MM after-tax); Q3’14 $50MM pre-tax ($31MM after-tax)
4 Purchased credit impaired loan portfolio recoveries: Q3’15 $19MM pre-tax ($12MM after-tax); Q2’15 $26MM pre-tax ($16MM after-tax); Q3’14 $57MM pre-tax ($35MM after-tax)
Financial Results Month xx, 2015 1515Q3
Risk ReviewFor the Quarter Ended – July 31, 2015
August 25, 2015
Surjit RajpalChief Risk Officer
Risk Review August 25, 2015 16
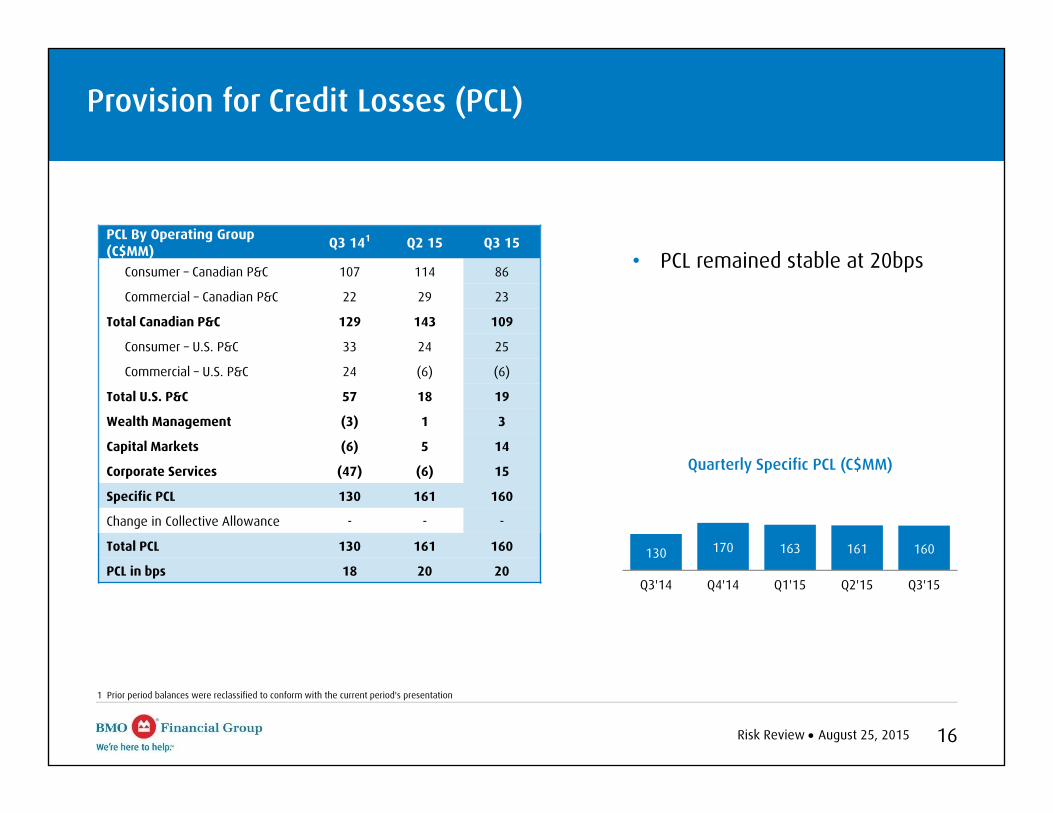
130 170 163 161 160
Q3'14 Q4'14 Q1'15 Q2'15 Q3'15
Quarterly Specific PCL (C$MM)
• PCL remained stable at 20bps
1 Prior period balances were reclassified to conform with the current period's presentation
Provision for Credit Losses (PCL)
PCL By Operating Group (C$MM) Q3 141 Q2 15 Q3 15
Consumer – Canadian P&C 107 114 86
Commercial – Canadian P&C 22 29 23
Total Canadian P&C 129 143 109
Consumer – U.S. P&C 33 24 25
Commercial – U.S. P&C 24 (6) (6)
Total U.S. P&C 57 18 19
Wealth Management (3) 1 3
Capital Markets (6) 5 14
Corporate Services (47) (6) 15
Specific PCL 130 161 160
Change in Collective Allowance - - -
Total PCL 130 161 160
PCL in bps 18 20 20
Risk Review August 25, 2015 17
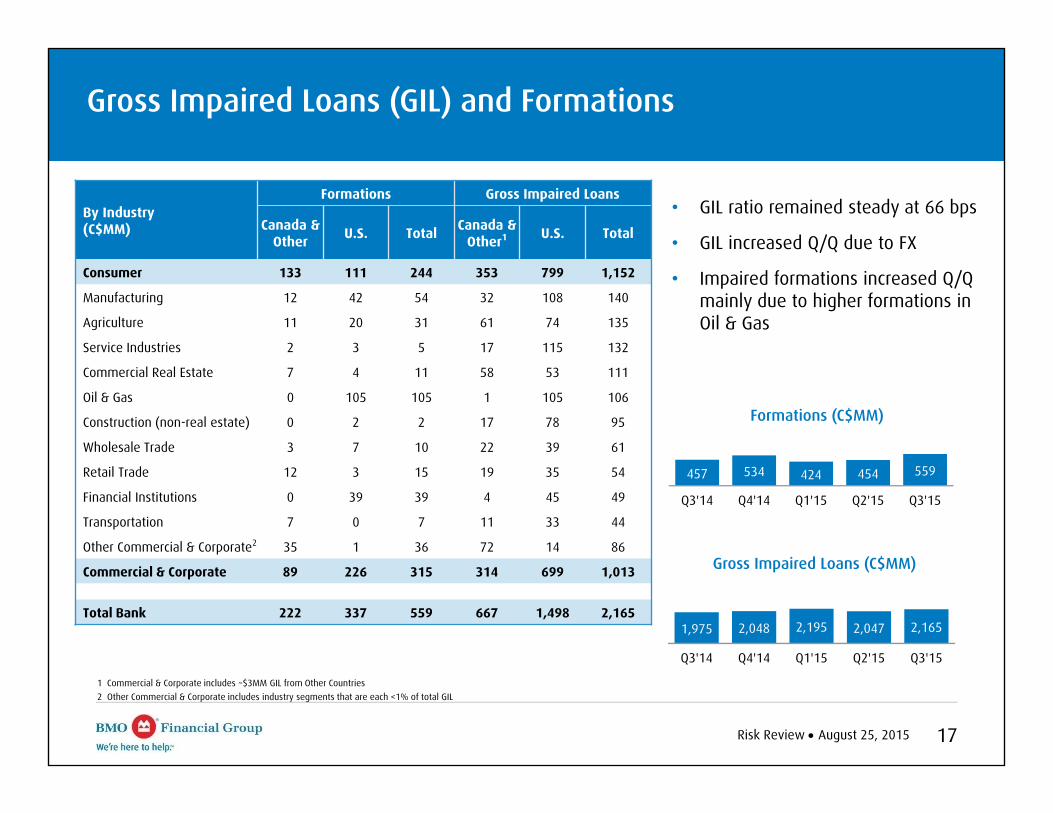
Gross Impaired Loans (GIL) and Formations
457 534 424 454 559
Q3'14 Q4'14 Q1'15 Q2'15 Q3'15
Formations (C$MM)
1,975 2,048 2,195 2,047 2,165
Q3'14 Q4'14 Q1'15 Q2'15 Q3'15
Gross Impaired Loans (C$MM)
1 Commercial & Corporate includes ~$3MM GIL from Other Countries2 Other Commercial & Corporate includes industry segments that are each <1% of total GIL
• GIL ratio remained steady at 66 bps
• GIL increased Q/Q due to FX
• Impaired formations increased Q/Q mainly due to higher formations in Oil & Gas
By Industry(C$MM)
Formations Gross Impaired Loans
Canada & Other U.S. Total Canada &
Other1 U.S. Total
Consumer 133 111 244 353 799 1,152
Manufacturing 12 42 54 32 108 140
Agriculture 11 20 31 61 74 135
Service Industries 2 3 5 17 115 132
Commercial Real Estate 7 4 11 58 53 111
Oil & Gas 0 105 105 1 105 106
Construction (non-real estate) 0 2 2 17 78 95
Wholesale Trade 3 7 10 22 39 61
Retail Trade 12 3 15 19 35 54
Financial Institutions 0 39 39 4 45 49
Transportation 7 0 7 11 33 44
Other Commercial & Corporate2 35 1 36 72 14 86
Commercial & Corporate 89 226 315 314 699 1,013
Total Bank 222 337 559 667 1,498 2,165
Risk Review August 25, 2015 18
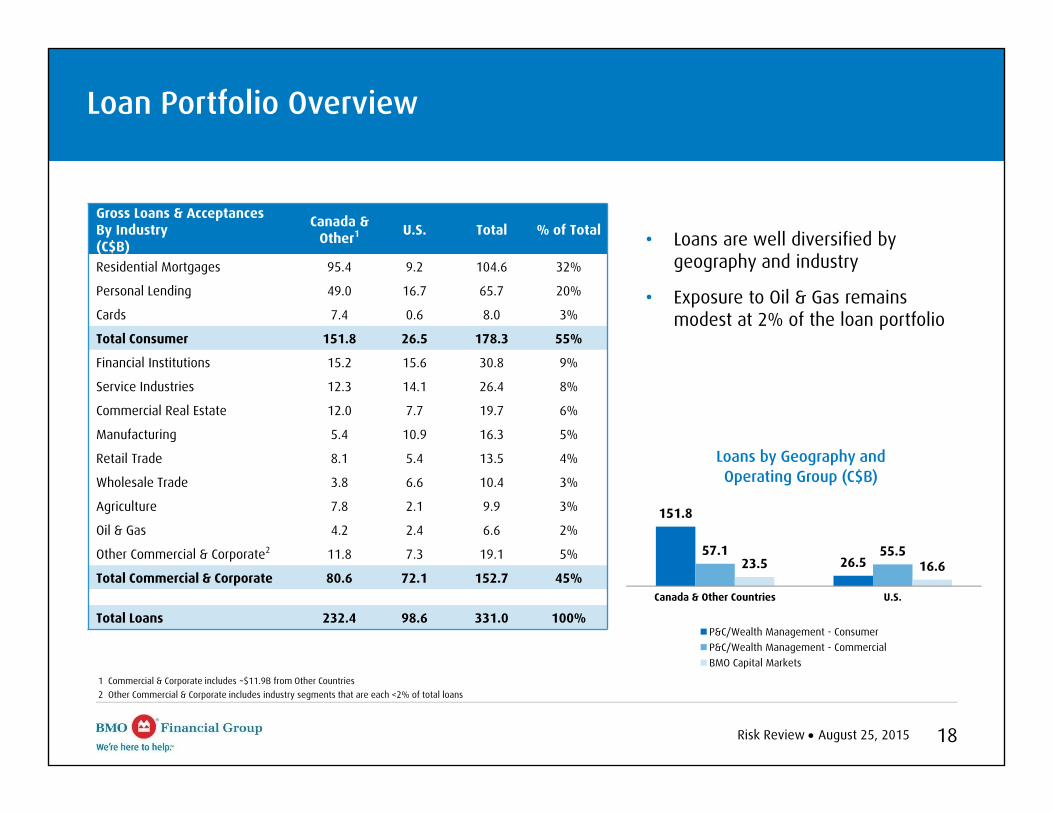
Loan Portfolio Overview
1 Commercial & Corporate includes ~$11.9B from Other Countries2 Other Commercial & Corporate includes industry segments that are each <2% of total loans
151.8
26.557.1 55.5
23.5 16.6
Canada & Other Countries U.S.
Loans by Geography and Operating Group (C$B)
P&C/Wealth Management - ConsumerP&C/Wealth Management - CommercialBMO Capital Markets
• Loans are well diversified by geography and industry
• Exposure to Oil & Gas remains modest at 2% of the loan portfolio
Gross Loans & Acceptances By Industry(C$B)
Canada & Other1 U.S. Total % of Total
Residential Mortgages 95.4 9.2 104.6 32%
Personal Lending 49.0 16.7 65.7 20%
Cards 7.4 0.6 8.0 3%
Total Consumer 151.8 26.5 178.3 55%
Financial Institutions 15.2 15.6 30.8 9%
Service Industries 12.3 14.1 26.4 8%
Commercial Real Estate 12.0 7.7 19.7 6%
Manufacturing 5.4 10.9 16.3 5%
Retail Trade 8.1 5.4 13.5 4%
Wholesale Trade 3.8 6.6 10.4 3%
Agriculture 7.8 2.1 9.9 3%
Oil & Gas 4.2 2.4 6.6 2%
Other Commercial & Corporate2 11.8 7.3 19.1 5%
Total Commercial & Corporate 80.6 72.1 152.7 45%
Total Loans 232.4 98.6 331.0 100%
Risk Review August 25, 2015 19
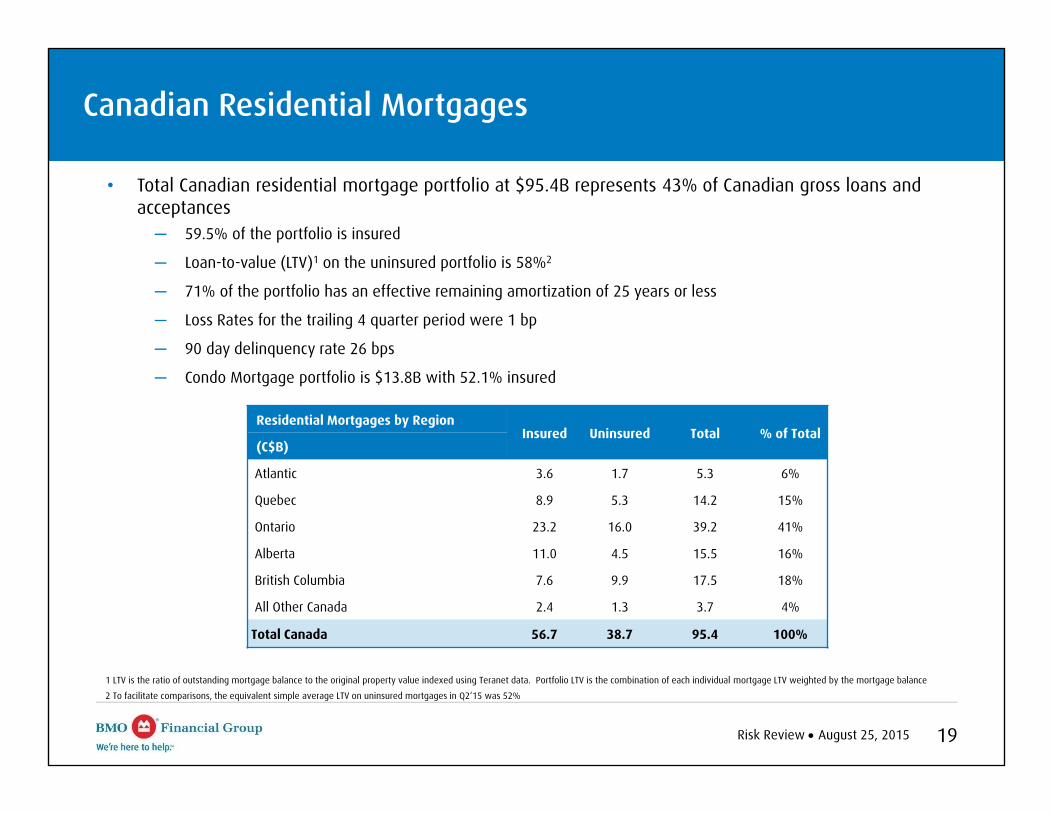
Canadian Residential Mortgages
• Total Canadian residential mortgage portfolio at $95.4B represents 43% of Canadian gross loans and acceptances─ 59.5% of the portfolio is insured
─ Loan-to-value (LTV)1 on the uninsured portfolio is 58%2
─ 71% of the portfolio has an effective remaining amortization of 25 years or less
─ Loss Rates for the trailing 4 quarter period were 1 bp
─ 90 day delinquency rate 26 bps
─ Condo Mortgage portfolio is $13.8B with 52.1% insured
1 LTV is the ratio of outstanding mortgage balance to the original property value indexed using Teranet data. Portfolio LTV is the combination of each individual mortgage LTV weighted by the mortgage balance
2 To facilitate comparisons, the equivalent simple average LTV on uninsured mortgages in Q2‘15 was 52%
Residential Mortgages by Region Insured Uninsured Total % of Total
(C$B)
Atlantic 3.6 1.7 5.3 6%
Quebec 8.9 5.3 14.2 15%
Ontario 23.2 16.0 39.2 41%
Alberta 11.0 4.5 15.5 16%
British Columbia 7.6 9.9 17.5 18%
All Other Canada 2.4 1.3 3.7 4%
Total Canada 56.7 38.7 95.4 100%
Risk Review August 25, 2015 20
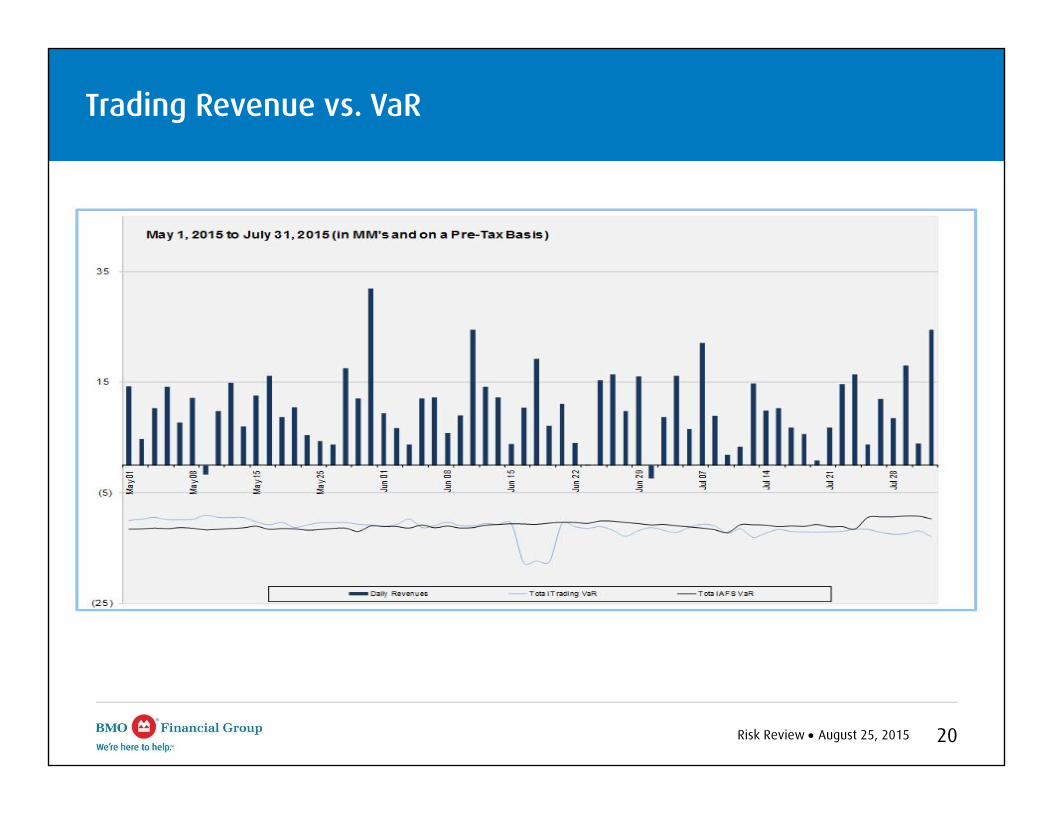
Trading Revenue vs. VaR
Financial Results August 25, 2015 21
APPENDIX
Financial Results August 25, 2015 22
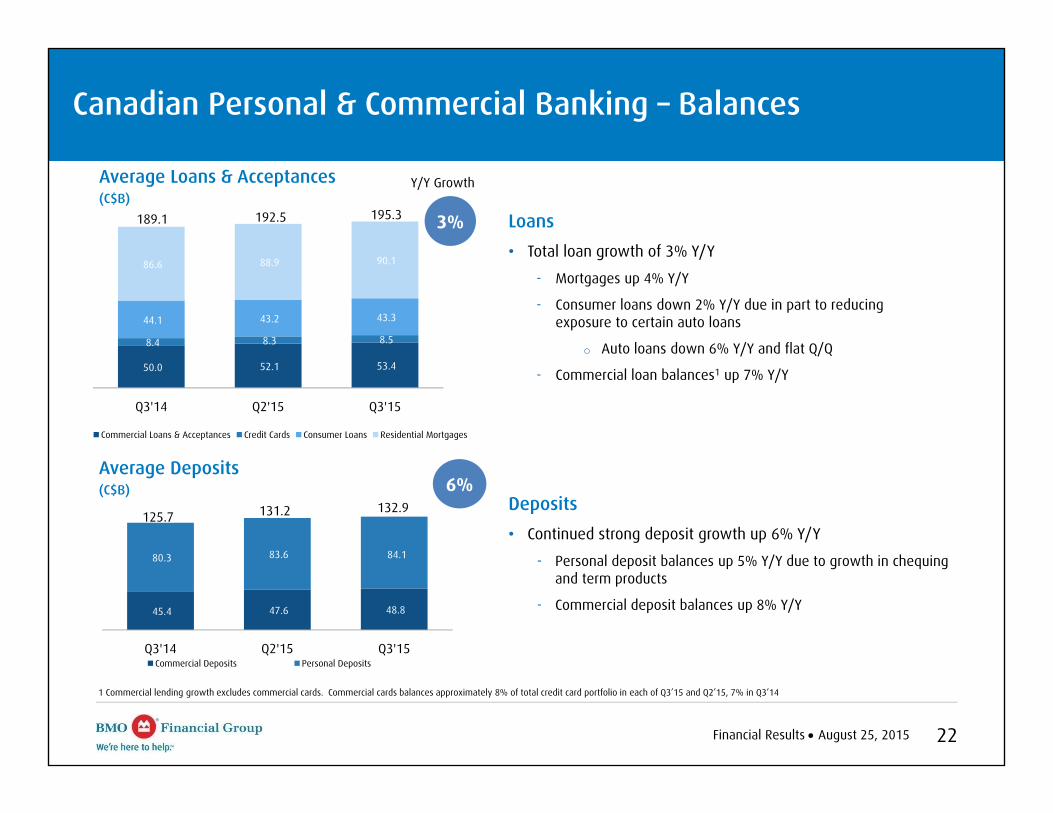
45.4 47.6 48.8
80.3 83.6 84.1
Q3'14 Q2'15 Q3'15Commercial Deposits Personal Deposits
6%
Canadian Personal & Commercial Banking – Balances
1 Commercial lending growth excludes commercial cards. Commercial cards balances approximately 8% of total credit card portfolio in each of Q3’15 and Q2’15, 7% in Q3’14
Average Loans & Acceptances(C$B)
Loans• Total loan growth of 3% Y/Y
- Mortgages up 4% Y/Y
- Consumer loans down 2% Y/Y due in part to reducing exposure to certain auto loans
o Auto loans down 6% Y/Y and flat Q/Q
- Commercial loan balances1 up 7% Y/Y50.0 52.1 53.4
8.4 8.3 8.5
44.1 43.2 43.3
86.6 88.9 90.1
Q3'14 Q2'15 Q3'15
Commercial Loans & Acceptances Credit Cards Consumer Loans Residential Mortgages
189.1 192.5 195.3
Deposits• Continued strong deposit growth up 6% Y/Y
- Personal deposit balances up 5% Y/Y due to growth in chequing and term products
- Commercial deposit balances up 8% Y/Y
Average Deposits(C$B)
131.2
3%
Y/Y Growth
132.9125.7
Financial Results August 25, 2015 23
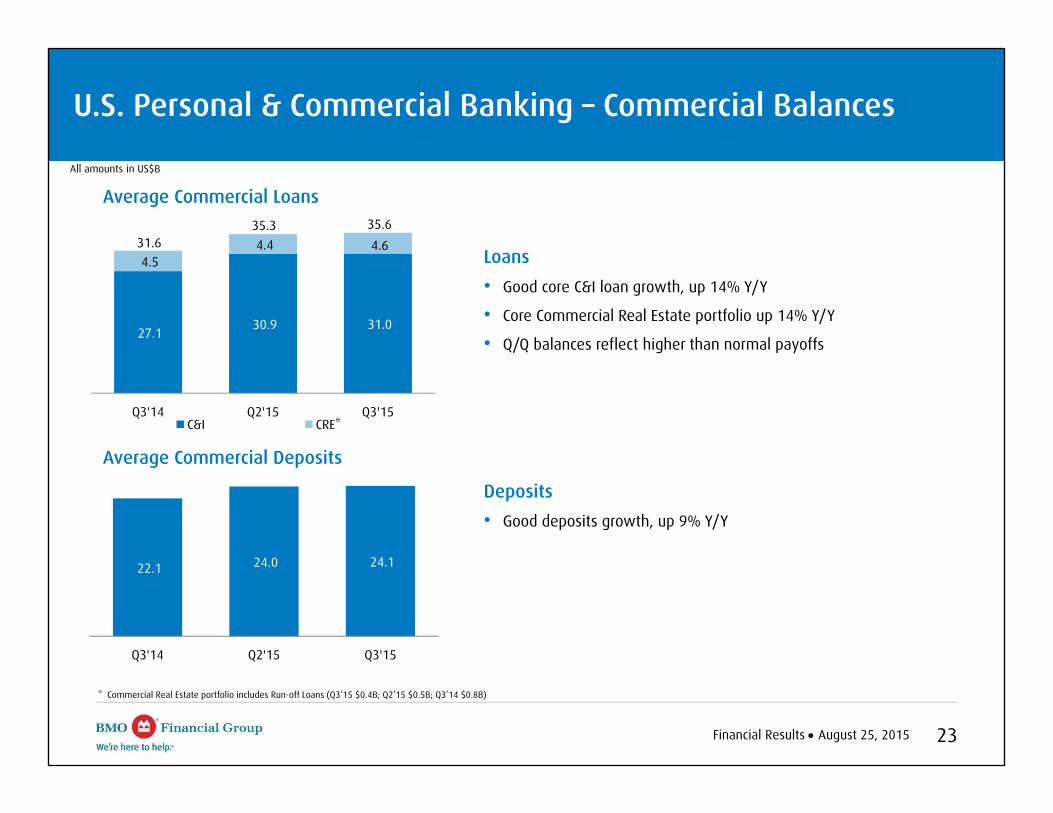
27.1 30.9 31.0
4.5 4.4 4.6
Q3'14 Q2'15 Q3'15C&I CRE*
U.S. Personal & Commercial Banking – Commercial Balances
All amounts in US$B
Average Commercial Loans
22.1 24.0 24.1
Q3'14 Q2'15 Q3'15
Average Commercial Deposits
31.635.3
Loans• Good core C&I loan growth, up 14% Y/Y
• Core Commercial Real Estate portfolio up 14% Y/Y
• Q/Q balances reflect higher than normal payoffs
Deposits• Good deposits growth, up 9% Y/Y
35.6
* Commercial Real Estate portfolio includes Run-off Loans (Q3’15 $0.4B; Q2’15 $0.5B; Q3’14 $0.8B)
Financial Results August 25, 2015 24
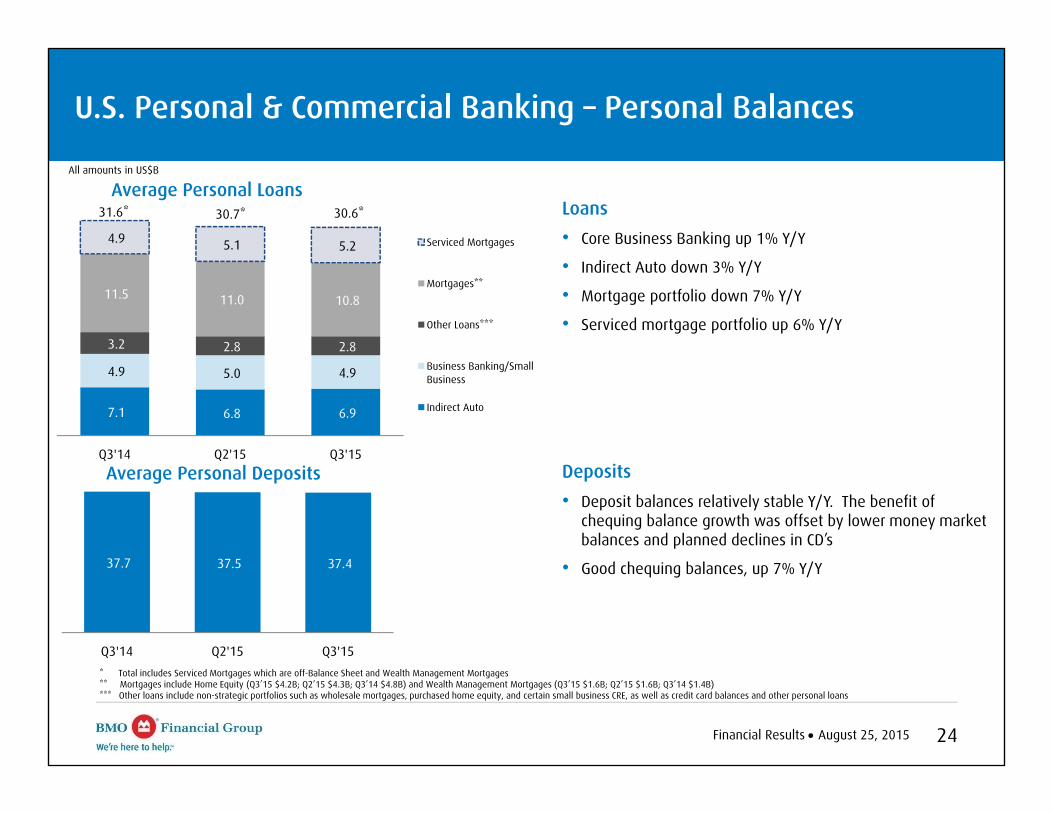
37.7 37.5 37.4
Q3'14 Q2'15 Q3'15
7.1 6.8 6.9
4.9 5.0 4.9
3.2 2.8 2.8
11.5 11.0 10.8
4.9 5.1 5.2
Q3'14 Q2'15 Q3'15
Serviced Mortgages
Mortgages**
Other Loans***
Business Banking/SmallBusiness
Indirect Auto
U.S. Personal & Commercial Banking – Personal Balances
All amounts in US$B
Average Personal Loans
Average Personal Deposits
* Total includes Serviced Mortgages which are off-Balance Sheet and Wealth Management Mortgages** Mortgages include Home Equity (Q3’15 $4.2B; Q2’15 $4.3B; Q3’14 $4.8B) and Wealth Management Mortgages (Q3’15 $1.6B; Q2’15 $1.6B; Q3’14 $1.4B)*** Other loans include non-strategic portfolios such as wholesale mortgages, purchased home equity, and certain small business CRE, as well as credit card balances and other personal loans
31.6* 30.7* 30.6* Loans• Core Business Banking up 1% Y/Y
• Indirect Auto down 3% Y/Y
• Mortgage portfolio down 7% Y/Y
• Serviced mortgage portfolio up 6% Y/Y
Deposits• Deposit balances relatively stable Y/Y. The benefit of
chequing balance growth was offset by lower money market balances and planned declines in CD’s
• Good chequing balances, up 7% Y/Y
Financial Results August 25, 2015 25
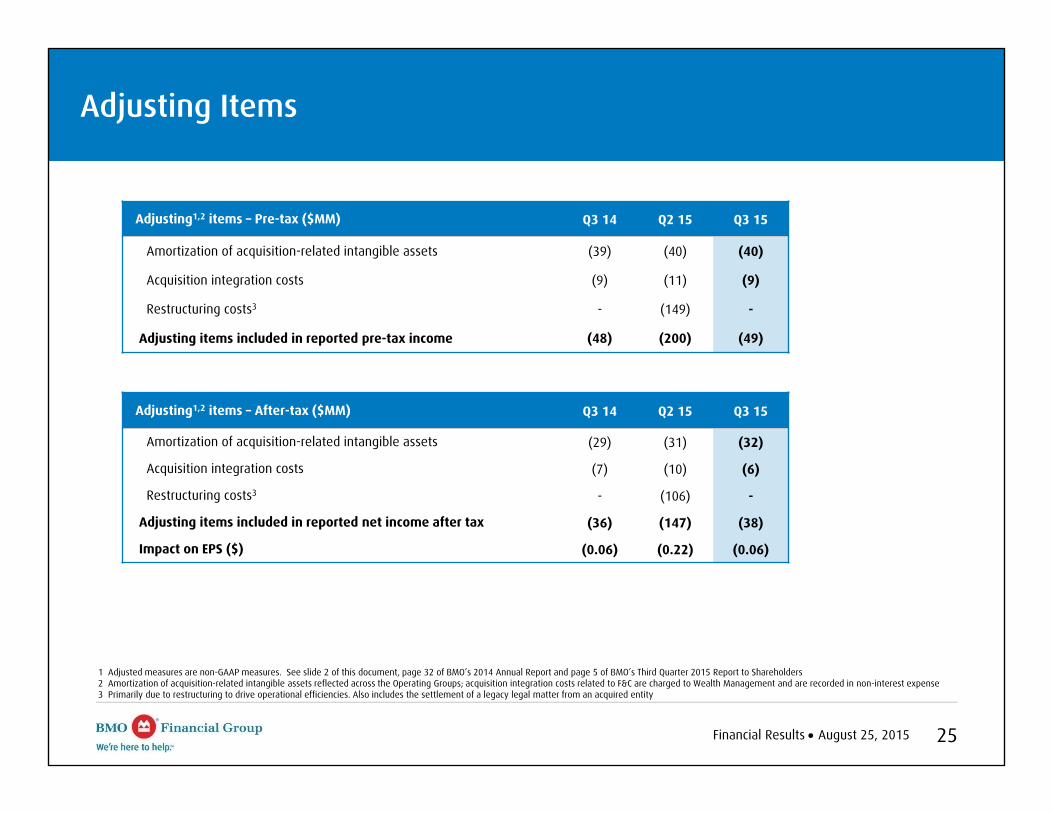
1 Adjusted measures are non-GAAP measures. See slide 2 of this document, page 32 of BMO’s 2014 Annual Report and page 5 of BMO’s Third Quarter 2015 Report to Shareholders2 Amortization of acquisition-related intangible assets reflected across the Operating Groups; acquisition integration costs related to F&C are charged to Wealth Management and are recorded in non-interest expense3 Primarily due to restructuring to drive operational efficiencies. Also includes the settlement of a legacy legal matter from an acquired entity
Adjusting Items
Adjusting1,2 items – Pre-tax ($MM) Q3 14 Q2 15 Q3 15
Amortization of acquisition-related intangible assets (39) (40) (40)
Acquisition integration costs (9) (11) (9)
Restructuring costs3 - (149) -
Adjusting items included in reported pre-tax income (48) (200) (49)
Adjusting1,2 items – After-tax ($MM) Q3 14 Q2 15 Q3 15
Amortization of acquisition-related intangible assets (29) (31) (32)
Acquisition integration costs (7) (10) (6)
Restructuring costs3 - (106) -
Adjusting items included in reported net income after tax (36) (147) (38)
Impact on EPS ($) (0.06) (0.22) (0.06)

Financial Results May 27, 2015 26
Investor Relations Contact Information
E-mail: [email protected]
www.bmo.com/investorrelations
Fax: 416.867.3367
LISA HOFSTATTERManaging Director, Investor [email protected]
CHRISTINE VIAUDirector, Investor [email protected]