Embed Size (px)
Citation preview
Centrica Energy Trading A/S
Skelagervej 19000 Aalborg
CVR-No.20293195
Annual Report 2019
The Annual Report has been adopted and approved on the Annual General Meeting on 15 May, 2020.
Chairman of the General MeetingOle Ibsen
ANNUAL REPORT
2019
Management’s Review
Preface And at A GlanceExecutive review 5Financial Highlights 8
Corporate ReviewCentrica Group Corporate Responsibility 12Reporting on Corporate Responsibility 13Corporate governance 14Our diversity 14Financial review 15Statement by the Management on the annual report 17Independent auditor’s report 19
Financial Statements
Accounting policies 22Income statement 26Balance sheet 27Statement of changes in equity 29Cash flow statement 30Notes 31Notes regarding Financial Instruments 43
Contents

5-10
PREFACEAND AT
A GLANCE
Centrica Energy Trading 5
Centrica Energy Trading delivered a good annual result in 2019, generating profit for the year of 214 mDKK. This is an increase of 43% compared to 2018 and the strongest financial result to date.
We delivered a strong performance in both our trading and our customer-centric busi-nesses. A satisfying result given the significant internal changes carried out and relatively stable market conditions.
A year of consolidation
During 2019 our integration within Centrica Energy Marketing & Trading (EM&T) contin-ued, and in February 2019 we changed our company name from Neas Energy A/S to Centrica Energy Trading A/S. The most significant integration activities included:
–– consolidating all EM&T’s short-term power and gas trading activities in Centrica Energy Trading in Aalborg and Singapore
–– centralising EM&T’s customer-centric business in Centrica Energy Trading –– continued integration of system architecture including ETRM systems
A continued focus on cost efficiency meant that OPEX was stable compared to 2018. Staff costs rose only slightly as did the average number of employees as Centrica’s wholesale short-term power and gas trading activities was consolidated in Aalborg and Singapore.
Strong power and gas trading in a challenging market
Relative to 2018, our power and gas trading business experienced less favourable market conditions, in particular mild weather conditions, reduced price volatility and increased market coupling across Europe. Good performance in this environment can be attributed to strong trading and effective use of analytics and automated trading.
We saw significant benefits from algorithmic trading, which we are developing further.
Executive Review
Preface And at A Glance
Centrica Energy Trading 6Preface And at A Glance
At the heart of Europe’s green transition
Our customer-centric business continued to grow the portfolio of power purchase agree-ments (PPAs) with owners of renewable energy projects and corporate off-takers. We grew our renewables PPA portfolio to more than 10GW while also finding significant traction in the corporate PPA market.
At the end of 2019 we separated our power asset management activities from our proprietary trading activities. This ensures we will continue to meet regulatory compliance obligations and focus deployment of increasingly automated trading strategies.
In 2020 we will continue to play a central part in Europe’s green transition and be at the forefront of bankable PPA offerings. We experience an increased level of investments in the southern part of Europe which fit our expansion plans.
The 2019 financial result exceeded our expectations.
The directors expect the general level of activities and scope of business in 2020 to be similar to 2019.
We have acted promptly to implement precautions to safeguard our employees and secure business continuity during the Covid-19 break-out. As a result, we haven’t yet experienced and do not expect material impact to our 2020 financial results due to Covid-19 break-out.
Centrica Energy Trading 7Preface And at A Glance
Our Business Model
Centrica Energy Trading has built a successful business on trading power and gas across the European borders based on an extensive legacy expertise from the Nordic and UK energy markets. We connect producers, suppliers and off takers in the wholesale energy markets, providing best in class route-to-market services through integrating sophisticated software, structuring and optimising exposures from long term risk management down to physical trading seconds before delivery.
Risk Management
As part of our business model Centrica Energy Trading is exposed to a variety of different risks.
We work with the following main risk categories: market risk, liquidity risk, credit risk, oper-ational risk and compliance risk.
Risks are actively managed by our risk teams in accordance with Centrica EM&T’ policies which is designed to enable us to identify, evaluate and mitigate our risks appropriately.On an annual basis we evaluate our System of Risk Management and Internal Control learning from any control incidents that have arisen to ensure we are mitigating risks in line with our risk appetite. We are evolving our System of Risk Management and Internal Con-trol to ensure it remains appropriate in support of our strategy.
Annual Report 2019 8Preface and at a glance
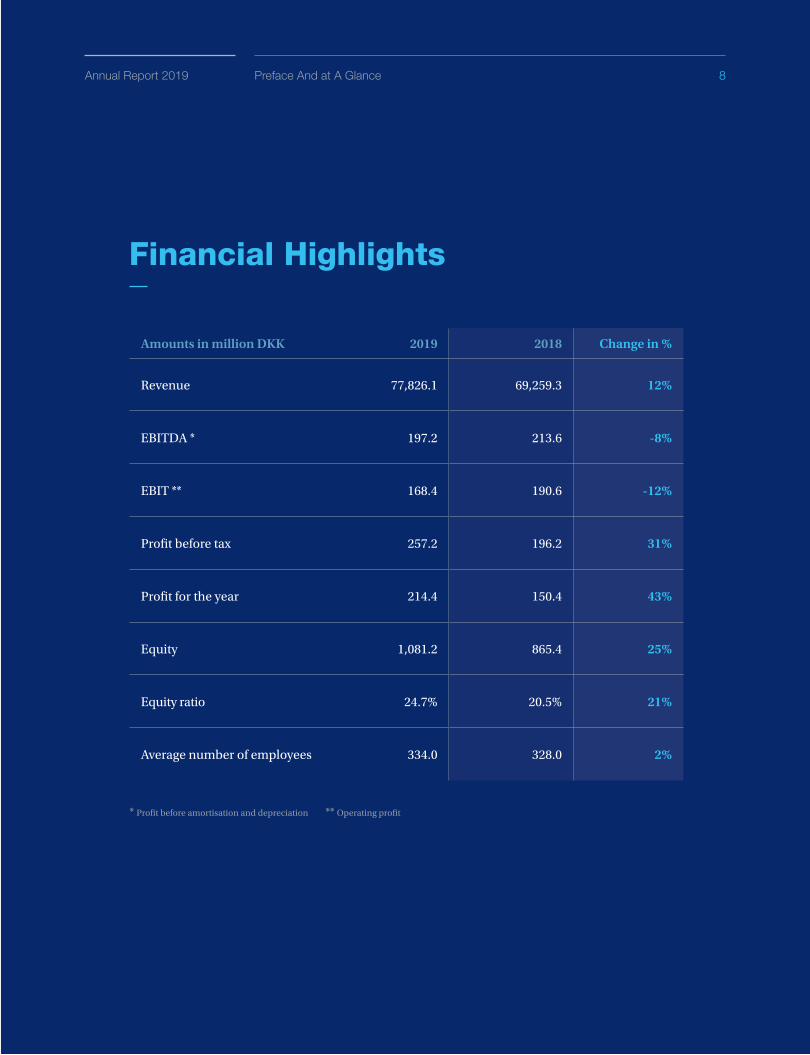
Amounts in million DKK 2019 2018 Change in %
Revenue 77,826.1 69,259.3 12%
EBITDA * 197.2 213.6 -8%
EBIT ** 168.4 190.6 -12%
Profit before tax 257.2 196.2 31%
Profit for the year 214.4 150.4 43%
Equity 1,081.2 865.4 25%
Equity ratio 24.7% 20.5% 21%
Average number of employees 334.0 328.0 2%
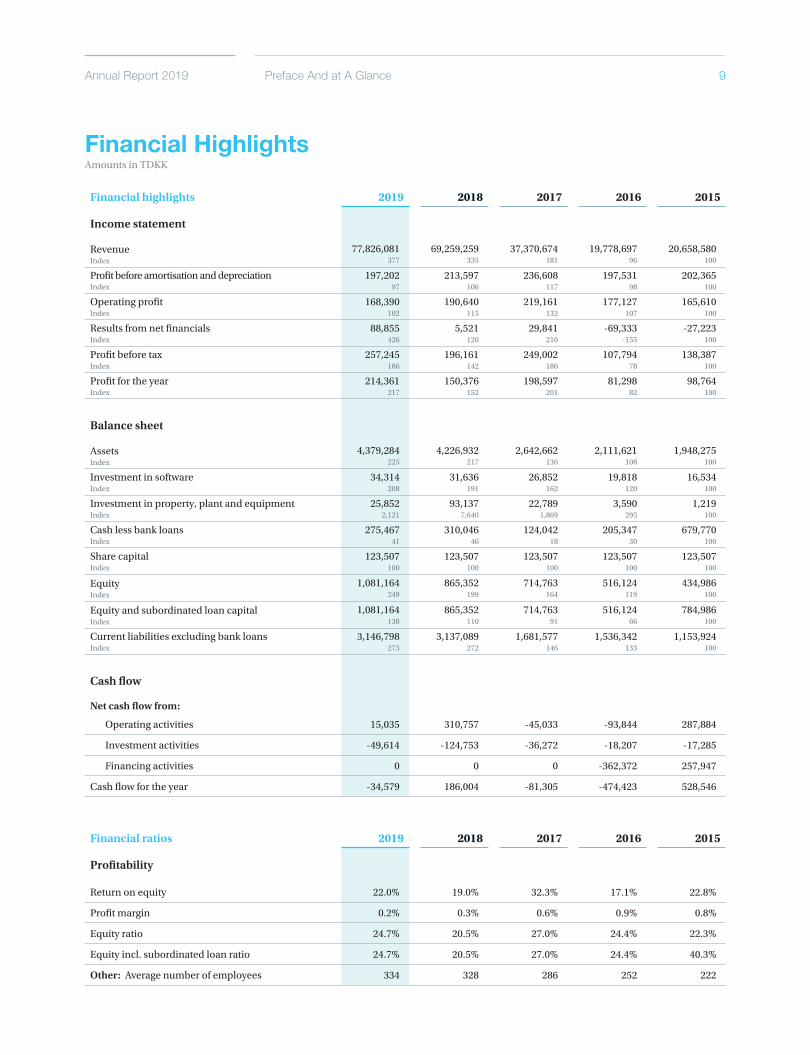
Financial Highlights
* Profit before amortisation and depreciation ** Operating profit
8Preface And at A GlanceAnnual Report 2019
Annual Report 2019 9
Financial highlights 2019 2018 2017 2016 2015
Income statement
RevenueIndex
77,826,081 377
69,259,259 335
37,370,674 181
19,778,697 96
20,658,580 100
Profit before amortisation and depreciationIndex
197,20297
213,597 106
236,608 117
197,531 98
202,365 100
Operating profitIndex
168,390 102
190,640 115
219,161 132
177,127 107
165,610 100
Results from net financialsIndex
88,855 426
5,521 120
29,841 210
-69,333 -155
-27,223 100
Profit before taxIndex
257,245186
196,161 142
249,002 180
107,794 78
138,387 100
Profit for the yearIndex
214,361217
150,376 152
198,597 201
81,298 82
98,764 100
Balance sheet
AssetsIndex
4,379,284225
4,226,932 217
2,642,662 136
2,111,621 108
1,948,275 100
Investment in software Index
34,314208
31,636 191
26,852 162
19,818 120
16,534 100
Investment in property, plant and equipmentIndex
25,8522,121
93,137 7,640
22,789 1,869
3,590 295
1,219 100
Cash less bank loansIndex
275,467 41
310,046 46
124,042 18
205,347 30
679,770 100
Share capitalIndex
123,507100
123,507 100
123,507 100
123,507 100
123,507 100
EquityIndex
1,081,164249
865,352 199
714,763 164
516,124 119
434,986 100
Equity and subordinated loan capitalIndex
1,081,164138
865,352 110
714,763 91
516,124 66
784,986 100
Current liabilities excluding bank loansIndex
3,146,798273
3,137,089 272
1,681,577 146
1,536,342 133
1,153,924 100
Cash flow
Net cash flow from:
Operating activities 15,035 310,757 -45,033 -93,844 287,884
Investment activities -49,614 -124,753 -36,272 -18,207 -17,285
Financing activities 0 0 0 -362,372 257,947
Cash flow for the year -34,579 186,004 -81,305 -474,423 528,546
Financial ratios 2019 2018 2017 2016 2015
Profitability
Return on equity 22.0% 19.0% 32.3% 17.1% 22.8%
Profit margin 0.2% 0.3% 0.6% 0.9% 0.8%
Equity ratio 24.7% 20.5% 27.0% 24.4% 22.3%
Equity incl. subordinated loan ratio 24.7% 20.5% 27.0% 24.4% 40.3%
Other: Average number of employees 334 328 286 252 222
Financial HighlightsAmounts in TDKK
Preface And at A Glance
10Preface And at A GlanceAnnual Report 2019
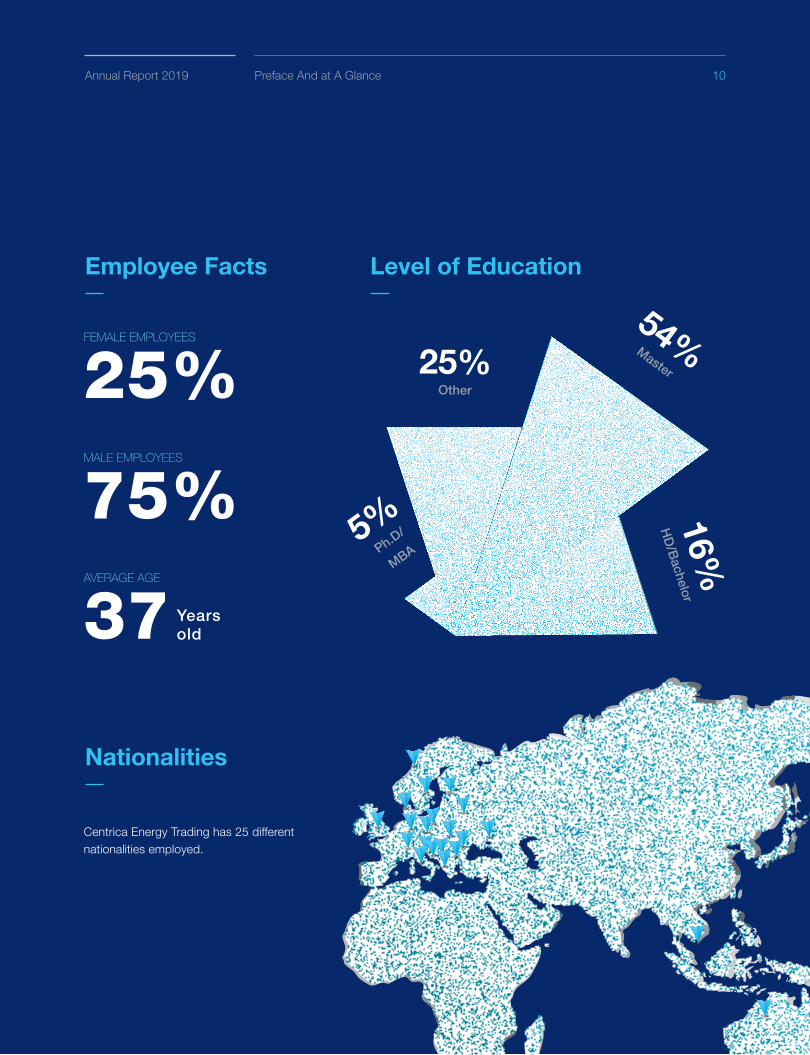
Level of EducationEmployee Facts
Nationalities
FEMALE EMPLOYEES
25%MALE EMPLOYEES
75%AVERAGE AGE
37
54%Master25%Other
5%Ph.D/
MBA
16%HD/Bachelor
Yearsold
Centrica Energy Trading has 25 different nationalities employed.

12-20
CORPORATEREVIEW
Annual Report 2019 12
Satisfying the changing needs of our customersAnnual Report and Accounts 2018
Corporate Review
As a company in the Centrica Group, Centrica Energy Trading’s reporting on corporate policies and annual review of progress are covered by Centrica Plc. Centrica reviews a number of corporate functions and Corporate Citizenship in the group’s annual report and a number of reports/updates on “Responsible Business” measures.
The 2019 annual report is available here:
www.centrica.com/investors/annual-report-2019
Centrica Group Corporate Responsibility
Centrica Energy Trading 13Corporate Review
Information and data on Centrica’s performance within Corporate Responsibility is available on the group website here:
www.centrica.com/investors/annual-report-2019
The latest version of the Communication on Progress for the UNGC along reports on the CR Basis of Reporting, Performance Review and a number of other CR related reports/updates can be found here:
www.centrica.com/investors/annual-report-2019
The 2019 update on Centrica’s general Corporate Responsibility and principle is available here:
www.centrica.com/investors/annual-report-2019
Reporting on Corporate Responsibility
Centrica Energy Trading 14Corporate Review
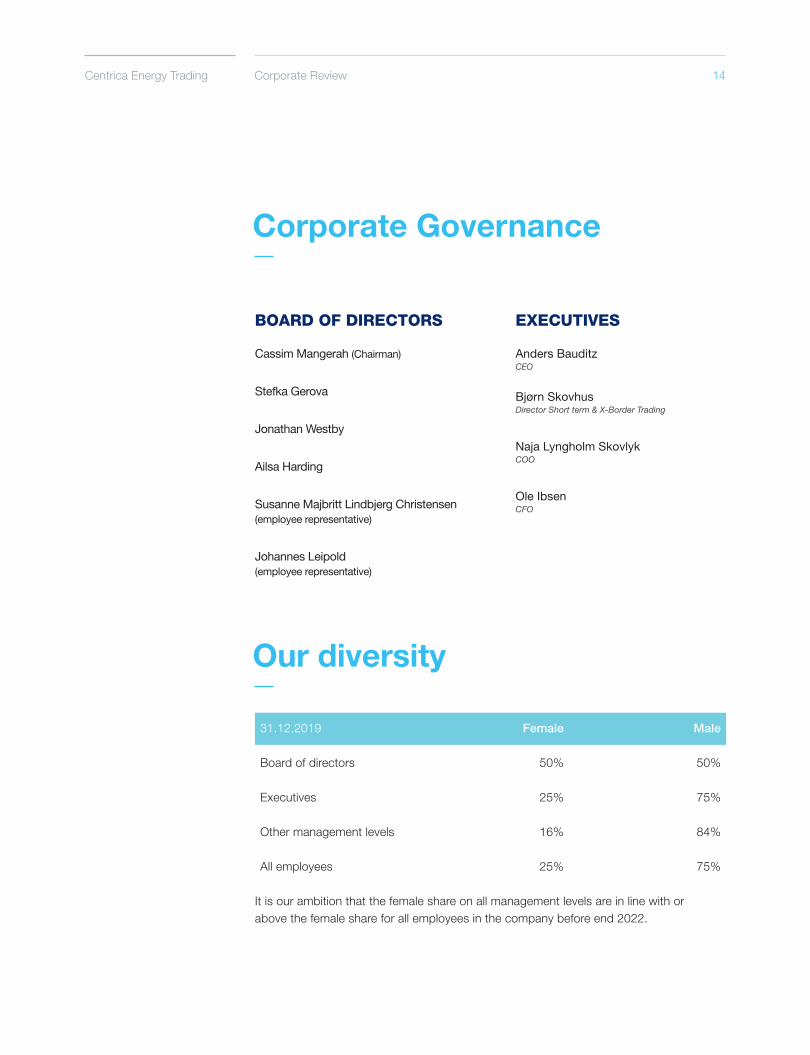
Corporate Governance
Our diversity
BOARD OF DIRECTORS
Cassim Mangerah (Chairman)
Stefka Gerova
Jonathan Westby
Ailsa Harding
Susanne Majbritt Lindbjerg Christensen (employee representative)
Johannes Leipold (employee representative)
EXECUTIVES
Anders Bauditz CEO
Bjørn Skovhus Director Short term & X-Border Trading
Naja Lyngholm Skovlyk COO
Ole IbsenCFO
31.12.2019 Female Male
Board of directors 50% 50%
Executives 25% 75%
Other management levels 16% 84%
All employees 25% 75%
It is our ambition that the female share on all management levels are in line with or above the female share for all employees in the company before end 2022.
Annual Report 2019 15
Financial Review
INCOME STATEMENT2019 revenue amounted to 77,826.1 mDKK. Gross profit was 506.1 mDKK equivalent to a gross profit margin of 0.65%.
Gross profit is equal to contribution margins from the buying, selling and trading of energy, portfolio management and administrative and technical services for electricity producers, gas companies and energy off-takers.
Revenue was up 12.4% compared to 2018. As expected, both power and gas traded volumes grew significantly, but the impact on revenue was comparatively counterbalanced by lower prices per MWh, most noteworthy in the gas market.
Gross profit of the Parent Company reduced compared to 2018. 2018 was an unusual year with extraordinary weather conditions, specifically when the cold spell hit Europe during Q1. This caused increased market volatility and beneficial trading opportunities. 2019 had less market volatility and as such unfavourable market conditions.
There was a small increase in staff cost partly associated to a slight rose in average number of employees due to consolidation of Centrica’s short-term wholesale trading activities in Centrica Energy Trading in Aalborg and Singapore.
Compared to 2018, there was a substantial larger share of Gross Profit in the subsidiaries in UK, Germany and Singapore.
Operating profit was 168.4 mDKK compared to 190.6 mDKK in 2018. Profit margin was realised at 0.22 %.
Other financial income and expenses delivered a net income of 21.1 mDKK. Financial income was equal to interest earnings from deposits at Centrica group, whilst financial expenses primarily consisted of warranty provisions and interest payable.
Income from investments in group enterprises and associates amounted to 67.5 mDKK in 2019 compared to -9.9 mDKK in 2018. In Germany, we successfully dedicated our customer-centric activities and competencies towards Renewable PPAs to build further on our strong portfolio and as a consequence closed a sales office focused on less profitable activities.
Corporate Review
Centrica Energy Trading 16
The Singapore office has gradually taken a larger share of the Parent Company’s trading activities to effectively cover and extent 24/7 trading activities across Europe.
Profit before tax was 257.2 mDKK and tax on profit for the year was 42.9 mDKK.
Profit for the year amounted to 214.4 mDKK, which was up 42.6% compared to 2018 profit for the year of 150.4 mDKK. BALANCE SHEETTotal assets as of 31 December 2019 was 4,379.3 mDKK of which 3,969.3 were current assets. Working capital consisted especially of receivables from the buying and selling of energy, plus the value of open positions and holdings on the balance sheet date. Cash amounted to 275.5 mDKK compared to 310.0 mDKK in 2018.
Equity comprised 1,081.2 mDKK and was up with 215.8 mDKK or 24.9% compared to 2018. The increase was mainly driven by the result of the year. Equity ratio increased from 20.5% last year to 24.7% this year.
CASH FLOW STATEMENTNet cash flow for the year amounted to -34,6 mDKK in 2019 compared to 186,0 mDKK in 2018.
Changes in net working capital amounted to -161.3 mDKK in 2019 and corporation tax paid during 2019 amounted to -42.2 mDKK. This was compensated by profit before tax which amounted to 257.2 mDKK leading to a net cash flow from operating activities of 15.0 mDKK in 2019.
Net cash flow from investing activities amounted to -49.6 mDKK in 2019 and net cash flow from financing activities was 0 mDKK in 2019.
Corporate Review
Centrica Energy Trading 17Corporate Review
Statement by The Management on The Annual Report
The Board of Directors and the Executive Board have today considered and approved the annual report of Centrica Energy Trading A/S for the financial year 01.01.2019 - 31.12.2019.
The annual report is presented in accordance with the Danish Financial Statements Act.
In our opinion, the financial statements give a true and fair view of the Entity’s financial position at 31.12.2019 and of the results of its operations and cash flows for the financial year 01.01.2019 - 31.12.2019.
We believe that the management commentary contains a fair review of the affairs and conditions referred to therein.
We recommend the annual report for adoption at the Annual General Meeting.
Aalborg, 15.05.2020
Annual Report 2019 18Corporate Review
CEO
Anders Bauditz
The Supervisory Board of Directors
Cassim Mangerah Stefka Gerova Jonathan Westby
Ailsa Harding Susanne Majbritt Lindbjerg Christensen Johannes Leipold
ChairmanThe annual report was presented and approved at the company’s ordinary annual general meeting held on 15 May, 2020.
Ole Ibsen
Annual Report 2019 19Corporate Review
Independent Auditor’s Report
To the shareholders of Centrica Energy Trading A/S
OpinionWe have audited the financial statements of Centrica Energy
Trading A/S for the financial year 01.01.2019 - 31.12.2019,
which comprise the income statement, balance sheet, state-
ment of changes in equity, cash flow statement and notes,
including a summary of significant accounting policies. The fi-
nancial statements are prepared in accordance with the Danish
Financial Statements Act.
In our opinion, the financial statements give a true and fair
view of the Entity’s financial position at 31.12.2019 and of the
results of its operations and cash flows for the financial year
01.01.2019 - 31.12.2019 in accordance with the Danish Finan-
cial Statements Act.
Basis for OpinionWe conducted our audit in accordance with International
Standards on Auditing (ISAs) and addi-tional requirements
applicable in Denmark. Our responsibilities under those stand-
ards and re-quirements are further described in the Auditor’s
responsibilities for the audit of the financial statements section
of this auditor’s report. We are independent of the Entity in
accordance with the International Ethics Standards Board of
Accountants’ Code of Ethics for Professional Accountants
(IESBA Code) and the additional requirements applicable in
Denmark, and we have fulfilled our other ethical responsibilities
in accordance with these requirements. We believe that the
audit evidence we have obtained is sufficient and appropriate
to provide a basis for our opinion.
Management’s Responsibilities for The Financial Statements Management is responsible for the preparation of financial
statements that give a true and fair view in accordance with
the Danish Financial Statements Act, and for such internal
control as Management determines is necessary to enable the
preparation of financial statements that are free from material
misstatement, whether due to fraud or error.
In preparing the financial statements, Management is respon-
sible for assessing the Entity’s ability to continue as a going
concern, for disclosing, as applicable, matters related to going
concern, and for using the going concern basis of accounting
in preparing the financial statements unless Management either
intends to liquidate the Entity or to cease operations, or has no
realistic alternative but to do so.
Auditor’s Responsibilities for The Audit of The
Financial StatementsOur objectives are to obtain reasonable assurance about
whether the financial statements as a whole are free from material
misstatement, whether due to fraud or error, and to issue an au-
di-tor’s report that includes our opinion. Reasonable assurance is
a high level of assurance, but is not a guarantee that an audit con-
ducted in accordance with ISAs and the additional requirements
applicable in Denmark will always detect a material misstatement
when it exists. Misstatements can arise from fraud or error and are
considered material if, individually or in the aggregate, they could
reasonably be expected to influence the economic decisions of
users taken on the basis of these financial statements.
As part of an audit conducted in accordance with ISAs and the
additional requirements applicable in Denmark, we exercise
professional judgement and maintain professional scepticism
through-out the audit. We also:
• Identify and assess the risks of material misstatement of the
financial statements, whether due to fraud or error, design
and perform audit procedures responsive to those risks,
and obtain audit evidence that is sufficient and appropriate
to provide a basis for our opinion. The risk of not detecting
a material misstatement resulting from fraud is higher than
for one resulting from error, as fraud may involve collusion,
forgery, intentional omissions, misrepresentations, or the
override of internal control.
Centrica Energy Trading 20Corporate Review
• Obtain an understanding of internal control relevant to the
audit in order to design audit procedures that are appro-
priate in the circumstances, but not for the purpose of
expressing an opinion on the effectiveness of the Entity’s
internal control.
• Evaluate the appropriateness of accounting policies used
and the reasonableness of accounting estimates and relat-
ed disclosures made by Management.
• Conclude on the appropriateness of Management’s use
of the going concern basis of accounting in preparing the
financial statements, and, based on the audit evidence
obtained, whether a material uncertainty exists related to
events or conditions that may cast significant doubt on
the Entity’s ability to continue as a going concern. If we
conclude that a material uncertainty exists, we are required
to draw attention in our auditor’s report to the related
disclosures in the financial statements or, if such disclosures
are inadequate, to modify our opinion. Our conclusions are
based on the audit evidence obtained up to the date of our
auditor’s report. However, future events or conditions may
cause the Entity to cease to continue as a going concern.
• Evaluate the overall presentation, structure and content of
the financial statements, including the disclosures in the
notes, and whether the financial statements represent the
underlying transactions and events in a manner that gives a
true and fair view.
We communicate with those charged with governance regard-
ing, among other matters, the planned scope and timing of
the audit and significant audit findings, including any significant
deficiencies in internal control that we identify during our audit.
Statement on The Management CommentaryManagement is responsible for the management commentary.
Our opinion on the financial statements does not cover the
management commentary, and we do not express any form of
assurance conclusion thereon.
In connection with our audit of the financial statements, our
responsibility is to read the management commentary and,
in doing so, consider whether the management commentary
is materially inconsistent with the financial statements or our
knowledge obtained in the audit or otherwise appears to be
materially misstated.
Moreover, it is our responsibility to consider whether the man-
agement commentary provides the information required under
the Danish Financial Statements Act.
Based on the work we have performed, we conclude that the
management commentary is in accordance with the financial
statements and has been prepared in accordance with the
requirements of the Danish Financial Statements Act. We did
not identify any material misstatement of the management
commentary.
Aalborg, 15.05.2020
DeloitteStatsautoriseret RevisionspartnerselskabBusiness Registration No 33 96 35 56
Lars Birner Sørensen Peter Mølkjær
State-Authorised State-Authorised
Public Accountant Public Accountant
MNE no mne11671 MNE no mne24821

22-53
FINANCIALSTATEMENTS
Centrica Energy Trading 22Financial Statements
Accounting Policies
GeneralThis Annual Report has been prepared in accordance with the
provisions of the Danish Financial Statements Act applying to
large enterprises of reporting class C. This include the use of
International Financial Reporting Standards for recognition,
measurement and presentation and disclosure of financial
instruments in accordance with IFRS9.
According to the exemption in §112 of the Danish Finacial
Statements Act, no consolidated financial statements have
been prepared. The financial statements of Centrica Energy
Trading A/S and subsidiaries are included in the consolidated
financial statements of CENTRICA Plc. (Millstream, Maidenhead
Road, Windsor, Berkshire, SL4 5GD, No.: 3033654).
The accounting policies applied remain unchanged from the
previous years.
Foreign currency The Annual Report is presented in Danish kroner (DKK).
Transactions in foreign currencies are translated at the ex-
change rates at the dates of transaction. Gains and losses
arising due to differences between rates at the transaction date
and the rates at the dates of payment are recognised in finan-
cial income or financial expenses in the income statement.
Receivables, payables and other monetary items in foreign
currencies that have not been settled at the balance sheet date
are translated at the exchange rates at the balance sheet date.
Any differences between the exchange rates at the balance
sheet date and the transaction date rates are recognised in
financial income or financial expenses in the income statement.
Basis of Recognition and MeasurementIncome is recognised in the income statement as earned, includ-
ing value adjustments of financial assets and liabilities.
All expenses including depreciation, amortization and impairment
losses, are also recognised in the income statement.
Assets are recognised in the balance sheet when future financial
benefits are likely to accrue to the company and the value of such
assets can be reliably measured. Liabilities are recognised in the
balance sheet when they are probable and can be measured
reliably. Upon initial recognition, assets and liabilities are meas-
ured at cost. Subsequently, assets and liabilities are measured as
described below for each item.
Predictable losses and risks arising before the date of presenta-
tion of the financial statements and the facts that confirm or rebut
circumstances and conditions existing at the reporting date are
taken into consideration upon recognition and measurement.
Income StatementRevenues
Physical ProductionIncome from the sale of energy and certificates, also including
trading activities connected to physical energy, is recognised in ac-
cordance with the delivery principle such that income is recognised
as and when delivery takes place.
Income from the sale of services is recognised linearly as and when
the services are delivered also according to the delivery principle.
Profits and loss is included in the income statement as revenue.
Financial instrumentsProfits/losses from financial trading activities are recognised as
ascertained and open positions are adjusted to the fair value on
the reporting date and the adjustment effect is thus recognised
in the income statement as revenue. As an addition reserves
are applied as part of the fair value to adjust for the risk of over
estimation effectively resulting in a lower valuation price for both
bids and offers respectively.
Open positions on financial contracts are adjusted to fair value at
the reporting date and the adjustment effect is thus recognised in
the income statement as revenue.
Derivative financial instrumentsDerivative financial instruments regarding sales and purchases
of energy are recognised at fair value. Positive and negative
adjustments in fair values of derivative financial instruments are
included in receivables or liabilities, respectively. The effect of
value adjustments in fair value of derivative financial instruments
is recognised in the income statement as revenue. As an addition
Annual Report 2019 23Financial Statements
reserves are applied as part of the fair value to adjust for the risk
of over estimation effectively resulting in a lower valuation price
for both bids and offers respectively.
Centrica Energy Trading enters into financial energy contracts on
a regular basis for which no quoted fair value exists. The fair val-
ue of these instruments is determined using accepted valuation
models and current market data.
CostCost is recognised in the income statement upon delivery of
the acquired service or physical item. Provisions are made for
deliveries referring to the reporting period. Cost referring to
future periods is accrued as prepayments.
Other operating incomeOther operating income includes items of a secondary nature in
relation to the company’s activities.
Depreciation and AmortisationAmortisation of intangible assets and depreciation of property,
plant and equipment aim to ensure linear amortisation and de-
preciation over the expected useful life of the asset in question.
The following useful lives and residual values apply:
Useful life Residual value
Land and Buildings 50 years 0%
Software 3-5 years 0%
Contractual rights 7 years 0%
Plant and equipment 5 years 0%
Net FinancialsNet financials comprise of interest income, interest expenses
and foreign currency adjustments.
TaxesThe tax for the year, which consists of the current tax for the year
and the change in deferred tax, is recognised in the income state-
ment with the portion attributable to the net profit or loss for the
year, and directly in equity with the portion attributable to amounts
recognised directly in equity.
The company is included in the joint taxation with Danish affiliated
companies. The current Danish corporation tax is distributed
among the jointly taxed companies in proportion to their taxable
income (Full distribution with reimbursement of tax losses).
Balance SheetIntangible AssetsIntangible assets are measured in the balance sheet at the
lower of cost less accumulated amortisation and the recover-
able amount. The recoverable amount is the value of the asset
in continued use or from sale. Directly and indirectly incurred
costs are included in cost.
IT-development projects are recognised at cost, including costs
of, for example, wages directly or indirectly attributable to the
development projects. Development projects are recognised
in the balance sheet where these aim to develop a particular
product or system that the company intends to produce with
the intention to sell or use in own production. Other develop-
ment costs are recognised in the income statement in the year
they are incurred.
Capitalised development costs are amortised from the time
of completion the product or system linearly over the period
where they are expected to generate economic benefits. How-
ever, the amortisation period cannot exceed five years.
In the balance sheet intangible assets are shown as software
and all assets within this category are own developed assets.
EquipmentProperty, plant and equipment is measured in the balance
sheet at at lower of cost less the accumulated depreciation and
the recoverable amount. The recoverable amount is the value
of the asset in continued use or from sale.
The recoverable amount of the asset is calculated as the higher
of the net selling price and the capital value. The capital value is
calculated as the present value of the expected net cash flows
from application of the asset or asset group and expected net
cash flows from sale of the asset or asset group after the end
of useful life.
Centrica Energy Trading 24Financial Statements
Equity Investments in Group Enterprises Or Associated CompaniesEquity investments in group enterprises and associated com-
panies are recognised and measured according to the ‘Equity
Method’. Accordingly, investments are measured at the pro rata
share of the companies’ equity value with addition or subtraction
of unamortized positive or negative goodwill respectively and
with subtraction or addition of unrealised intercompany profits
and losses.
In the income statement the parent company’s share of the
company’s profits is recognised for the year after elimination of
intercompany profits and losses and with subtraction or addition
of amortization of positive or negative goodwill respectively.
Group enterprises and associated companies with a negative
equity value are measured at nil and any receivables from such
companies are reduced by the parent company’s share of the
negative equity value to the extent that it is regarded irrecov-
erable. If the negative equity value exceeds the receivable the
exceeding amount is recognised as a provision only to the extent
that the parent company has a legal or de facto obligation to
indemnify the liabilities of the company in question.
InventoriesInventories comprise goods for resale. In general inventories
are measured at the lower of cost or net realisable value.
Gas inventories, ROCs Certificates and other inventories are
measured at weighted-average cost.
Other certificates are measured at cost based on the FIFO
principle.
The net realisable value of inventories is calculated at the
amount expected to be generated by sales during normal
operations less selling expenses. The net realisable value is
determined allowing for marketability, obsolescence and devel-
opment in expected sales.
When inventories are effectively hedged, inventories are meas-
ured at the fair value.
ReceivablesReceivables consist primarily of settled and realised gains from
counterparties related to physical trading.
Receivables are measured at the nominal value less estimated
risks of losses according to both group wise and individual
assessments.
Receivables from physical trading is measured at nominal
value.
Other ReceivablesOther receivables consist primarily of unrealised gains from
financial trading activities and deposits.
Unrealised gains from financial trading activities are recognised
at fair value. Deposits are measured at nominal value.
PrepaymentsPrepayments contains prepaid cost for delivery in periods after
status date. The prepayments mainly consist of prepaid cost
for trading capacities and external suppliers cost.
EquityNet revaluation of equity investments in subsidiaries is recog-
nised under equity in reserve for net revaluation according to
the equity method, to the extent the carrying amount exceeds
the acquisition value.
The acquisition and sale of own equity investments and
dividend from these are recognised directly in equity under
retained earnings.
A reserve for development cost is recognised in the equity.
Current and Deferred TaxesCurrent tax payables and receivables are recognised in the
balance sheet as calculated tax on the taxable income, adjust-
ed for tax on taxable incomes for prior years and tax paid on
account.
Joint taxation contributions payable and receivable are recog-
nised in the balance sheet as corporation tax under receivables
or liabilities.
Deferred tax liabilities and deferred tax assets are calculated
on the basis of all temporary differences arising between the
carrying amount of assets and liabilities and their respective
Annual Report 2019 25Financial Statements
tax assets, and are recognised in the balance sheet at the pre-
vailing tax rate. However, deferred tax of temporary differences
regarding non-amortisable goodwill and other items is not
recognised where temporary differences, except for company
acquisitions, have arisen at the time of acquisition without any
impact on the profit or loss or taxable income.
Deferred tax assets are recognised at their assessed expected
realisable value by offsetting against deferred tax liabilities or
against tax on future earnings.
Liabilities Other Than ProvisionsLiabilities other than provisions are measured at cost at the
time when the liability is incurred. Liabilities other than provi-
sions are subsequently measured at amortised cost, with capi-
tal losses and loan costs being distributed over the term of the
liability on the basis of the calculated, effective rate of interest at
the time at which the liability is incurred.
PayablesPayables consist primarily of settled and realised gains from
counterparties related to physical trading.
Payables are measured at nominal value.
Other payables
Other receivables consist primarily of liabilities towards public
institutions and employees.
Other receivables are measured at nominal value.
Deferred IncomeDeferred income contains prepayments received for delivery
after status date related to the handling of energy assets.
Cash Flow StatementThe cash flow statement is prepared according to the indirect
method, showing cash flows from operating, investing and
financing activities, as well as changes in cash flows for the
year and cash equivalents at the beginning and end of the
year. Cash flows from operating activities are calculated as the
net profit or loss for the year, adjusted for non-cash operating
items, corporate income tax paid and changes in working
capital.
Cash flows from investing activities consist of the additions to
and disposals of intangible assets, property, plant and equip-
ment and investments, appropriately adjusted for changes in
the amount of receivables and payables for such items.
Cash flows from financing activities consist of cash flows
provided by, and dividend paid to shareholders, as well as the
securing of and repayment of non-current liabilities other than
provisions.
Cash flows at the beginning and end of the year comprise cash
and short-term bank debt.
Calculation of Financial RatiosFinancial ratios have been calculated in accordance with the
recommendations of the Danish Society of Financial Analysts:
Return on equity
Profit for the year
Average equity
Return on capital employed
Operating profit
Total assets
Profit margin
Operating profit
Revenue
Equity ratio
Equity at year-end
Total assets
Annual Report 2019 26Financial Statements
2019 2018
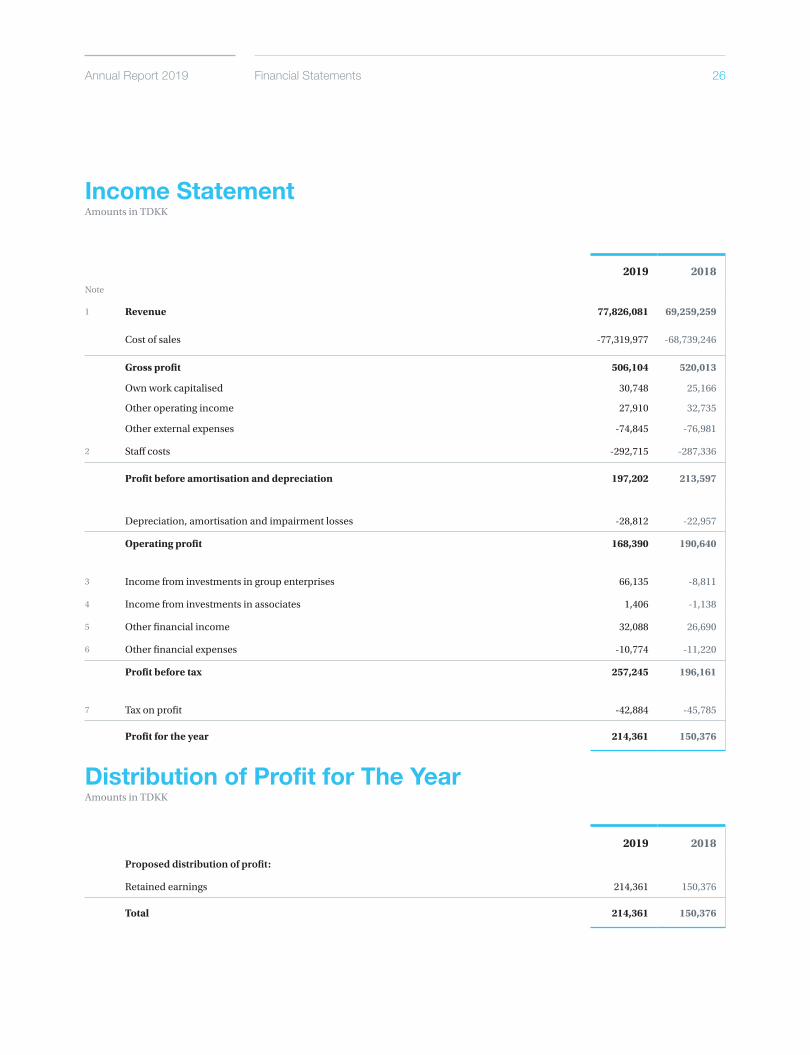
Proposed distribution of profit:
Retained earnings 214,361 150,376
Total 214,361 150,376
Income StatementAmounts in TDKK
Distribution of Profit for The YearAmounts in TDKK
2019 2018Note
1 Revenue 77,826,081 69,259,259
Cost of sales -77,319,977 -68,739,246
Gross profit 506,104 520,013
Own work capitalised
Other operating income
30,748
27,910
25,166
32,735
Other external expenses -74,845 -76,981
2 Staff costs -292,715 -287,336
Profit before amortisation and depreciation 197,202 213,597
Depreciation, amortisation and impairment losses -28,812 -22,957
Operating profit 168,390 190,640
3 Income from investments in group enterprises 66,135 -8,811
4 Income from investments in associates 1,406 -1,138
5 Other financial income 32,088 26,690
6 Other financial expenses -10,774 -11,220
Profit before tax 257,245 196,161
7 Tax on profit -42,884 -45,785
Profit for the year 214,361 150,376
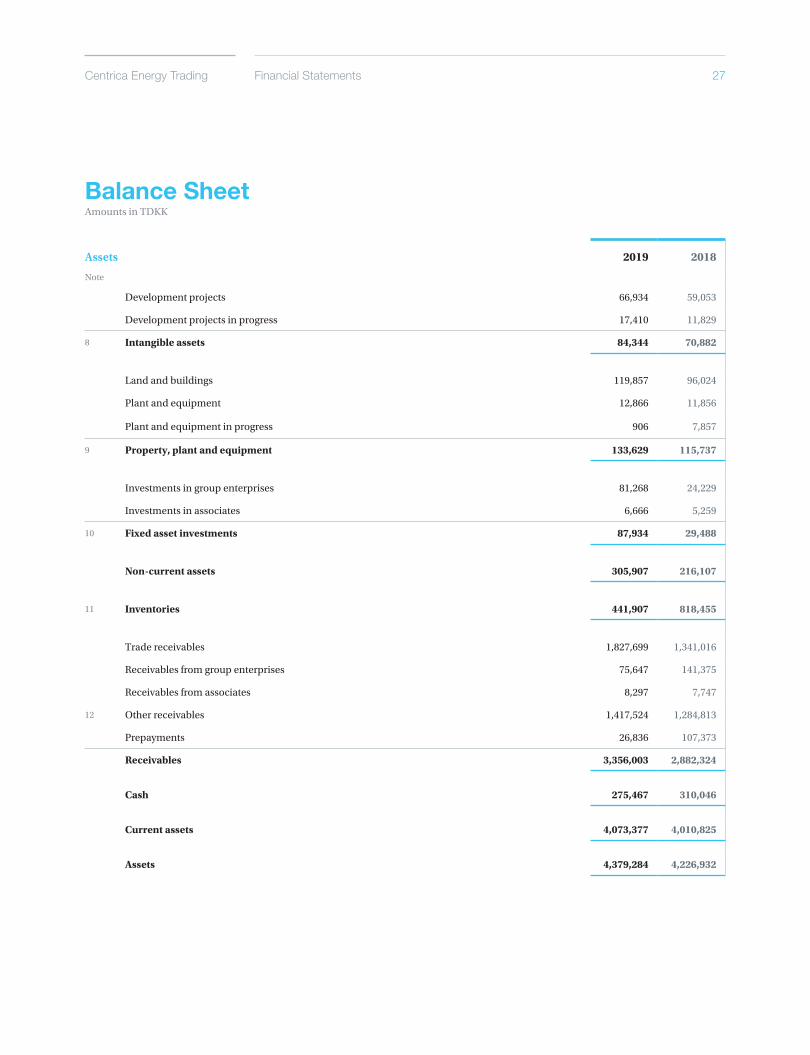
Centrica Energy Trading 27Financial Statements
Assets 2019 2018
Note
Development projects 66,934 59,053
Development projects in progress 17,410 11,829
8 Intangible assets 84,344 70,882
Land and buildings 119,857 96,024
Plant and equipment 12,866 11,856
Plant and equipment in progress 906 7,857
9 Property, plant and equipment 133,629 115,737
Investments in group enterprises 81,268 24,229
Investments in associates 6,666 5,259
10 Fixed asset investments 87,934 29,488
Non-current assets 305,907 216,107
11 Inventories 441,907 818,455
Trade receivables 1,827,699 1,341,016
Receivables from group enterprises 75,647 141,375
Receivables from associates 8,297 7,747
12 Other receivables 1,417,524 1,284,813
Prepayments 26,836 107,373
Receivables 3,356,003 2,882,324
Cash 275,467 310,046
Current assets 4,073,377 4,010,825
Assets 4,379,284 4,226,932
Balance SheetAmounts in TDKK
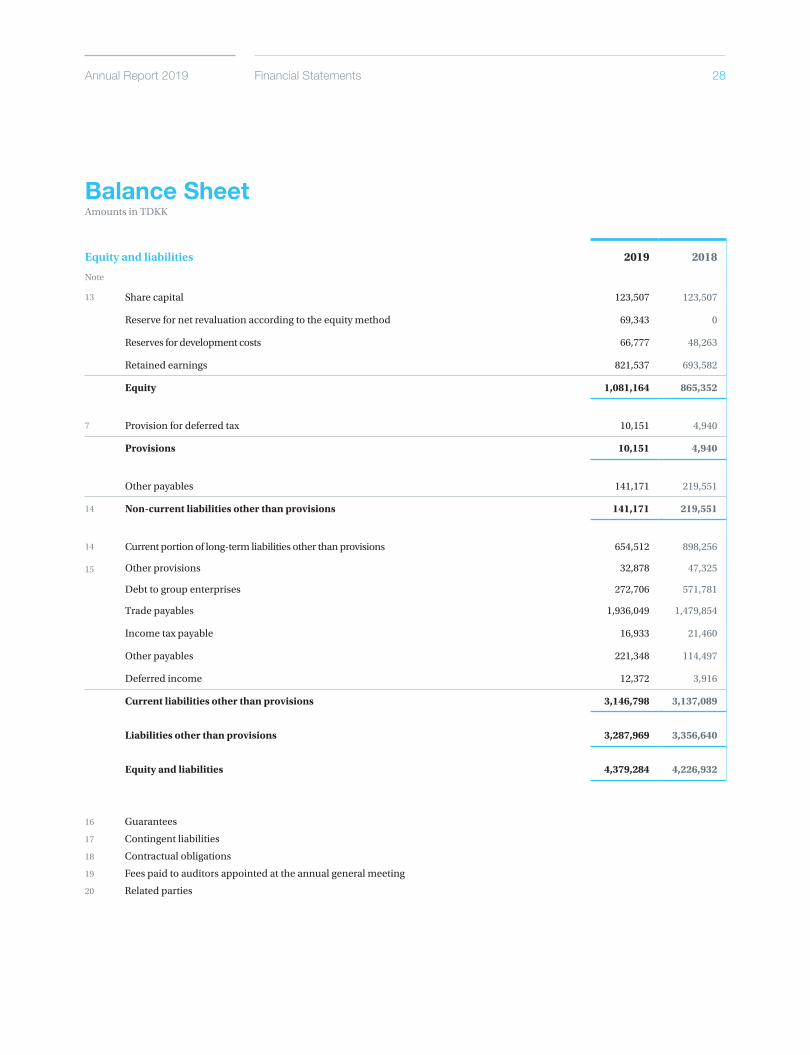
Annual Report 2019 28Financial Statements
Equity and liabilities 2019 2018
Note
13 Share capital 123,507 123,507
Reserve for net revaluation according to the equity method 69,343 0
Reserves for development costs 66,777 48,263
Retained earnings 821,537 693,582
Equity 1,081,164 865,352
7 Provision for deferred tax 10,151 4,940
Provisions 10,151 4,940
Other payables 141,171 219,551
14 Non-current liabilities other than provisions 141,171 219,551
14 Current portion of long-term liabilities other than provisions 654,512 898,256
15
Other provisions
Debt to group enterprises
32,878
272,706
47,325
571,781
Trade payables 1,936,049 1,479,854
Income tax payable 16,933 21,460
Other payables 221,348 114,497
Deferred income 12,372 3,916
Current liabilities other than provisions 3,146,798 3,137,089
Liabilities other than provisions 3,287,969 3,356,640
Equity and liabilities 4,379,284 4,226,932
Balance SheetAmounts in TDKK
16 Guarantees
17 Contingent liabilities
18 Contractual obligations
19 Fees paid to auditors appointed at the annual general meeting
20 Related parties
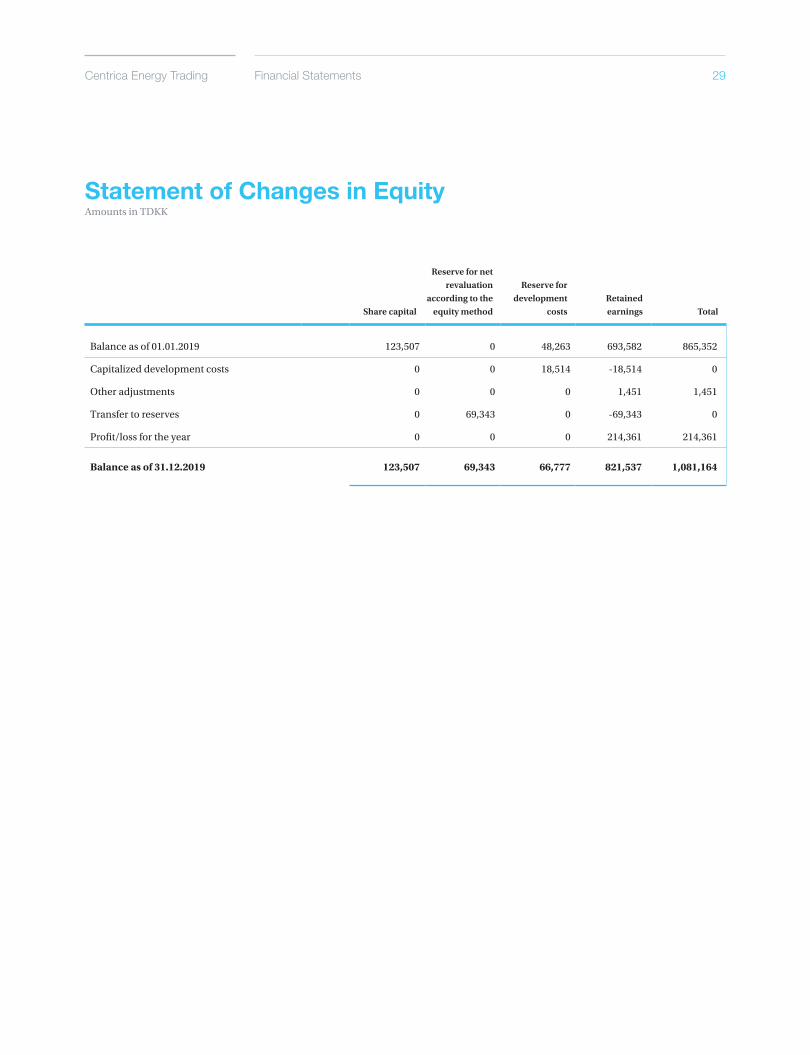
Centrica Energy Trading 29Financial Statements
Statement of Changes in EquityAmounts in TDKK
Balance as of 01.01.2019 123,507 0 48,263 693,582 865,352
Capitalized development costs 0 0 18,514 -18,514 0
Other adjustments 0 0 0 1,451 1,451
Transfer to reserves 0 69,343 0 -69,343 0
Profit/loss for the year 0 0 0 214,361 214,361
Balance as of 31.12.2019 123,507 69,343 66,777 821,537 1,081,164
Share capitalRetainedearnings
Reserve for development
costs
Reserve for net revaluation
according to the equity method Total
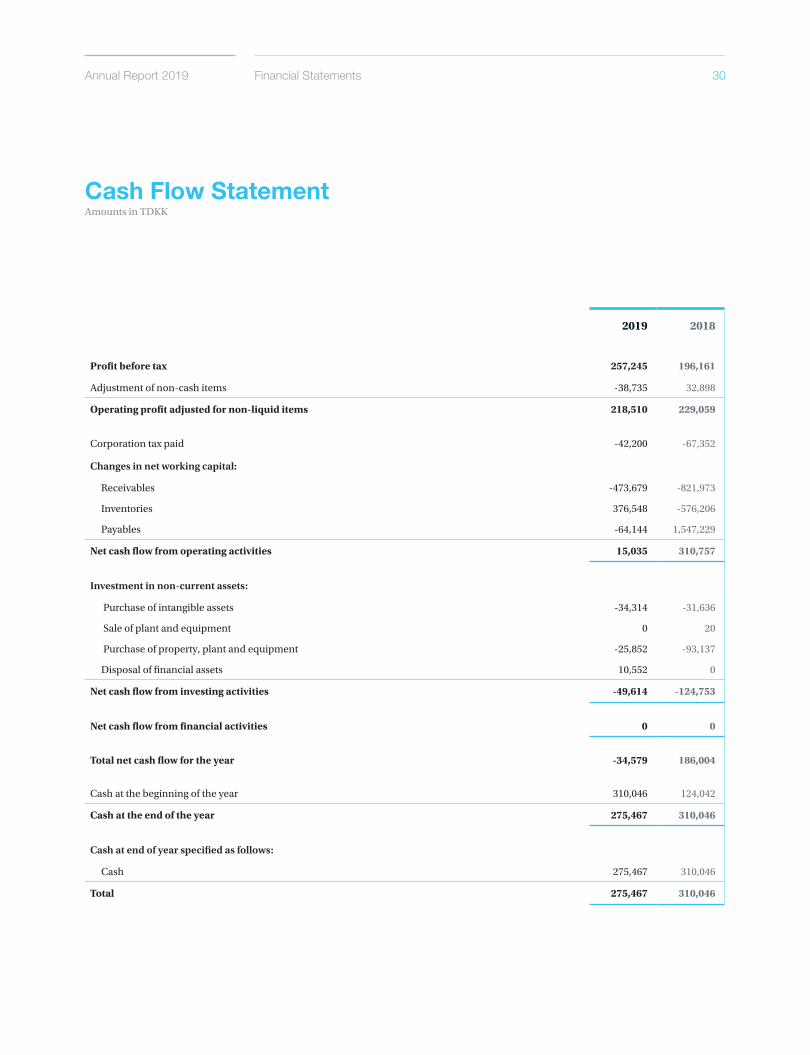
Annual Report 2019 30Financial Statements
Cash Flow StatementAmounts in TDKK
2019 2018
Profit before tax 257,245 196,161
Adjustment of non-cash items -38,735 32,898
Operating profit adjusted for non-liquid items 218,510 229,059
Corporation tax paid -42,200 -67,352
Changes in net working capital:
Receivables -473,679 -821,973
Inventories 376,548 -576,206
Payables -64,144 1,547,229
Net cash flow from operating activities 15,035 310,757
Investment in non-current assets:
Purchase of intangible assets -34,314 -31,636
Sale of plant and equipment 0 20
Purchase of property, plant and equipment -25,852 -93,137
Disposal of financial assets 10,552 0
Net cash flow from investing activities -49,614 -124,753
Net cash flow from financial activities 0 0
Total net cash flow for the year -34,579 186,004
Cash at the beginning of the year 310,046 124,042
Cash at the end of the year 275,467 310,046
Cash at end of year specified as follows:
Cash 275,467 310,046
Total 275,467 310,046
Centrica Energy Trading 31Financial Statements
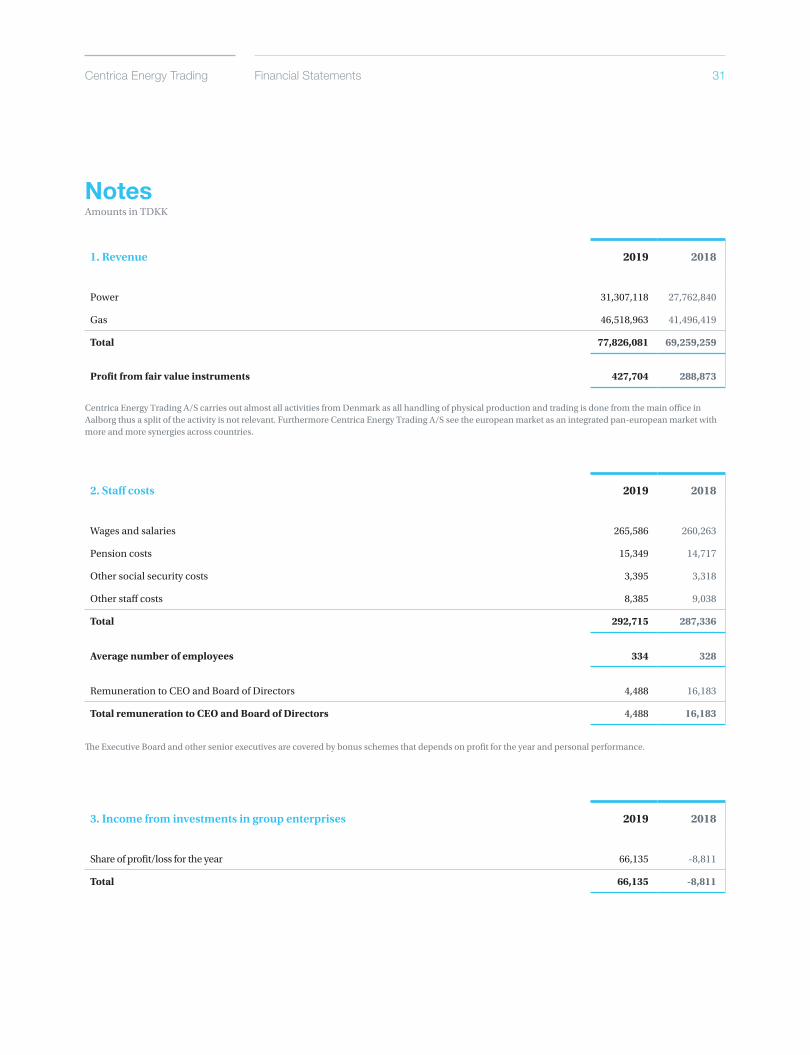
3. Income from investments in group enterprises 2019 2018
Share of profit/loss for the year 66,135 -8,811
Total 66,135 -8,811
NotesAmounts in TDKK
1. Revenue 2019 2018
Power 31,307,118 27,762,840
Gas 46,518,963 41,496,419
Total 77,826,081 69,259,259
Profit from fair value instruments 427,704 288,873
2. Staff costs 2019 2018
Wages and salaries 265,586 260,263
Pension costs 15,349 14,717
Other social security costs 3,395 3,318
Other staff costs 8,385 9,038
Total 292,715 287,336
Average number of employees 334 328
Remuneration to CEO and Board of Directors 4,488 16,183
Total remuneration to CEO and Board of Directors 4,488 16,183
Centrica Energy Trading A/S carries out almost all activities from Denmark as all handling of physical production and trading is done from the main office in Aalborg thus a split of the activity is not relevant. Furthermore Centrica Energy Trading A/S see the european market as an integrated pan-european market with more and more synergies across countries.
The Executive Board and other senior executives are covered by bonus schemes that depends on profit for the year and personal performance.
Annual Report 2019 32
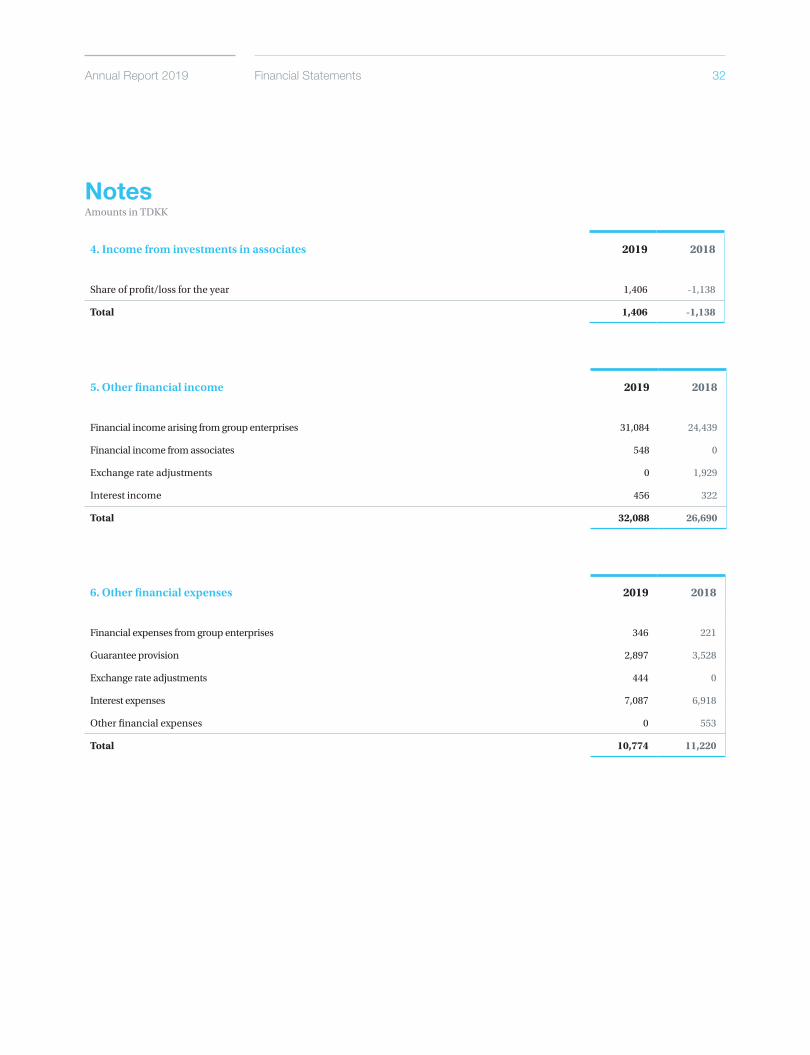
4. Income from investments in associates 2019 2018
Share of profit/loss for the year 1,406 -1,138
Total 1,406 -1,138
5. Other financial income 2019 2018
Financial income arising from group enterprises 31,084 24,439
Financial income from associates 548 0
Exchange rate adjustments 0 1,929
Interest income 456 322
Total 32,088 26,690
6. Other financial expenses 2019 2018
Financial expenses from group enterprises 346 221
Guarantee provision 2,897 3,528
Exchange rate adjustments 444 0
Interest expenses 7,087 6,918
Other financial expenses 0 553
Total 10,774 11,220
Financial Statements
NotesAmounts in TDKK
Centrica Energy Trading 33Financial Statements
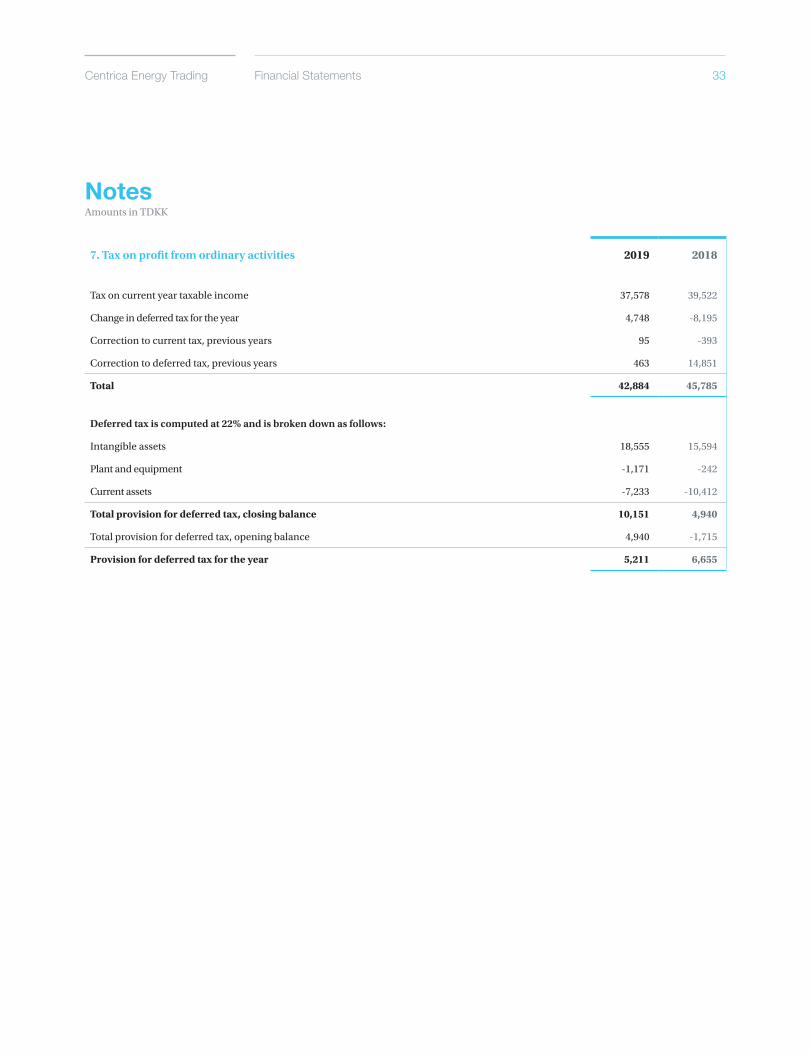
7. Tax on profit from ordinary activities 2019 2018
Tax on current year taxable income 37,578 39,522
Change in deferred tax for the year 4,748 -8,195
Correction to current tax, previous years 95 -393
Correction to deferred tax, previous years 463 14,851
Total 42,884 45,785
Deferred tax is computed at 22% and is broken down as follows:
Intangible assets 18,555 15,594
Plant and equipment -1,171 -242
Current assets -7,233 -10,412
Total provision for deferred tax, closing balance 10,151 4,940
Total provision for deferred tax, opening balance 4,940 -1,715
Provision for deferred tax for the year 5,211 6,655
NotesAmounts in TDKK
Annual Report 2019 34Financial Statements
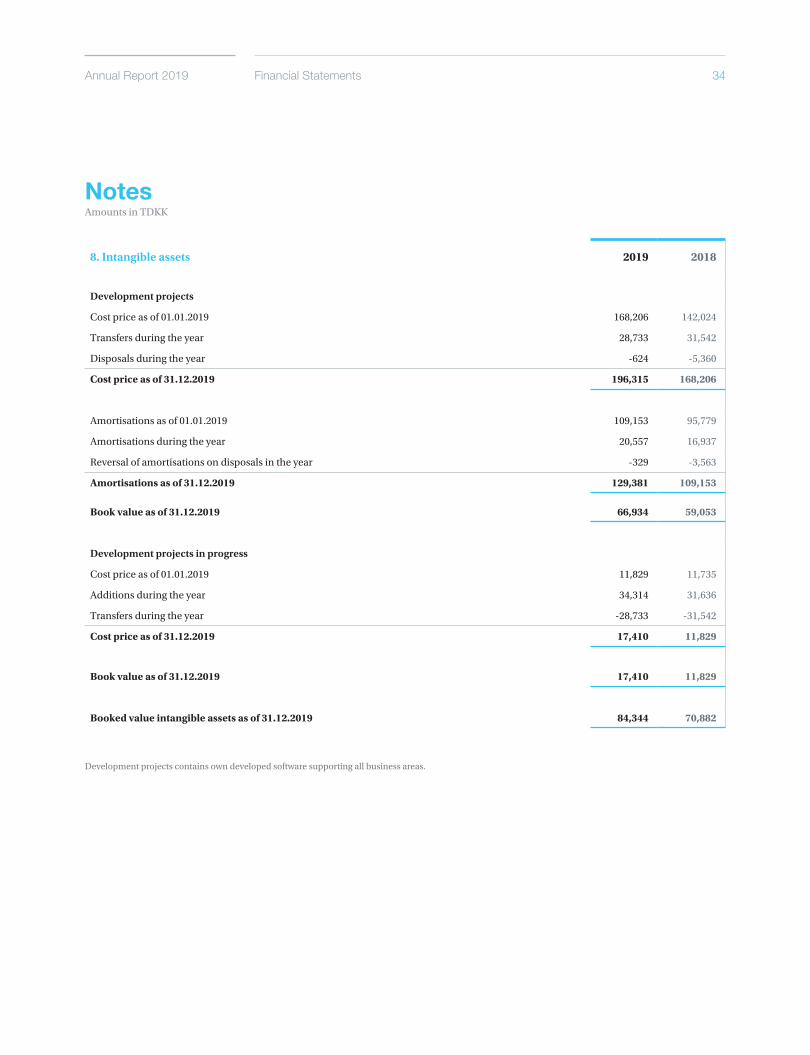
8. Intangible assets 2019 2018
Development projects
Cost price as of 01.01.2019 168,206 142,024
Transfers during the year 28,733 31,542
Disposals during the year -624 -5,360
Cost price as of 31.12.2019 196,315 168,206
Amortisations as of 01.01.2019 109,153 95,779
Amortisations during the year 20,557 16,937
Reversal of amortisations on disposals in the year -329 -3,563
Amortisations as of 31.12.2019 129,381 109,153
Book value as of 31.12.2019 66,934 59,053
Development projects in progress
Cost price as of 01.01.2019 11,829 11,735
Additions during the year 34,314 31,636
Transfers during the year -28,733 -31,542
Cost price as of 31.12.2019 17,410 11,829
Book value as of 31.12.2019 17,410 11,829
Booked value intangible assets as of 31.12.2019 84,344 70,882
NotesAmounts in TDKK
Development projects contains own developed software supporting all business areas.
Centrica Energy Trading 35Financial Statements
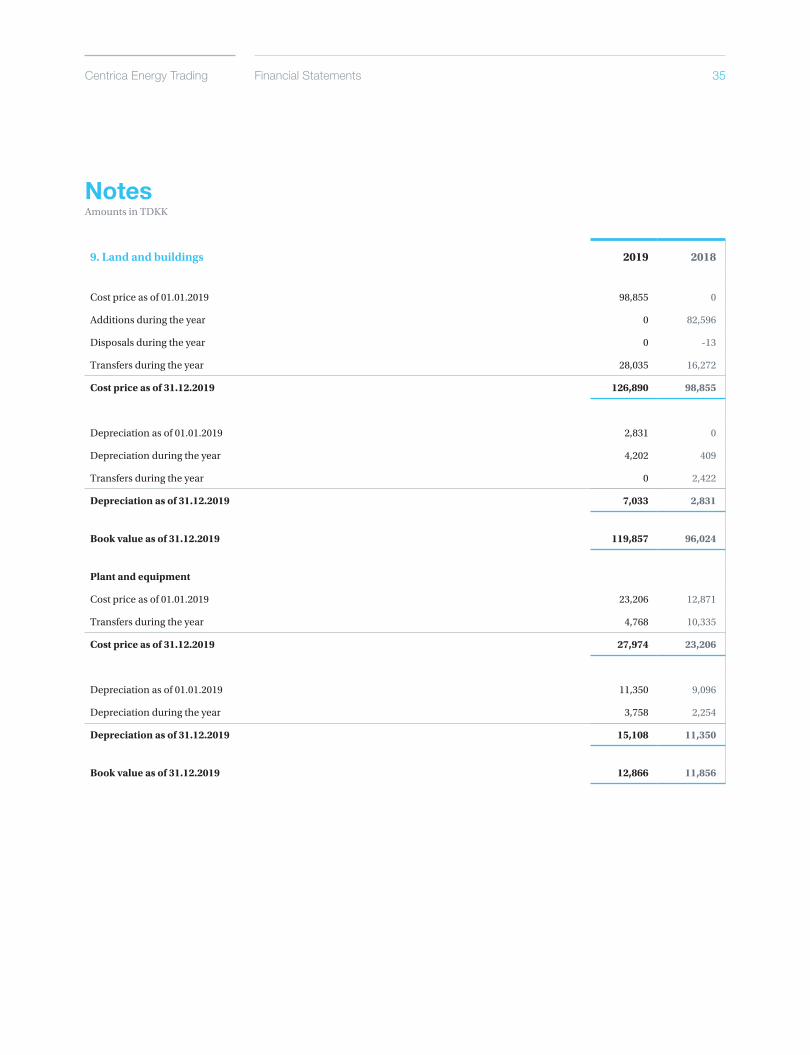
9. Land and buildings 2019 2018
Cost price as of 01.01.2019 98,855 0
Additions during the year 0 82,596
Disposals during the year 0 -13
Transfers during the year 28,035 16,272
Cost price as of 31.12.2019 126,890 98,855
Depreciation as of 01.01.2019 2,831 0
Depreciation during the year 4,202 409
Transfers during the year 0 2,422
Depreciation as of 31.12.2019 7,033 2,831
Book value as of 31.12.2019 119,857 96,024
Plant and equipment
Cost price as of 01.01.2019 23,206 12,871
Transfers during the year 4,768 10,335
Cost price as of 31.12.2019 27,974 23,206
Depreciation as of 01.01.2019 11,350 9,096
Depreciation during the year 3,758 2,254
Depreciation as of 31.12.2019 15,108 11,350
Book value as of 31.12.2019 12,866 11,856
NotesAmounts in TDKK
Annual Report 2019 36
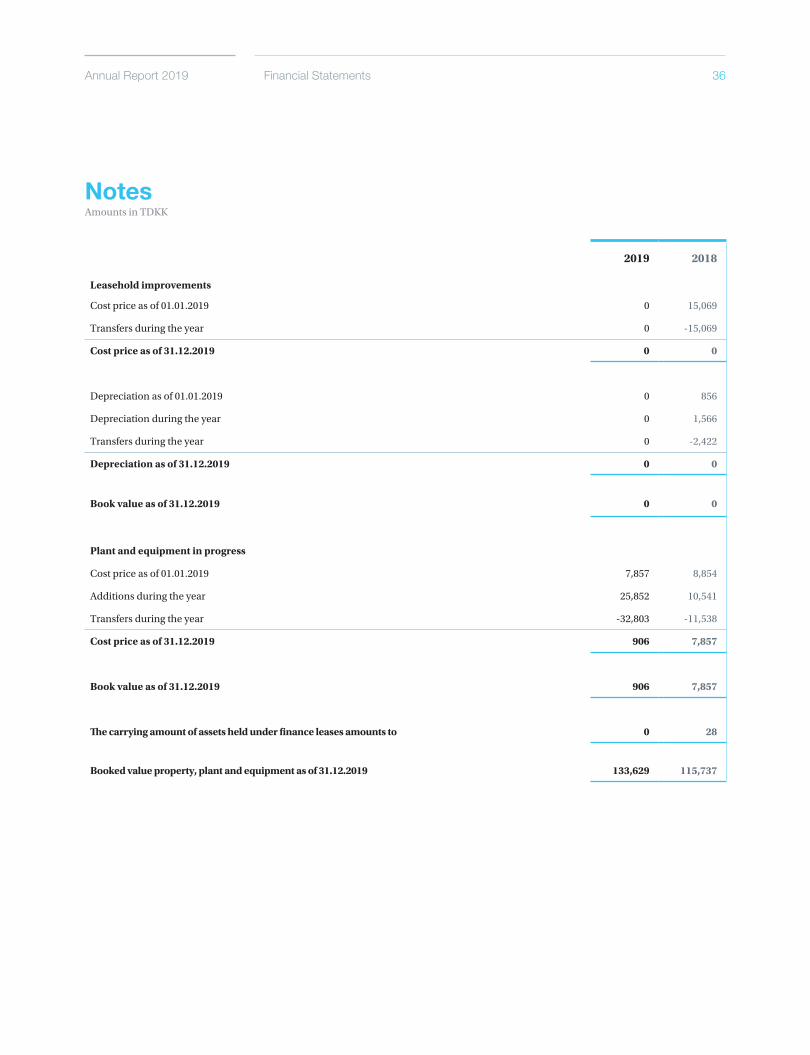
2019 2018
Leasehold improvements
Cost price as of 01.01.2019 0 15,069
Transfers during the year 0 -15,069
Cost price as of 31.12.2019 0 0
Depreciation as of 01.01.2019 0 856
Depreciation during the year 0 1,566
Transfers during the year 0 -2,422
Depreciation as of 31.12.2019 0 0
Book value as of 31.12.2019 0 0
Plant and equipment in progress
Cost price as of 01.01.2019 7,857 8,854
Additions during the year 25,852 10,541
Transfers during the year -32,803 -11,538
Cost price as of 31.12.2019 906 7,857
Book value as of 31.12.2019 906 7,857
The carrying amount of assets held under finance leases amounts to 0 28
Booked value property, plant and equipment as of 31.12.2019 133,629 115,737
NotesAmounts in TDKK
Financial Statements
Centrica Energy Trading 37Financial Statements
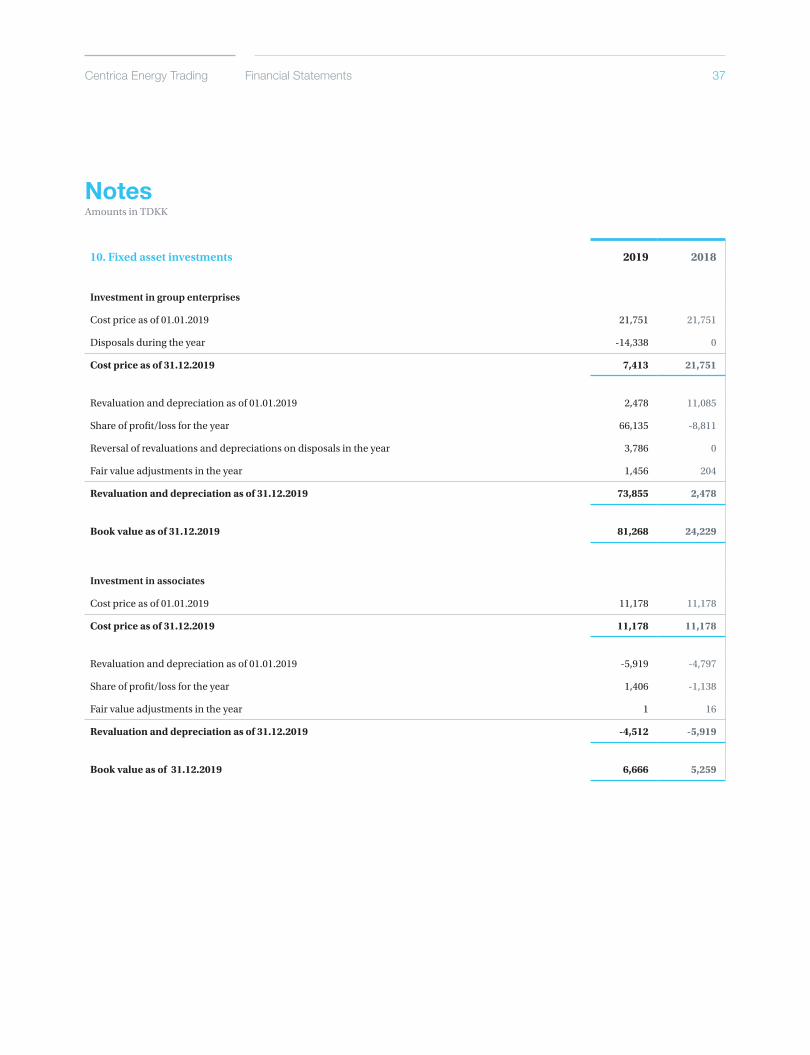
10. Fixed asset investments 2019 2018
Investment in group enterprises
Cost price as of 01.01.2019 21,751 21,751
Disposals during the year -14,338 0
Cost price as of 31.12.2019 7,413 21,751
Revaluation and depreciation as of 01.01.2019 2,478 11,085
Share of profit/loss for the year 66,135 -8,811
Reversal of revaluations and depreciations on disposals in the year 3,786 0
Fair value adjustments in the year 1,456 204
Revaluation and depreciation as of 31.12.2019 73,855 2,478
Book value as of 31.12.2019 81,268 24,229
Investment in associates
Cost price as of 01.01.2019 11,178 11,178
Cost price as of 31.12.2019 11,178 11,178
Revaluation and depreciation as of 01.01.2019 -5,919 -4,797
Share of profit/loss for the year 1,406 -1,138
Fair value adjustments in the year 1 16
Revaluation and depreciation as of 31.12.2019 -4,512 -5,919
Book value as of 31.12.2019 6,666 5,259
NotesAmounts in TDKK

Annual Report 2019 38Financial Statements
NotesAmounts in TDKK
Group enterprises
Neas Invest A/S Aalborg, Denmark 1,342 -37 100%
NEAS Fondsmæglerselskab A/S (solvent liquidation in 2019) Aalborg, Denmark 0 -73 100%
Neas Energy Ltd. London, United Kingdom 29,593 15,035 100%
Centrica Energy Trading Gmbh. Hamburg, Germany -3,808 18,018 100%
Centrica Energy Trading Pte. Ltd. Singapore 54,162 33,192 100%
Associates
Danish Carbon Fund Copenhagen, Denmark 4,159 -2,000 7%
Vindpark Keblowo ApS Hobro, Denmark 12,759 3,089 50%
DomicileProfit for
the yearPercentage
owned
10. Fixed asset investments
Equity
Centrica Energy Trading 39Financial Statements
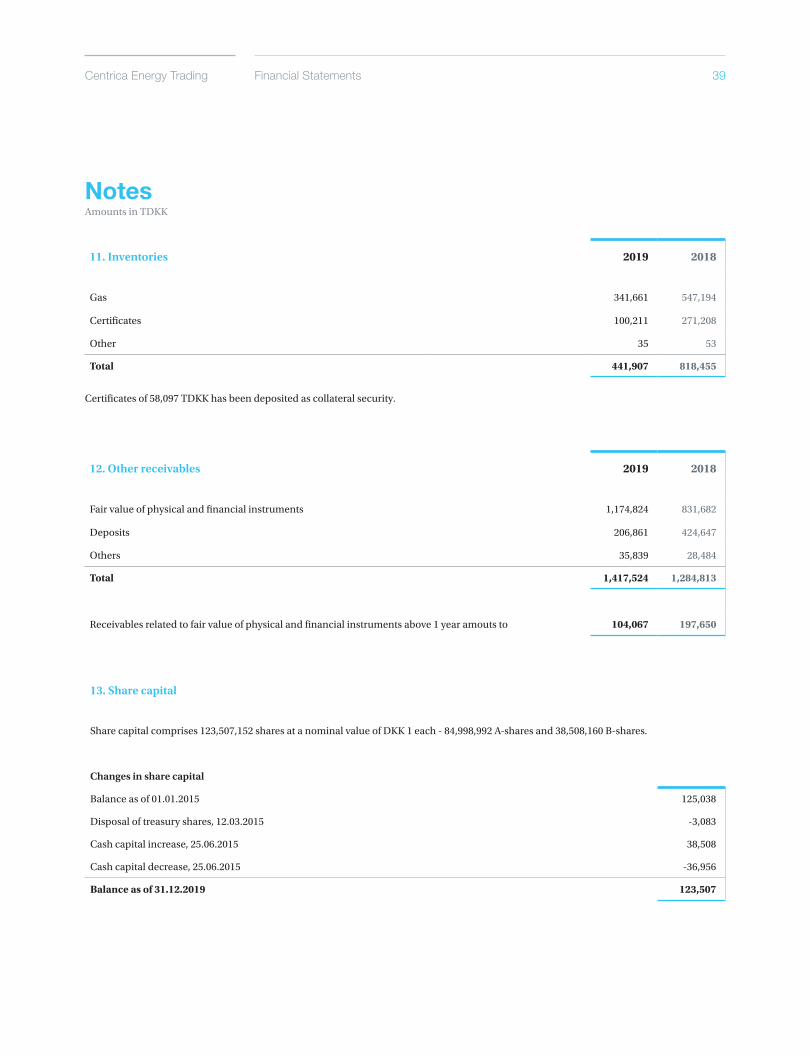
Changes in share capital
Balance as of 01.01.2015 125,038
Disposal of treasury shares, 12.03.2015 -3,083
Cash capital increase, 25.06.2015 38,508
Cash capital decrease, 25.06.2015 -36,956
Balance as of 31.12.2019 123,507
NotesAmounts in TDKK
13. Share capital
Share capital comprises 123,507,152 shares at a nominal value of DKK 1 each - 84,998,992 A-shares and 38,508,160 B-shares.
12. Other receivables 2019 2018
Fair value of physical and financial instruments 1,174,824 831,682
Deposits 206,861 424,647
Others 35,839 28,484
Total 1,417,524 1,284,813
Receivables related to fair value of physical and financial instruments above 1 year amouts to 104,067 197,650
11. Inventories 2019 2018
Gas 341,661 547,194
Certificates 100,211 271,208
Other 35 53
Total 441,907 818,455
Certificates of 58,097 TDKK has been deposited as collateral security.
Annual Report 2019 40Financial Statements
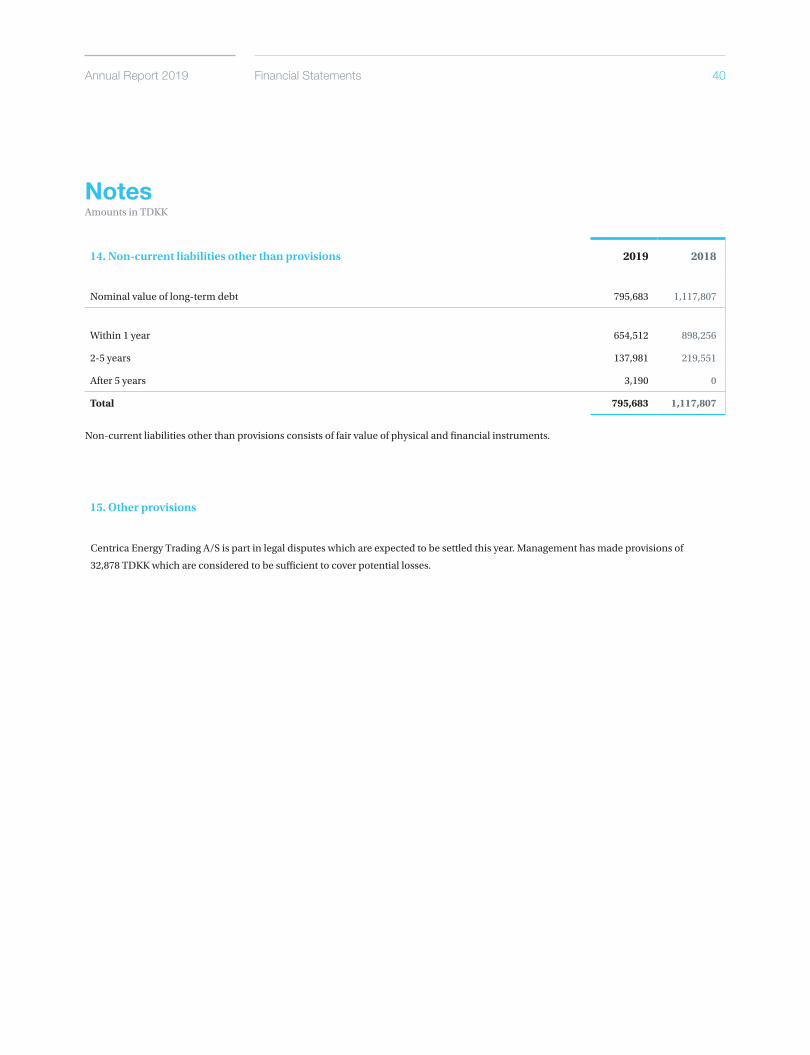
14. Non-current liabilities other than provisions 2019 2018
Nominal value of long-term debt 795,683 1,117,807
Within 1 year 654,512 898,256
2-5 years 137,981 219,551
After 5 years 3,190 0
Total 795,683 1,117,807
NotesAmounts in TDKK
15. Other provisions
Non-current liabilities other than provisions consists of fair value of physical and financial instruments.
Centrica Energy Trading A/S is part in legal disputes which are expected to be settled this year. Management has made provisions of
32,878 TDKK which are considered to be sufficient to cover potential losses.
Centrica Energy Trading 41Financial Statements
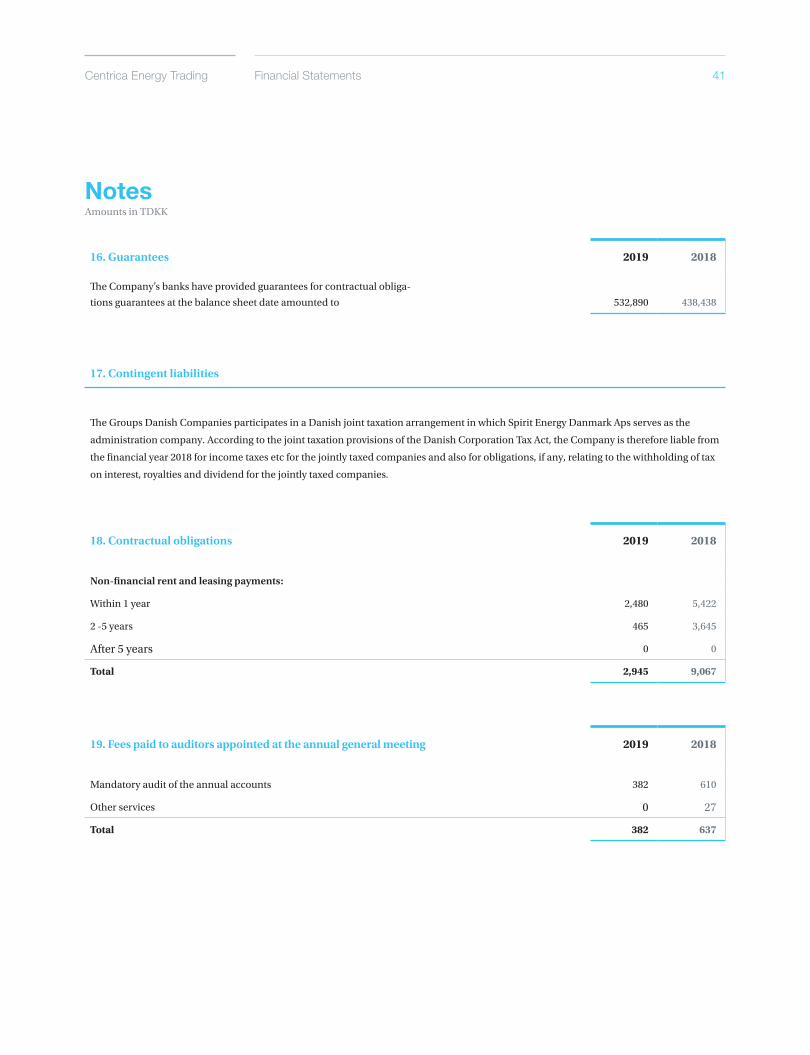
18. Contractual obligations 2019 2018
Non-financial rent and leasing payments:
Within 1 year 2,480 5,422
2 -5 years 465 3,645
After 5 years 0 0
Total 2,945 9,067
16. Guarantees 2019 2018
The Company’s banks have provided guarantees for contractual obliga-
tions guarantees at the balance sheet date amounted to 532,890 438,438
NotesAmounts in TDKK
17. Contingent liabilities
The Groups Danish Companies participates in a Danish joint taxation arrangement in which Spirit Energy Danmark Aps serves as the
administration company. According to the joint taxation provisions of the Danish Corporation Tax Act, the Company is therefore liable from
the financial year 2018 for income taxes etc for the jointly taxed companies and also for obligations, if any, relating to the withholding of tax
on interest, royalties and dividend for the jointly taxed companies.
19. Fees paid to auditors appointed at the annual general meeting 2019 2018
Mandatory audit of the annual accounts 382 610
Other services 0 27
Total 382 637
Centrica Energy Trading 42Financial Statements
NotesAmounts in TDKK
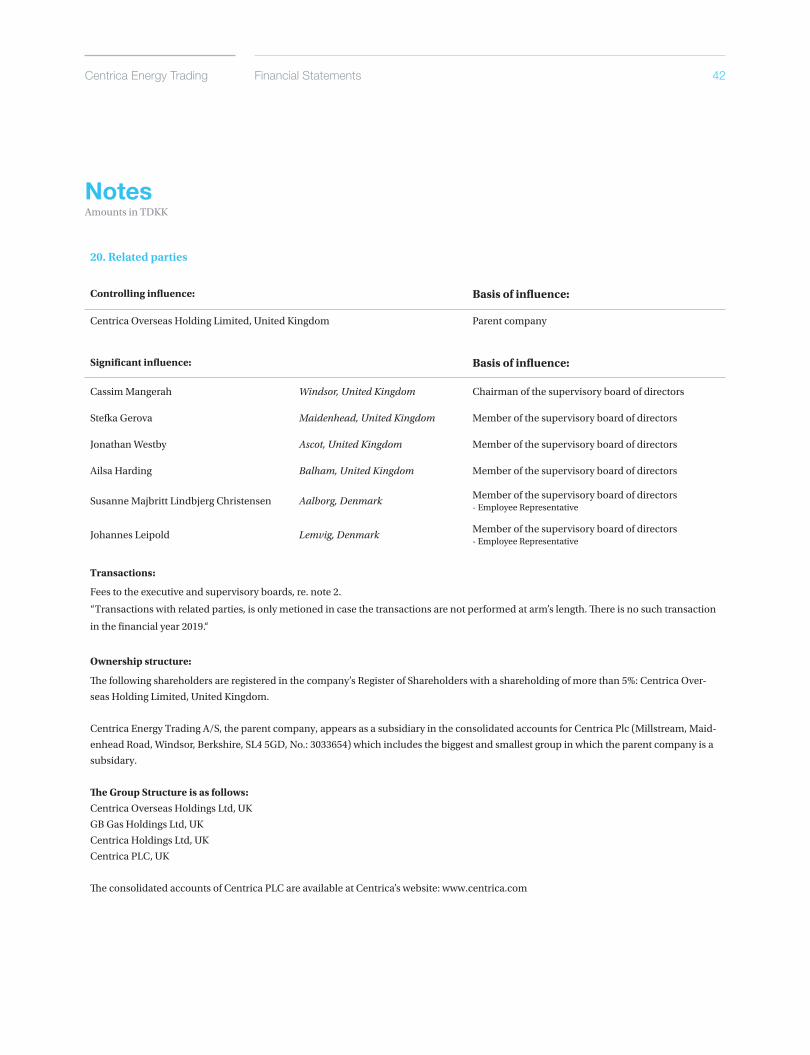
20. Related parties
Controlling influence: Basis of influence:
Centrica Overseas Holding Limited, United Kingdom Parent company
Significant influence: Basis of influence:
Cassim Mangerah Windsor, United Kingdom Chairman of the supervisory board of directors
Stefka Gerova Maidenhead, United Kingdom Member of the supervisory board of directors
Jonathan Westby Ascot, United Kingdom Member of the supervisory board of directors
Ailsa Harding Balham, United Kingdom Member of the supervisory board of directors
Susanne Majbritt Lindbjerg Christensen Aalborg, DenmarkMember of the supervisory board of directors - Employee Representative
Johannes Leipold Lemvig, DenmarkMember of the supervisory board of directors - Employee Representative
Transactions:
Fees to the executive and supervisory boards, re. note 2.
“Transactions with related parties, is only metioned in case the transactions are not performed at arm’s length. There is no such transaction
in the financial year 2019.“
Ownership structure:
The following shareholders are registered in the company’s Register of Shareholders with a shareholding of more than 5%: Centrica Over-
seas Holding Limited, United Kingdom.
Centrica Energy Trading A/S, the parent company, appears as a subsidiary in the consolidated accounts for Centrica Plc (Millstream, Maid-
enhead Road, Windsor, Berkshire, SL4 5GD, No.: 3033654) which includes the biggest and smallest group in which the parent company is a
subsidary.
The Group Structure is as follows:
Centrica Overseas Holdings Ltd, UK
GB Gas Holdings Ltd, UK
Centrica Holdings Ltd, UK
Centrica PLC, UK
The consolidated accounts of Centrica PLC are available at Centrica’s website: www.centrica.com
Annual Report 2019 43Financial Statements
Notes Regarding Financial InstrumentsAmounts in TDKK
Risk note
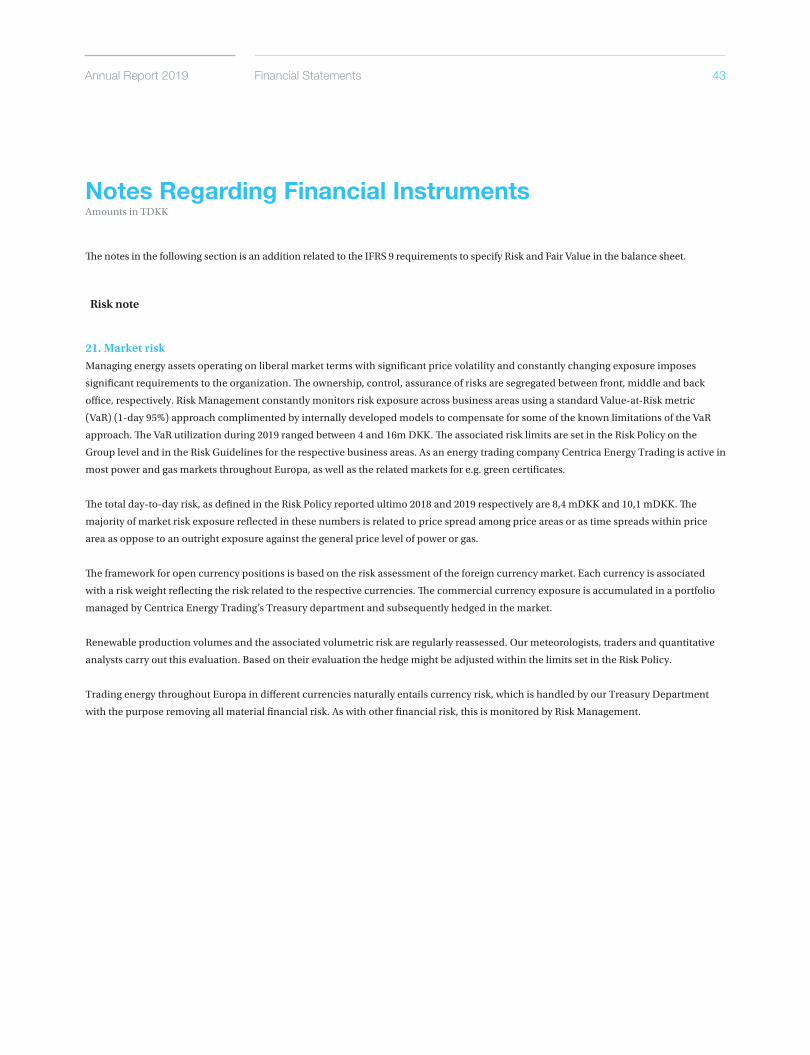
21. Market risk
Managing energy assets operating on liberal market terms with significant price volatility and constantly changing exposure imposes
significant requirements to the organization. The ownership, control, assurance of risks are segregated between front, middle and back
office, respectively. Risk Management constantly monitors risk exposure across business areas using a standard Value-at-Risk metric
(VaR) (1-day 95%) approach complimented by internally developed models to compensate for some of the known limitations of the VaR
approach. The VaR utilization during 2019 ranged between 4 and 16m DKK. The associated risk limits are set in the Risk Policy on the
Group level and in the Risk Guidelines for the respective business areas. As an energy trading company Centrica Energy Trading is active in
most power and gas markets throughout Europa, as well as the related markets for e.g. green certificates.
The total day-to-day risk, as defined in the Risk Policy reported ultimo 2018 and 2019 respectively are 8,4 mDKK and 10,1 mDKK. The
majority of market risk exposure reflected in these numbers is related to price spread among price areas or as time spreads within price
area as oppose to an outright exposure against the general price level of power or gas.
The framework for open currency positions is based on the risk assessment of the foreign currency market. Each currency is associated
with a risk weight reflecting the risk related to the respective currencies. The commercial currency exposure is accumulated in a portfolio
managed by Centrica Energy Trading’s Treasury department and subsequently hedged in the market.
Renewable production volumes and the associated volumetric risk are regularly reassessed. Our meteorologists, traders and quantitative
analysts carry out this evaluation. Based on their evaluation the hedge might be adjusted within the limits set in the Risk Policy.
Trading energy throughout Europa in different currencies naturally entails currency risk, which is handled by our Treasury Department
with the purpose removing all material financial risk. As with other financial risk, this is monitored by Risk Management.
The notes in the following section is an addition related to the IFRS 9 requirements to specify Risk and Fair Value in the balance sheet.
Centrica Energy Trading 44Financial Statements
Notes Regarding Financial InstrumentsAmounts in TDKK
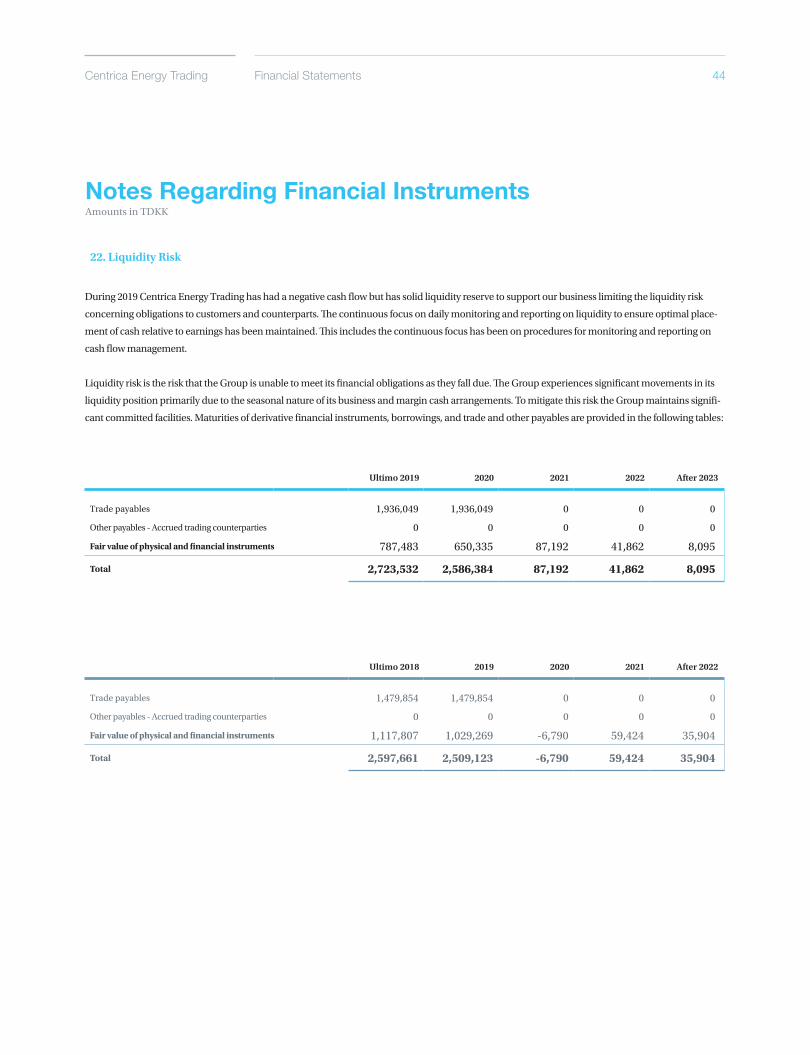
22. Liquidity Risk
During 2019 Centrica Energy Trading has had a negative cash flow but has solid liquidity reserve to support our business limiting the liquidity risk
concerning obligations to customers and counterparts. The continuous focus on daily monitoring and reporting on liquidity to ensure optimal place-
ment of cash relative to earnings has been maintained. This includes the continuous focus has been on procedures for monitoring and reporting on
cash flow management.
Liquidity risk is the risk that the Group is unable to meet its financial obligations as they fall due. The Group experiences significant movements in its
liquidity position primarily due to the seasonal nature of its business and margin cash arrangements. To mitigate this risk the Group maintains signifi-
cant committed facilities. Maturities of derivative financial instruments, borrowings, and trade and other payables are provided in the following tables:
Trade payables 1,936,049 1,936,049 0 0 0
Other payables - Accrued trading counterparties 0 0 0 0 0
Fair value of physical and financial instruments 787,483 650,335 87,192 41,862 8,095
Total 2,723,532 2,586,384 87,192 41,862 8,095
Trade payables 1,479,854 1,479,854 0 0 0
Other payables - Accrued trading counterparties 0 0 0 0 0
Fair value of physical and financial instruments 1,117,807 1,029,269 -6,790 59,424 35,904
Total 2,597,661 2,509,123 -6,790 59,424 35,904
Ultimo 2019 After 2023202220212020
Ultimo 2018 After 2022202120202019
Annual Report 2019 45
Notes Regarding Financial InstrumentsAmounts in TDKK
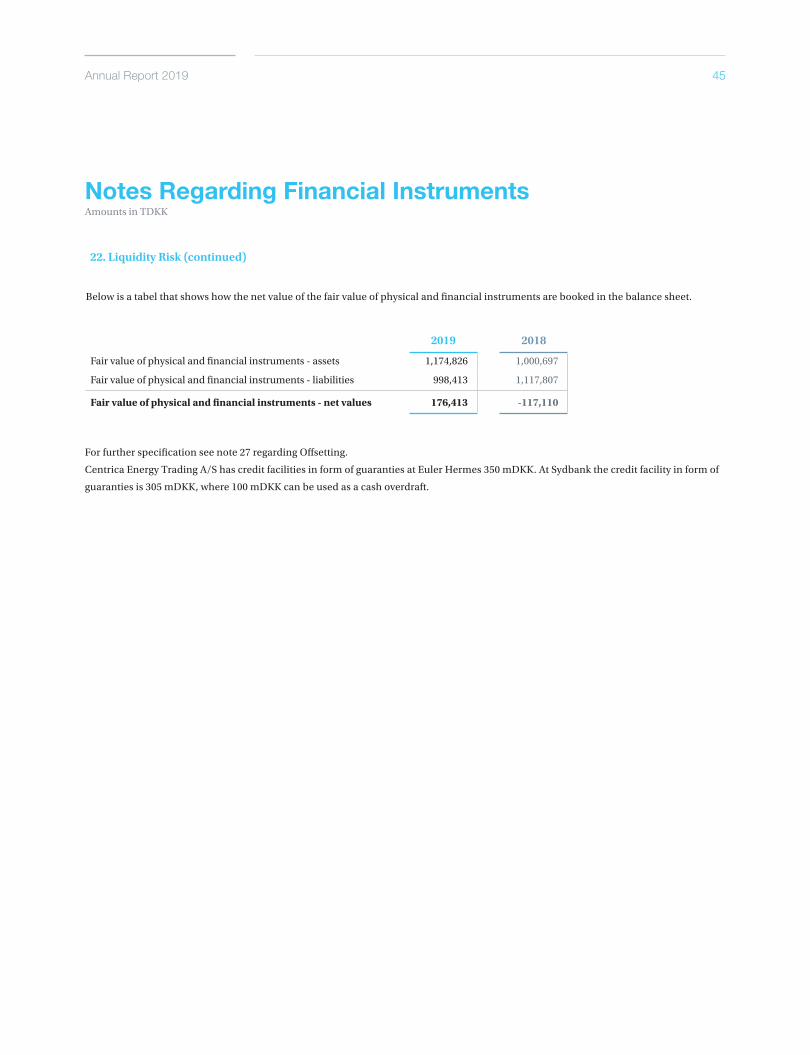
22. Liquidity Risk (continued)
Below is a tabel that shows how the net value of the fair value of physical and financial instruments are booked in the balance sheet.
For further specification see note 27 regarding Offsetting.
Centrica Energy Trading A/S has credit facilities in form of guaranties at Euler Hermes 350 mDKK. At Sydbank the credit facility in form of
guaranties is 305 mDKK, where 100 mDKK can be used as a cash overdraft.
2019 2018
Fair value of physical and financial instruments - assets 1,174,826 1,000,697
Fair value of physical and financial instruments - liabilities 998,413 1,117,807
Fair value of physical and financial instruments - net values 176,413 -117,110
Annual Report 2019 46Financial Statements
Notes Regarding Financial InstrumentsAmounts in TDKK
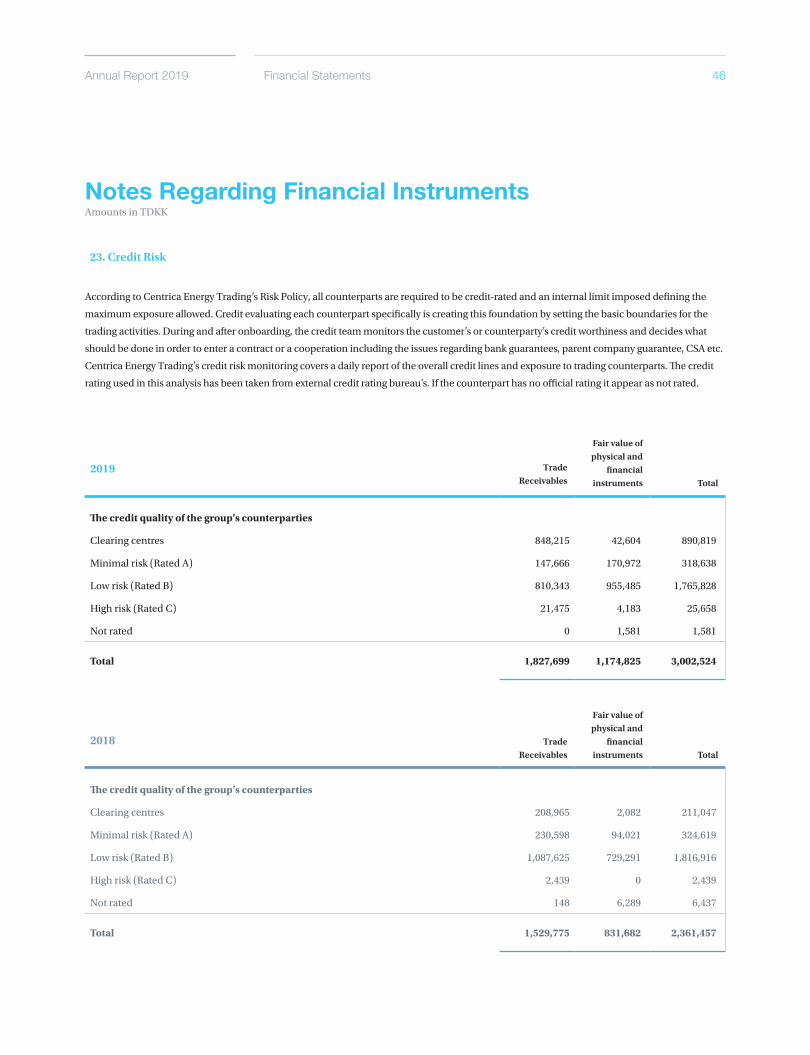
23. Credit Risk
According to Centrica Energy Trading’s Risk Policy, all counterparts are required to be credit-rated and an internal limit imposed defining the
maximum exposure allowed. Credit evaluating each counterpart specifically is creating this foundation by setting the basic boundaries for the
trading activities. During and after onboarding, the credit team monitors the customer’s or counterparty’s credit worthiness and decides what
should be done in order to enter a contract or a cooperation including the issues regarding bank guarantees, parent company guarantee, CSA etc.
Centrica Energy Trading’s credit risk monitoring covers a daily report of the overall credit lines and exposure to trading counterparts. The credit
rating used in this analysis has been taken from external credit rating bureau’s. If the counterpart has no official rating it appear as not rated.
2019
The credit quality of the group’s counterparties
Clearing centres 848,215 42,604 890,819
Minimal risk (Rated A) 147,666 170,972 318,638
Low risk (Rated B) 810,343 955,485 1,765,828
High risk (Rated C) 21,475 4,183 25,658
Not rated 0 1,581 1,581
Total 1,827,699 1,174,825 3,002,524
2018
The credit quality of the group’s counterparties
Clearing centres 208,965 2,082 211,047
Minimal risk (Rated A) 230,598 94,021 324,619
Low risk (Rated B) 1,087,625 729,291 1,816,916
High risk (Rated C) 2,439 0 2,439
Not rated 148 6,289 6,437
Total 1,529,775 831,682 2,361,457
Trade Receivables
Trade Receivables
Fair value of physical and
financial instruments
Fair value of physical and
financial instruments
Total
Total
Centrica Energy Trading 47Financial Statements
Notes Regarding Financial InstrumentsAmounts in TDKK
A considerable part of Centrica Energy Trading’s counterparts are covered by the standard EFET agreement. This agreement also contain
regulation on credit, payment and offsetting. This mean thatCentrica Energy Trading is less exposed to credit risk as opposed to a setup
with less or no standardised terms.
Minimal and low risk covers TSO’s, Power Plants and A-rated counterparts. It is the assessment of the Group that these counterparts carries
no or only little credit risk as they are part of partly public security of supply or have high credit ratings. The category “Not rated” covers
counterparts with smaller claims that has not been formally classified in the year end process or counterparts without any formal rating.
However Centrica Energy Trading always carries out an internal evaluation of the credit risk towards any counterpart before trading is
allowed.
23. Credit risk (continued)
Annual Report 2019 48Financial Statements
Notes Regarding Financial InstrumentsAmounts in TDKK
23. Credit risk (continued)
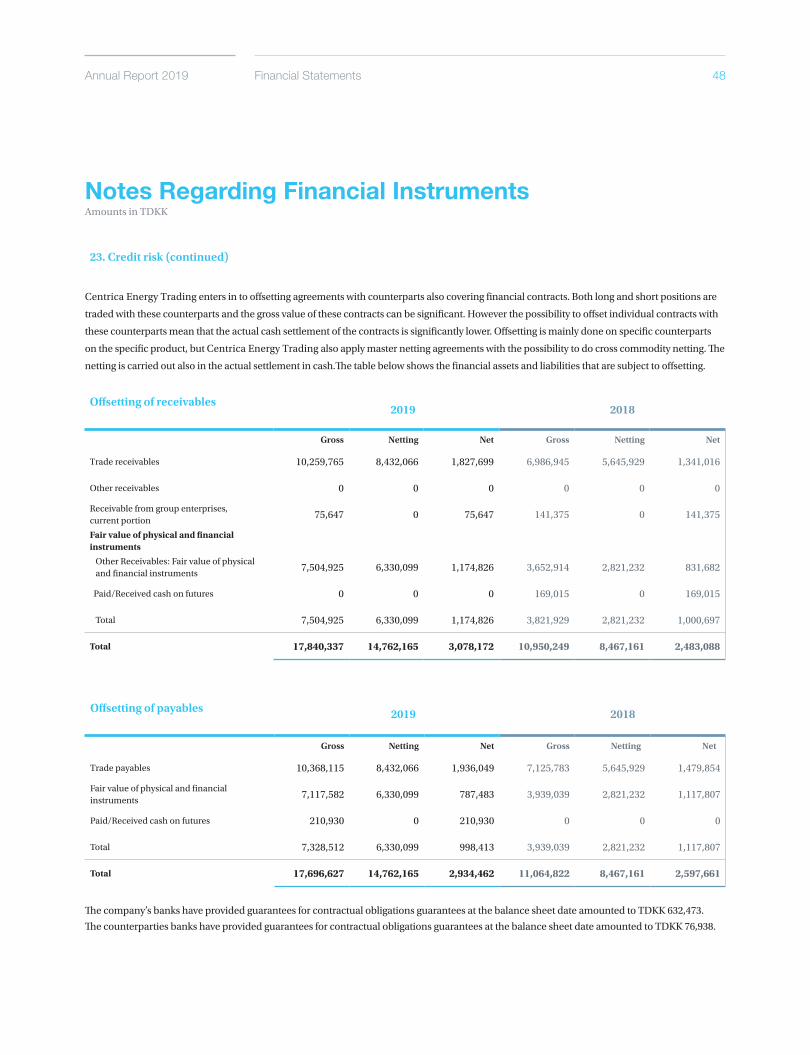
Centrica Energy Trading enters in to offsetting agreements with counterparts also covering financial contracts. Both long and short positions are
traded with these counterparts and the gross value of these contracts can be significant. However the possibility to offset individual contracts with
these counterparts mean that the actual cash settlement of the contracts is significantly lower. Offsetting is mainly done on specific counterparts
on the specific product, but Centrica Energy Trading also apply master netting agreements with the possibility to do cross commodity netting. The
netting is carried out also in the actual settlement in cash.The table below shows the financial assets and liabilities that are subject to offsetting.
Offsetting of receivables
Gross Netting Net Gross Netting Net
Trade receivables 10,259,765 8,432,066 1,827,699 6,986,945 5,645,929 1,341,016
Other receivables 0 0 0 0 0 0
Receivable from group enterprises, current portion
75,647 0 75,647 141,375 0 141,375
Fair value of physical and financial instruments
Other Receivables: Fair value of physical and financial instruments
7,504,925 6,330,099 1,174,826 3,652,914 2,821,232 831,682
Paid/Received cash on futures 0 0 0 169,015 0 169,015
Total 7,504,925 6,330,099 1,174,826 3,821,929 2,821,232 1,000,697
Total 17,840,337 14,762,165 3,078,172 10,950,249 8,467,161 2,483,088
Offsetting of payables
Gross Netting Net Gross Netting Net
Trade payables 10,368,115 8,432,066 1,936,049 7,125,783 5,645,929 1,479,854
Fair value of physical and financialinstruments
7,117,582 6,330,099 787,483 3,939,039 2,821,232 1,117,807
Paid/Received cash on futures 210,930 0 210,930 0 0 0
Total 7,328,512 6,330,099 998,413 3,939,039 2,821,232 1,117,807
Total 17,696,627 14,762,165 2,934,462 11,064,822 8,467,161 2,597,661
The company’s banks have provided guarantees for contractual obligations guarantees at the balance sheet date amounted to TDKK 632,473.
The counterparties banks have provided guarantees for contractual obligations guarantees at the balance sheet date amounted to TDKK 76,938.
2019
2019
2018
2018
Centrica Energy Trading 49Financial Statements
Notes Regarding Financial InstrumentsAmounts in TDKK
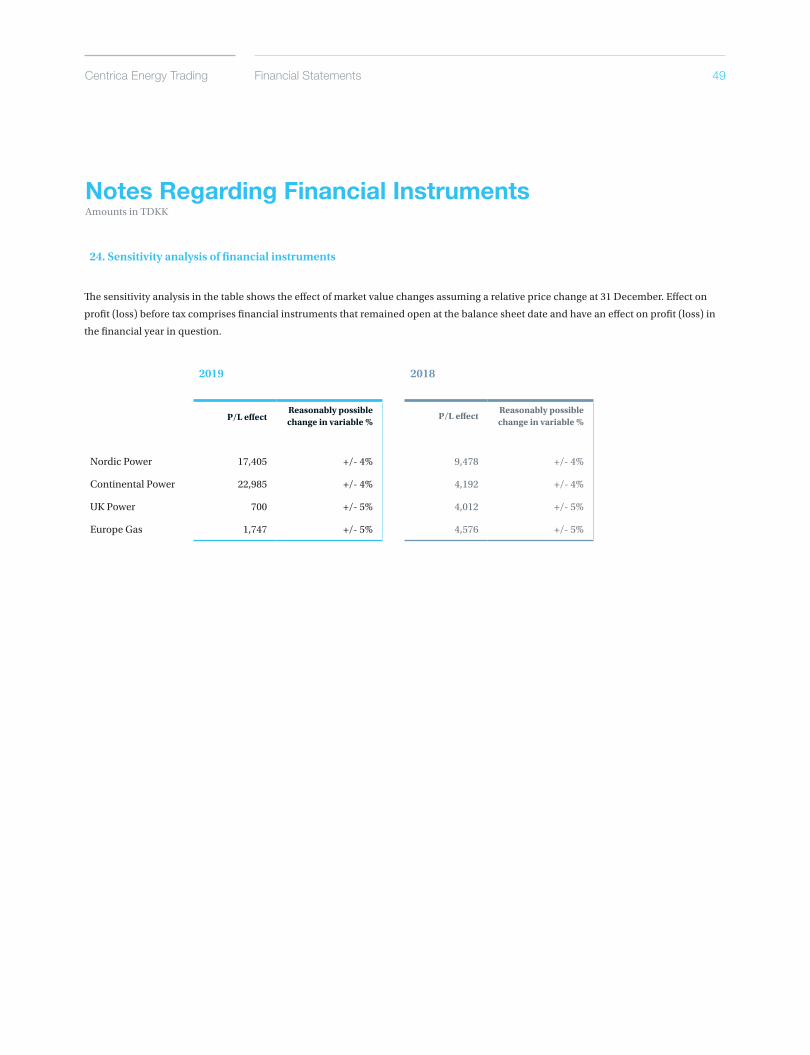
24. Sensitivity analysis of financial instruments
The sensitivity analysis in the table shows the effect of market value changes assuming a relative price change at 31 December. Effect on
profit (loss) before tax comprises financial instruments that remained open at the balance sheet date and have an effect on profit (loss) in
the financial year in question.
2019 2018
P/L effect Reasonably possible change in variable %
P/L effect Reasonably possible change in variable %
Nordic Power 17,405 +/- 4% 9,478 +/- 4%
Continental Power 22,985 +/- 4% 4,192 +/- 4%
UK Power 700 +/- 5% 4,012 +/- 5%
Europe Gas 1,747 +/- 5% 4,576 +/- 5%
Annual Report 2019 50Financial Statements
Notes Regarding Financial Instruments
25. Fair value hierachy
Fair value hierachy
Financial assets and financial liabilities measured and held at fair value are classified into one of the three categories, known as hierarchy
levels, which are defined according to the inputs used to measure fair value as follows:
• Level 1: Fair value is determined using observable inputs that reflect unadjusted quoted market prices for identical assets and liabilities;
• Level 2: Fair value is determined using significant inputs that may be directly observable inputs or unobservable inputs that are cor-
roborated by market data; and
• Level 3: Fair value is determined using significant unobservable inputs that are not corroborated by market data and may be used with
internally developed methodologies that result in management’s best estimate of fair value.
Valuation techniques used to derive Level 2 and Level 3 fair values and Group valuation process
Level 2 energy derivatives are fair valued by comparing the difference between the expected contractual cash flow for the relevant com-
modities and the quoted prices or prices derived from quoted prices. Renewable energy contracts with volume flexibility enters the
valuation with their expected production profile.
Level 2 foreign exchange contracts are fair valued using forward exchange rates that are quoted in an active market.
For Level 3 energy derivatives, the main input used by the Group pertains to deriving expected future commodity prices in markets with no
quoted prices at all. This applies for some OTC gas and power contracts traded in very illiquid markets.
Gas storage and cross border capacities (gas and power) enter the valuation (Level 3) using the intrinsic value as an estimate of the fair
value. On the transaction date, the extrinsic value (time value) is computed as the difference between the book value and the intrinsic
value. This time value is deferred until delivery of the underlying assets, equivalent to deferred day-1 values.
The notes in the following section is an addition related to the IAS 39 requirements to specify risk and fair value in the balance sheet
Level 1
• Exchange traded derivatives and
identical energy contracts
Level 2
• Power derivatives (not in Level 1 or 3)
• Gas derivatives (not in Level 1 or 3)
• Currency derivatives
Level 3
• Asian options
• Cross border capacities
• Power and gas derivatives traded in
markets with no access to market data
It should be noted that the fair values disclosed here only concern those contracts entered into which are within the scope of IAS 39. The
Group has a few other commodity contracts which are outside the scope of IFRS 9 and are not fair valued.
The Group’s valuation process includes specific team of individuals (Risk Management) that perform valuation of the Group’s derivatives
for financial reporting purposes, including Level 3 valuations. It is also Risk Management that derives future commodity price curves based
on available external data and these prices feed in to the energy derivatives valuations.
Centrica Energy Trading 51Financial Statements
Notes Regarding Financial InstrumentsAmounts in TDKK
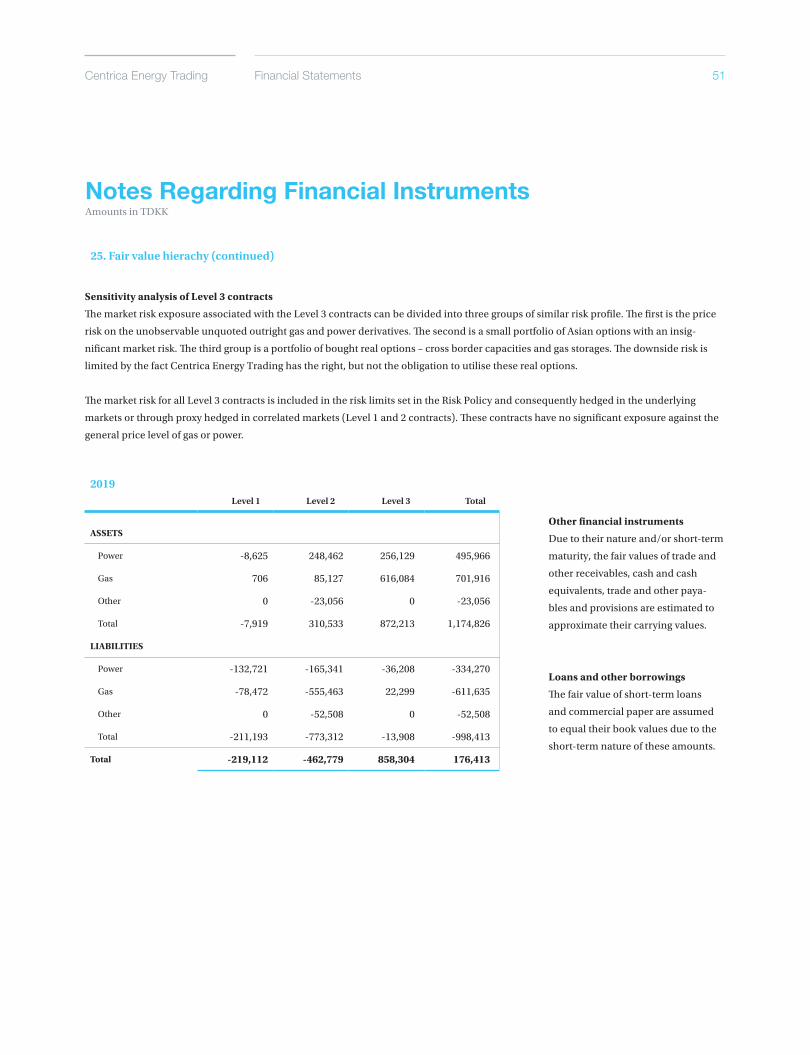
Sensitivity analysis of Level 3 contracts
The market risk exposure associated with the Level 3 contracts can be divided into three groups of similar risk profile. The first is the price
risk on the unobservable unquoted outright gas and power derivatives. The second is a small portfolio of Asian options with an insig-
nificant market risk. The third group is a portfolio of bought real options – cross border capacities and gas storages. The downside risk is
limited by the fact Centrica Energy Trading has the right, but not the obligation to utilise these real options.
The market risk for all Level 3 contracts is included in the risk limits set in the Risk Policy and consequently hedged in the underlying
markets or through proxy hedged in correlated markets (Level 1 and 2 contracts). These contracts have no significant exposure against the
general price level of gas or power.
Other financial instruments
Due to their nature and/or short-term
maturity, the fair values of trade and
other receivables, cash and cash
equivalents, trade and other paya-
bles and provisions are estimated to
approximate their carrying values.
Loans and other borrowings
The fair value of short-term loans
and commercial paper are assumed
to equal their book values due to the
short-term nature of these amounts.
2019
ASSETS
Power -8,625 248,462 256,129 495,966
Gas 706 85,127 616,084 701,916
Other 0 -23,056 0 -23,056
Total -7,919 310,533 872,213 1,174,826
LIABILITIES
Power -132,721 -165,341 -36,208 -334,270
Gas -78,472 -555,463 22,299 -611,635
Other 0 -52,508 0 -52,508
Total -211,193 -773,312 -13,908 -998,413
Total -219,112 -462,779 858,304 176,413
Level 1 TotalLevel 3Level 2
25. Fair value hierachy (continued)
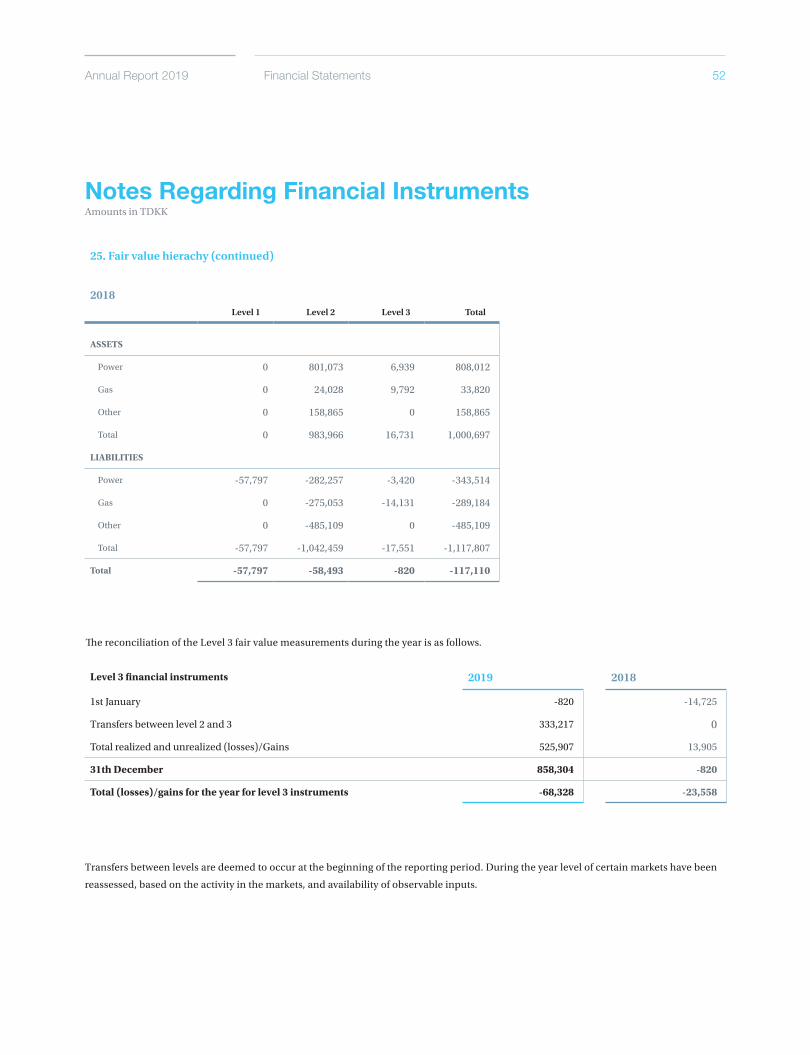
Annual Report 2019 52
Notes Regarding Financial InstrumentsAmounts in TDKK
The reconciliation of the Level 3 fair value measurements during the year is as follows.
2018
ASSETS
Power 0 801,073 6,939 808,012
Gas 0 24,028 9,792 33,820
Other 0 158,865 0 158,865
Total 0 983,966 16,731 1,000,697
LIABILITIES
Power -57,797 -282,257 -3,420 -343,514
Gas 0 -275,053 -14,131 -289,184
Other 0 -485,109 0 -485,109
Total -57,797 -1,042,459 -17,551 -1,117,807
Total -57,797 -58,493 -820 -117,110
Level 1 TotalLevel 3Level 2
25. Fair value hierachy (continued)
Level 3 financial instruments 2019 2018
1st January -820 -14,725
Transfers between level 2 and 3 333,217 0
Total realized and unrealized (losses)/Gains 525,907 13,905
31th December 858,304 -820
Total (losses)/gains for the year for level 3 instruments -68,328 -23,558
Financial Statements
Transfers between levels are deemed to occur at the beginning of the reporting period. During the year level of certain markets have been
reassessed, based on the activity in the markets, and availability of observable inputs.
Centrica Energy Trading 53Financial Statements
Notes Regarding Financial InstrumentsAmounts in TDKK
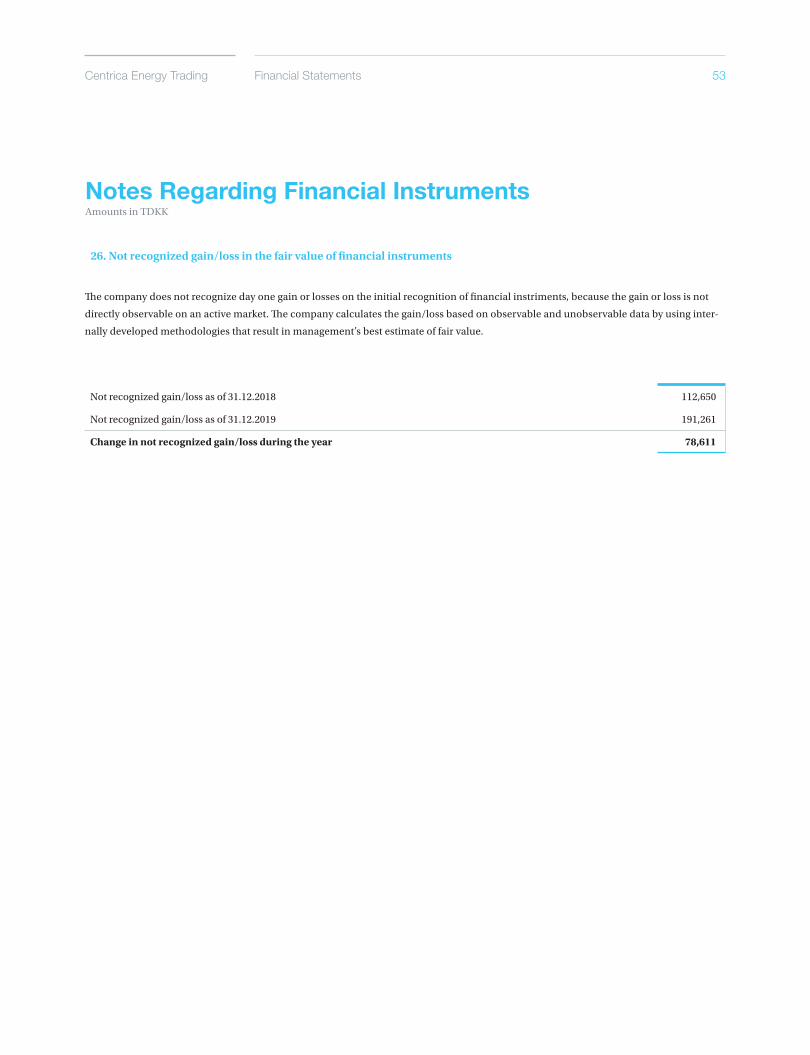
The company does not recognize day one gain or losses on the initial recognition of financial instriments, because the gain or loss is not
directly observable on an active market. The company calculates the gain/loss based on observable and unobservable data by using inter-
nally developed methodologies that result in management’s best estimate of fair value.
26. Not recognized gain/loss in the fair value of financial instruments
Not recognized gain/loss as of 31.12.2018 112,650
Not recognized gain/loss as of 31.12.2019 191,261
Change in not recognized gain/loss during the year 78,611
Centrica Energy Trading A/S
Skelagervej 1 · DK-9000 Aalborg
www.centrica.com · CVR no. 20293195