Embed Size (px)
Citation preview
GREEN NORMS FOR
GREEN ENERGY
SMALL HYDROPOWER
Centre for Science and Environment41, Tughlakabad Institutional Area, New Delhi – 110 062Tel: 91-11-29955124, 29956110, 29956394 Fax: 91-11-29955879Email: [email protected] Website: www.cseindia.org

GREEN NORMS FOR
GREEN ENERGY
Small Hydro Power
Centre for Science and Environment
Research directorChandra Bhushan
ResearchersJonas HambergAbhinav Goyal
ContributorsKanchan Kumar AgrawalAruna Kumarankandath
EditorsSouparno Banerjee Sheeba Madan
Design and layoutAnirban BoraKirpal Singh
ProductionRakesh Shrivastava Gundhar Das
Cover photoAbhinav Goyal
We are grateful to Shakti Sustainable Energy Foundation (www.shaktifoundation.in) for their support. However, the views expressedand analysis in this document does not necessarily reflect views of the Foundation. The Foundation also does not guarantee theaccuracy of any data included in this publication nor does it accept any responsibility for the consequences of its use.
© 2013 Centre for Science and Environment
Citation: Chandra Bhushan, Jonas Hamberg and Abhinav Goyal 2013, Green Norms for Green Energy: Small Hydro Power, Centrefor Science and Environment, New Delhi
Published by:Centre for Science and Environment41 Tughlakabad Institutional AreaNew Delhi – 110 062, IndiaPh: 91-11-2995 6110, 2995 5124, 2995 6394, 2995 6499Fax: 91-11-2995 5879, 2995 0870Email: [email protected] Website: www.cseindia.org
Contents
Introduction ................................................................................................................................1
Environmental impacts of SHP .................................................................................................3
SHP in Karnataka ........................................................................................................................9
SHP in Uttarakhand.................................................................................................................11
Regulations ..............................................................................................................................16
Global best practices ................................................................................................................23
Recommendations ...................................................................................................................26
Annexures ...................................................................................................................................27
References ..................................................................................................................................31

4 GREEN NORMS FOR GREEN ENERGY: SMALL HYDRO POWER
GREEN NORMS FOR GREEN ENERGY: SMALL HYDRO POWER 1
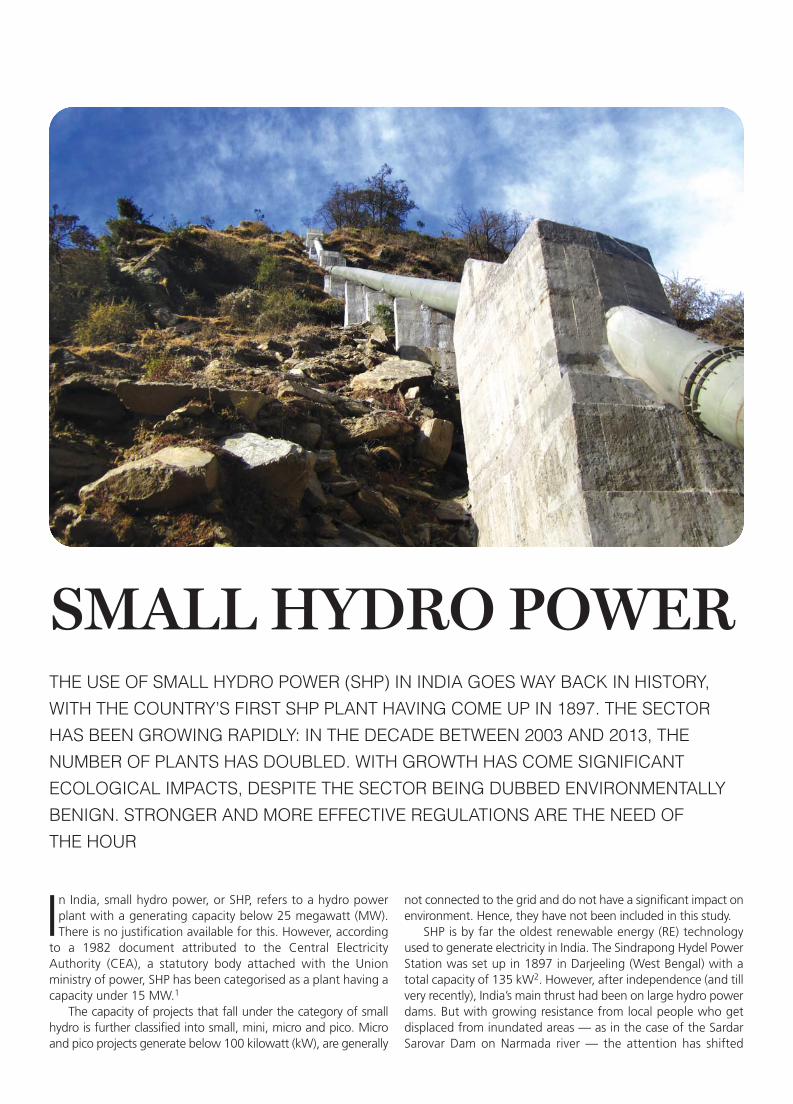
In India, small hydro power, or SHP, refers to a hydro powerplant with a generating capacity below 25 megawatt (MW).There is no justification available for this. However, according
to a 1982 document attributed to the Central ElectricityAuthority (CEA), a statutory body attached with the Unionministry of power, SHP has been categorised as a plant having acapacity under 15 MW.1
The capacity of projects that fall under the category of smallhydro is further classified into small, mini, micro and pico. Microand pico projects generate below 100 kilowatt (kW), are generally
not connected to the grid and do not have a significant impact onenvironment. Hence, they have not been included in this study.
SHP is by far the oldest renewable energy (RE) technologyused to generate electricity in India. The Sindrapong Hydel PowerStation was set up in 1897 in Darjeeling (West Bengal) with atotal capacity of 135 kW2. However, after independence (and tillvery recently), India’s main thrust had been on large hydro powerdams. But with growing resistance from local people who getdisplaced from inundated areas — as in the case of the SardarSarovar Dam on Narmada river — the attention has shifted
SMALL HYDRO POWERTHE USE OF SMALL HYDRO POWER (SHP) IN INDIA GOES WAY BACK IN HISTORY,
WITH THE COUNTRY’S FIRST SHP PLANT HAVING COME UP IN 1897. THE SECTOR
HAS BEEN GROWING RAPIDLY: IN THE DECADE BETWEEN 2003 AND 2013, THE
NUMBER OF PLANTS HAS DOUBLED. WITH GROWTH HAS COME SIGNIFICANT
ECOLOGICAL IMPACTS, DESPITE THE SECTOR BEING DUBBED ENVIRONMENTALLY
BENIGN. STRONGER AND MORE EFFECTIVE REGULATIONS ARE THE NEED OF
THE HOUR
2 GREEN NORMS FOR GREEN ENERGY: SMALL HYDRO POWER
towards smaller hydro power plants using ‘run-of-the-river’(ROR) design as well as towards canal-based projects. However,it is becoming apparent that these projects, especially thoseincorporating ROR design, do have environmental impacts thatcan rival large hydro projects when measured against the actualgeneration of the plants.
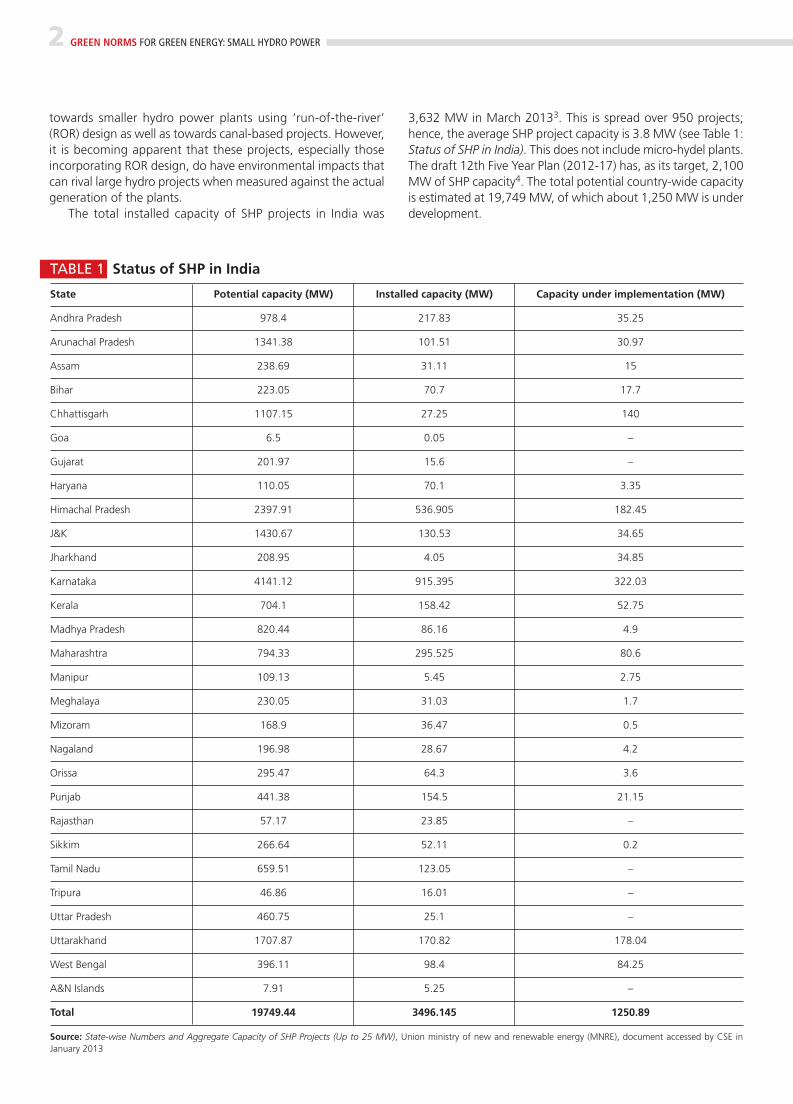
The total installed capacity of SHP projects in India was
3,632 MW in March 20133. This is spread over 950 projects;hence, the average SHP project capacity is 3.8 MW (see Table 1:Status of SHP in India). This does not include micro-hydel plants.The draft 12th Five Year Plan (2012-17) has, as its target, 2,100MW of SHP capacity4. The total potential country-wide capacityis estimated at 19,749 MW, of which about 1,250 MW is underdevelopment.
TABLE 1 Status of SHP in India
State Potential capacity (MW) Installed capacity (MW) Capacity under implementation (MW)
Andhra Pradesh 978.4 217.83 35.25
Arunachal Pradesh 1341.38 101.51 30.97
Assam 238.69 31.11 15
Bihar 223.05 70.7 17.7
Chhattisgarh 1107.15 27.25 140
Goa 6.5 0.05 –
Gujarat 201.97 15.6 –
Haryana 110.05 70.1 3.35
Himachal Pradesh 2397.91 536.905 182.45
J&K 1430.67 130.53 34.65
Jharkhand 208.95 4.05 34.85
Karnataka 4141.12 915.395 322.03
Kerala 704.1 158.42 52.75
Madhya Pradesh 820.44 86.16 4.9
Maharashtra 794.33 295.525 80.6
Manipur 109.13 5.45 2.75
Meghalaya 230.05 31.03 1.7
Mizoram 168.9 36.47 0.5
Nagaland 196.98 28.67 4.2
Orissa 295.47 64.3 3.6
Punjab 441.38 154.5 21.15
Rajasthan 57.17 23.85 –
Sikkim 266.64 52.11 0.2
Tamil Nadu 659.51 123.05 –
Tripura 46.86 16.01 –
Uttar Pradesh 460.75 25.1 –
Uttarakhand 1707.87 170.82 178.04
West Bengal 396.11 98.4 84.25
A&N Islands 7.91 5.25 –
Total 19749.44 3496.145 1250.89
Source: State-wise Numbers and Aggregate Capacity of SHP Projects (Up to 25 MW), Union ministry of new and renewable energy (MNRE), document accessed by CSE inJanuary 2013
GREEN NORMS FOR GREEN ENERGY: SMALL HYDRO POWER 3
SHP plants5 have been, and to some extent still are, viewed asbeing an environmentally benign energy source, and arecategorised by the Union ministry of new and renewable energy(MNRE) as a green and renewable technology. When comparedto thermal coal power, SHP has no effect on climate change, itsfuel source is inexhaustible and it does not contribute to airpollution. Water pollution by SHP is relatively low, and happensmainly during the construction phase. Compared to large dams, it inundates much lesser area and causes little or nodisplacement of people.
SHP can, however, exert multiple impacts on localenvironment and ecology. Because SHP is exempt from EIA inIndia, there are not many studies available which examine indetail either the project level impacts or cumulative impacts.The impacts which are perceived to be of critical importanceare ecological (on aquatic flora and fauna), physical (on waterquality, sediment carrying capacity, erosion, groundwater qualityand recharge, climate, soil and geology), and human–induced(such as interference with drinking and agriculture wateravailability, solid waste generation and socio-economic factors).
SHP plants with a capacity close to the maximum limit mayhave dams (even when classified ROR) up to 10 metres (m) inheight. SHP plants often re-route water through pipelines andtunnels to increase the pressure and remove silt, leaving longstretches of a river dry6. The river distance left dry by small RORplants varies depending on the geography of the site as well aswith the size of the project. For example, the 10-MW MadhyaMeshwar SHP plant in Uttarakhand uses a 4-km long tunnelalong the river.
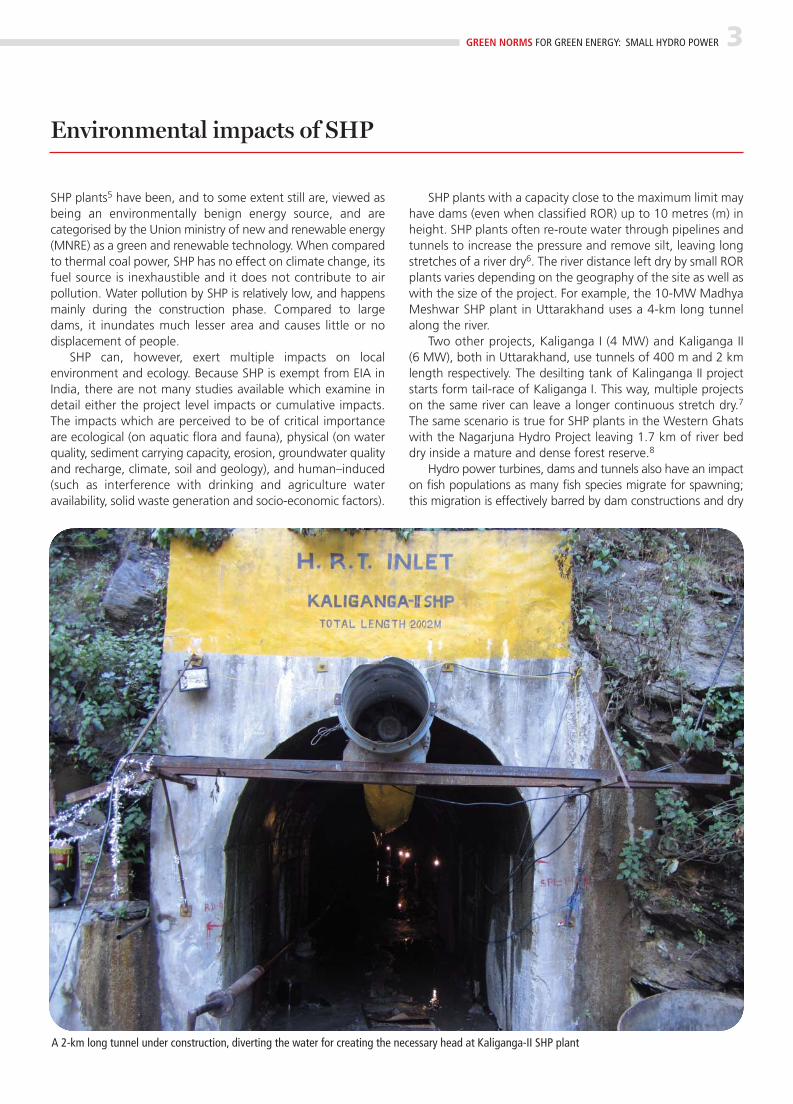
Two other projects, Kaliganga I (4 MW) and Kaliganga II (6 MW), both in Uttarakhand, use tunnels of 400 m and 2 kmlength respectively. The desilting tank of Kalinganga II projectstarts form tail-race of Kaliganga I. This way, multiple projectson the same river can leave a longer continuous stretch dry.7
The same scenario is true for SHP plants in the Western Ghatswith the Nagarjuna Hydro Project leaving 1.7 km of river beddry inside a mature and dense forest reserve.8
Hydro power turbines, dams and tunnels also have an impacton fish populations as many fish species migrate for spawning;this migration is effectively barred by dam constructions and dry
Environmental impacts of SHP
A 2-km long tunnel under construction, diverting the water for creating the necessary head at Kaliganga-II SHP plant
riverbeds. ‘Fish ladders’ — unblocked streams, either human-made or natural, running by the side of a project with ‘steps’ lowenough for the fish to travel — give fish an alternative means tomove up and downstream. They can be used or created toimprove migration; however, in most cases, this has not beendone. On the other hand, the success rate of fish-ladders isdebatable9, especially in tropical areas, where there has been littleresearch on how fish travel as opposed to studies on salmonmigration in the northern latitudes10.
A single SHP plant has a relatively lesser impact on thesurrounding area. However, since its output is also less, moreplants are required to generate the same amount of electricityas one large hydro power plant. Therefore, the cumulativeimpact of SHP projects is most important. In an article publishedin Energy Policy, Dominique Egrea and Joseph C Milewski ask:”Could the overall impact of a single 2,000-MW project be lessthan the cumulative impact of 400 small hydro power projectsof 5 MW, because of the number of rivers and tributaries whichwill be affected?"11
Four hundred SHP projects of 5 MW each have the potentialto affect more tributaries directly compared to one large hydropower project of 2,000 MW. The location of the dam site is alsoimportant. A large dam needs a greater flow which can only bepossible on major rivers. The World Bank, one of the largestfunding bodies for hydro power projects, admitted in 2003 thatthe impact of plants placed downstream on large rivers is moresevere than that of projects, including those that are small-scale,placed upstream on smaller tributaries12.
Furthermore, if SHP projects are designed with reservoirs(and not actual ROR), the area needed for these reservoirs ismuch larger per MW capacity as compared to large hydro
power projects. Theoretically, the volume of a reservoir increasescubically with an increase in surface area: a dam of double thesize would hold four times more water, and therefore be moreefficient. Similarly, the storage volume would decrease multipletimes if the surface area is cut in half13 (see Table 2: Comparativesizes of plants and reservoirs).
If measured according to impact per MW, SHP can — incertain scenarios — exert the same impacts as large hydropower (see Box: Small vs large). The environmental impacts varywidely depending on the site and the selected technology. Forinstance, canal projects which use no tunnels have no impactother than what the canal had from the start.
4 GREEN NORMS FOR GREEN ENERGY: SMALL HYDRO POWER
TABLE 2 Comparative sizes of plants andreservoirsSize of plants Number of plants Average size of (in MW) in survey category reservoir per unit of
power (ha/MW)
3000-18,200 19 32
2000-2999 16 40
1000-1999 36 36
500-999 25 80
250-499 37 69
100-249 33 96
2-99 33 249
Source: Robert Goodland, How to distinguish better hydros from worse: theenvironmental sustainability challenge for the hydro industry, The World Bank, 1995
Building a SHP plant leads to generation of rubble and wastes as seen here at the Adit tunnel of Kaliganga-II. Often, these wastes are dumped in pristineforest areas
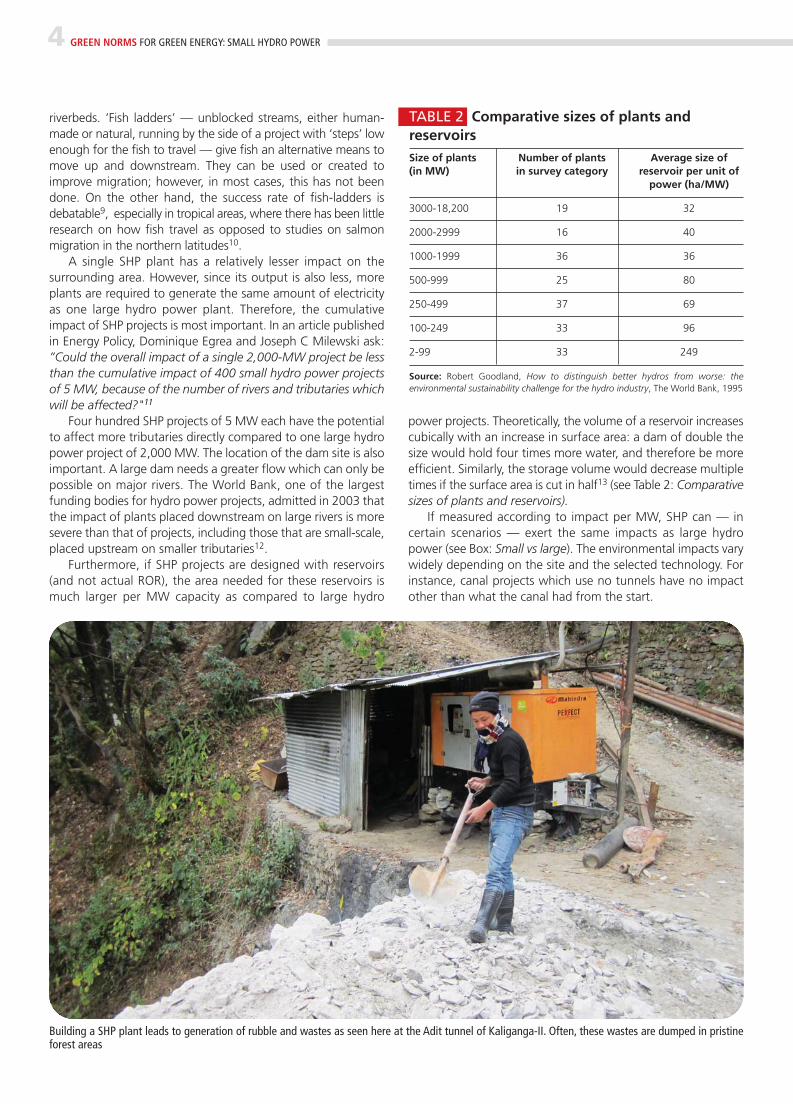
Access roads and transmission lines to and from multiplesmall plants increase the environmental impacts as they oftenneed to be constructed through hilly and forested terrain,necessitating the use of explosives such as dynamite. Thedeposition of rubble, muck and silt from both construction and
operations is also a concern; dumping sites are often located inpristine forest areas where they should be forbidden. Notreturning silt to the river may also lead to a decrease in nutrients downstream — nutrients that are vital for bothfarming14 and fisheries15.
GREEN NORMS FOR GREEN ENERGY: SMALL HYDRO POWER 5
SMALL VS LARGE
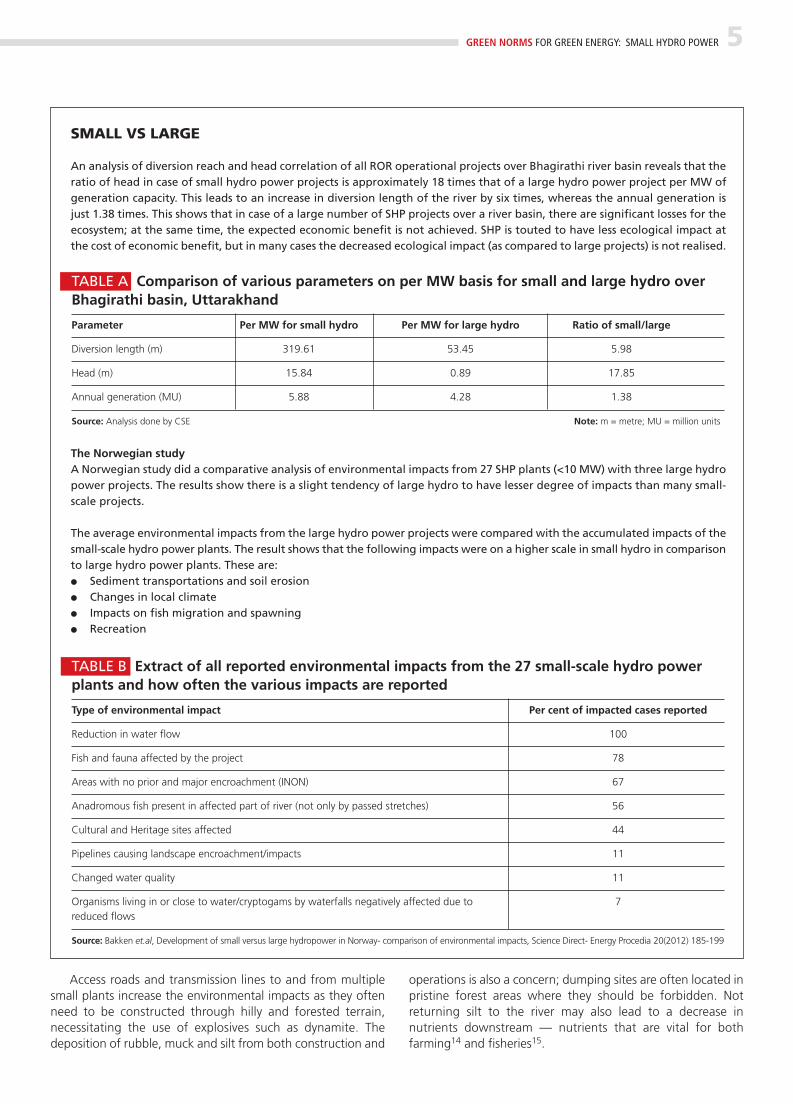
An analysis of diversion reach and head correlation of all ROR operational projects over Bhagirathi river basin reveals that theratio of head in case of small hydro power projects is approximately 18 times that of a large hydro power project per MW ofgeneration capacity. This leads to an increase in diversion length of the river by six times, whereas the annual generation isjust 1.38 times. This shows that in case of a large number of SHP projects over a river basin, there are significant losses for theecosystem; at the same time, the expected economic benefit is not achieved. SHP is touted to have less ecological impact atthe cost of economic benefit, but in many cases the decreased ecological impact (as compared to large projects) is not realised.
The Norwegian studyA Norwegian study did a comparative analysis of environmental impacts from 27 SHP plants (<10 MW) with three large hydropower projects. The results show there is a slight tendency of large hydro to have lesser degree of impacts than many small-scale projects.
The average environmental impacts from the large hydro power projects were compared with the accumulated impacts of thesmall-scale hydro power plants. The result shows that the following impacts were on a higher scale in small hydro in comparisonto large hydro power plants. These are:● Sediment transportations and soil erosion● Changes in local climate● Impacts on fish migration and spawning● Recreation
TABLE B Extract of all reported environmental impacts from the 27 small-scale hydro powerplants and how often the various impacts are reported
Type of environmental impact Per cent of impacted cases reported
Reduction in water flow 100
Fish and fauna affected by the project 78
Areas with no prior and major encroachment (INON) 67
Anadromous fish present in affected part of river (not only by passed stretches) 56
Cultural and Heritage sites affected 44
Pipelines causing landscape encroachment/impacts 11
Changed water quality 11
Organisms living in or close to water/cryptogams by waterfalls negatively affected due to 7reduced flows
Source: Bakken et.al, Development of small versus large hydropower in Norway- comparison of environmental impacts, Science Direct- Energy Procedia 20(2012) 185-199
TABLE A Comparison of various parameters on per MW basis for small and large hydro overBhagirathi basin, Uttarakhand
Parameter Per MW for small hydro Per MW for large hydro Ratio of small/large
Diversion length (m) 319.61 53.45 5.98
Head (m) 15.84 0.89 17.85
Annual generation (MU) 5.88 4.28 1.38
Source: Analysis done by CSE Note: m = metre; MU = million units
Cumulative impactsCumulative impacts imply the ‘addition’ of environmentaleffects due to various projects on the same river basin whichshare a similar topography, ecology and environment at large.
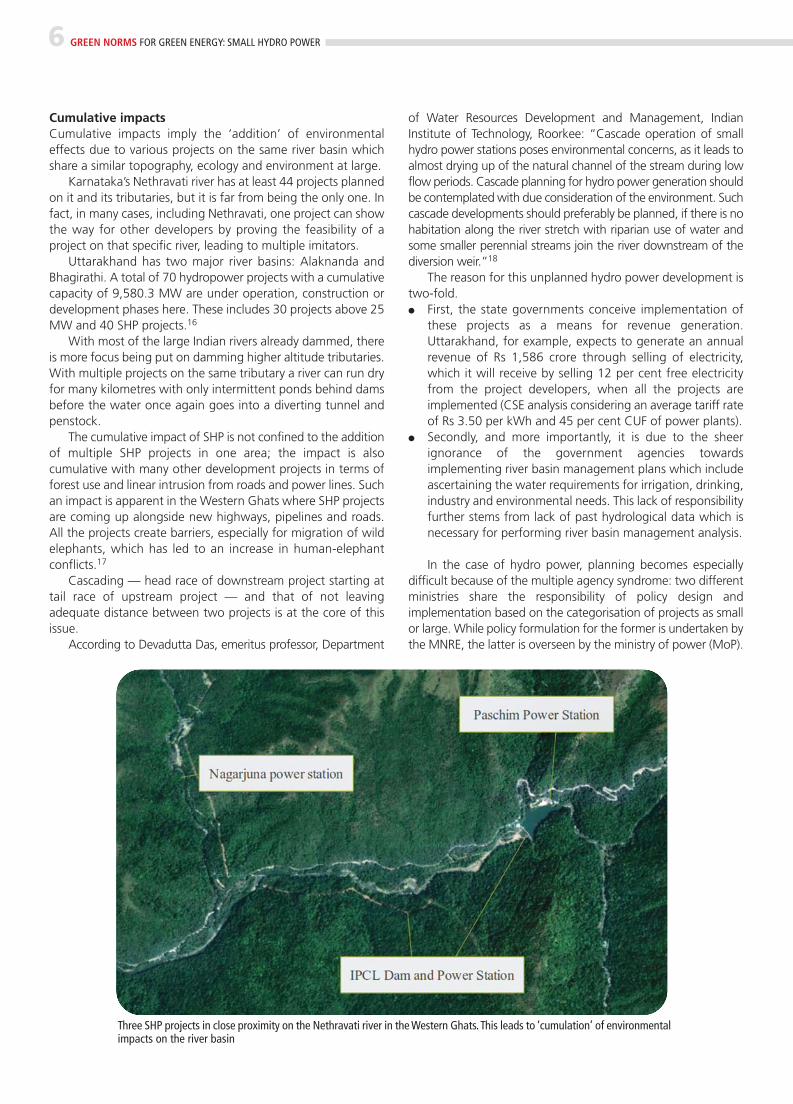
Karnataka’s Nethravati river has at least 44 projects plannedon it and its tributaries, but it is far from being the only one. Infact, in many cases, including Nethravati, one project can showthe way for other developers by proving the feasibility of aproject on that specific river, leading to multiple imitators.
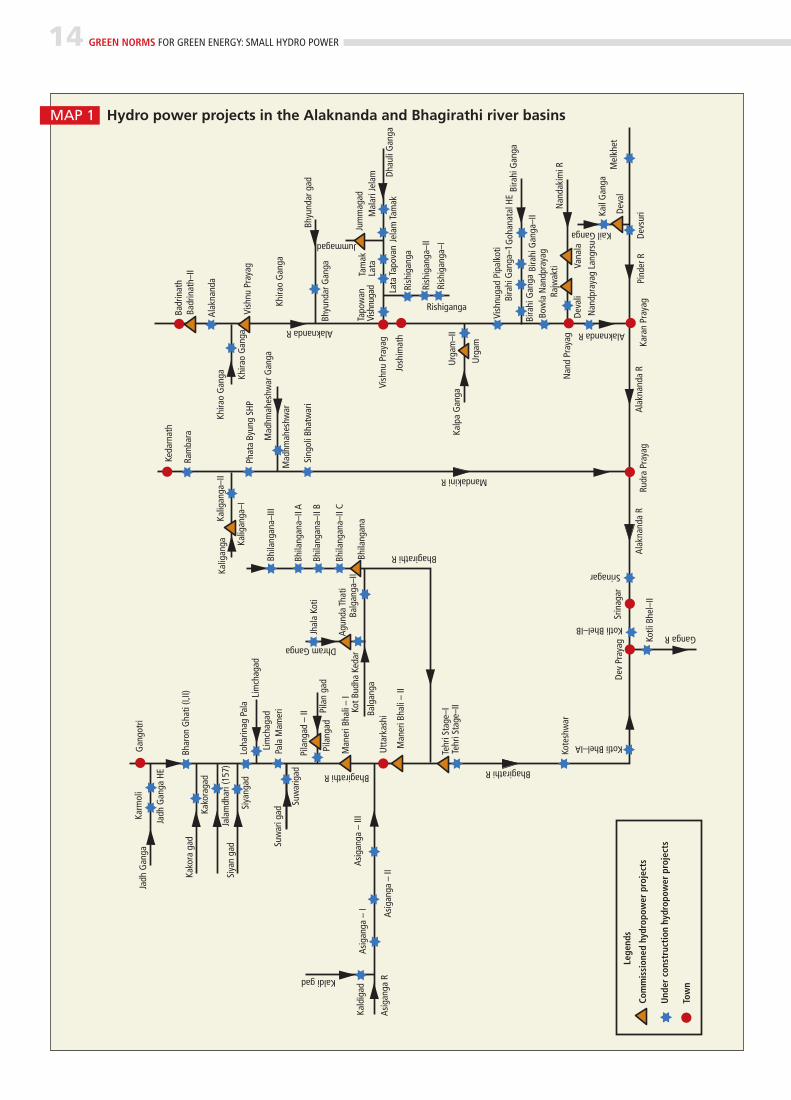
Uttarakhand has two major river basins: Alaknanda andBhagirathi. A total of 70 hydropower projects with a cumulativecapacity of 9,580.3 MW are under operation, construction ordevelopment phases here. These includes 30 projects above 25MW and 40 SHP projects.16
With most of the large Indian rivers already dammed, thereis more focus being put on damming higher altitude tributaries.With multiple projects on the same tributary a river can run dryfor many kilometres with only intermittent ponds behind damsbefore the water once again goes into a diverting tunnel andpenstock.
The cumulative impact of SHP is not confined to the additionof multiple SHP projects in one area; the impact is alsocumulative with many other development projects in terms offorest use and linear intrusion from roads and power lines. Suchan impact is apparent in the Western Ghats where SHP projectsare coming up alongside new highways, pipelines and roads.All the projects create barriers, especially for migration of wildelephants, which has led to an increase in human-elephantconflicts.17
Cascading — head race of downstream project starting attail race of upstream project — and that of not leavingadequate distance between two projects is at the core of thisissue.
According to Devadutta Das, emeritus professor, Department
of Water Resources Development and Management, IndianInstitute of Technology, Roorkee: “Cascade operation of smallhydro power stations poses environmental concerns, as it leads toalmost drying up of the natural channel of the stream during lowflow periods. Cascade planning for hydro power generation shouldbe contemplated with due consideration of the environment. Suchcascade developments should preferably be planned, if there is nohabitation along the river stretch with riparian use of water andsome smaller perennial streams join the river downstream of thediversion weir.”18
The reason for this unplanned hydro power development istwo-fold.● First, the state governments conceive implementation of
these projects as a means for revenue generation.Uttarakhand, for example, expects to generate an annualrevenue of Rs 1,586 crore through selling of electricity,which it will receive by selling 12 per cent free electricityfrom the project developers, when all the projects areimplemented (CSE analysis considering an average tariff rateof Rs 3.50 per kWh and 45 per cent CUF of power plants).
● Secondly, and more importantly, it is due to the sheerignorance of the government agencies towardsimplementing river basin management plans which includeascertaining the water requirements for irrigation, drinking,industry and environmental needs. This lack of responsibilityfurther stems from lack of past hydrological data which isnecessary for performing river basin management analysis.
In the case of hydro power, planning becomes especiallydifficult because of the multiple agency syndrome: two differentministries share the responsibility of policy design andimplementation based on the categorisation of projects as smallor large. While policy formulation for the former is undertaken bythe MNRE, the latter is overseen by the ministry of power (MoP).
6 GREEN NORMS FOR GREEN ENERGY: SMALL HYDRO POWER
Three SHP projects in close proximity on the Nethravati river in the Western Ghats. This leads to ‘cumulation’ of environmentalimpacts on the river basin
GREEN NORMS FOR GREEN ENERGY: SMALL HYDRO POWER 7
Ecological flowEcological flow is the concept of keeping enough water in theriver downstream from a dam to sustain ecosystems and humanlivelihoods dependent on water from the river. So far, in Indiathere are no country-wide rules on environmental flow even forlarge-scale hydro power projects. The concept is only adheredto at specific projects where it is part of the environmentalclearance process. The implementation and enforcement,however, is haphazard at best.
● Himachal Pradesh: This is the only state that hasintroduced general terms for minimum ecological flow thathydro power projects, including SHP projects, have tocomply with. The mandated minimum flow in Himachal is15 per cent of the average of the three leanest months(generally between October and February).19 But there is aconcern with this measurement: the state’s hydrology isaffected both by monsoon and glacier melt-off and the riverflow is highly seasonal. Therefore, 15 per cent of the leanflow will be a fraction of the high season flow.
Take, for example, the Ravi river. At its head, the leanseason (November to January) flow is only 22.6 per cent ofthe high season flow (July to September).20 This wouldmean that for an SHP on a tributary with the same qualities,actual minimum flow in lean season will be mandated at3.4 per cent of the high season flow (15 per cent of 22.6 percent). Any computation of minimum flow would also needup-to-date and reliable measurements, something whichhas been difficult to come by so far for many Indian rivers.21
● Uttarakhand: At present, there is no regulation inUttarakhand mandating a certain percentage ofenvironmental flow in the case of small and large hydropower projects for capacities up to 100 MW. It is a generallyshared belief among state authorities that 10 per cent ofthe lean flow should be left at any given point of time inthe natural river stream. However, this is not adhered to dueto technical and financial concerns.
● Karnataka: Although there is no specific mention ofmandating ecological flows in Karnataka, the KarnatakaRenewable Energy Policy 2009-14 says: “The Mini HydroProject proposals which do not involve diversion of thewater flow resulting in drying up the stream/river stretch willbe considered for development.”22
Impacts on riverine fishThe impacts of SHP plants, dams and the drying out of riverbeds on fish in rivers is, to a large extent, unknown. ProfessorRenee Borges from the Indian Institute of Science (IISc),Bengaluru, an expert on Western Ghats ecology states, “I cancount the studies on the fish fauna in the Western Ghats onone hand, and there is only one recent one. We don’t knowwhat is there frankly.”
What is known so far, is that there are 318 species of fishin the rivers of the Western Ghats, of which 136 species are endemic, 55 are endangered and 27 are criticallyendangered. Even more important is the fact that 128species are “data-deficient”,23 which means that the status
of these fishes is unknown. Making it even more apparent that these rivers are
biodiversity hotspots is the fact that new fish species are beingdiscovered on a regular basis; last year, a new species was foundin the Kumaradhara river,24 which has SHP projects indevelopment and operation.25
Another species of fish was found in the Barapole river, onthe Karnataka-Kerala border in 201226 where a new SHPproject was recently stopped because of its impact on theenvironment and due to resistance from the local community.27
In Sita river, near Shimoga, Karnataka, where many new SHPprojects were planned, two new species were found in 2010.28
The team behind some of these discoveries and locals inKarnataka and Kerala say that the knowledge of fish fauna inthe Western Ghats is still limited.29 With very little idea of evenwhich fish species exist, information on their behaviour is evenless exhaustive.30 There is little know-how about how thedifferent species of fish breed and if they migrate. If any of the fish species migrate upstream (or their larvae driftdownstream), any dam such as those built for ROR SHPprojects in the Western Ghats would block off the speciescompletely and potentially kill it. If a species is not migratory,and like many of the newly discovered species exists in a smallstretch of one river, a loss of a km or two of habitat due todrying out of the river as its water is diverted could also spelldoom for the species.
In the Himalaya, large hydro power projects and other damson major rivers have already stopped much of the migration offish species such as the hilsa31. Any new SHP dams anddiversions would have the same effect on local population as inthe Western Ghats. The power plants in the Himalaya also leavethe river bed dry and dams block any migration32. Hilsaexemplifies the fact that the fish in the river are not justimportant for ecological reasons, but also for survival of fisher-communities up and down the river and for food safety.
HOW MUCH IS LOST FROM ECOLOGICALFLOW?
As pointed out by the Himachal Pradesh State ElectricityBoard in a court case (Himachal Pradesh ElectricityRegulatory Commission vs M/s DSL Hydrowatt Limited),the minimum flow requirement has no major impact ongeneration from SHP. The developer was requesting ahigher tariff, arguing, among other things, that theecological flow requirement of 15 per cent (of leanseason flow) cut generation to nearly nil in lean season,forcing a shut down of the plant. The Board, however,looked at the actual generation from the plant asopposed to projected generation. Projected generationwas 0.393 million units (MU) — 0.432 MU for January andFebruary — while actual generation was 0.94 MU and0.92 MU (Financial Year 2009), which means generationwas far above projections. All in all, the ElectricityRegulatory Commission found that the cost of theecological flow regulations was Rs 810.34 lakh over 40years, or 8 paise per unit.
According to the South Asia Network on Dams, Rivers, andPeople (SANDRP), 10.86 million Indians depend on fish frominland fisheries like rivers, tanks, ponds and wetlands forsubsistence and income33. Fishing yields of hilsa, mahseer34,carp and catfish have decreased or collapsed over the last fewdecades.
The yield of fish in the Ganga fell from around 50.3kg/ha/year in the 1960s to 20 kg/ha/year in 1972 to 6.3kg/ha/year in the 1980s35. Fisheries in smaller rivers where damshave been constructed have all shown a decline. However, nospecific reasons have yet been documented for this decline infish yield.
Based on 1997 figures, Indian rivers are estimated to yield0.64 to 1.64 tonnes of fish per km although this may have fallento 0.3 tonnes already. The higher stretches of the river36 supporttraditional artisanal fisherfolk who fish for their ownsubsistence.
Since the dependence on small riverine fisheries is often forsubsistence, the value of these fisheries is not accounted for inthe economy.
It can be roughly estimated that a ROR dam that leaves onekm of river bed dry could mean a loss of 0.3 -1.64 tonnes of fishfor traditional fisherfolk each year. However, in reality, the impactis much greater as dams stop migration and fish may be killed inturbines as well.
Hydro power dams are not the only threat to fisheries in India— pollution, encroachment, irrigation diversions, etc also poseserious threats.
The Report of the Working Group on Fisheries andAquaculture of the 12th Five Year plan acknowledges: “Waterabstraction for irrigation and power generation is perhaps the
biggest reason (for problems of inland fisheries), causingreduced or no flow in the main channel to support fisheries andother riverine fauna and flora37.”
In many countries, fish-ladders are used to let migratory fish(especially salmon type fish that need to go upstream to procreateand spawn) bypass dams by letting them jump up a stair-likestructure, with each ‘step’ designed low to enable fish to passupwards.
The fish-ladder concept is far from universally accepted evenin Europe and North America with critics stating that the laddersoften aren’t designed well enough to be effective. Besides,tropical rivers and fish have their own issues depending onspecies and the hydrology of the river.38
India has a few fish-ladders, one being in the lower Gangabarrage, but its efficacy is so far unclear, especially since thedesigns are based on fish-ladders in temperate zones with adifferent fish-fauna.39 Although officials of the KarnatakaRenewable Energy Development Limited (KREDL) say that all theSHP projects have fish-ladders, none of the projects examinedby a CSE researcher had fish-ladders or any other bypasspossibilities for fish.40 Engineers on site questioned either didnot know what a fish-ladder or fish-way was or claimed thatthere were “very few” fish in the river.41
It is essential to have documented knowledge of theabundance of fish in the rivers to implement a fish-ladder.Also, the migratory pattern and abilities of the fish would firsthave to be known, before a dam and diversion are built. Atpresent, there is little knowledge of these things. Of course,for any fish-ladder/fish-way to work, there also needs to beenvironmental flow in the river between the dam and the tail-race.
8 GREEN NORMS FOR GREEN ENERGY: SMALL HYDRO POWER
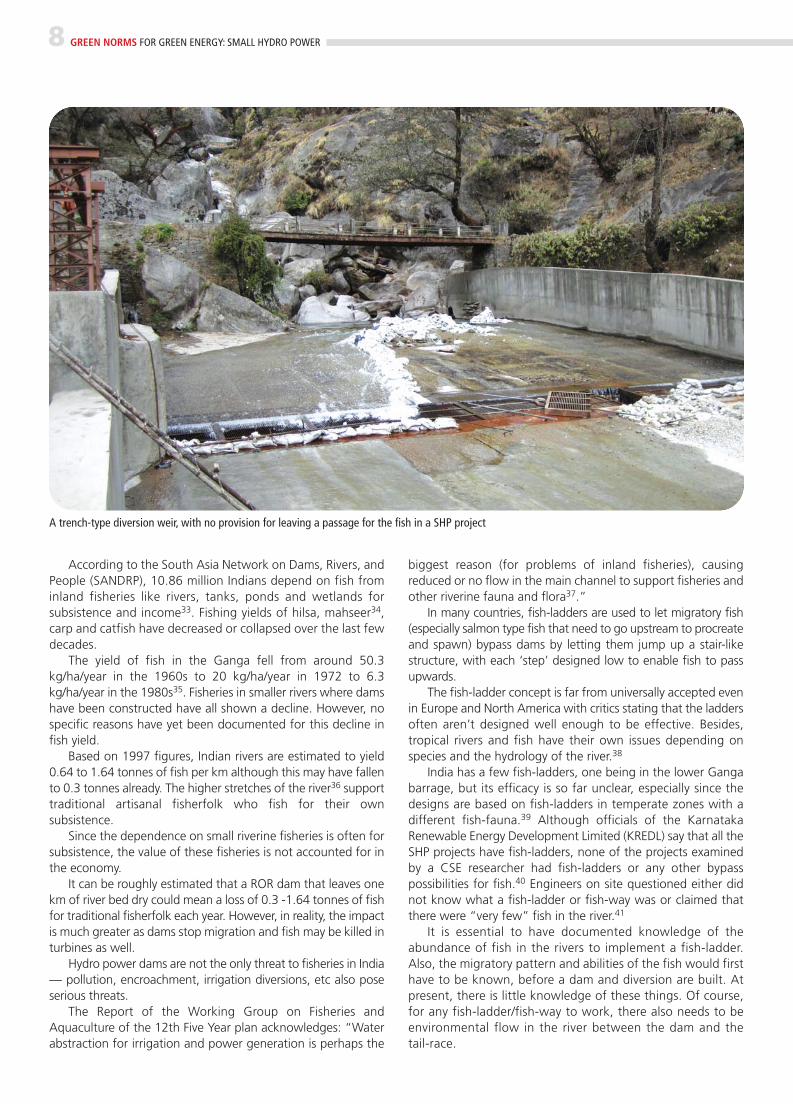
A trench-type diversion weir, with no provision for leaving a passage for the fish in a SHP project
SHP in Karnataka is governed by the policy on renewable energyreleased in 2009 (applicable for the period 2009-2014). Thepolicy includes the following key aspects with regard to SHPproject development: ● It is targeted to have 600 MW of SHP projects during the
policy period.● The responsibility of identifying potential sites for SHP
development lies with KREDL on Public Private Partnership(PPP) / Build Operate Own Transfer (BOOT) mode.
● Mini hydro projects in the Western Ghats will be restrictedto a maximum of 5 MW (preferably ROR projects).
● A single window clearance mechanism is available forfacilitating expeditious commissioning of the targeted hydroprojects.
● KREDL will identify the pico hydel projects (less than 10 kW)in a fast track mode. The central financial assistance of 90per cent of the project cost, provided by MNRE, will bepassed on to the eligible beneficiaries speedily.The power generated through SHP projects in Karnataka
accounted for roughly 4.4 per cent of the total energygeneration in the year 2011-12. This is considering the totalenergy generation of 53,595 million units (MU)42 with SHPcontributing around 2,365 MU43.
Case study
Kempehole and Nethravati riversKempehole river is a major tributary of the Nethravati, a west-flowing river in the Shiradi Ghats in the southern part of theKarnataka section of the Western Ghats. The two rivers runthrough thick evergreen forests (where elephants, leopards, lion-tailed macaques and many other species roam), plantations andfarmlands.
Since 2002, multiple SHP projects have been constructed onthe Kempehole and other tributaries of the Nethravati: over 44projects are currently under development on them.44 Theseprojects are, in some cases, being implemented back-to-backwith one project starting just where the last one left off.
In the case of Paschim Hydro Energy project (9 MW), thetail-race flows directly into the reservoir of the InternationalPower Corporation Limited’s (IPCL) Kempehole project (18 MW).A second tributary joining Kempehole, not more than 1.5 kmdownstream of the IPCL project, also has a project beingdeveloped on it, the Nagarjuna Hydro Energy Project (15 MW).
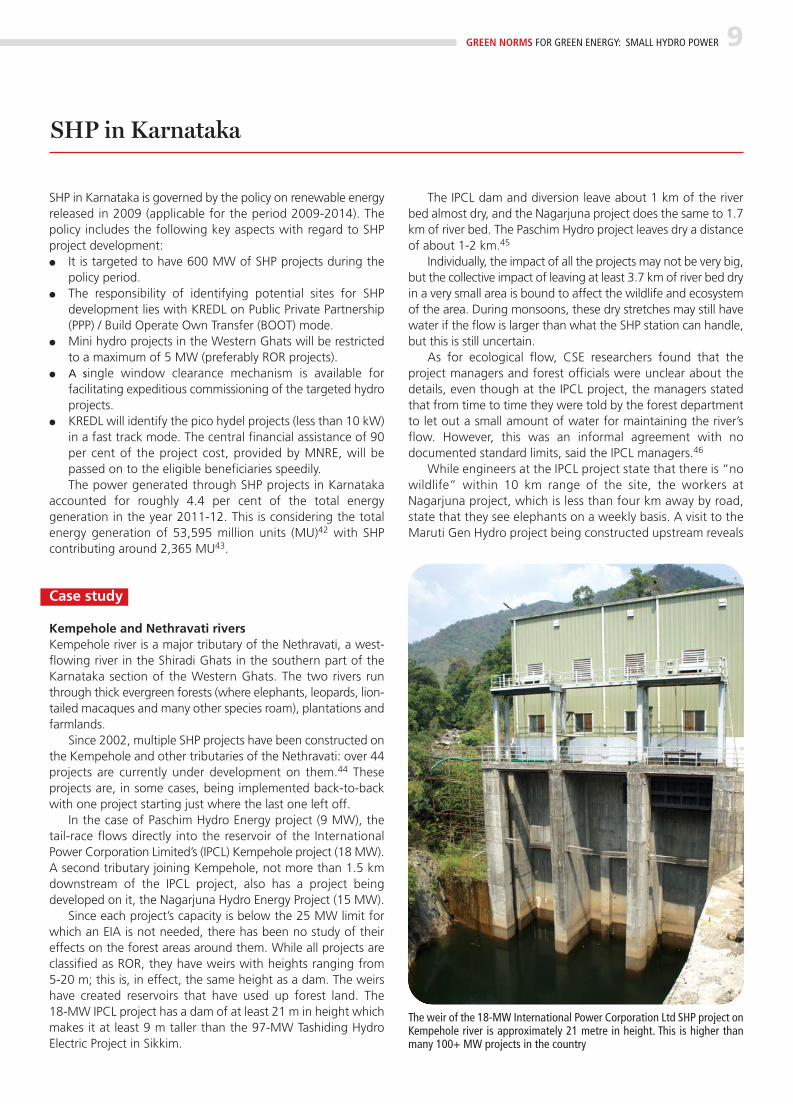
Since each project’s capacity is below the 25 MW limit forwhich an EIA is not needed, there has been no study of theireffects on the forest areas around them. While all projects areclassified as ROR, they have weirs with heights ranging from 5-20 m; this is, in effect, the same height as a dam. The weirshave created reservoirs that have used up forest land. The 18-MW IPCL project has a dam of at least 21 m in height whichmakes it at least 9 m taller than the 97-MW Tashiding HydroElectric Project in Sikkim.
The IPCL dam and diversion leave about 1 km of the riverbed almost dry, and the Nagarjuna project does the same to 1.7km of river bed. The Paschim Hydro project leaves dry a distanceof about 1-2 km.45
Individually, the impact of all the projects may not be very big,but the collective impact of leaving at least 3.7 km of river bed dryin a very small area is bound to affect the wildlife and ecosystemof the area. During monsoons, these dry stretches may still havewater if the flow is larger than what the SHP station can handle,but this is still uncertain.
As for ecological flow, CSE researchers found that theproject managers and forest officials were unclear about thedetails, even though at the IPCL project, the managers statedthat from time to time they were told by the forest departmentto let out a small amount of water for maintaining the river’sflow. However, this was an informal agreement with nodocumented standard limits, said the IPCL managers.46
While engineers at the IPCL project state that there is “nowildlife” within 10 km range of the site, the workers atNagarjuna project, which is less than four km away by road,state that they see elephants on a weekly basis. A visit to theMaruti Gen Hydro project being constructed upstream reveals
GREEN NORMS FOR GREEN ENERGY: SMALL HYDRO POWER 9
The weir of the 18-MW International Power Corporation Ltd SHP project onKempehole river is approximately 21 metre in height. This is higher thanmany 100+ MW projects in the country
SHP in Karnataka
fresh elephant dung as well as leopard tracks. Locals as wellas academics report an increase in human-elephant conflictsin the area.47 This has been attributed, in part, to the smallhydro plant as well as to the linear projects located in theforest, such as power lines and roads. Some of the roads inthe area used by the SHP projects are already existing couperoads (roads used for logging mature trees). These roads weredeveloped by the forest department; they are made up ofgravel and mud. The traffic on them has increased due to theprojects, scaring away the wildlife.
It must be mentioned here that the extent of the impacts ofthe SHP plants on the forest remains unclear, since the forestarea is also experiencing encroachment by farmers and fromother projects.48
State actionThe Karnataka state government has now banned SHP projectsin the forest areas in the Western Ghats; the same order,incidentally, also bans wind power from these forests.49 TheKarnataka High Court has also halted SHP projects in theWestern Ghats due to an ongoing Public Interest Litigation (PIL).Unusually so, activists as well as developers seem unaware ofthe state government’s ban, though they know about the HighCourt’s temporary stay order.50
The damage has already been done; the plants, tunnels anddams which are already constructed will remain, and the riverbeds will remain dry for long stretches. A hydro power dam
once built can be functional for up to 60 years; even after thisperiod, dams can be refurbished and refitted to last indefinitely.There does not seem to be any movement towards taking downthe plants and rehabilitating the forests.
Although SHP projects in the forests surroundingKempehole have been suspended because of the order,another project on the same river remains under development.This is the Gundia Hydel Project, with a capacity of 200 MWand an inundation area much larger than any of the SHPprojects (400 ha of forest area).51 The project is awaitingenvironmental clearance. The Gundia project is expected tochange the ecological flow of the rivers and may make the SHPprojects on Kempehole and other tributaries of Nethravatiredundant. Complicating the situation further is a huge projectto use garland canals and tunnels in the hills to divert part of theNethravati flow eastwards for drinking and irrigationpurposes.52 This would affect both the Gundia and the SHPprojects.
Of course, SHP plants do generate power and Karnataka isa power-starved state. The 9-MW Paschim Hydro Energyproject produced 25,307 MWh in 2012, with a 32 per centcapacity utilization factor. The 18-MW IPCL Kempehole projectproduced 46,119 MWh or 29 per cent of its total capacity. Thestate’s per capita consumption of electricity is estimated to be873 KWh per annum.53 A rough calculation reveals that thesetwo projects produce enough power for 80,000 people in thestate.54
10 GREEN NORMS FOR GREEN ENERGY: SMALL HYDRO POWER
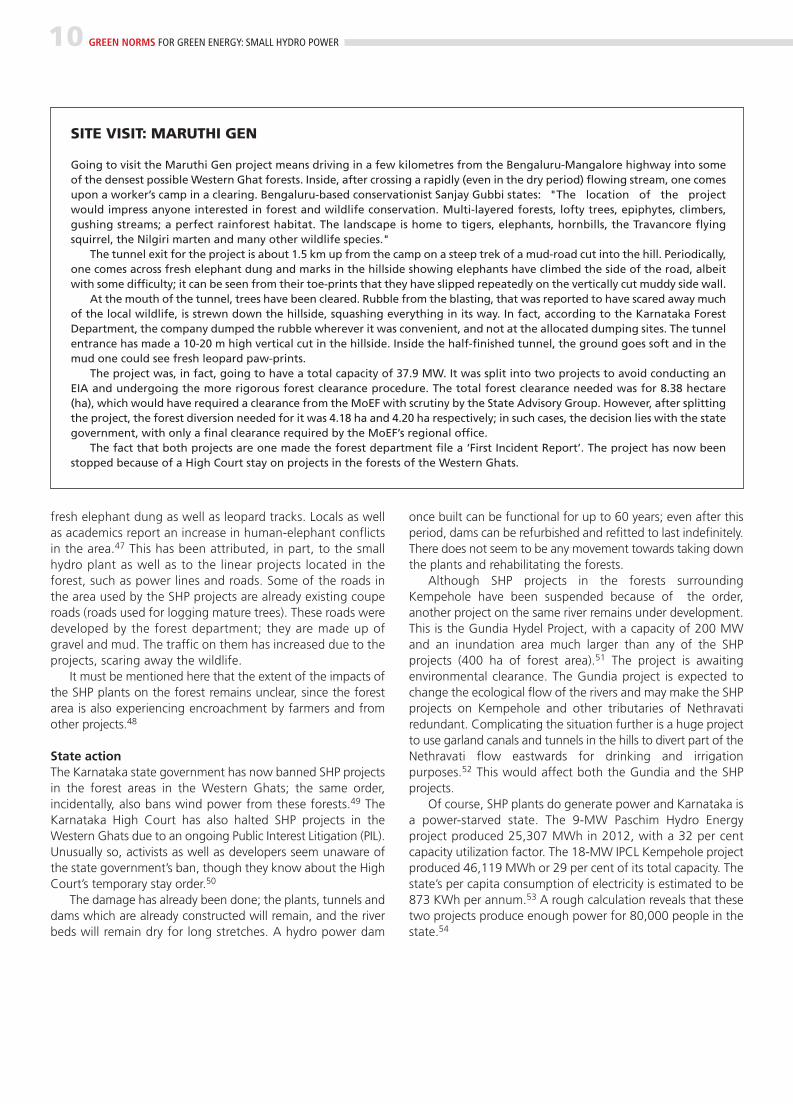
SITE VISIT: MARUTHI GEN
Going to visit the Maruthi Gen project means driving in a few kilometres from the Bengaluru-Mangalore highway into someof the densest possible Western Ghat forests. Inside, after crossing a rapidly (even in the dry period) flowing stream, one comesupon a worker’s camp in a clearing. Bengaluru-based conservationist Sanjay Gubbi states: "The location of the projectwould impress anyone interested in forest and wildlife conservation. Multi-layered forests, lofty trees, epiphytes, climbers,gushing streams; a perfect rainforest habitat. The landscape is home to tigers, elephants, hornbills, the Travancore flyingsquirrel, the Nilgiri marten and many other wildlife species."
The tunnel exit for the project is about 1.5 km up from the camp on a steep trek of a mud-road cut into the hill. Periodically,one comes across fresh elephant dung and marks in the hillside showing elephants have climbed the side of the road, albeitwith some difficulty; it can be seen from their toe-prints that they have slipped repeatedly on the vertically cut muddy side wall.
At the mouth of the tunnel, trees have been cleared. Rubble from the blasting, that was reported to have scared away muchof the local wildlife, is strewn down the hillside, squashing everything in its way. In fact, according to the Karnataka ForestDepartment, the company dumped the rubble wherever it was convenient, and not at the allocated dumping sites. The tunnelentrance has made a 10-20 m high vertical cut in the hillside. Inside the half-finished tunnel, the ground goes soft and in themud one could see fresh leopard paw-prints.
The project was, in fact, going to have a total capacity of 37.9 MW. It was split into two projects to avoid conducting anEIA and undergoing the more rigorous forest clearance procedure. The total forest clearance needed was for 8.38 hectare(ha), which would have required a clearance from the MoEF with scrutiny by the State Advisory Group. However, after splittingthe project, the forest diversion needed for it was 4.18 ha and 4.20 ha respectively; in such cases, the decision lies with the stategovernment, with only a final clearance required by the MoEF’s regional office.
The fact that both projects are one made the forest department file a ‘First Incident Report’. The project has now beenstopped because of a High Court stay on projects in the forests of the Western Ghats.
Uttarakhand has an estimated SHP potential of 1,700 MW. Theinstalled SHP projects are worth 170 MW, which is around 5 percent of the nation’s total installed capacity of 3,496 MW. Theprojects under construction are approximately 14 per cent ofthe 1,250 MW being built nationally.55
The government of Uttarakhand, through its 2008renewable energy policy, aims at harnessing 600 MW of hydropower potential through SHP by 2020.56 The state wants toharness this potential through private/public/communityparticipation. For this, the Uttarakhand policy provides thefollowing incentives to private developers:● Single window clearances in a time-bound manner.● The electricity produced shall be purchased by the
Uttarakhand Power Corporation Limited (UPCL), which willhave the first right to purchase. The state government willprovide a guarantee for the payments to be made by UPCLfor such purchases.
● Evacuating infrastructure shall be provided by the UPCL orthe Power Transmission Corporation of Uttarakhand Limited(PTCUL) to the developer project site.
● SHP projects are exempted from paying any royalty for thefirst 15 years beyond which there is an applicability of 18per cent royalty towards usage of water resources.The high potential supplemented by favourable policy
instruments and high rate of returns (see Annexure 1) hasresulted in the growth of SHP in Uttarakhand. However, thestate’s policy fails to mention anything about EIA requirementsor regulations; also, there is no rehabilitation and resettlement(R&R) policy for plants with a capacity up to 100 MW.
Case study
CAG report: SHP impacts in Uttarakhand One of very few large-scale studies on the impact of hydropower in India that also looks specifically at the impacts of SHPwas carried out by the Comptroller and Auditor General of India(CAG) in 2008-09. The report, titled Performance Audit ofHydropower Development through Private Sector Participation,Uttarakhand57, studied five operational plants, six that were
under progress and three in their initial stages of development. Ofthe five projects which were operational, four were SHP plants(see Table 10: Power plants audited by CAG).
CAG identified three major issues pertaining to SHP development in Uttarakhand:● Non-maintenance/applicability of downstream flow and
consequent ecological impacts● Muck generation and its use and disposal plans● Non-adherence to plantation and/or afforestation plans by
roughly 38 per cent of the projects and the resultingdamage to local ecology
Inadequate downstream flow Almost all the SHP projects in Uttarakhand are ROR type,implying that there is no reservoir creation. Instead, the wateris diverted for a certain distance using diversion weirs throughtunnels or open channels.
This diversion is necessary for creating a head. The head isdependent on the geographical location of the power plant.Hence the distance between the diversion weirs to thepowerhouse varies depending on the geographical location.The longer the distance, the greater is the extent to which thenatural river course is diverted and hence, the more significantthe impact on the riverine ecosystem.
To reduce this impact, ecologists and biologists across theworld suggest leaving a certain quantity of the natural flow inthe original course of the river. However, quantificationbecomes difficult in the absence of an acceptable definition ofecological needs. While domestic and agricultural requirementscan be easily quantified, it is difficult to decide what compriseslegitimate ecological needs.58
The water quality is also impacted by improper muckdisposal — rubble and muck is released in huge quantitiesbased on the tunnelling length and the construction of otherinfrastructure such as roads. The assorted waste going into theriver channel contributes to the turbidity of the water and leadsto deterioration in water quality.
The impacts on human environment include reduced orintermittent supply of drinking and irrigation water. Further, forthe projects which have pondage, sediment from the upper
GREEN NORMS FOR GREEN ENERGY: SMALL HYDRO POWER 11
TABLE 10 Power plants audited by CAG
Name of project Capacity (MW) District River/tributary Developer Date of commissioning
Rajwakti 4.4 Chamoli Nandakini Himurja April 2002
Debal 5 Chamoli Kailganga Chamoli Hydro Power Pvt Ltd, 2007Hyderabad
Hanuman Ganga 4.95 Uttarkashi Hanuman Ganga Nallah APH Regency Power Group April 2005
Loharket 4.8 Bageshwar Sarju, tributary of Kailganga Parvatiya Power Ltd, under Sarda February 2008Energy and Minerals
Source: Performance Audit of Hydropower Development through Private Sector Participation, Uttarakhand for the year 2008-09, Comptroller and Auditor General of India.
SHP in Uttarakhand
reaches of the Himalaya gets trapped in the silt, thus deprivingit of critical sediment in the alluvial planes.
In its audit report, CAG noted: “The physical verification(during May 2009 to July 2009) at the project sites of all the fouroperational projects, falling in the audit sample, showed thatriver beds downstream had almost completely dried up and thewater flow was down to a trickle and extremely inadequate forthe sustenance of ecology and nearby groundwater aquifers.”59
Based on ground interaction with villagers, CAG made thefollowing observations on the four projects:● Debal hydro power: Villagers informed the CAG about the
depletion in natural water resources used for both irrigationand drinking, after the establishment and operation of theproject. The depletion was evident in 4 km of the river stretchfrom where the water has been diverted through the tunnel.The inhabitants of Kail village reported that they and theirlivestock were vulnerable to attacks by wild animals fromthe neighbouring forest. This was a result of the drying upof the river stretch which used to act as a boundary betweenthe village and the forest.
● Rajwakti hydro project: The lift irrigation system built for thepurpose of providing water for irrigation was defunct due tothe diversion of the river. There were around 60 affectedresident families in the villages of Tefina and Gwalla.
● Loharkhet and Hanuman Ganga: Due to the trench typediversion weir, during the lean season, the downstream flowceases completely.In order to ascertain the impacts of curtailing downstream
flow, the CAG calculated that the average diversion of RORprojects was 4.16 km for both small and large projects (seeTable 11: Comparison of diversion reaches for small and largehydro power plants).
Muck disposalThe MoEF clearance condition states that muck generated fromexcavation in the course of construction activity must bedisposed of in a planned manner so that it takes less space, isnot hazardous to the environment and does not contaminate
12 GREEN NORMS FOR GREEN ENERGY: SMALL HYDRO POWER
TABLE 11 Comparison of diversion reaches forsmall and large hydro power plants
Name of the project Capacity (MW) Diversion reach* (in km)
Small hydro power
Rajwakti 4.4 2.56
Debal 5 3.79
Hanuman Ganga 4.95 1.86
Loharket 4.8 2.67
Bhyunder Ganga 24.3 4.42
Birahi Ganga-II 24 3.29
Bhilangana-III 24 4.77
Large hydro power
Srinagar 330 4.72
Alaknanda 300 5.8
Note: * The diversion reach has been calculated by summing up the lengths of intake,desiliting tank, penstock and tail-race. This gives a conservative estimation of thediversion length; the actual diversion can be even larger due to topography.Source: Performance Audit of Hydropower Development through Private SectorParticipation, Uttarakhand for the year 2008-09, Comptroller and Auditor General ofIndia
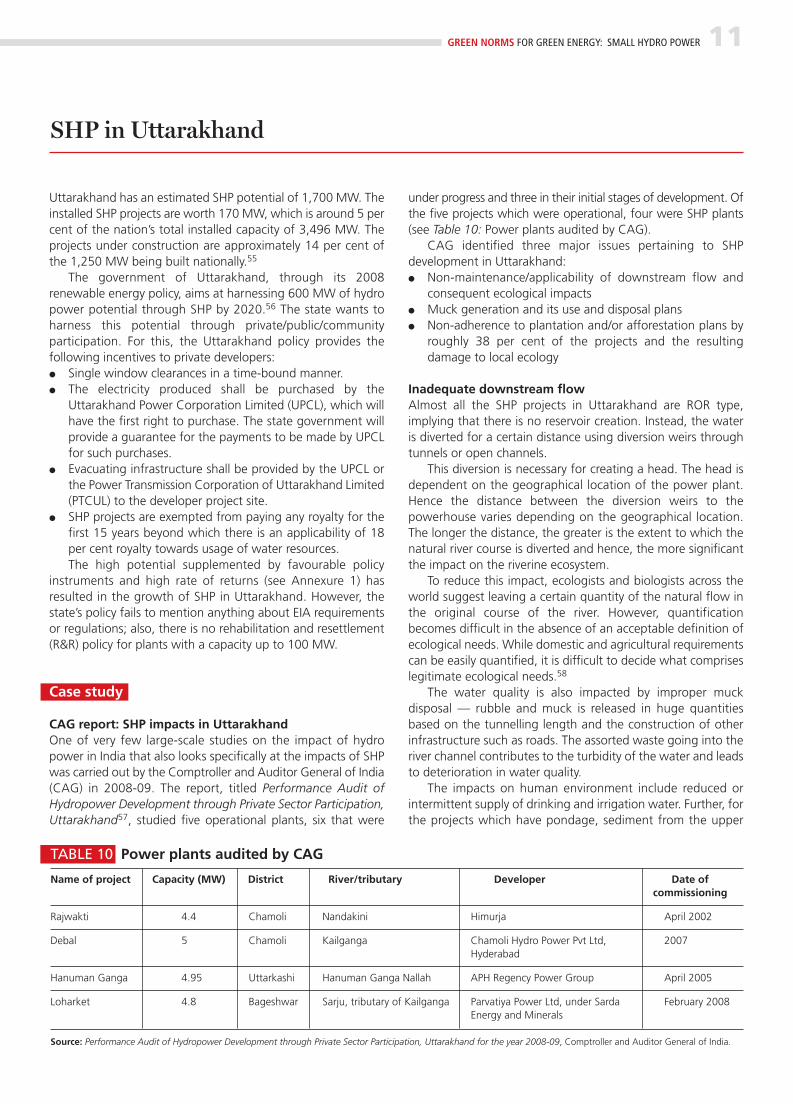
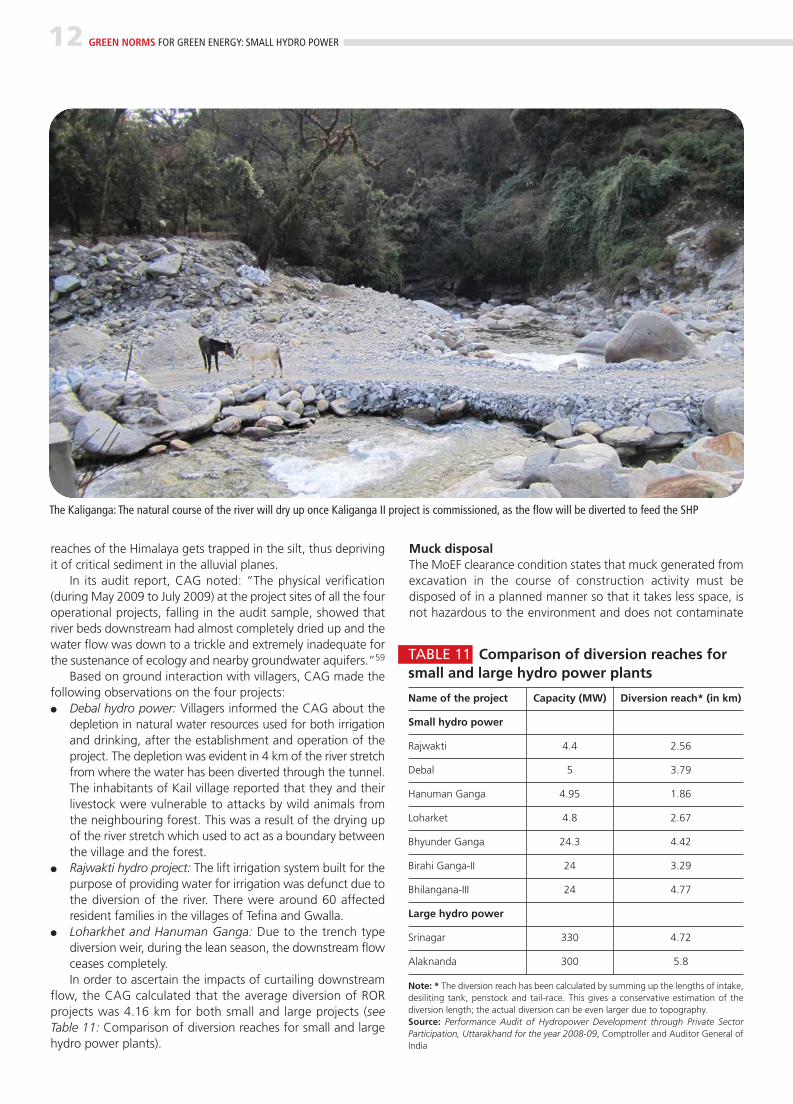
The Kaliganga: The natural course of the river will dry up once Kaliganga II project is commissioned, as the flow will be diverted to feed the SHP
any land or water source60. With specific reference to hillyregions, muck disposal should be carried out in such a way that usable terraces can be developed with suitable retaining walls.The terrace in due course of time shall be covered with fertilesoil and suitable plants.
However, proper muck disposal is not being done by mostdevelopers. In fact, it seems to be an accepted practice that themuck will get eroded with rainwater during the monsoonseason.
The CAG report has identified the following issues that resultfrom improper muck disposal:● Increase in turbidity of river water ● Shrinkage of the river catchment area● Impact on aquatic biota
It found the following non-compliance on muck disposal:● Debal project: According to MoEF regulations, the muck
disposal site should have been developed by makingterraces, covering them with fertile soil and doing suitableplantation. This has not been implemented even though theproject has been operational since 2007.
● Rajwakti project: The muck generated during theconstruction of the project must have been dumped in theNandakini river as there is no muck disposal site which theproject proponent could show to CAG auditors.
● Agunda Thati project: This project lacked a proper muckdisposal process. This is evident from the fact that there wasno protection wall constructed for protecting the powerchannel, which could have stopped the muck from beingdisposed off in the Balganga river. These cases clearly reflect the need for proper planning,
implementation and management of muck disposal. This is veryessential to protect the locations from soil erosion, encourageafforestation, and to ensure proper utilisation of muck during theconstruction of roads, check dams and slope maintenance. Thereneeds to be a monitoring mechanism penalising the projectproponents for not adhering to the laid out regulatory framework.
Impact on terrestrial ecosystem One of the relative advantages that ROR small hydro powerprojects have over large hydro (with storage) or large ROR withsmall pondage, is that they do not involve submergence of hugeareas. This in turn avoids a large number of issues such aschanges in landscape, rehabilitation and resettlement of projectaffected people, soil erosion, groundwater recharge, waterquality, sediment transportation resulting from submergence ofvast tracts of land and massive deforestation activities.
However, deforestation still takes place due to theconstruction of project facilities like power houses, head-race,tail-race, transmission lines and access roads to the project site.The significant concerns due to deforestation observed by theCAG audit included increased soil erosion, disruption of localflora and fauna and disturbance of hill slopes.
CAG auditors also noticed that out of the four SHP projects,two, Loharket and Debal, reported zero achievement withregard to afforestation while Rajwakti reported 50 per centachievement; Hanuman Ganga was the only project adhering tothe afforestation requirement. However, the survival ratio wasnot made available to the CAG auditor by the forest officials.
Case study
The IMG reportThe MoEF has constituted a inter-ministerial group (IMG) to lookinto the issues related to hydro power plants and ecologicalflows on the Ganga. In its report titled Report of the Inter-Ministerial Group on issues relating to River Ganga, dated April2013, the IMG has taken note of the fact that hydro powerdevelopment exerts an impact on environment, ecology (bothterrestrial and aquatic), and economic and social life. Presently,70 hydro power projects with a capacity of 9,580.3 MW havebeen proposed on the Bhagirathi and Alaknanda basins — thetwo main tributaries of the Ganga in Uttarakhand. Theseinclude 17 operational projects with a capacity of 2,295.2 MW,26 projects with a capacity of 3,261.3 MW which are underconstruction and 27 projects under development (includingprojects under scientifc investigation or at the project feasibilityreport stage) having a capacity of 4,023.8 MW.61
Environmental flow regulationThe IMG looked at the issue of hydro power and ecological flow(e-flow) and concluded that the e-flow regime must be basedon two key parameters:● An important component of the e-flow regime has to be
the mimicking of the river flow to keep it very close to thenatural flow. The requirements must reflect, in addition toecological and environmental needs of the river, the requirements of the community for societal, cultural and religious purposes and the energy needs. Thisconsideration is important especially during the winterseason when the availability of water gets reduced sharply.
● There is a need to have an e-flow policy regime which iseffectively implementable by different hydro projects. Anessential ingredient of such a policy is simplified e-flownorms with minimum variations during the year.
Based on the above two criteria, the IMGrecommended e-flows (for the hydro power projects on
GREEN NORMS FOR GREEN ENERGY: SMALL HYDRO POWER 13
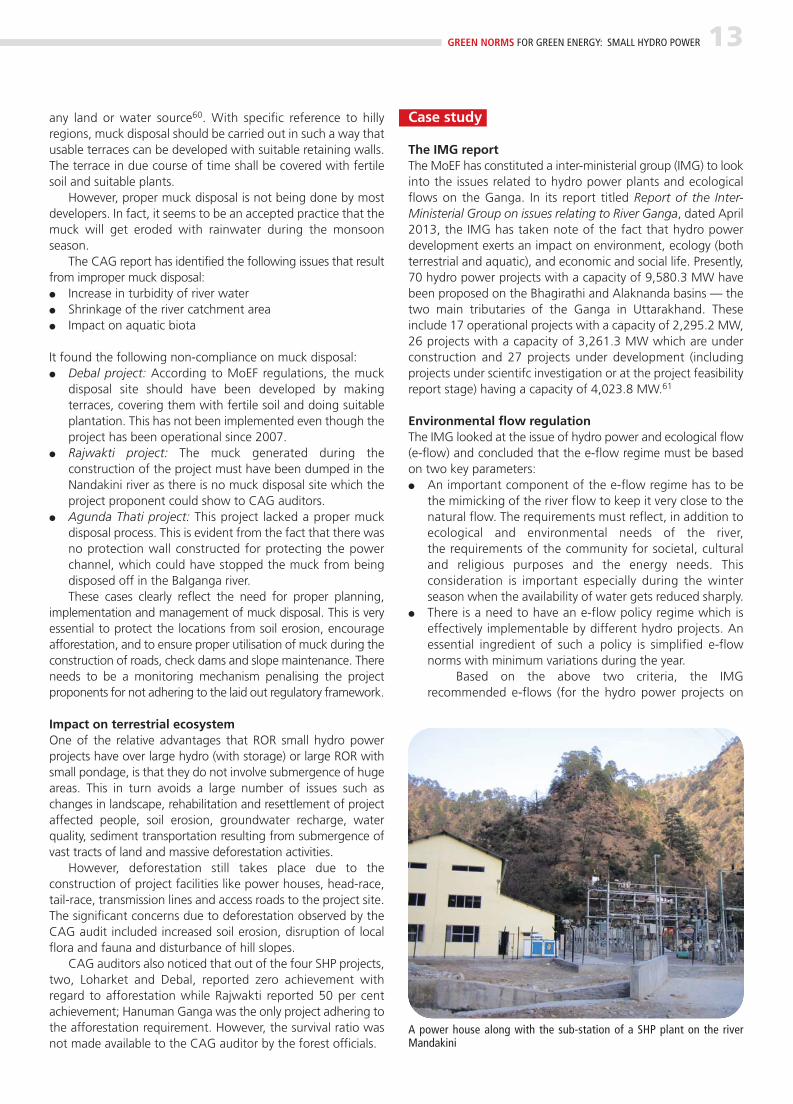
A power house along with the sub-station of a SHP plant on the riverMandakini
14 GREEN NORMS FOR GREEN ENERGY: SMALL HYDRO POWER
Bhila
ngan
a–III
Bhila
ngan
a–II
A
Bhila
ngan
a–II
B
Bhila
ngan
a–II
C
Bhila
ngan
a
Vana
la
Deva
l
Com
mis
sion
ed h
ydro
pow
er p
roje
cts
Und
er c
onst
ruct
ion
hydr
opow
er p
roje
cts
Tow
n
Lege
nds
MAP 1 Hydro power projects in the Alaknanda and Bhagirathi river basins
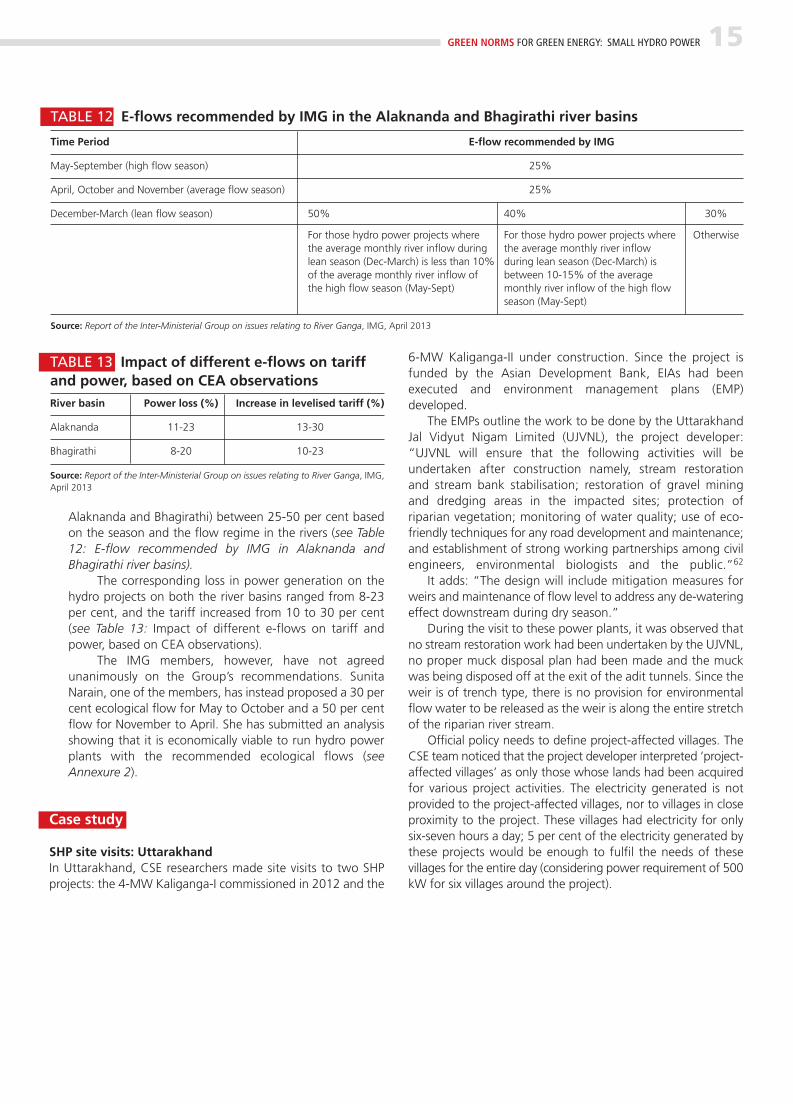
Alaknanda and Bhagirathi) between 25-50 per cent basedon the season and the flow regime in the rivers (see Table12: E-flow recommended by IMG in Alaknanda andBhagirathi river basins).
The corresponding loss in power generation on thehydro projects on both the river basins ranged from 8-23per cent, and the tariff increased from 10 to 30 per cent(see Table 13: Impact of different e-flows on tariff andpower, based on CEA observations).
The IMG members, however, have not agreedunanimously on the Group’s recommendations. SunitaNarain, one of the members, has instead proposed a 30 percent ecological flow for May to October and a 50 per centflow for November to April. She has submitted an analysisshowing that it is economically viable to run hydro powerplants with the recommended ecological flows (seeAnnexure 2).
Case study
SHP site visits: UttarakhandIn Uttarakhand, CSE researchers made site visits to two SHPprojects: the 4-MW Kaliganga-I commissioned in 2012 and the
6-MW Kaliganga-II under construction. Since the project isfunded by the Asian Development Bank, EIAs had beenexecuted and environment management plans (EMP)developed.
The EMPs outline the work to be done by the UttarakhandJal Vidyut Nigam Limited (UJVNL), the project developer:“UJVNL will ensure that the following activities will beundertaken after construction namely, stream restoration and stream bank stabilisation; restoration of gravel mining and dredging areas in the impacted sites; protection of riparian vegetation; monitoring of water quality; use of eco-friendly techniques for any road development and maintenance;and establishment of strong working partnerships among civilengineers, environmental biologists and the public.”62
It adds: “The design will include mitigation measures forweirs and maintenance of flow level to address any de-wateringeffect downstream during dry season.”
During the visit to these power plants, it was observed thatno stream restoration work had been undertaken by the UJVNL,no proper muck disposal plan had been made and the muckwas being disposed off at the exit of the adit tunnels. Since theweir is of trench type, there is no provision for environmentalflow water to be released as the weir is along the entire stretchof the riparian river stream.
Official policy needs to define project-affected villages. TheCSE team noticed that the project developer interpreted ‘project-affected villages’ as only those whose lands had been acquiredfor various project activities. The electricity generated is notprovided to the project-affected villages, nor to villages in closeproximity to the project. These villages had electricity for onlysix-seven hours a day; 5 per cent of the electricity generated bythese projects would be enough to fulfil the needs of thesevillages for the entire day (considering power requirement of 500kW for six villages around the project).
GREEN NORMS FOR GREEN ENERGY: SMALL HYDRO POWER 15
TABLE 12 E-flows recommended by IMG in the Alaknanda and Bhagirathi river basins
Time Period E-flow recommended by IMG
May-September (high flow season) 25%
April, October and November (average flow season) 25%
December-March (lean flow season) 50% 40% 30%
For those hydro power projects where For those hydro power projects where Otherwisethe average monthly river inflow during the average monthly river inflow lean season (Dec-March) is less than 10% during lean season (Dec-March) is of the average monthly river inflow of between 10-15% of the average the high flow season (May-Sept) monthly river inflow of the high flow
season (May-Sept)
Source: Report of the Inter-Ministerial Group on issues relating to River Ganga, IMG, April 2013
TABLE 13 Impact of different e-flows on tariffand power, based on CEA observationsRiver basin Power loss (%) Increase in levelised tariff (%)
Alaknanda 11-23 13-30
Bhagirathi 8-20 10-23
Source: Report of the Inter-Ministerial Group on issues relating to River Ganga, IMG,April 2013
EIA and EC Understanding the consequences of development andforecasting its impact on environment and people is referredto as Environmental Impact Assessment (EIA). The objective ofEIA is to foresee and address potential environmentalproblems/concerns at early stages of project planning anddesign.
According to the EIA notification 2006, a hydro power
plant below 25 MW capacity does not need an EIA. So, allSHP projects in India are being constructed without an EIA.This has led to a situation where some projects are falsifyinginformation to get international funding for clean energy (seeBox: It's easy to lie when you have no EIA requirement). Mostserious is the way large hydro power projects are being splitinto two to avoid EIA regulations (see Box: Two projects onpaper, one on the ground - how to avoid EIA in Karnataka).
16 GREEN NORMS FOR GREEN ENERGY: SMALL HYDRO POWER
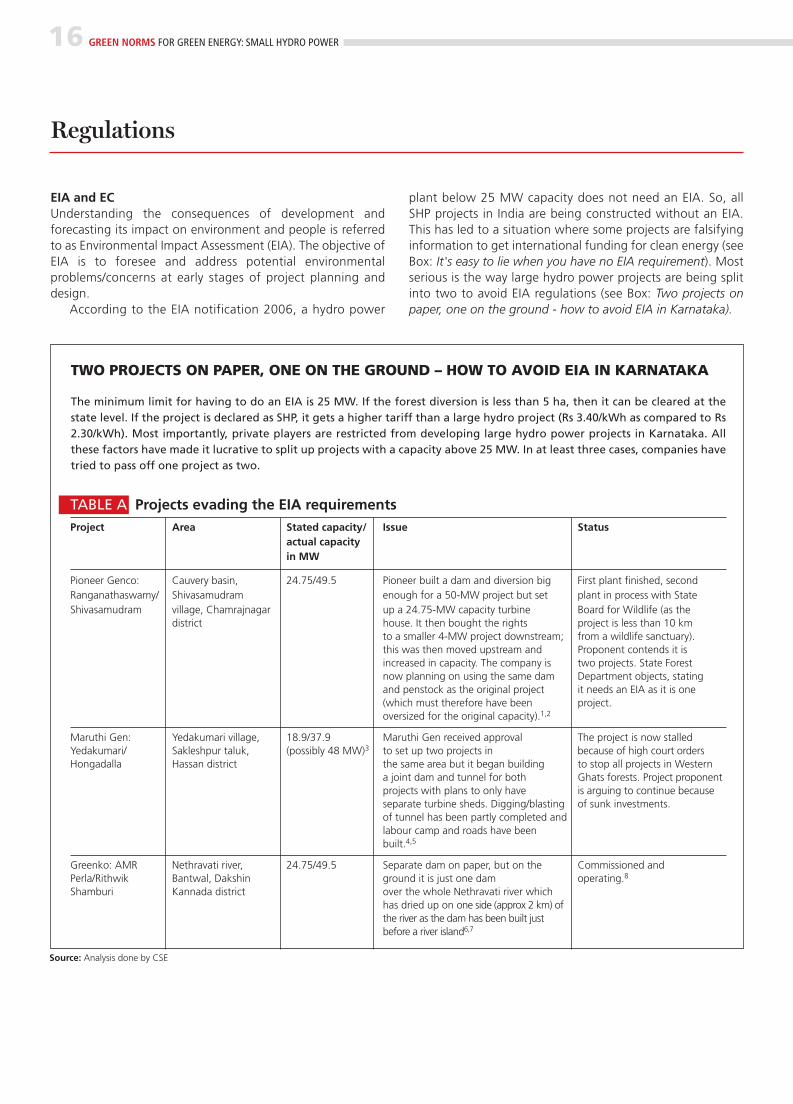
TWO PROJECTS ON PAPER, ONE ON THE GROUND – HOW TO AVOID EIA IN KARNATAKA
The minimum limit for having to do an EIA is 25 MW. If the forest diversion is less than 5 ha, then it can be cleared at thestate level. If the project is declared as SHP, it gets a higher tariff than a large hydro project (Rs 3.40/kWh as compared to Rs2.30/kWh). Most importantly, private players are restricted from developing large hydro power projects in Karnataka. Allthese factors have made it lucrative to split up projects with a capacity above 25 MW. In at least three cases, companies havetried to pass off one project as two.
TABLE A Projects evading the EIA requirements Project Area Stated capacity/ Issue Status
actual capacity in MW
Pioneer Genco: Cauvery basin, 24.75/49.5 Pioneer built a dam and diversion big First plant finished, second Ranganathaswamy/ Shivasamudram enough for a 50-MW project but set plant in process with StateShivasamudram village, Chamrajnagar up a 24.75-MW capacity turbine Board for Wildlife (as the
district house. It then bought the rights project is less than 10 km to a smaller 4-MW project downstream; from a wildlife sanctuary). this was then moved upstream and Proponent contends it is increased in capacity. The company is two projects. State Forest now planning on using the same dam Department objects, statingand penstock as the original project it needs an EIA as it is one(which must therefore have been project.oversized for the original capacity).1,2
Maruthi Gen: Yedakumari village, 18.9/37.9 Maruthi Gen received approval The project is now stalled Yedakumari/ Sakleshpur taluk, (possibly 48 MW)3 to set up two projects in because of high court ordersHongadalla Hassan district the same area but it began building to stop all projects in Western
a joint dam and tunnel for both Ghats forests. Project proponentprojects with plans to only have is arguing to continue because separate turbine sheds. Digging/blasting of sunk investments.of tunnel has been partly completed and labour camp and roads have been built.4,5
Greenko: AMR Nethravati river, 24.75/49.5 Separate dam on paper, but on the Commissioned and Perla/Rithwik Bantwal, Dakshin ground it is just one dam operating.8
Shamburi Kannada district over the whole Nethravati river which has dried up on one side (approx 2 km) of the river as the dam has been built just before a river island6,7
Source: Analysis done by CSE
Regulations
GREEN NORMS FOR GREEN ENERGY: SMALL HYDRO POWER 17
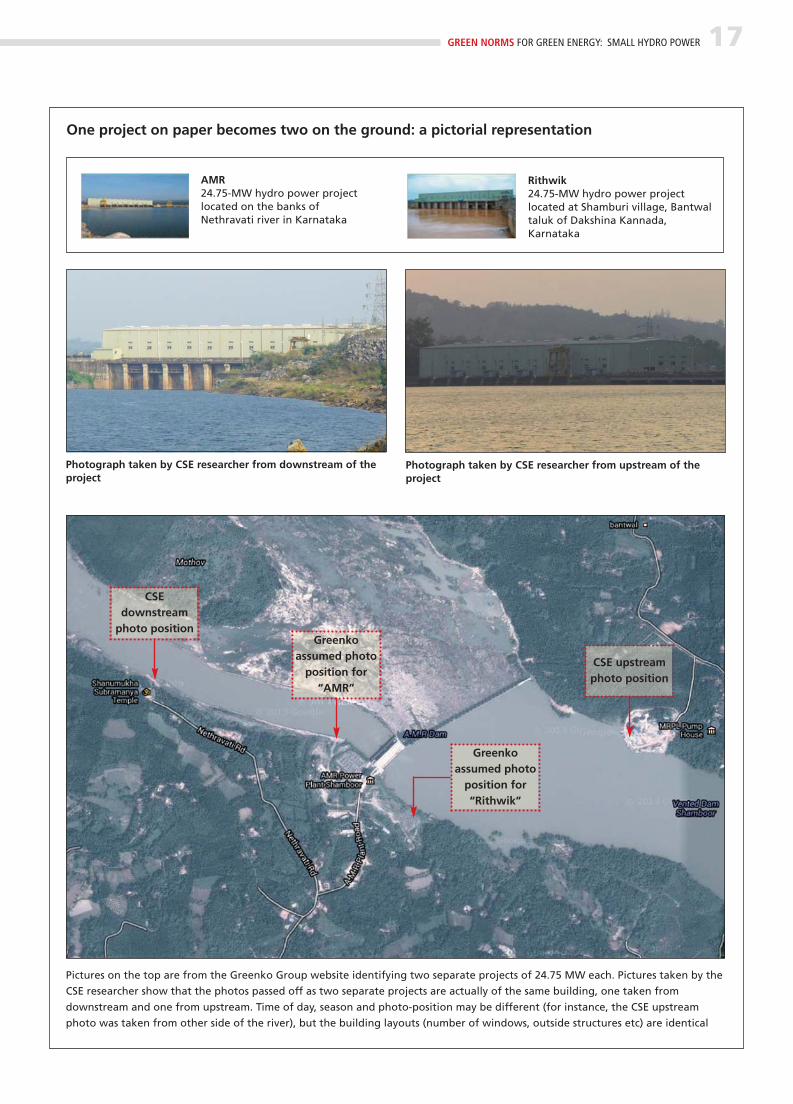
One project on paper becomes two on the ground: a pictorial representation
AMR24.75-MW hydro power projectlocated on the banks ofNethravati river in Karnataka
Rithwik24.75-MW hydro power projectlocated at Shamburi village, Bantwaltaluk of Dakshina Kannada,Karnataka
Photograph taken by CSE researcher from downstream of theproject
Photograph taken by CSE researcher from upstream of theproject
Pictures on the top are from the Greenko Group website identifying two separate projects of 24.75 MW each. Pictures taken by the
CSE researcher show that the photos passed off as two separate projects are actually of the same building, one taken from
downstream and one from upstream. Time of day, season and photo-position may be different (for instance, the CSE upstream
photo was taken from other side of the river), but the building layouts (number of windows, outside structures etc) are identical
CSEdownstream
photo position
CSE upstreamphoto position
Greenkoassumed photo
position for“AMR”
Greenkoassumed photo
position for“Rithwik”
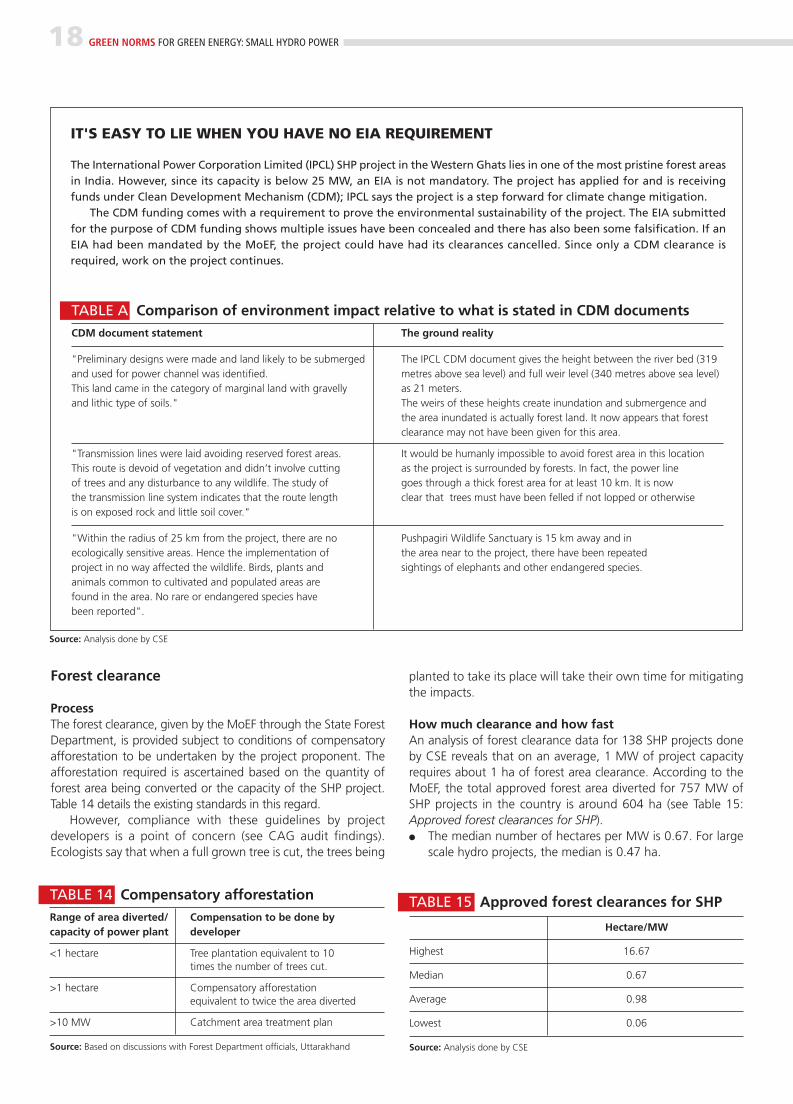
Forest clearance
ProcessThe forest clearance, given by the MoEF through the State ForestDepartment, is provided subject to conditions of compensatoryafforestation to be undertaken by the project proponent. Theafforestation required is ascertained based on the quantity offorest area being converted or the capacity of the SHP project.Table 14 details the existing standards in this regard.
However, compliance with these guidelines by projectdevelopers is a point of concern (see CAG audit findings).Ecologists say that when a full grown tree is cut, the trees being
planted to take its place will take their own time for mitigatingthe impacts.
How much clearance and how fastAn analysis of forest clearance data for 138 SHP projects doneby CSE reveals that on an average, 1 MW of project capacityrequires about 1 ha of forest area clearance. According to theMoEF, the total approved forest area diverted for 757 MW ofSHP projects in the country is around 604 ha (see Table 15:Approved forest clearances for SHP).● The median number of hectares per MW is 0.67. For large
scale hydro projects, the median is 0.47 ha.
18 GREEN NORMS FOR GREEN ENERGY: SMALL HYDRO POWER
TABLE 15 Approved forest clearances for SHP
Hectare/MW
Highest 16.67
Median 0.67
Average 0.98
Lowest 0.06
Source: Analysis done by CSE
TABLE 14 Compensatory afforestationRange of area diverted/ Compensation to be done by capacity of power plant developer
<1 hectare Tree plantation equivalent to 10times the number of trees cut.
>1 hectare Compensatory afforestation equivalent to twice the area diverted
>10 MW Catchment area treatment plan
Source: Based on discussions with Forest Department officials, Uttarakhand
IT'S EASY TO LIE WHEN YOU HAVE NO EIA REQUIREMENT
The International Power Corporation Limited (IPCL) SHP project in the Western Ghats lies in one of the most pristine forest areasin India. However, since its capacity is below 25 MW, an EIA is not mandatory. The project has applied for and is receivingfunds under Clean Development Mechanism (CDM); IPCL says the project is a step forward for climate change mitigation.
The CDM funding comes with a requirement to prove the environmental sustainability of the project. The EIA submittedfor the purpose of CDM funding shows multiple issues have been concealed and there has also been some falsification. If anEIA had been mandated by the MoEF, the project could have had its clearances cancelled. Since only a CDM clearance isrequired, work on the project continues.
TABLE A Comparison of environment impact relative to what is stated in CDM documentsCDM document statement The ground reality
"Preliminary designs were made and land likely to be submerged The IPCL CDM document gives the height between the river bed (319and used for power channel was identified. metres above sea level) and full weir level (340 metres above sea level)This land came in the category of marginal land with gravelly as 21 meters. and lithic type of soils." The weirs of these heights create inundation and submergence and
the area inundated is actually forest land. It now appears that forestclearance may not have been given for this area.
"Transmission lines were laid avoiding reserved forest areas. It would be humanly impossible to avoid forest area in this locationThis route is devoid of vegetation and didn’t involve cutting as the project is surrounded by forests. In fact, the power lineof trees and any disturbance to any wildlife. The study of goes through a thick forest area for at least 10 km. It is nowthe transmission line system indicates that the route length clear that trees must have been felled if not lopped or otherwiseis on exposed rock and little soil cover."
"Within the radius of 25 km from the project, there are no Pushpagiri Wildlife Sanctuary is 15 km away and in ecologically sensitive areas. Hence the implementation of the area near to the project, there have been repeated project in no way affected the wildlife. Birds, plants and sightings of elephants and other endangered species.animals common to cultivated and populated areas are found in the area. No rare or endangered species have been reported".
Source: Analysis done by CSE
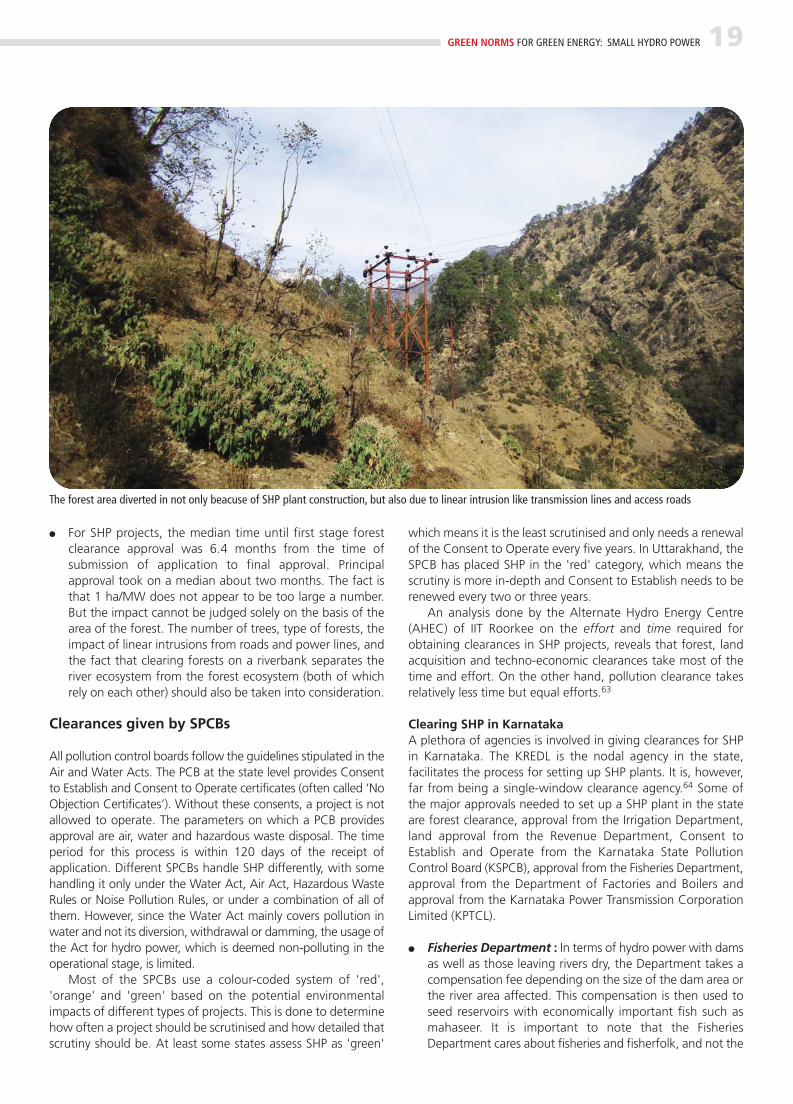
● For SHP projects, the median time until first stage forestclearance approval was 6.4 months from the time ofsubmission of application to final approval. Principalapproval took on a median about two months. The fact isthat 1 ha/MW does not appear to be too large a number.But the impact cannot be judged solely on the basis of thearea of the forest. The number of trees, type of forests, theimpact of linear intrusions from roads and power lines, andthe fact that clearing forests on a riverbank separates theriver ecosystem from the forest ecosystem (both of whichrely on each other) should also be taken into consideration.
Clearances given by SPCBs
All pollution control boards follow the guidelines stipulated in theAir and Water Acts. The PCB at the state level provides Consentto Establish and Consent to Operate certificates (often called ‘NoObjection Certificates’). Without these consents, a project is notallowed to operate. The parameters on which a PCB providesapproval are air, water and hazardous waste disposal. The timeperiod for this process is within 120 days of the receipt ofapplication. Different SPCBs handle SHP differently, with somehandling it only under the Water Act, Air Act, Hazardous WasteRules or Noise Pollution Rules, or under a combination of all ofthem. However, since the Water Act mainly covers pollution inwater and not its diversion, withdrawal or damming, the usage ofthe Act for hydro power, which is deemed non-polluting in theoperational stage, is limited.
Most of the SPCBs use a colour-coded system of 'red','orange' and 'green' based on the potential environmentalimpacts of different types of projects. This is done to determinehow often a project should be scrutinised and how detailed thatscrutiny should be. At least some states assess SHP as 'green'
which means it is the least scrutinised and only needs a renewalof the Consent to Operate every five years. In Uttarakhand, theSPCB has placed SHP in the 'red' category, which means thescrutiny is more in-depth and Consent to Establish needs to berenewed every two or three years.
An analysis done by the Alternate Hydro Energy Centre(AHEC) of IIT Roorkee on the effort and time required forobtaining clearances in SHP projects, reveals that forest, landacquisition and techno-economic clearances take most of thetime and effort. On the other hand, pollution clearance takesrelatively less time but equal efforts.63
Clearing SHP in KarnatakaA plethora of agencies is involved in giving clearances for SHPin Karnataka. The KREDL is the nodal agency in the state,facilitates the process for setting up SHP plants. It is, however,far from being a single-window clearance agency.64 Some ofthe major approvals needed to set up a SHP plant in the stateare forest clearance, approval from the Irrigation Department,land approval from the Revenue Department, Consent toEstablish and Operate from the Karnataka State PollutionControl Board (KSPCB), approval from the Fisheries Department,approval from the Department of Factories and Boilers andapproval from the Karnataka Power Transmission CorporationLimited (KPTCL).
● Fisheries Department : In terms of hydro power with damsas well as those leaving rivers dry, the Department takes acompensation fee depending on the size of the dam area orthe river area affected. This compensation is then used toseed reservoirs with economically important fish such asmahaseer. It is important to note that the FisheriesDepartment cares about fisheries and fisherfolk, and not the
GREEN NORMS FOR GREEN ENERGY: SMALL HYDRO POWER 19
The forest area diverted in not only beacuse of SHP plant construction, but also due to linear intrusion like transmission lines and access roads
20 GREEN NORMS FOR GREEN ENERGY: SMALL HYDRO POWER
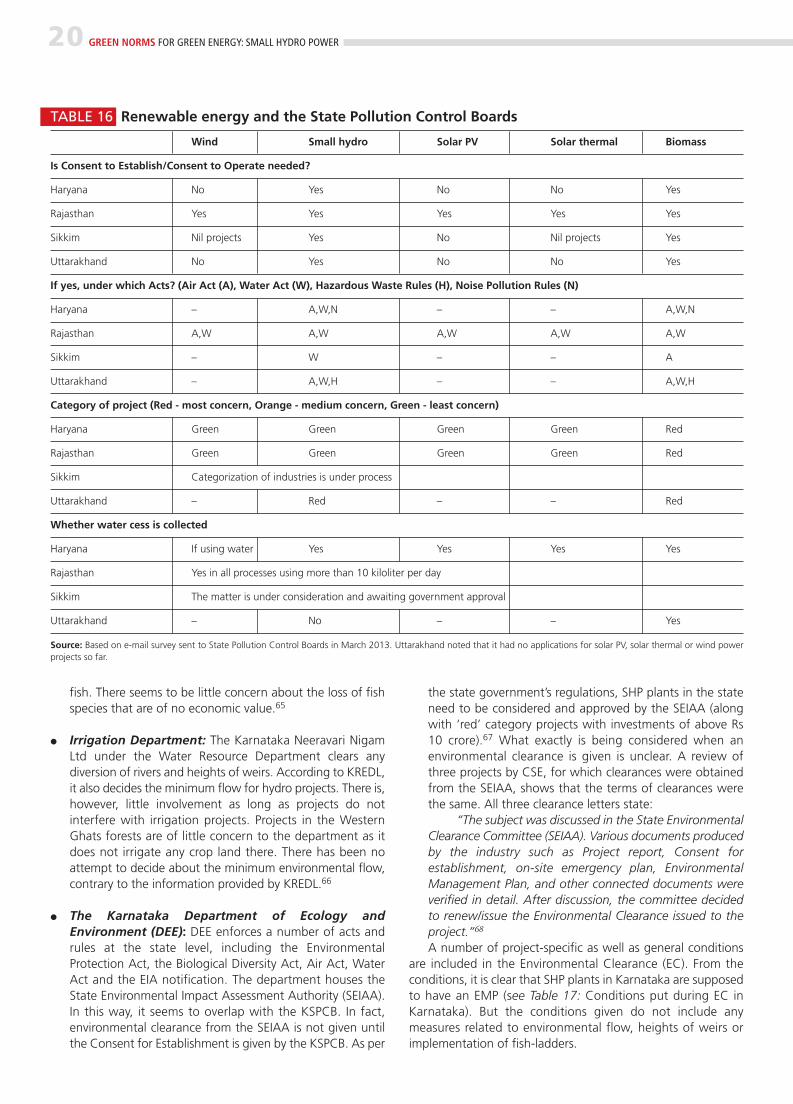
TABLE 16 Renewable energy and the State Pollution Control Boards
Wind Small hydro Solar PV Solar thermal Biomass
Is Consent to Establish/Consent to Operate needed?
Haryana No Yes No No Yes
Rajasthan Yes Yes Yes Yes Yes
Sikkim Nil projects Yes No Nil projects Yes
Uttarakhand No Yes No No Yes
If yes, under which Acts? (Air Act (A), Water Act (W), Hazardous Waste Rules (H), Noise Pollution Rules (N)
Haryana – A,W,N – – A,W,N
Rajasthan A,W A,W A,W A,W A,W
Sikkim – W – – A
Uttarakhand – A,W,H – – A,W,H
Category of project (Red - most concern, Orange - medium concern, Green - least concern)
Haryana Green Green Green Green Red
Rajasthan Green Green Green Green Red
Sikkim Categorization of industries is under process
Uttarakhand – Red – – Red
Whether water cess is collected
Haryana If using water Yes Yes Yes Yes
Rajasthan Yes in all processes using more than 10 kiloliter per day
Sikkim The matter is under consideration and awaiting government approval
Uttarakhand – No – – Yes
Source: Based on e-mail survey sent to State Pollution Control Boards in March 2013. Uttarakhand noted that it had no applications for solar PV, solar thermal or wind powerprojects so far.
fish. There seems to be little concern about the loss of fishspecies that are of no economic value.65
● Irrigation Department: The Karnataka Neeravari NigamLtd under the Water Resource Department clears anydiversion of rivers and heights of weirs. According to KREDL,it also decides the minimum flow for hydro projects. There is,however, little involvement as long as projects do notinterfere with irrigation projects. Projects in the WesternGhats forests are of little concern to the department as itdoes not irrigate any crop land there. There has been noattempt to decide about the minimum environmental flow,contrary to the information provided by KREDL.66
● The Karnataka Department of Ecology and Environment (DEE): DEE enforces a number of acts andrules at the state level, including the EnvironmentalProtection Act, the Biological Diversity Act, Air Act, WaterAct and the EIA notification. The department houses theState Environmental Impact Assessment Authority (SEIAA).In this way, it seems to overlap with the KSPCB. In fact,environmental clearance from the SEIAA is not given untilthe Consent for Establishment is given by the KSPCB. As per
the state government’s regulations, SHP plants in the stateneed to be considered and approved by the SEIAA (alongwith ‘red’ category projects with investments of above Rs10 crore).67 What exactly is being considered when anenvironmental clearance is given is unclear. A review ofthree projects by CSE, for which clearances were obtainedfrom the SEIAA, shows that the terms of clearances werethe same. All three clearance letters state:
“The subject was discussed in the State EnvironmentalClearance Committee (SEIAA). Various documents producedby the industry such as Project report, Consent forestablishment, on-site emergency plan, EnvironmentalManagement Plan, and other connected documents wereverified in detail. After discussion, the committee decidedto renew/issue the Environmental Clearance issued to theproject.”68
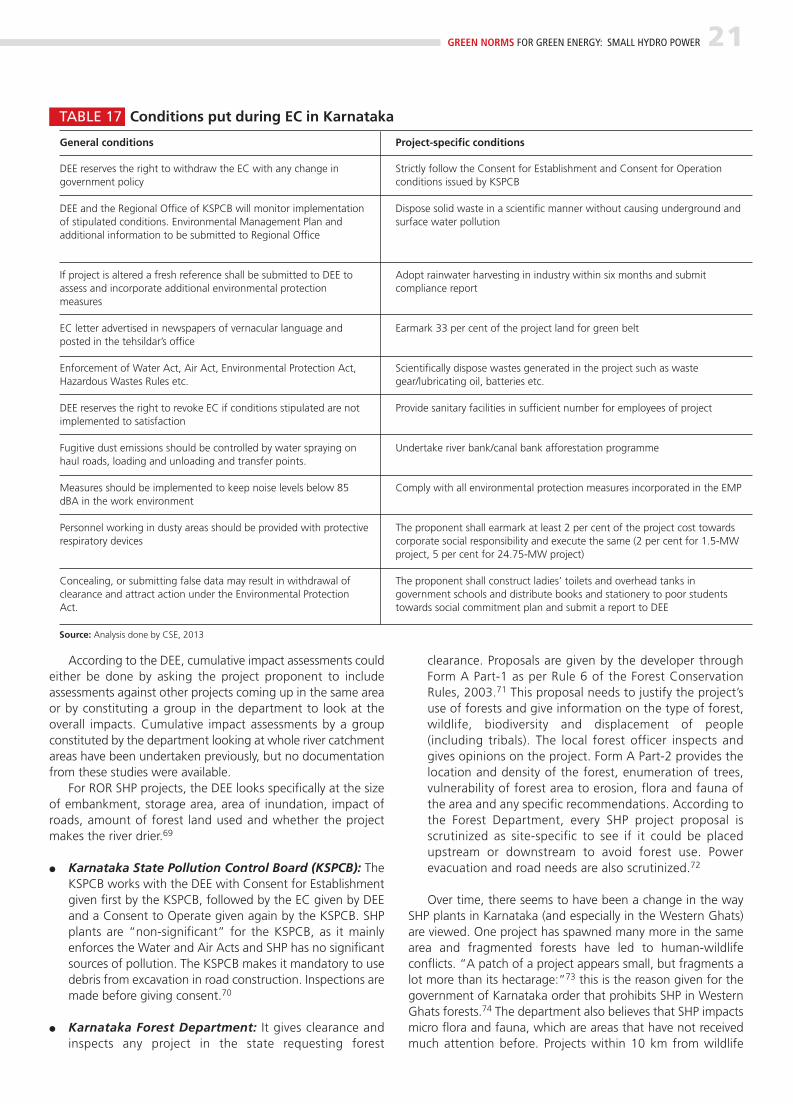
A number of project-specific as well as general conditionsare included in the Environmental Clearance (EC). From theconditions, it is clear that SHP plants in Karnataka are supposedto have an EMP (see Table 17: Conditions put during EC inKarnataka). But the conditions given do not include anymeasures related to environmental flow, heights of weirs orimplementation of fish-ladders.
According to the DEE, cumulative impact assessments couldeither be done by asking the project proponent to includeassessments against other projects coming up in the same areaor by constituting a group in the department to look at theoverall impacts. Cumulative impact assessments by a groupconstituted by the department looking at whole river catchmentareas have been undertaken previously, but no documentationfrom these studies were available.
For ROR SHP projects, the DEE looks specifically at the sizeof embankment, storage area, area of inundation, impact ofroads, amount of forest land used and whether the projectmakes the river drier.69
● Karnataka State Pollution Control Board (KSPCB): TheKSPCB works with the DEE with Consent for Establishmentgiven first by the KSPCB, followed by the EC given by DEEand a Consent to Operate given again by the KSPCB. SHPplants are “non-significant” for the KSPCB, as it mainlyenforces the Water and Air Acts and SHP has no significantsources of pollution. The KSPCB makes it mandatory to usedebris from excavation in road construction. Inspections aremade before giving consent.70
● Karnataka Forest Department: It gives clearance andinspects any project in the state requesting forest
clearance. Proposals are given by the developer throughForm A Part-1 as per Rule 6 of the Forest ConservationRules, 2003.71 This proposal needs to justify the project’suse of forests and give information on the type of forest,wildlife, biodiversity and displacement of people(including tribals). The local forest officer inspects andgives opinions on the project. Form A Part-2 provides thelocation and density of the forest, enumeration of trees,vulnerability of forest area to erosion, flora and fauna ofthe area and any specific recommendations. According tothe Forest Department, every SHP project proposal isscrutinized as site-specific to see if it could be placedupstream or downstream to avoid forest use. Powerevacuation and road needs are also scrutinized.72
Over time, there seems to have been a change in the waySHP plants in Karnataka (and especially in the Western Ghats)are viewed. One project has spawned many more in the samearea and fragmented forests have led to human-wildlifeconflicts. “A patch of a project appears small, but fragments alot more than its hectarage:”73 this is the reason given for thegovernment of Karnataka order that prohibits SHP in WesternGhats forests.74 The department also believes that SHP impactsmicro flora and fauna, which are areas that have not receivedmuch attention before. Projects within 10 km from wildlife
GREEN NORMS FOR GREEN ENERGY: SMALL HYDRO POWER 21
TABLE 17 Conditions put during EC in Karnataka
Source: Analysis done by CSE, 2013
General conditions
DEE reserves the right to withdraw the EC with any change ingovernment policy
DEE and the Regional Office of KSPCB will monitor implementationof stipulated conditions. Environmental Management Plan andadditional information to be submitted to Regional Office
If project is altered a fresh reference shall be submitted to DEE toassess and incorporate additional environmental protectionmeasures
EC letter advertised in newspapers of vernacular language andposted in the tehsildar’s office
Enforcement of Water Act, Air Act, Environmental Protection Act,Hazardous Wastes Rules etc.
DEE reserves the right to revoke EC if conditions stipulated are notimplemented to satisfaction
Fugitive dust emissions should be controlled by water spraying onhaul roads, loading and unloading and transfer points.
Measures should be implemented to keep noise levels below 85dBA in the work environment
Personnel working in dusty areas should be provided with protectiverespiratory devices
Concealing, or submitting false data may result in withdrawal ofclearance and attract action under the Environmental ProtectionAct.
Project-specific conditions
Strictly follow the Consent for Establishment and Consent for Operationconditions issued by KSPCB
Dispose solid waste in a scientific manner without causing underground andsurface water pollution
Adopt rainwater harvesting in industry within six months and submitcompliance report
Earmark 33 per cent of the project land for green belt
Scientifically dispose wastes generated in the project such as wastegear/lubricating oil, batteries etc.
Provide sanitary facilities in sufficient number for employees of project
Undertake river bank/canal bank afforestation programme
Comply with all environmental protection measures incorporated in the EMP
The proponent shall earmark at least 2 per cent of the project cost towardscorporate social responsibility and execute the same (2 per cent for 1.5-MWproject, 5 per cent for 24.75-MW project)
The proponent shall construct ladies’ toilets and overhead tanks ingovernment schools and distribute books and stationery to poor studentstowards social commitment plan and submit a report to DEE
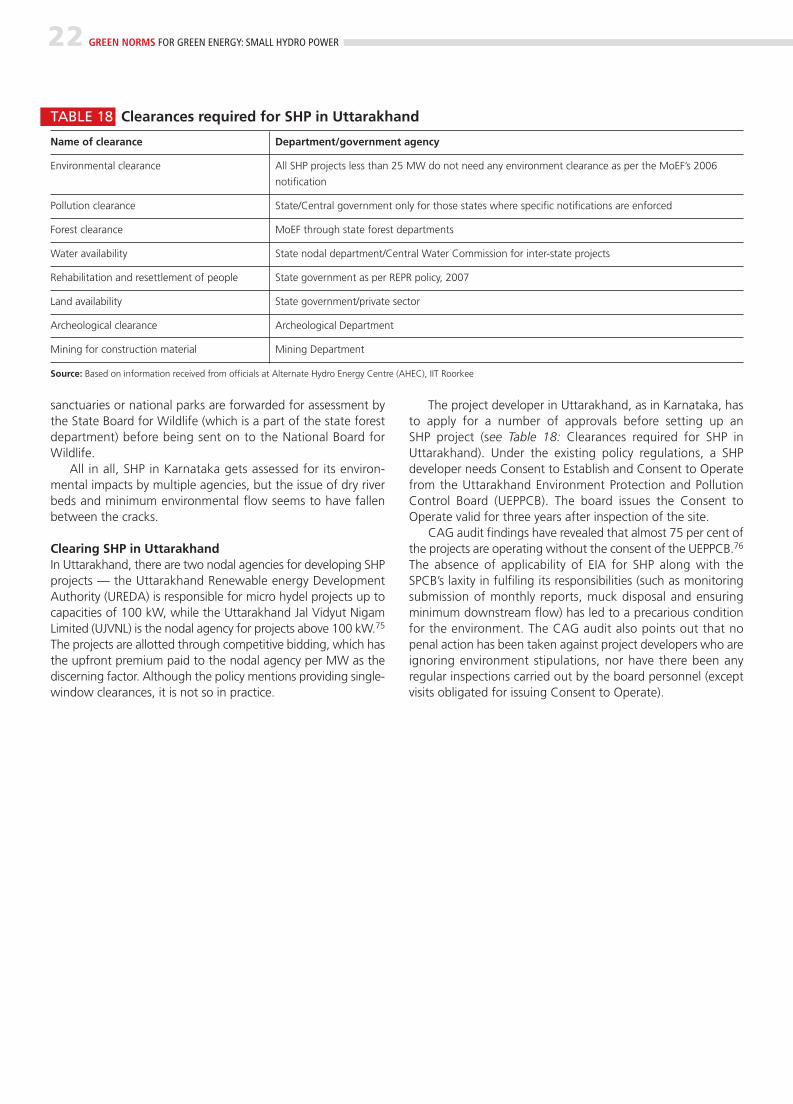
sanctuaries or national parks are forwarded for assessment bythe State Board for Wildlife (which is a part of the state forestdepartment) before being sent on to the National Board forWildlife.
All in all, SHP in Karnataka gets assessed for its environ -mental impacts by multiple agencies, but the issue of dry riverbeds and minimum environmental flow seems to have fallenbetween the cracks.
Clearing SHP in UttarakhandIn Uttarakhand, there are two nodal agencies for developing SHPprojects — the Uttarakhand Renewable energy DevelopmentAuthority (UREDA) is responsible for micro hydel projects up tocapacities of 100 kW, while the Uttarakhand Jal Vidyut NigamLimited (UJVNL) is the nodal agency for projects above 100 kW.75
The projects are allotted through competitive bidding, which hasthe upfront premium paid to the nodal agency per MW as thediscerning factor. Although the policy mentions providing single-window clearances, it is not so in practice.
The project developer in Uttarakhand, as in Karnataka, hasto apply for a number of approvals before setting up an SHP project (see Table 18: Clearances required for SHP inUttarakhand). Under the existing policy regulations, a SHPdeveloper needs Consent to Establish and Consent to Operatefrom the Uttarakhand Environment Protection and PollutionControl Board (UEPPCB). The board issues the Consent toOperate valid for three years after inspection of the site.
CAG audit findings have revealed that almost 75 per cent ofthe projects are operating without the consent of the UEPPCB.76
The absence of applicability of EIA for SHP along with theSPCB’s laxity in fulfiling its responsibilities (such as monitoringsubmission of monthly reports, muck disposal and ensuringminimum downstream flow) has led to a precarious conditionfor the environment. The CAG audit also points out that nopenal action has been taken against project developers who areignoring environment stipulations, nor have there been anyregular inspections carried out by the board personnel (exceptvisits obligated for issuing Consent to Operate).
22 GREEN NORMS FOR GREEN ENERGY: SMALL HYDRO POWER
TABLE 18 Clearances required for SHP in Uttarakhand
Name of clearance Department/government agency
Environmental clearance All SHP projects less than 25 MW do not need any environment clearance as per the MoEF’s 2006
notification
Pollution clearance State/Central government only for those states where specific notifications are enforced
Forest clearance MoEF through state forest departments
Water availability State nodal department/Central Water Commission for inter-state projects
Rehabilitation and resettlement of people State government as per REPR policy, 2007
Land availability State government/private sector
Archeological clearance Archeological Department
Mining for construction material Mining Department
Source: Based on information received from officials at Alternate Hydro Energy Centre (AHEC), IIT Roorkee
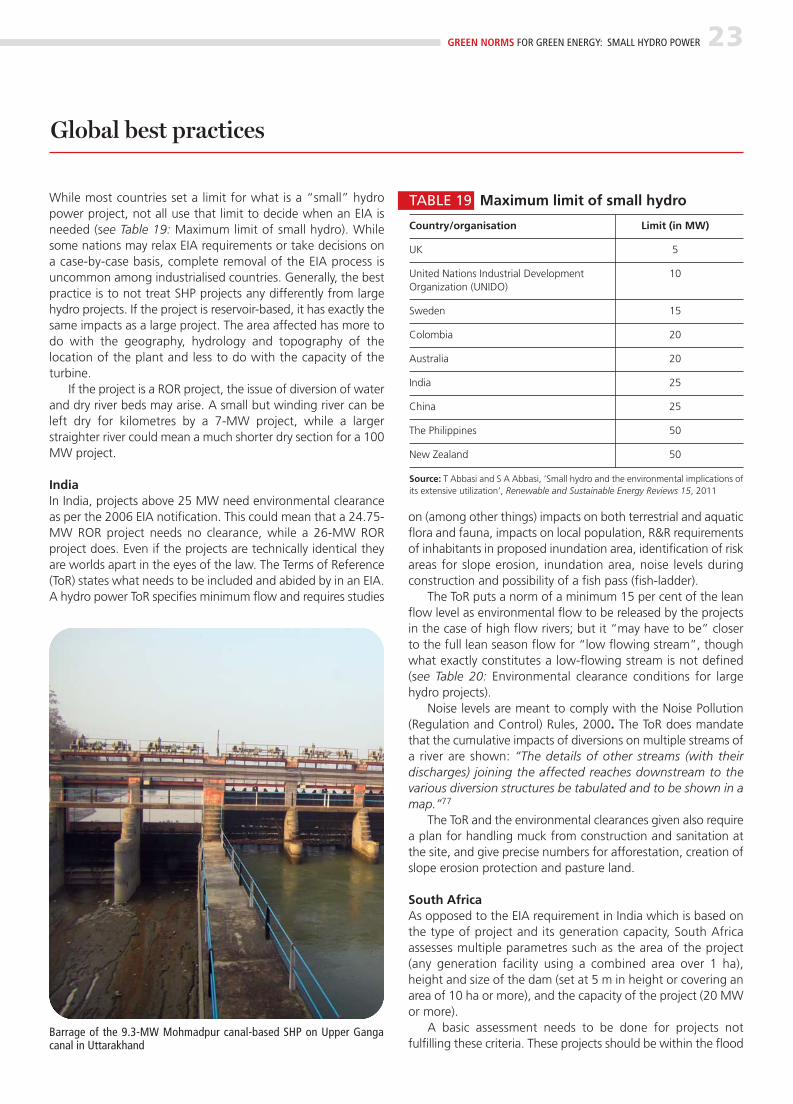
While most countries set a limit for what is a “small” hydropower project, not all use that limit to decide when an EIA isneeded (see Table 19: Maximum limit of small hydro). Whilesome nations may relax EIA requirements or take decisions ona case-by-case basis, complete removal of the EIA process isuncommon among industrialised countries. Generally, the bestpractice is to not treat SHP projects any differently from largehydro projects. If the project is reservoir-based, it has exactly thesame impacts as a large project. The area affected has more todo with the geography, hydrology and topography of thelocation of the plant and less to do with the capacity of theturbine.
If the project is a ROR project, the issue of diversion of waterand dry river beds may arise. A small but winding river can beleft dry for kilometres by a 7-MW project, while a largerstraighter river could mean a much shorter dry section for a 100MW project.
IndiaIn India, projects above 25 MW need environmental clearanceas per the 2006 EIA notification. This could mean that a 24.75-MW ROR project needs no clearance, while a 26-MW RORproject does. Even if the projects are technically identical theyare worlds apart in the eyes of the law. The Terms of Reference(ToR) states what needs to be included and abided by in an EIA.A hydro power ToR specifies minimum flow and requires studies
on (among other things) impacts on both terrestrial and aquaticflora and fauna, impacts on local population, R&R requirementsof inhabitants in proposed inundation area, identification of riskareas for slope erosion, inundation area, noise levels duringconstruction and possibility of a fish pass (fish-ladder).
The ToR puts a norm of a minimum 15 per cent of the leanflow level as environmental flow to be released by the projectsin the case of high flow rivers; but it “may have to be” closerto the full lean season flow for “low flowing stream”, thoughwhat exactly constitutes a low-flowing stream is not defined(see Table 20: Environmental clearance conditions for largehydro projects).
Noise levels are meant to comply with the Noise Pollution(Regulation and Control) Rules, 2000. The ToR does mandatethat the cumulative impacts of diversions on multiple streams ofa river are shown: “The details of other streams (with theirdischarges) joining the affected reaches downstream to thevarious diversion structures be tabulated and to be shown in amap.”77
The ToR and the environmental clearances given also requirea plan for handling muck from construction and sanitation atthe site, and give precise numbers for afforestation, creation ofslope erosion protection and pasture land.
South AfricaAs opposed to the EIA requirement in India which is based onthe type of project and its generation capacity, South Africaassesses multiple parametres such as the area of the project(any generation facility using a combined area over 1 ha),height and size of the dam (set at 5 m in height or covering anarea of 10 ha or more), and the capacity of the project (20 MWor more).
A basic assessment needs to be done for projects notfulfilling these criteria. These projects should be within the flood
GREEN NORMS FOR GREEN ENERGY: SMALL HYDRO POWER 23
Barrage of the 9.3-MW Mohmadpur canal-based SHP on Upper Gangacanal in Uttarakhand
Global best practices
TABLE 19 Maximum limit of small hydro
Country/organisation Limit (in MW)
UK 5
United Nations Industrial Development 10Organization (UNIDO)
Sweden 15
Colombia 20
Australia 20
India 25
China 25
The Philippines 50
New Zealand 50
Source: T Abbasi and S A Abbasi, ‘Small hydro and the environmental implications ofits extensive utilization’, Renewable and Sustainable Energy Reviews 15, 2011
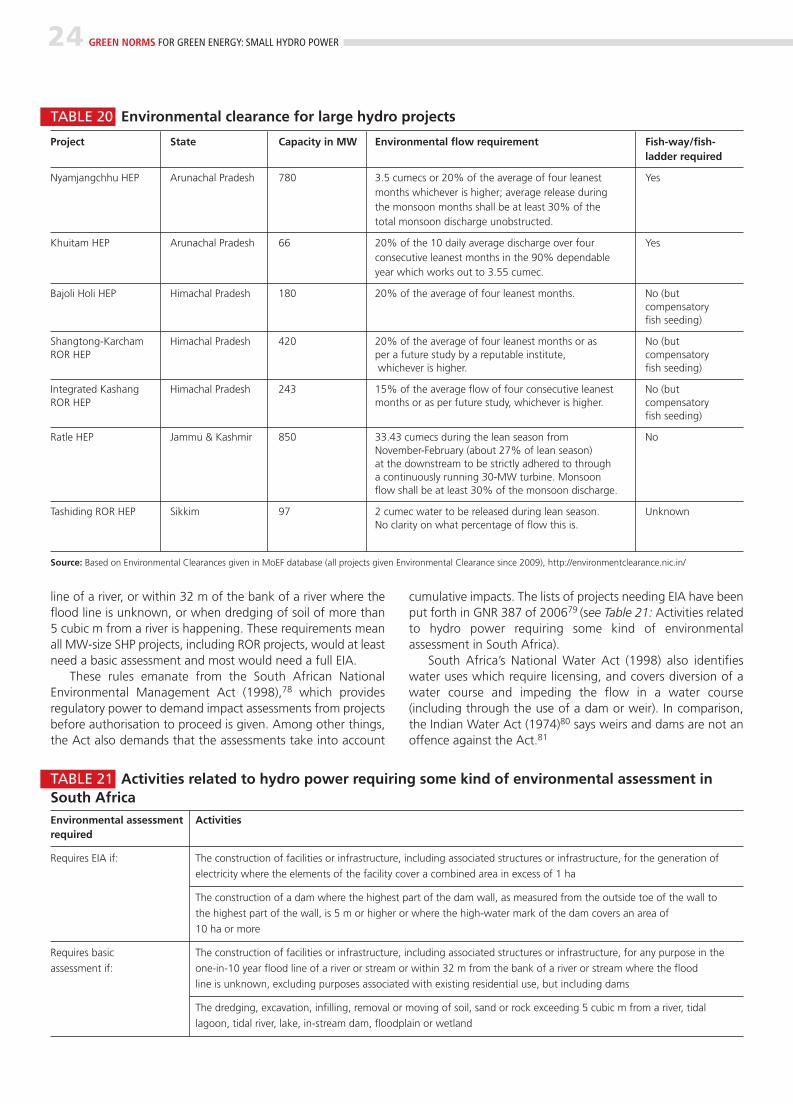
line of a river, or within 32 m of the bank of a river where theflood line is unknown, or when dredging of soil of more than5 cubic m from a river is happening. These requirements meanall MW-size SHP projects, including ROR projects, would at leastneed a basic assessment and most would need a full EIA.
These rules emanate from the South African NationalEnvironmental Management Act (1998),78 which providesregulatory power to demand impact assessments from projectsbefore authorisation to proceed is given. Among other things,the Act also demands that the assessments take into account
cumulative impacts. The lists of projects needing EIA have beenput forth in GNR 387 of 200679 (see Table 21: Activities relatedto hydro power requiring some kind of environmentalassessment in South Africa).
South Africa’s National Water Act (1998) also identifieswater uses which require licensing, and covers diversion of awater course and impeding the flow in a water course(including through the use of a dam or weir). In comparison,the Indian Water Act (1974)80 says weirs and dams are not anoffence against the Act.81
24 GREEN NORMS FOR GREEN ENERGY: SMALL HYDRO POWER
TABLE 20 Environmental clearance for large hydro projects
Project State Capacity in MW Environmental flow requirement Fish-way/fish- ladder required
Nyamjangchhu HEP Arunachal Pradesh 780 3.5 cumecs or 20% of the average of four leanest Yesmonths whichever is higher; average release during the monsoon months shall be at least 30% of the total monsoon discharge unobstructed.
Khuitam HEP Arunachal Pradesh 66 20% of the 10 daily average discharge over four Yesconsecutive leanest months in the 90% dependableyear which works out to 3.55 cumec.
Bajoli Holi HEP Himachal Pradesh 180 20% of the average of four leanest months. No (but compensatory fish seeding)
Shangtong-Karcham Himachal Pradesh 420 20% of the average of four leanest months or as No (but ROR HEP per a future study by a reputable institute, compensatory
whichever is higher. fish seeding)
Integrated Kashang Himachal Pradesh 243 15% of the average flow of four consecutive leanest No (but ROR HEP months or as per future study, whichever is higher. compensatory
fish seeding)
Ratle HEP Jammu & Kashmir 850 33.43 cumecs during the lean season from NoNovember-February (about 27% of lean season) at the downstream to be strictly adhered to through a continuously running 30-MW turbine. Monsoon flow shall be at least 30% of the monsoon discharge.
Tashiding ROR HEP Sikkim 97 2 cumec water to be released during lean season. UnknownNo clarity on what percentage of flow this is.
Source: Based on Environmental Clearances given in MoEF database (all projects given Environmental Clearance since 2009), http://environmentclearance.nic.in/
TABLE 21 Activities related to hydro power requiring some kind of environmental assessment inSouth AfricaEnvironmental assessment Activitiesrequired
Requires EIA if: The construction of facilities or infrastructure, including associated structures or infrastructure, for the generation of
electricity where the elements of the facility cover a combined area in excess of 1 ha
The construction of a dam where the highest part of the dam wall, as measured from the outside toe of the wall to
the highest part of the wall, is 5 m or higher or where the high-water mark of the dam covers an area of
10 ha or more
Requires basic The construction of facilities or infrastructure, including associated structures or infrastructure, for any purpose in the
assessment if: one-in-10 year flood line of a river or stream or within 32 m from the bank of a river or stream where the flood
line is unknown, excluding purposes associated with existing residential use, but including dams
The dredging, excavation, infilling, removal or moving of soil, sand or rock exceeding 5 cubic m from a river, tidal
lagoon, tidal river, lake, in-stream dam, floodplain or wetland
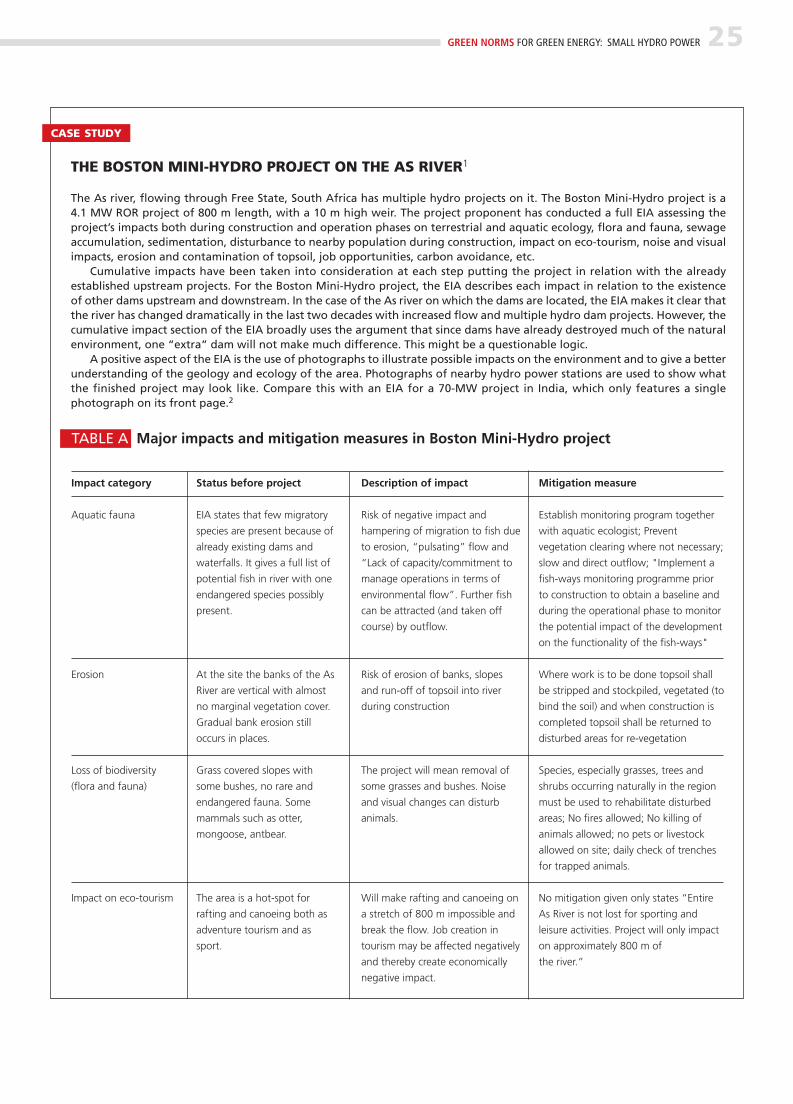
GREEN NORMS FOR GREEN ENERGY: SMALL HYDRO POWER 25
THE BOSTON MINI-HYDRO PROJECT ON THE AS RIVER1
The As river, flowing through Free State, South Africa has multiple hydro projects on it. The Boston Mini-Hydro project is a 4.1 MW ROR project of 800 m length, with a 10 m high weir. The project proponent has conducted a full EIA assessing theproject’s impacts both during construction and operation phases on terrestrial and aquatic ecology, flora and fauna, sewageaccumulation, sedimentation, disturbance to nearby population during construction, impact on eco-tourism, noise and visualimpacts, erosion and contamination of topsoil, job opportunities, carbon avoidance, etc.
Cumulative impacts have been taken into consideration at each step putting the project in relation with the alreadyestablished upstream projects. For the Boston Mini-Hydro project, the EIA describes each impact in relation to the existenceof other dams upstream and downstream. In the case of the As river on which the dams are located, the EIA makes it clear thatthe river has changed dramatically in the last two decades with increased flow and multiple hydro dam projects. However, thecumulative impact section of the EIA broadly uses the argument that since dams have already destroyed much of the naturalenvironment, one “extra” dam will not make much difference. This might be a questionable logic.
A positive aspect of the EIA is the use of photographs to illustrate possible impacts on the environment and to give a betterunderstanding of the geology and ecology of the area. Photographs of nearby hydro power stations are used to show whatthe finished project may look like. Compare this with an EIA for a 70-MW project in India, which only features a singlephotograph on its front page.2
TABLE A Major impacts and mitigation measures in Boston Mini-Hydro project
Impact category
Aquatic fauna
Erosion
Loss of biodiversity
(flora and fauna)
Impact on eco-tourism
Status before project
EIA states that few migratory
species are present because of
already existing dams and
waterfalls. It gives a full list of
potential fish in river with one
endangered species possibly
present.
At the site the banks of the As
River are vertical with almost
no marginal vegetation cover.
Gradual bank erosion still
occurs in places.
Grass covered slopes with
some bushes, no rare and
endangered fauna. Some
mammals such as otter,
mongoose, antbear.
The area is a hot-spot for
rafting and canoeing both as
adventure tourism and as
sport.
Description of impact
Risk of negative impact and
hampering of migration to fish due
to erosion, “pulsating” flow and
“Lack of capacity/commitment to
manage operations in terms of
environmental flow”. Further fish
can be attracted (and taken off
course) by outflow.
Risk of erosion of banks, slopes
and run-off of topsoil into river
during construction
The project will mean removal of
some grasses and bushes. Noise
and visual changes can disturb
animals.
Will make rafting and canoeing on
a stretch of 800 m impossible and
break the flow. Job creation in
tourism may be affected negatively
and thereby create economically
negative impact.
Mitigation measure
Establish monitoring program together
with aquatic ecologist; Prevent
vegetation clearing where not necessary;
slow and direct outflow; "Implement a
fish-ways monitoring programme prior
to construction to obtain a baseline and
during the operational phase to monitor
the potential impact of the development
on the functionality of the fish-ways"
Where work is to be done topsoil shall
be stripped and stockpiled, vegetated (to
bind the soil) and when construction is
completed topsoil shall be returned to
disturbed areas for re-vegetation
Species, especially grasses, trees and
shrubs occurring naturally in the region
must be used to rehabilitate disturbed
areas; No fires allowed; No killing of
animals allowed; no pets or livestock
allowed on site; daily check of trenches
for trapped animals.
No mitigation given only states “Entire
As River is not lost for sporting and
leisure activities. Project will only impact
on approximately 800 m of
the river.”
CASE STUDY
As with other developmental projects, as long as no EIArequirement exists, there is no way of knowing what impacts aproject may have.1. SHP plants above 1 MW in size should be included under
EIA notification 2006 as Category B projects, changing thetext under 1(c) River Valley Projects to: “(i) < 50 MW ≥ 1MW hydroelectric power generation”. Based on screening,the need for an EIA should be decided. Further, it should beadded that projects to be based in an already existingirrigation canal would be exempted from EIA requirement.
2. Before taking up further hydro power development, acarrying capacity study over a river basin should be executedfor all rivers. The distance between projects and the overallpercentage of river length affected must be decided on thebasis of the carrying capacity study.
3. As part of the environmental clearance for any project, apart of the stream should remain undammed and provide anatural or artificial water course designed for the localenvironment to allow passage of fish and macro-invertebrates. A minimum environmental flow rule shouldbe set in place for all SHPs. CSE recommends that 50 percent of the flow in lean season and 30 per cent of the flowin monsoon should be set aside as ecological flow. This
parameter should be publicly monitored. 4. Forest diversion should take into consideration the land
concreted due to coup roads, linear intrusion etc. ForestClearance should be given based on the combined impactof SHP and linear intrusion. Also, there should be strictermonitoring of the afforestation rules.
5. Clearance given by the Fisheries Department should notinclude the clause of introduction of invasive species intothe river ecology.
6. There should be clear rules and a plan prepared for muckdisposal by the developers along with better monitoring andenforcement of the said plans by the State Pollution ControlBoard.
7. An assessment of the infrastructure being constructed forSHP projects has to be done. There have been cases wherebigger infrastructure has been created in order to increasethe power production capacity in future.
8. Benefits from the projects must be shared with the localcommunities. For instance, the first right to power should bewith them. Profits generated should be shared with the localpopulation for development. Project-affected villages haveto be clearly defined so that it can be evaluated who willreceive the benefits from SHP.
26 GREEN NORMS FOR GREEN ENERGY: SMALL HYDRO POWER
Recommendations
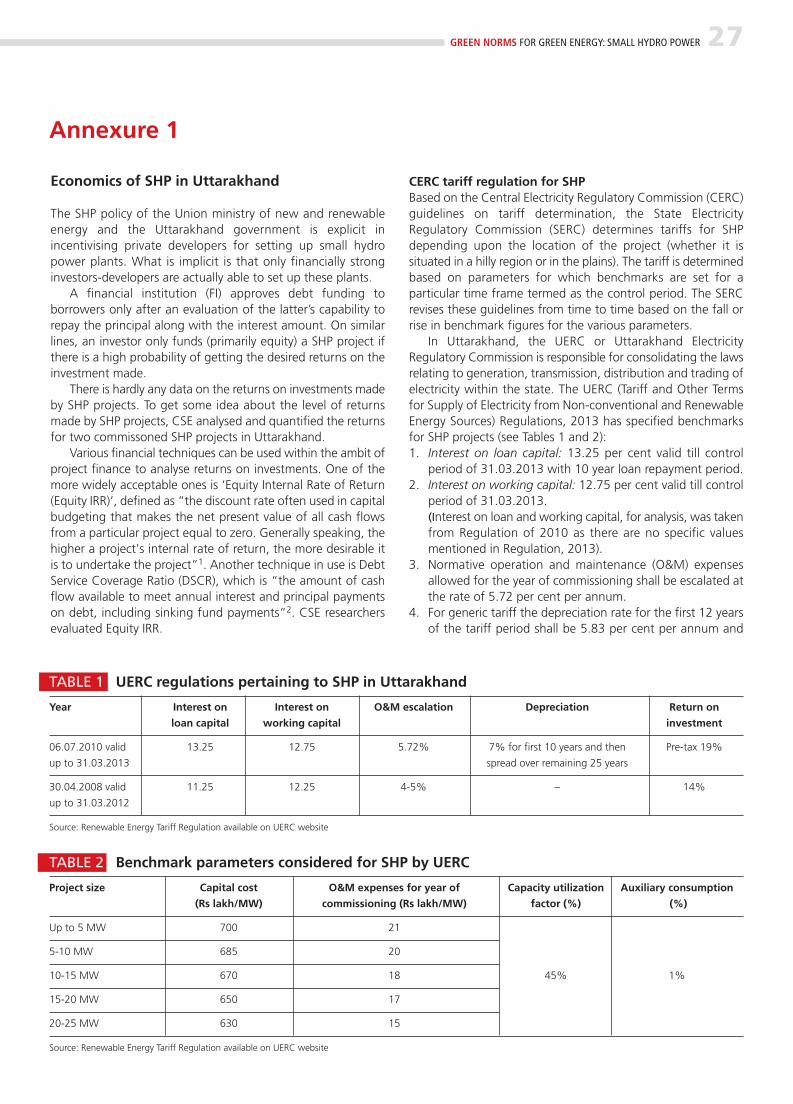
GREEN NORMS FOR GREEN ENERGY: SMALL HYDRO POWER 27
Economics of SHP in Uttarakhand
The SHP policy of the Union ministry of new and renewableenergy and the Uttarakhand government is explicit inincentivising private developers for setting up small hydropower plants. What is implicit is that only financially stronginvestors-developers are actually able to set up these plants.
A financial institution (FI) approves debt funding toborrowers only after an evaluation of the latter’s capability torepay the principal along with the interest amount. On similarlines, an investor only funds (primarily equity) a SHP project ifthere is a high probability of getting the desired returns on theinvestment made.
There is hardly any data on the returns on investments madeby SHP projects. To get some idea about the level of returnsmade by SHP projects, CSE analysed and quantified the returnsfor two commissoned SHP projects in Uttarakhand.
Various financial techniques can be used within the ambit ofproject finance to analyse returns on investments. One of themore widely acceptable ones is ‘Equity Internal Rate of Return(Equity IRR)’, defined as “the discount rate often used in capitalbudgeting that makes the net present value of all cash flowsfrom a particular project equal to zero. Generally speaking, thehigher a project's internal rate of return, the more desirable itis to undertake the project”1. Another technique in use is DebtService Coverage Ratio (DSCR), which is “the amount of cashflow available to meet annual interest and principal paymentson debt, including sinking fund payments”2. CSE researchersevaluated Equity IRR.
CERC tariff regulation for SHPBased on the Central Electricity Regulatory Commission (CERC)guidelines on tariff determination, the State ElectricityRegulatory Commission (SERC) determines tariffs for SHPdepending upon the location of the project (whether it issituated in a hilly region or in the plains). The tariff is determinedbased on parameters for which benchmarks are set for aparticular time frame termed as the control period. The SERCrevises these guidelines from time to time based on the fall orrise in benchmark figures for the various parameters.
In Uttarakhand, the UERC or Uttarakhand ElectricityRegulatory Commission is responsible for consolidating the lawsrelating to generation, transmission, distribution and trading ofelectricity within the state. The UERC (Tariff and Other Termsfor Supply of Electricity from Non-conventional and RenewableEnergy Sources) Regulations, 2013 has specified benchmarksfor SHP projects (see Tables 1 and 2): 1. Interest on loan capital: 13.25 per cent valid till control
period of 31.03.2013 with 10 year loan repayment period.2. Interest on working capital: 12.75 per cent valid till control
period of 31.03.2013.(Interest on loan and working capital, for analysis, was takenfrom Regulation of 2010 as there are no specific valuesmentioned in Regulation, 2013).
3. Normative operation and maintenance (O&M) expensesallowed for the year of commis sioning shall be escalated atthe rate of 5.72 per cent per annum.
4. For generic tariff the depreciation rate for the first 12 yearsof the tariff period shall be 5.83 per cent per annum and
Annexure 1
TABLE 2 Benchmark parameters considered for SHP by UERC
Project size Capital cost O&M expenses for year of Capacity utilization Auxiliary consumption
(Rs lakh/MW) commissioning (Rs lakh/MW) factor (%) (%)
Up to 5 MW 700 21
5-10 MW 685 20
10-15 MW 670 18 45% 1%
15-20 MW 650 17
20-25 MW 630 15
Source: Renewable Energy Tariff Regulation available on UERC website
TABLE 1 UERC regulations pertaining to SHP in Uttarakhand
Year Interest on Interest on O&M escalation Depreciation Return on
loan capital working capital investment
06.07.2010 valid 13.25 12.75 5.72% 7% for first 10 years and then Pre-tax 19%
up to 31.03.2013 spread over remaining 25 years
30.04.2008 valid 11.25 12.25 4-5% – 14%
up to 31.03.2012
Source: Renewable Energy Tariff Regulation available on UERC website
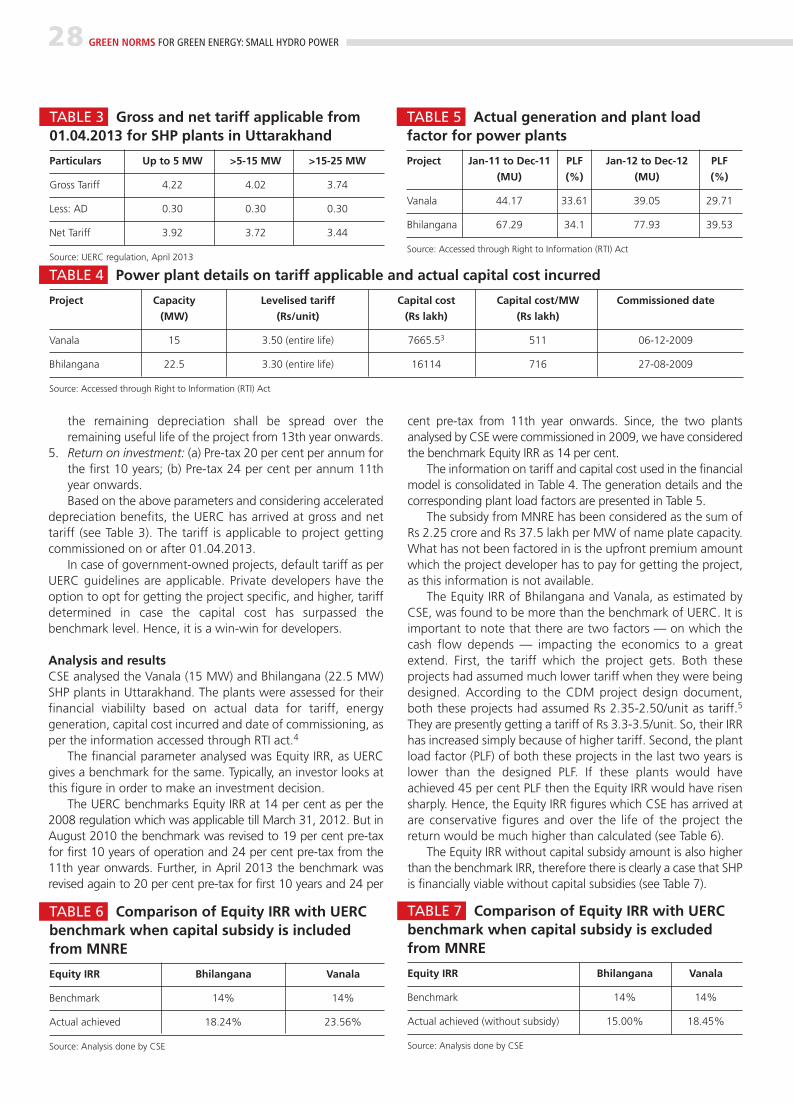
28 GREEN NORMS FOR GREEN ENERGY: SMALL HYDRO POWER
the remaining depreciation shall be spread over theremaining useful life of the project from 13th year onwards.
5. Return on investment: (a) Pre-tax 20 per cent per annum forthe first 10 years; (b) Pre-tax 24 per cent per annum 11thyear onwards.Based on the above parameters and considering accelerated
depreciation benefits, the UERC has arrived at gross and nettariff (see Table 3). The tariff is applicable to project gettingcommissioned on or after 01.04.2013.
In case of government-owned projects, default tariff as perUERC guidelines are applicable. Private developers have theoption to opt for getting the project specific, and higher, tariffdetermined in case the capital cost has surpassed thebenchmark level. Hence, it is a win-win for developers.
Analysis and results CSE analysed the Vanala (15 MW) and Bhilangana (22.5 MW)SHP plants in Uttarakhand. The plants were assessed for theirfinancial viabililty based on actual data for tariff, energygeneration, capital cost incurred and date of commissioning, asper the information accessed through RTI act.4
The financial parameter analysed was Equity IRR, as UERCgives a benchmark for the same. Typically, an investor looks atthis figure in order to make an investment decision.
The UERC benchmarks Equity IRR at 14 per cent as per the2008 regulation which was applicable till March 31, 2012. But inAugust 2010 the benchmark was revised to 19 per cent pre-taxfor first 10 years of operation and 24 per cent pre-tax from the11th year onwards. Further, in April 2013 the benchmark wasrevised again to 20 per cent pre-tax for first 10 years and 24 per
cent pre-tax from 11th year onwards. Since, the two plantsanalysed by CSE were commissioned in 2009, we have consideredthe benchmark Equity IRR as 14 per cent.
The information on tariff and capital cost used in the financialmodel is consolidated in Table 4. The generation details and thecorresponding plant load factors are presented in Table 5.
The subsidy from MNRE has been considered as the sum ofRs 2.25 crore and Rs 37.5 lakh per MW of name plate capacity.What has not been factored in is the upfront premium amountwhich the project developer has to pay for getting the project,as this information is not available.
The Equity IRR of Bhilangana and Vanala, as estimated byCSE, was found to be more than the benchmark of UERC. It isimportant to note that there are two factors –– on which thecash flow depends –– impacting the economics to a greatextend. First, the tariff which the project gets. Both theseprojects had assumed much lower tariff when they were beingdesigned. According to the CDM project design document,both these projects had assumed Rs 2.35-2.50/unit as tariff.5
They are presently getting a tariff of Rs 3.3-3.5/unit. So, their IRRhas increased simply because of higher tariff. Second, the plantload factor (PLF) of both these projects in the last two years islower than the designed PLF. If these plants would haveachieved 45 per cent PLF then the Equity IRR would have risensharply. Hence, the Equity IRR figures which CSE has arrived atare conservative figures and over the life of the project thereturn would be much higher than calculated (see Table 6).
The Equity IRR without capital subsidy amount is also higherthan the benchmark IRR, therefore there is clearly a case that SHPis financially viable without capital subsidies (see Table 7).
TABLE 4 Power plant details on tariff applicable and actual capital cost incurred
Project Capacity Levelised tariff Capital cost Capital cost/MW Commissioned date
(MW) (Rs/unit) (Rs lakh) (Rs lakh)
Vanala 15 3.50 (entire life) 7665.53 511 06-12-2009
Bhilangana 22.5 3.30 (entire life) 16114 716 27-08-2009
Source: Accessed through Right to Information (RTI) Act
TABLE 5 Actual generation and plant loadfactor for power plants
Project Jan-11 to Dec-11 PLF Jan-12 to Dec-12 PLF
(MU) (%) (MU) (%)
Vanala 44.17 33.61 39.05 29.71
Bhilangana 67.29 34.1 77.93 39.53
Source: Accessed through Right to Information (RTI) Act
TABLE 3 Gross and net tariff applicable from01.04.2013 for SHP plants in Uttarakhand
Particulars Up to 5 MW >5-15 MW >15-25 MW
Gross Tariff 4.22 4.02 3.74
Less: AD 0.30 0.30 0.30
Net Tariff 3.92 3.72 3.44
Source: UERC regulation, April 2013
TABLE 6 Comparison of Equity IRR with UERCbenchmark when capital subsidy is includedfrom MNRE
Equity IRR Bhilangana Vanala
Benchmark 14% 14%
Actual achieved 18.24% 23.56%
Source: Analysis done by CSE
TABLE 7 Comparison of Equity IRR with UERCbenchmark when capital subsidy is excludedfrom MNRE
Equity IRR Bhilangana Vanala
Benchmark 14% 14%
Actual achieved (without subsidy) 15.00% 18.45%
Source: Analysis done by CSE
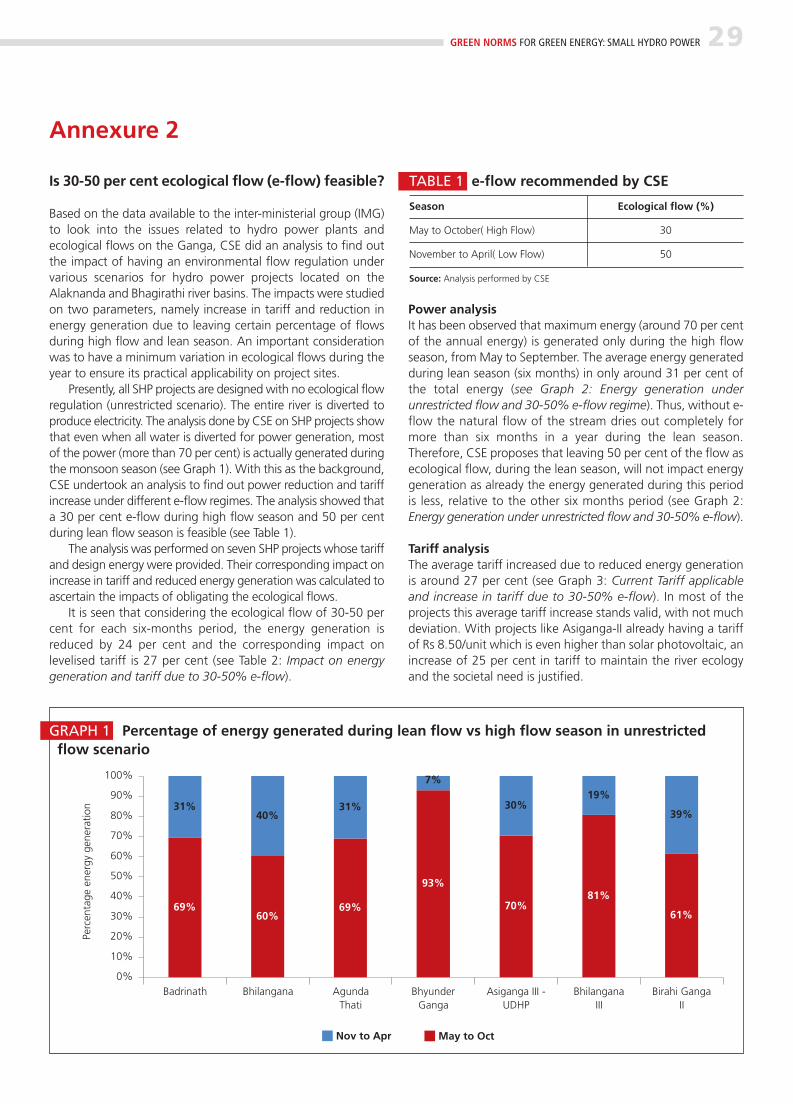
GREEN NORMS FOR GREEN ENERGY: SMALL HYDRO POWER 29
Is 30-50 per cent ecological flow (e-flow) feasible?
Based on the data available to the inter-ministerial group (IMG)to look into the issues related to hydro power plants andecological flows on the Ganga, CSE did an analysis to find outthe impact of having an environmental flow regulation undervarious scenarios for hydro power projects located on theAlaknanda and Bhagirathi river basins. The impacts were studiedon two parameters, namely increase in tariff and reduction inenergy generation due to leaving certain percentage of flowsduring high flow and lean season. An important considerationwas to have a minimum variation in ecological flows during theyear to ensure its practical applicability on project sites.
Presently, all SHP projects are designed with no ecological flowregulation (unrestricted scenario). The entire river is diverted toproduce electricity. The analysis done by CSE on SHP projects showthat even when all water is diverted for power generation, mostof the power (more than 70 per cent) is actually generated duringthe monsoon season (see Graph 1). With this as the background,CSE undertook an analysis to find out power reduction and tariffincrease under different e-flow regimes. The analysis showed thata 30 per cent e-flow during high flow season and 50 per centduring lean flow season is feasible (see Table 1).
The analysis was performed on seven SHP projects whose tariffand design energy were provided. Their corresponding impact onincrease in tariff and reduced energy generation was calculated toascertain the impacts of obligating the ecological flows.
It is seen that considering the ecological flow of 30-50 percent for each six-months period, the energy generation isreduced by 24 per cent and the corresponding impact onlevelised tariff is 27 per cent (see Table 2: Impact on energygeneration and tariff due to 30-50% e-flow).
Power analysisIt has been observed that maximum energy (around 70 per centof the annual energy) is generated only during the high flowseason, from May to September. The average energy generatedduring lean season (six months) in only around 31 per cent ofthe total energy (see Graph 2: Energy generation underunrestricted flow and 30-50% e-flow regime). Thus, without e-flow the natural flow of the stream dries out completely formore than six months in a year during the lean season.Therefore, CSE proposes that leaving 50 per cent of the flow asecological flow, during the lean season, will not impact energygeneration as already the energy generated during this periodis less, relative to the other six months period (see Graph 2:Energy generation under unrestricted flow and 30-50% e-flow).
Tariff analysisThe average tariff increased due to reduced energy generationis around 27 per cent (see Graph 3: Current Tariff applicableand increase in tariff due to 30-50% e-flow). In most of theprojects this average tariff increase stands valid, with not muchdeviation. With projects like Asiganga-II already having a tariffof Rs 8.50/unit which is even higher than solar photovoltaic, anincrease of 25 per cent in tariff to maintain the river ecologyand the societal need is justified.
Annexure 2
69%60%
69%
93%
70%81%
61%
31%40%
31%
7%
30%19%
39%
0%
10%
20%
30%
40%
50%
60%
70%
80%
90%
100%
Badrinath Bhilangana AgundaThati
BhyunderGanga
Asiganga III -UDHP
BhilanganaIII
Birahi GangaII
Nov to Apr May to Oct
Perc
enta
ge e
nerg
y ge
nera
tion
TABLE 1 e-flow recommended by CSE
Season Ecological flow (%)
May to October( High Flow) 30
November to April( Low Flow) 50
Source: Analysis performed by CSE
GRAPH 1 Percentage of energy generated during lean flow vs high flow season in unrestricted flow scenario
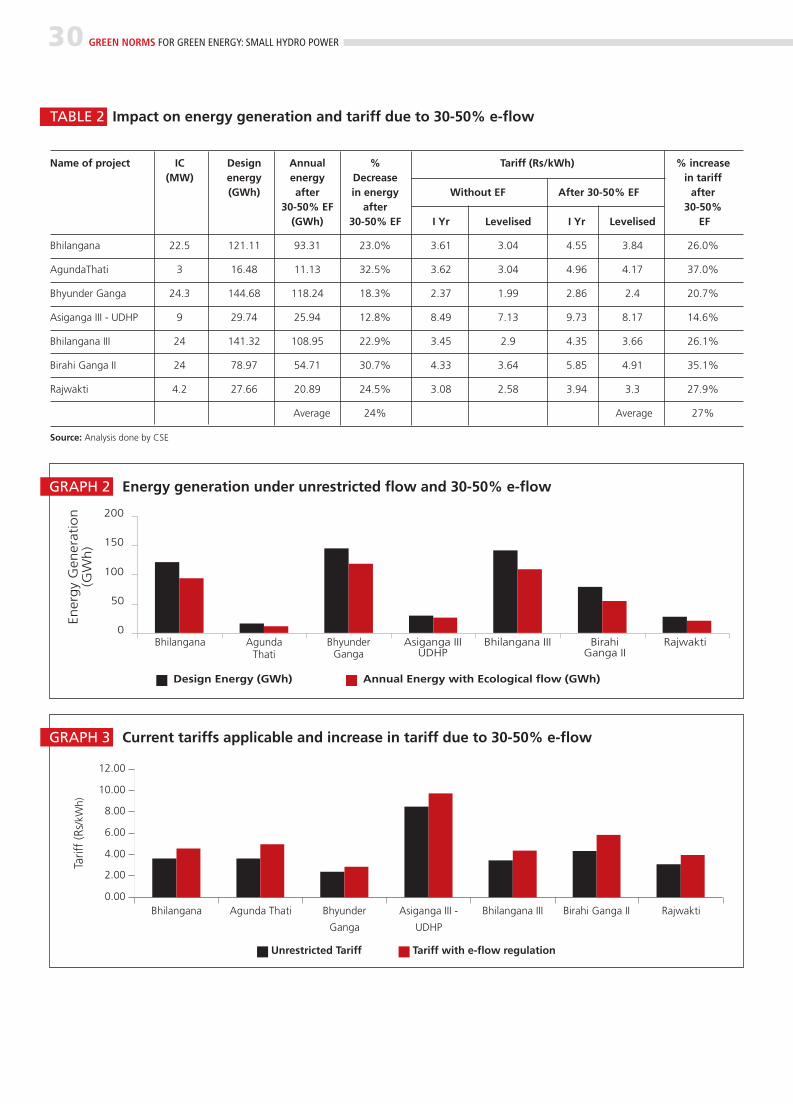
30 GREEN NORMS FOR GREEN ENERGY: SMALL HYDRO POWER
Ener
gy
Gen
erat
ion
(GW
h)
0
50
100
150
200
Bhilangana AgundaThati
BhyunderGanga
Asiganga IIIUDHP
Bhilangana III BirahiGanga II
Rajwakti
Design Energy (GWh) Annual Energy with Ecological flow (GWh)
GRAPH 2 Energy generation under unrestricted flow and 30-50% e-flow
0.00
2.00
4.00
6.00
8.00
10.00
12.00
Bhilangana Agunda Thati Bhyunder
Ganga
Asiganga III -
UDHP
Bhilangana III Birahi Ganga II Rajwakti
Tarif
f (R
s/kW
h)
Unrestricted Tariff Tariff with e-flow regulation
GRAPH 3 Current tariffs applicable and increase in tariff due to 30-50% e-flow
TABLE 2 Impact on energy generation and tariff due to 30-50% e-flow
Name of project IC Design Annual % Tariff (Rs/kWh) % increase (MW) energy energy Decrease in tariff
(GWh) after in energy Without EF After 30-50% EF after 30-50% EF after 30-50%
(GWh) 30-50% EF I Yr Levelised I Yr Levelised EF
Bhilangana 22.5 121.11 93.31 23.0% 3.61 3.04 4.55 3.84 26.0%
AgundaThati 3 16.48 11.13 32.5% 3.62 3.04 4.96 4.17 37.0%
Bhyunder Ganga 24.3 144.68 118.24 18.3% 2.37 1.99 2.86 2.4 20.7%
Asiganga III - UDHP 9 29.74 25.94 12.8% 8.49 7.13 9.73 8.17 14.6%
Bhilangana III 24 141.32 108.95 22.9% 3.45 2.9 4.35 3.66 26.1%
Birahi Ganga II 24 78.97 54.71 30.7% 4.33 3.64 5.85 4.91 35.1%
Rajwakti 4.2 27.66 20.89 24.5% 3.08 2.58 3.94 3.3 27.9%
Average 24% Average 27%
Source: Analysis done by CSE
GREEN NORMS FOR GREEN ENERGY: SMALL HYDRO POWER 31
1. Varun et al 2012, ‘Life cycle greenhouse gas emissions estimation forSHP schemes in India’, Elsevier, Energy 44 (2012) 498-508
2. Anon, ‘Sidrapong Hydel Power Station’, Department of Power & Non-conventional Energy Sources, Government of West Bengalhttp://wbpower.nic.in/sidra.htm, as viewed on April 2, 2013
3. Anon, ‘Achievements’, Ministry of new and renewable energy,http://www.mnre.gov.in/ mission-and-vision-2/achievements/ website,as viewed on March 25, 2013
4. Anon, ‘(Draft) Twelfth Five Year Plan 2012-2017: Economic SectorsVolume 2’, Planning Commission, p. 194, http://planning-commission.gov.in/plans/planrel/12thplan/pdf/vol_2.pdf, as viewed onApril 10, 2013
5. MNRE further classifies plants up to 100 kW as ‘micro-hydro’ andplants between 100 kW and 2 MW as ‘mini-hydro’, http://www.mnre.gov.in/schemes/grid- connected/small-hydro/, as viewed on April 2,2013
6. T Abbasi and S A Abbasi 2011, ‘Small hydro and the environmentalimplications of its extensive utilization’, Renewable and SustainableEnergy Reviews 15, 2011
7. Site visits by CSE researcher in Uttarakhand, January 20138. Analysis by CSE researcher on the line diagram of the Nagarjuna hydro
project9. Jed Brown et al 2013, ‘Fish and hydropower on the U.S. Atlantic coast:
failed fisheries policies from half-way technologies’, ConservationLetters, January 16, 2013
10. Nachiket Kelkar, ‘Thirsty Rivers, Bygone Fishes, Hungry Societies’,South Asia Network Dams, Rivers and People, http://sandrp.in/rivers/Thirsty_Rivers_Bygone_Fishes_Hungry_Societies_Nachiket_Kelkar_Dec2012.pdf, as viewed on April 10, 2013
11. Dominique Egrea and Joseph C Milewski 2002, ‘The diversity ofhydropower projects’, Energy Policy 30 (2002) 1225–1230
12. George Ledec and Juan David Quintero 2003, ‘Good Dams and BadDams: Environmental Criteria for Site Selection of HydroelectricProjects’, Latin America and Caribbean Region SustainableDevelopment Working Paper 16, World Bank, November
13. Robert Goodland, 1995, How to distinguish better hydros from worse:the environmental sustainability challenge for the hydro industry, TheWorld Bank
14. Chris Lang 2001, ‘Strangling the life-source of millions: China damsthe Mekong’, World Rainforest Movement, WRM’s Bulletin Nº 46, May
15. Edward Goldsmith and Nicholas Hildeyard, ‘The effects of large-scalewater projects on fisheries’, as part of The Social and EnvironmentalEffects of Large Dams: Volume 1, Overview., January 1984http://www.edwardgoldsmith.org/1019/the-effects-of-large-scale-water-projects-on-fisheries/, as viewed on April 10, 2013
16. Anon 2011, Assessment of cumulative impact of hydropower projectsin Alaknanda and Bhagirathi basins up to Devprayag, Alternate HydroEnergy Centre, Indian Institute of Technology Roorkee, December.
17. Interview with Praveen Bhargav, Managing Trustee of Wildlife First andex member of National Board for Wildlife, Bangalore, February 19,2013
18. Planning and design of Asiganga-II and Asiganga-III small hydro powerstations for tandem operation, http://2010.hidroenergia. eu/pdf/4B.06.pdf, as viewed on April 15, 2013
19. The usage of three lean months seem to be standard; it is however notmentioned in the hydro power policy of the state: (see clause xxxivhttp://ireda.gov.in/writereaddata/compendium/HP/HPper cent20percent20SHPupper cent20toper cent205per cent20MW-03.pdf )
20. Computed from 1994 data of Balloki and Sidhani headworks for threemonths of highest flow compared to three months of lowest flow,Waqar A Jehangir, Asad Sarwar Qureshi and Nazim Ali, ‘ConjunctiveWater Management in the Rechna Doab: An Overview of Resourcesand Issues’, IWMI, 2002 http://www.iwmi. cgiar.org/Publications/Working_Papers/working/WOR48.pdf
21. R Kaur and T Kendall, ‘Myth of power’, Down To Earth, September15, 2008, http://www.downtoearth.org.in/ node/4975
22. Anon, Karnataka Renewable Energy Policy 2009-14, KREDL
23. Shreekantha, ‘Sahyadri e-news: Issue XVII’, Energy & WetlandsResearch Group, Centre for Ecological Sciences, IISc Bangalore,http://www.ces.iisc.ernet.in/biodiversity/sahyadri_enews/newsletter/issue17/main_index.htm, accessed on April 11, 2013
24. T P Nijish, ‘Endangered fish found in Western Ghats’, The Times ofIndia, November 30, 2012, http://articles.timesofindia. indiatimes.com/2012-11-30/kozhikode/ 35483954_1_ralf-britz-aquarium-fish-puffer
25. Anon, ‘Small Hydro’, Karnataka Renewable Energy Development Ltd.http://www.kredltest.in/hydroreport.aspx, accessed on April 11, 2013
26. Anon, ‘Dario urops: a new fish species from the Western Ghats’,Zoospooks, June 14, 2013, http://ichthy. wordpress.com/2012/06/14/dario-urops-a-new-fish-species-from-the-western-ghats/
27. Latha Anantha and Parineeta Dandekar, ‘15 MW Barapole Small HydelProject coming up in Western Ghats Biodiversity Hotspot, does notdeserve CDM Credits’, SANDRP, http://cdm.unfccc.int/ filestorage/q/z/JGLGXCFT76Q92TZCSLILZ7I9OTT816.pdf/Commentpercent20submittedper cent20byper cent20SANDRP.pdf?t= R218bWwzNWd0fDDizbFHRQoLaAXn—eo9zJM
28. Biju Govind, ‘New freshwater fishes found in Western Ghats’, TheHindu, October 30, 2010, http://www. hindu.com/2010/10/30/stories/2010103059770400.htm
29. Stanley Pinto, ‘Expert pushes for more research in Western Ghats’, TheTimes of India, March 30, 2012, http:/ /timesofindia.indiatimes.com/city/mangalore/Expert-pushes-for-more-research-in-Western-Ghats/articles how/19290357.cms
30. Interview with Professor Renee Borges at IISc Bangalore, BangaloreFebruary 18, 2013
31. Pinaki Roy, ‘Hilsa may go for good’, The Daily Star, July 25, 2012,http://cmsdata.iucn.org/downloads/wedne_ sday_1.pdf
32. Sanjay Kumar, ‘Himalayan dam-building threatens endemic species’,New Scientist, December 21, 2012, http://www. newscientist.com/article/dn23033-himalayan-dambuilding-threatens-endemic-species.html
33. Parineeta Dandekar, Damaged Rivers, Collapsing Fisheries: Impacts ofDams on riverine fisheries in India’, SANDRP, September 2012ht tp : / / s and rp . i n /dams / Impac t s_o f_Dams_on_R i ve r i ne_Fisheries_in_India_ParineetaDandekar_Sept2012.pdf
34. K L Seghal, ‘Coldwater fish and fisheries in the Indian Himalayas: riversand streams’, http://www.fao.org/ docrep/003/x2614e/x2614e04.htm,accessed on April 12, 2012
35. Gerd Marmulla ed, ‘Dams, fish and fisheries: Opportunities, challengesand conflict resolution’, http://www. friendsofmerry meetingbay.org/cybrary/pages/20010000_UN_FAO_Dams,per cent20fishper cent20andper cent20 fisheries.pdf#page=6
36. Ibid37. Annual 12th Five Year Plan, Working Group on Fisheries and
Aquaculture38. Tyson R Roberts, ‘On the river of no returns: Thailand’s Pak Mun dam
and its fish ladder’, NAT. HIST. BULL. SIAM SOC. 49: 189-230. 2001http://www. thaiscience.info/journals/ Article/Onper cent20thepercent20riverper cent20ofper cent20noper cent20returnspercent20thailandsper cent20pakper cent20 munper cent20dampercent20andper cent20itsper cent20fishper cent20ladder.pdf
39. Upali Ananda Amarasinghe, Tushaar Shah and R P S Malik, StrategicAnalyses of the National River Linking Project (NRLP) of India,International Water Management Institute, 2009, Colombo, Sri Lanka
40. Interview with KREDL senior officer of hydro power at KREDL office inBangalore, February 18, 2013
41. CSE field study, February 2012, visiting IPCL, Nagarjuna Hydro EnergyProject, Paschim Hydro Energy project and Maruthi Gen Hydro project.
42. Anon, KERC Thirteenth Annual Report 2011-1243. This is calculated considering 30 per cent CUF for 900 MW of SHP
installed in Karnataka. This is a good approximation based ongeneration analysis for all the projects during 2011 and 2012.
44. Parineeta Dandekar, ‘Impacts of Dams on Biodiversity: Need for UrgentCollaborative Action’, SANDRP, December 2012, http://sandrp.in/rivers/Damned_Biodiversity_Presentation_Indian_Biodiversity_Congress_December2012.pdf
45. CSE field study, February 2012, visiting IPCL, Nagarjuna Hydro EnergyProject, Paschim Hydro Energy project and Maruthi Gen Hydro project.
References
46. Discussion with forest officials of Sakleshpur taluk and with engineersof IPCL and Nagarjuna Hydro projects
47. Interview with Dr T V Ramachandra, IISc Bangalore, February 18, 201348. Anon, ‘Mining, encroachment major threat to Western Ghats: IUCN’,
Business Standard, December 24, 2012, http://www. business-standard.com/article/pti-stories/mining-encroachment-major-threat-to-western-ghats-iucn-112122400454_1.html
49. Anon, ‘Proceedings of the meeting with regard to implementation ofworks related to Mini Hydel Power Project & Wind Power Projects andStone Quarrying activities in the Western Ghats under thechairmanship of Principal Secretary to Government, ForestEnvironment and Ecology Department on 23.06.2011 at 11.30 AM’,Government of Karnataka
50. Abhinav Goyal, ‘Kerala overlooks environmental aspects of proposedsmall hydropower plants’, Down To Earth, March 29, 2013,http://www.downtoearth.org.in/content/kerala-overlooks-environmental-aspects-proposed-small-hydropower-plants
51. Interview and site visits to Gundia area with Kishor Kumar, president,Malenadu Janapara Horata Samiti, Sakleshpur taluk and Gundia,Hassan district, February 21-22, 2013
52. Interview with R Rudraiah, managing director, Karnataka NeeravariNigam Limited, Bangalore, February 28, 2013
53. Anon, ‘Per Capita Power Consumption’, Press Information Bureau,May 18, 2012, http://pib.nic.in/newsite/erelease.aspx? relid=84206(note that these figures are three years old)
54. 2011 census source: http://www.censusindia.gov.in/ 2011-prov-results/paper2/data_files/karnataka/3-figure-7.pdf
55. Analysis by CSE on the data available from MNRE56. Anon, Policy for harnessing renewable energy sources in Uttarakhand
with private sector/community participitation, 29.1.2008 57. Performance Audit of Hydropower Development Through Private
Sector Participation, Uttarakhand for the year 2008-09, Comptrollerand Auditor General of India, http://cag.gov.in/ html/cag_reports/uttranchal/rep_2009/pa_cont.htm
58. Report of Working Group to advise WQAA on the minimum flows inthe rivers, Government of India, ministry of water resources, CentralWater Commission, July 2007.
59. Performance Audit of Hydropower Development Through PrivateSector Participation, Uttarakhand for the year 2008-09, Comptrollerand Auditor General of India
60. Ibid61. Anon, Report of the Inter-Ministerial Group on issues relating to River
Ganga, April 2013 62. This is based on field visits to Kaliganga I and II power plants during
the month of January 2013 and the EIA document63. Personal communication with Dr Arun Kumar, AHEC, IIT Roorkee
during January 201364. Interview with K Ramesh, senior officer, KREDL, Bangalore, January
18, 201365. Interview with Nagaraj, associate director, Fisheries Department,
Bangalore, February 28, 201366. Interview with R Rudraiah, managing director, Neeravari Nigam Ltd 67. Anon, ‘Government Order No. FEE 132 ECO 2011, Bangalore Dated
17.10.2012’, Government of Karnataka 68. No. FEE 137 ECO 2011 Issue of Environmental Clearance to M/S Flax
Hydro Energy (1.5 MW) - 03.11.2012/ No. FEE 121 ECO 2012 Issue ofEnvironmental Clearance to M/s Rising Sun Power (2 MW) -15.12.2012/ No. FEE 5 ECO 2011 Renewal of EnvironmentalClearance for Pioneer Power Corporation (24.75 MW) - 07.02.2011All obtained from Department of Ecology and Environment,Government of Karnataka, Bangalore, February 2013
69. Interview with senior scientific officer, Department of Ecology andEnvironment, Bangalore, February 20, 2013
70. Interview with K M Lingaraju, senior officer, Karantaka State PollutionControl Board, Bangalore, February 19, 2013
71. http://moef.nic.in/divisions/forcon/forms.htm, accessed on April 15,2013
72. Interview with Deputy Conservator of Forests, Karnataka ForestDepartment, Bangalore, February 19, 2013
73. Ibid
74. Anon, ‘Proceedings of the meeting with regard to imple mentation ofworks related to Mini Hydel Power Project & Wind Power Projects andStone Quarrying activities in the Western Ghats under thechairmanship of Principal Secretary to Government, ForestEnvironment and Ecology Department on 23.06.2011 at 11.30 AM’,Government of Karnataka
75. Discussion with Executive Engineer, Uttarakhand Jal Vidyut Nigamlimited (UJVNL), Dehradun, Uttarakhand
76. The CAG audit sample has seven SHP projects of the eight projectconsidered. Performance Audit of Hydropower Development ThroughPrivate Sector Participation, Uttarakhand for the year 2008-09,Comptroller and Auditor General of India
77. Anon, ‘Terms of Reference for the Preparation of EnvironmentalImpact Assessment [EIA] Report and Environment Management Plan[EMP] On Hydro Electric Projects for Consideration by State ExpertAppraisal Committee in Himachal Pradesh’, MoEF
78. South African National Environmental Management Act (1998),Government of South Africa, http://www.info. gov.za/view/DownloadFileAction?id=70641
79. Anon, ‘List of activities and competent authorities identified in terms of section 24 and 24(d) of NEMA 1998’, Department of Environmental Affairs and Tourism, April 21, 2006,http://www.enviroleg.co.za/acts/Nationalper cent20Environmen talpercent20Management/REGS/ 387-06per cent20Listper cent20ofpercent20Activitiesper cent20andper cent20Competent percent20Authorities.pdf
80. http://www.dwaf.gov.za/Documents/Legislature/ nw_act/NWA.pdf81. http://www.moef.nic.in/legis/water/wat1c5.html
Box: Two projects on paper, one on the ground: how to avoid EIA inKarnataka1. Interview with senior official, Karnataka Forest Department,
Bangalore, February 28, 20132. Project Design Document for 24.75-MW Ranganathaswamy Mini
Hydel Project, Karnataka, India3. Anon, ‘Small Hydro’, Karnataka Renewable Energy Development Ltd,
http://www.kredltest.in/hydroreport.aspx, accessed on April 11, 20134. Interview and site visits to Maruthi plant with Kishor Kumar, president
Malenadu Janapara Horata Samiti and Forest Department officials,Sakleshpur taluk, Hassan district, February 21, 2013
5. Sanjay Gubbi, ‘Gone Missing’, December 21, 2011, http://sanjaygubbi.blogspot.in/2011_12_01_archive.html
6. Panduranga Hegde, G L Janardhana and Parineeta Dandekar, "Haltsmall hydel projects pending review, regulatory mechanism’, ESC,SANDRP, SWGM, August 8, 2012
7. Site visit on February 23, 2013 (access to the plant was denied)8. Anon, ‘Small Hydro’, Karnataka Renewable Energy Development Ltd,
http://www.kredltest.in/hydroreport.aspx, accessed on April 11, 2013
Box: The Boston Mini-Hydro project on the As river1. http://aurecon.webfoundryza.com/assets/files/Boston%20Hydro/ EIR_
Draft_21092011%20Ver%200%202_No%20Images.pdf, accessedon April 29, 2013
2. Anon, ‘Environmental impact assessment for Dhamwari Sunda HEProject’, International Testing Centre, http://moef.nic.in/ divisions/iass/Ex-Sum_Dham.pdf
Annexure 1: The economics of small hydro power in Uttarakhand1. Investopedia2. Investopedia3. Vanala small scale hydro power Validation report available at UNFCCC
website, http://cdm.unfccc.int/Projects/DB/SGS-UKL1300101472.3/view, accessed on May 15, 2013
4. Information received through Right to information Act, 2005 fromUttarakhand Power Corporation Limted (UPCL) and Himurja, theproject developer
5. Appendix 2-IRR Vanala 15 MW, available online https://cdm.unfccc.int/Projects/DB/SGS-UKL1300101472.3/view accessed on May 15, 2013;Bhilangana tariff figure assumed from UERC Regulation, 2006
32 GREEN NORMS FOR GREEN ENERGY: SMALL HYDRO POWER
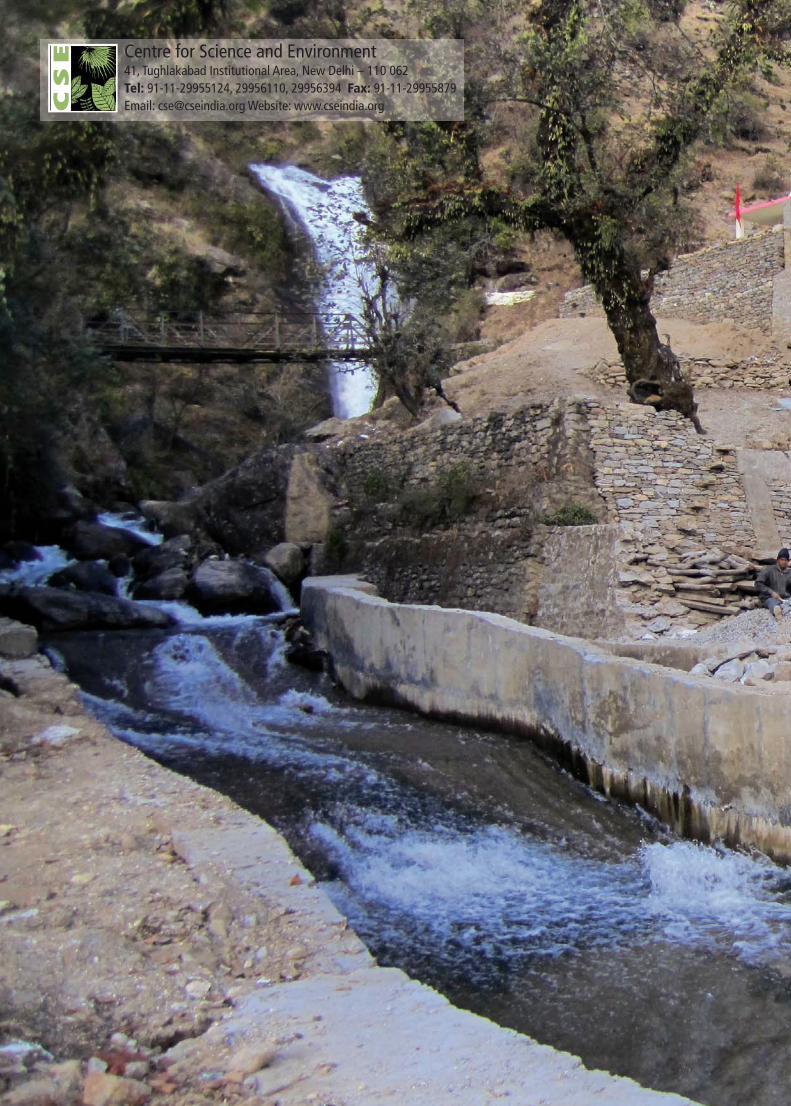
GREEN NORMS FOR
GREEN ENERGY
SMALL HYDROPOWER
Centre for Science and Environment41, Tughlakabad Institutional Area, New Delhi – 110 062Tel: 91-11-29955124, 29956110, 29956394 Fax: 91-11-29955879Email: [email protected] Website: www.cseindia.org


![Mersey Valley Processing Centre [MVPC] Shell Green](https://img.pdfslide.us/doc/110x75/61e37d272a7cd0201c51cd7b/mersey-valley-processing-centre-mvpc-shell-green-.jpg)