Embed Size (px)
Citation preview
1
Centre for Science and Environment
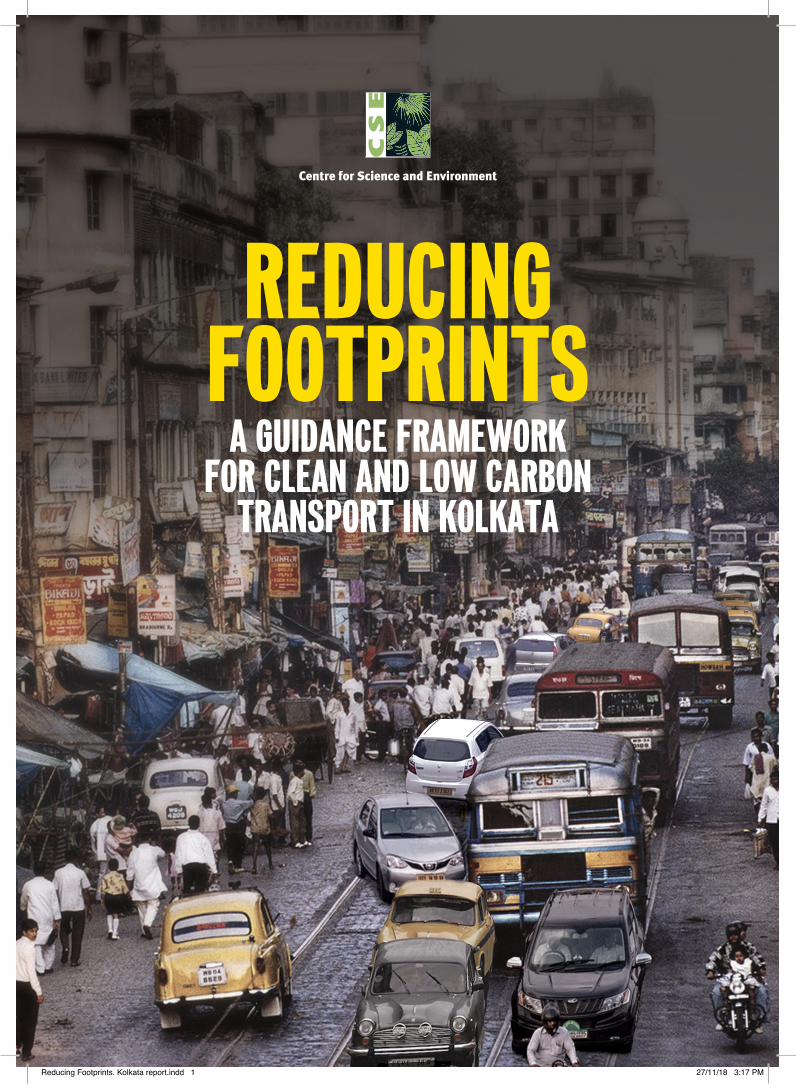
REDUCING FOOTPRINTS
A GUIDANCE FRAMEWORK FOR CLEAN AND LOW CARBON
TRANSPORT IN KOLKATA
Reducing Footprints. Kolkata report.indd 1 27/11/18 3:17 PM
Research direction: Anumita Roychowdhary
Writers: Anannya Das, Gaurav Dubey and Usman Nasim
Editor: Tanya Mathur
Design and cover: Ajit Bajaj
Production: Rakesh Shrivastava, Gundhar Das
© 2018 Centre for Science and Environment
Material from this publication can be used, but with acknowledgement.
Citation: Anumita Roychowdhary, Anannya Das, Gaurav Dubey and Usman Nasim 2018, Reducing Footprints: A Guidance Framework for Clean and Low Carbon Transport in Kolkata, Centre for Science and Environment, New Delhi
Published byCentre for Science and Environment41, Tughlakabad Institutional AreaNew Delhi 110 062Phones: 91-11-29955124, 29955125, 29953394Fax: 91-11-29955879E-mail: [email protected] Website: www.cseindia.org
Printed at Multi Colour Services
We are grateful to MacArthur Foundation for providing institutional support in preparing this document
Reducing Footprints. Kolkata report.indd 2 27/11/18 3:17 PM
Centre for Science and Environment
REDUCING FOOTPRINTS
A GUIDANCE FRAMEWORK FOR CLEAN AND LOW CARBON
TRANSPORT IN KOLKATA
Reducing Footprints. Kolkata report.indd 3 27/11/18 3:17 PM

Reducing Footprints. Kolkata report.indd 4 27/11/18 3:17 PM
5
REDUCING FOOTPRINTS: A GUIDANCE FRAMEWORK FOR CLEAN AND LOW CARBON TRANSPORT IN KOLKATA
Contents
1. Introduction 6
2. Challenges 7 2.1 Meeting clean air targets in Kolkata 72.2 Increase in heat-trapping global warming gases
due to motorization 9
3. Opportunities 133.1 Compact city design 133.2 Impressive share of public transport, walking and cycling 13
4. Thedirectionofchange 154.1 Public transport 154.2 Reinventing tram 184.3 Multi-modal system 194.4 Walkability 204.5 Para-transit: Autos and taxis 224.6 Promote transit-oriented design 254.7 Parking policy for travel demand management 26
5. Guidanceframework 345.1 Public transport and multi modal integration 345.2 Non-motorized transport and safe access 365.3 Intermediate Public Transport (IPT) 385.4 Vehicle restraint measures 395.5 Road infrastructure 415.6 Freight transportation 415.7 Passenger transportation 425.8 Management of in-use emissions from on-road vehicles 425.9 Traffic management 425.10 Need for traffic impact assessment 435.11 Water transport 435.12 Financing of public transport 435.13 Improve capacity 435.14 Research, development and technology upgrade 445.15 Need for public awareness and cooperation 44
References 45
Reducing Footprints. Kolkata report.indd 5 27/11/18 3:17 PM
6
Road vehicle emissions are one of the most major sources of human exposure to air pollution. To curb the impact of pollution caused due to urban commuting, it is important to implement city-centric actions. Cities, sub-centers and growing urban nodes demand immediate mobility and transportation strategies for a livable, sustainable and energy-efficient future. It is essential that each city contributes towards the target of meeting clean air standards and the national target for Intended Nationally Determined Contributions (INDC) of reducing greenhouse gas emission intensity by 33–35 per cent by 2030.
Currently, the situation in Kolkata is extremely grim. In spite of its several advantages over other metro cities—high use of public transport, share of walk trips, and compactness of its urban form—Kolkata’s strength can get eroded if the issue of urban pollution is not recognized and dealt with in time.
Kolkata represents an important learning curve for bigger cities of West Bengal and other states. Centre for Science and Environment (CSE) has developed a deeper understanding of the challenges and opportunities important to implement a successful action plan across the urban landscape of West Bengal.
INTRODUCTION
Reducing Footprints. Kolkata report.indd 6 27/11/18 3:17 PM
7
REDUCING FOOTPRINTS: A GUIDANCE FRAMEWORK FOR CLEAN AND LOW CARBON TRANSPORT IN KOLKATA
CHALLENGESMEETING CLEAN AIR TARGETS IN KOLKATA
The objective of air quality monitoring and management is to meet clean air standards. According to the air quality index (AQI) of the Central Pollution Control Board (CPCB), the quality of air is considered good when the levels are 50 per cent below the National Air Quality Standards. But to be able to achieve the standards—or a good air quality benchmark—within a given time frame, cities need to set their goals now. The problem of air pollution is growing in Kolkata with several pollution hotspots proliferating across the city.
Based on the WHO standards, Kolkata would need to reduce the annual average PM10 by 98 per cent from the current baseline—which is the average for the years 2014–16—to meet the annual average standards. The annual average levels of Nitrogen dioxide (NO2) in Kolkata will also have to be reduced by 35 per cent. It is significant to sustain this target reduction and meet the annual average ambient air quality standards over time, as it will define the level of stringency in actions to achieve clean air.
Highexposuretotoxicvehicularfumes:According to the 2008 Comprehensive Mobility Plan (CMP) of Kolkata , around 70 per cent of the city’s 18 million inhabitants suffer from respiratory problems such as asthma and lung cancer. These issues are caused by pollution from the city’s chaotic transport sector. Studies carried out by Chittaranjan National Cancer Research Institute have found that more than 60 per cent children in Kolkata have lung function impairments compared to 24 per cent in cleaner areas. Healthy individuals and non-smokers also show respiratory symptoms and lung function impairments.
While there is a need for stringent action against all sectors including industry, trash burning, construction dust and road dust among others to meet clean air targets, vehicles need special attention. Scientists now assess how different sources of pollution influence our health depending on the proximity to those sources. In terms of actual exposure, people are more vulnerable to vehicular fumes than other sources of pollution.
In densely populated cities, more than 50–60 per cent of the population lives or works near the roadsides, where the impact of vehicular emissions is highest. The population-weighted intake fraction, or the grams of vehicle pollution inhaled per grams of vehicle pollution emitted in Kolkata, is four times higher than the world average—highest among all the key Indian metro cities, according to a study by the scientists of University of California, Berkeley.
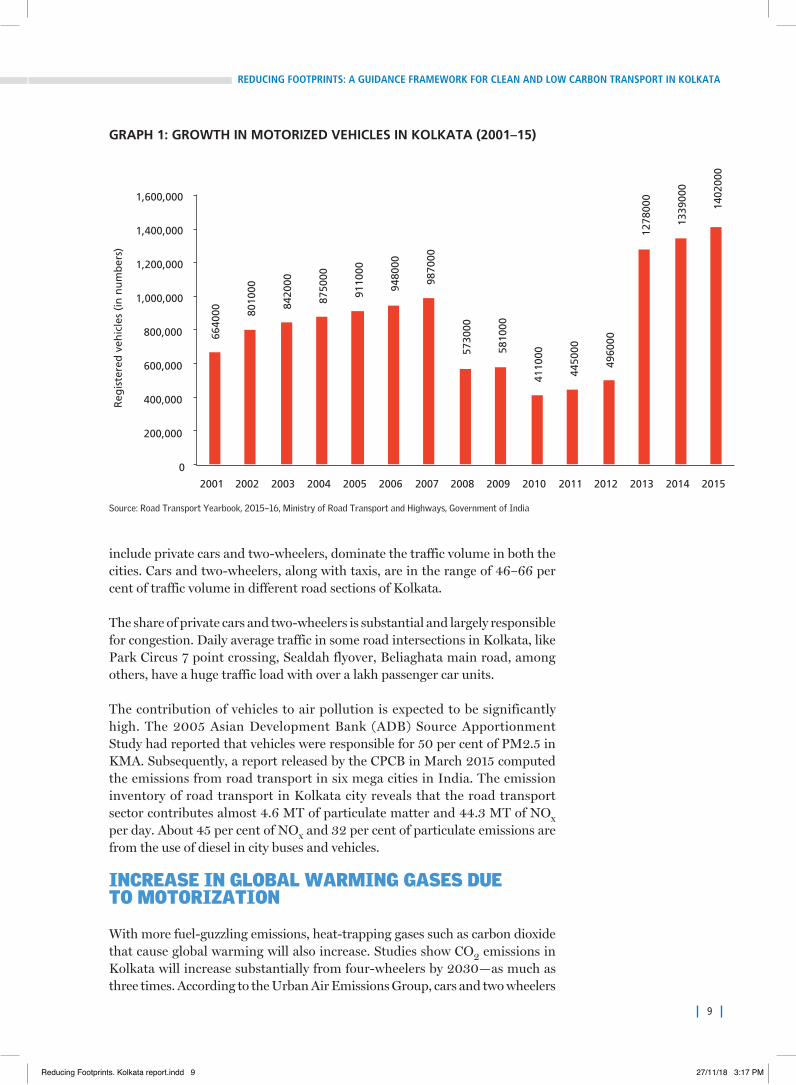
Rapidmotorization:The data available from the Road Transport Yearbook of the Ministry of Road Transport and Highways highlights distinct trends in vehicle registration in Kolkata since 2001 (see Graph 1: Growth in motorized vehicles in Kolkata). During the initial stages (2001–2007), vehicle registration in Kolkata grew at an annual average growth rate of 6.3 per cent. During 2007
Reducing Footprints. Kolkata report.indd 7 27/11/18 3:17 PM
8
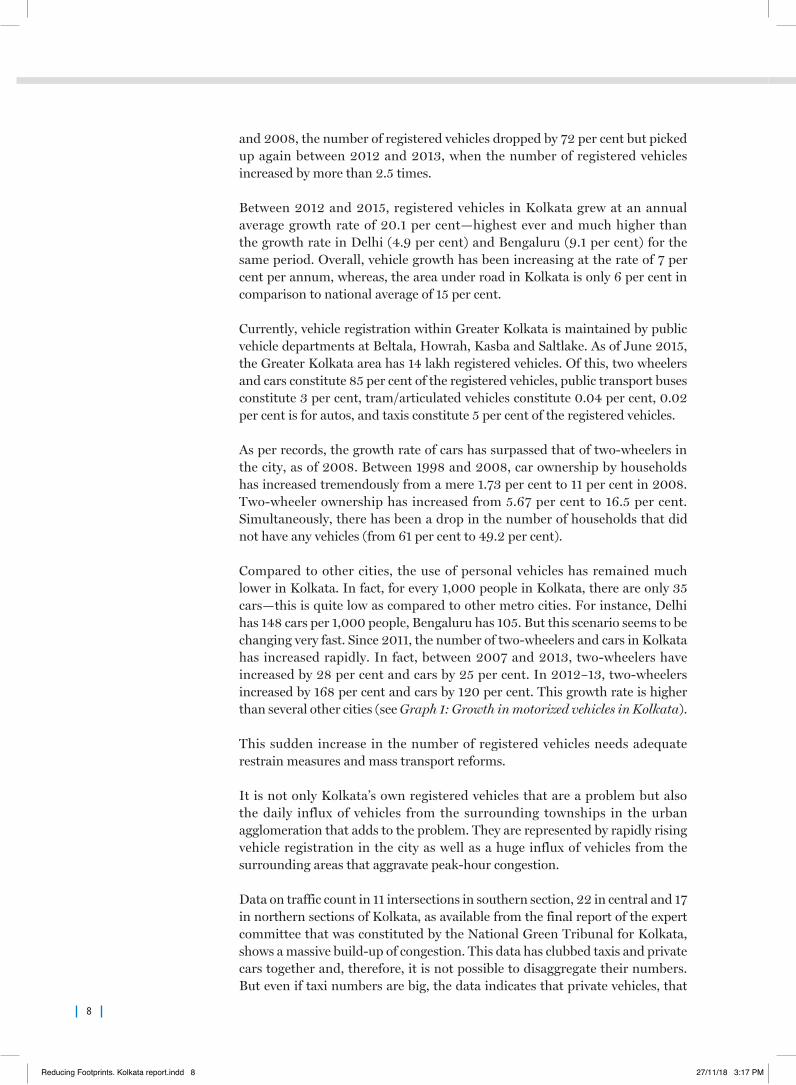
and 2008, the number of registered vehicles dropped by 72 per cent but picked up again between 2012 and 2013, when the number of registered vehicles increased by more than 2.5 times.
Between 2012 and 2015, registered vehicles in Kolkata grew at an annual average growth rate of 20.1 per cent—highest ever and much higher than the growth rate in Delhi (4.9 per cent) and Bengaluru (9.1 per cent) for the same period. Overall, vehicle growth has been increasing at the rate of 7 per cent per annum, whereas, the area under road in Kolkata is only 6 per cent in comparison to national average of 15 per cent.
Currently, vehicle registration within Greater Kolkata is maintained by public vehicle departments at Beltala, Howrah, Kasba and Saltlake. As of June 2015, the Greater Kolkata area has 14 lakh registered vehicles. Of this, two wheelers and cars constitute 85 per cent of the registered vehicles, public transport buses constitute 3 per cent, tram/articulated vehicles constitute 0.04 per cent, 0.02 per cent is for autos, and taxis constitute 5 per cent of the registered vehicles.
As per records, the growth rate of cars has surpassed that of two-wheelers in the city, as of 2008. Between 1998 and 2008, car ownership by households has increased tremendously from a mere 1.73 per cent to 11 per cent in 2008. Two-wheeler ownership has increased from 5.67 per cent to 16.5 per cent. Simultaneously, there has been a drop in the number of households that did not have any vehicles (from 61 per cent to 49.2 per cent).
Compared to other cities, the use of personal vehicles has remained much lower in Kolkata. In fact, for every 1,000 people in Kolkata, there are only 35 cars—this is quite low as compared to other metro cities. For instance, Delhi has 148 cars per 1,000 people, Bengaluru has 105. But this scenario seems to be changing very fast. Since 2011, the number of two-wheelers and cars in Kolkata has increased rapidly. In fact, between 2007 and 2013, two-wheelers have increased by 28 per cent and cars by 25 per cent. In 2012–13, two-wheelers increased by 168 per cent and cars by 120 per cent. This growth rate is higher than several other cities (see Graph 1: Growth in motorized vehicles in Kolkata).
This sudden increase in the number of registered vehicles needs adequate restrain measures and mass transport reforms.
It is not only Kolkata’s own registered vehicles that are a problem but also the daily influx of vehicles from the surrounding townships in the urban agglomeration that adds to the problem. They are represented by rapidly rising vehicle registration in the city as well as a huge influx of vehicles from the surrounding areas that aggravate peak-hour congestion.
Data on traffic count in 11 intersections in southern section, 22 in central and 17 in northern sections of Kolkata, as available from the final report of the expert committee that was constituted by the National Green Tribunal for Kolkata, shows a massive build-up of congestion. This data has clubbed taxis and private cars together and, therefore, it is not possible to disaggregate their numbers. But even if taxi numbers are big, the data indicates that private vehicles, that
Reducing Footprints. Kolkata report.indd 8 27/11/18 3:17 PM
9
REDUCING FOOTPRINTS: A GUIDANCE FRAMEWORK FOR CLEAN AND LOW CARBON TRANSPORT IN KOLKATA
include private cars and two-wheelers, dominate the traffic volume in both the cities. Cars and two-wheelers, along with taxis, are in the range of 46–66 per cent of traffic volume in different road sections of Kolkata.
The share of private cars and two-wheelers is substantial and largely responsible for congestion. Daily average traffic in some road intersections in Kolkata, like Park Circus 7 point crossing, Sealdah flyover, Beliaghata main road, among others, have a huge traffic load with over a lakh passenger car units.
The contribution of vehicles to air pollution is expected to be significantly high. The 2005 Asian Development Bank (ADB) Source Apportionment Study had reported that vehicles were responsible for 50 per cent of PM2.5 in KMA. Subsequently, a report released by the CPCB in March 2015 computed the emissions from road transport in six mega cities in India. The emission inventory of road transport in Kolkata city reveals that the road transport sector contributes almost 4.6 MT of particulate matter and 44.3 MT of NOx per day. About 45 per cent of NOx and 32 per cent of particulate emissions are from the use of diesel in city buses and vehicles.
INCREASE IN GLOBAL WARMING GASES DUE TO MOTORIZATION
With more fuel-guzzling emissions, heat-trapping gases such as carbon dioxide that cause global warming will also increase. Studies show CO2 emissions in Kolkata will increase substantially from four-wheelers by 2030—as much as three times. According to the Urban Air Emissions Group, cars and two wheelers
GRAPH 1: GROWTH IN MOTORIZED VEHICLES IN KOLKATA (2001–15)
6640
00
8010
00
8420
00
8750
00
9110
00
9480
00
9870
00
Reg
iste
red
veh
icle
s (i
n n
um
ber
s)
5730
00
5810
00
4110
00
4450
00
4960
00
1278
000
1339
000
1402
000
0
200,000
400,000
600,000
800,000
1,000,000
1,200,000
1,400,000
1,600,000
2001 2002 2003 2004 2005 2006 2007 2008 2009 2010 2011 2012 2013 2014 2015
Source: Road Transport Yearbook, 2015–16, Ministry of Road Transport and Highways, Government of India
Reducing Footprints. Kolkata report.indd 9 27/11/18 3:17 PM
10
together use up about 40 per cent of the total transport energy consumption in Kolkata. If the dependence on personal vehicles continues to increase, transport oil consumption will increase thrice by 2030, with highest growth expected from four-wheelers. According to the SIM-air study of 2009, total transport energy consumption in Kolkata was about 1.6 mtoe in 2008, which is about 60 per cent of that in Delhi. For CO2, Kolkata emits 67 per cent less than Delhi.
Dieselized: A study carried out by the researchers of University of Kolkata in 2013 shows that in contrast to the national trend, new diesel cars cover 65 per cent of new car sales in Kolkata. Statistics have established the rising popularity of diesel cars. Diesel constitutes 45 per cent of the total oil consumption by car users in Kolkata. About 99 per cent of the commercial vehicles in Kolkata are diesel-driven; thus, Kolkata has earned the notoriety of diesel capital of India.
A study by the International Council for Local Environmental Initiatives-South Asia reveals that Kolkata consumes more diesel in the transportation sector than petrol. Diesel-run vehicles scientifically are very toxic and are branded as probable human carcinogen. Approximately 65 per cent of all vehicles and 99 per cent of all commercial vehicles are diesel-run. Even Bharat Stage-IV com-pliant vehicles have higher toxicity than the petrol counterpart. The irony is that diesel cars are legally allowed to emit more nitrogen oxides and particulate matter than petrol vehicles.
An ADB study estimates that large diesel buses account for nearly half of the ve-hicular particulate matter in Kolkata; hence, they are also the principal source of nitrogen oxides. National trend in dieselization shows that cars are growing to be a bigger diesel consuming segment in the coming days.
This is a very serious concern as the WHO has classified diesel emissions as class I carcinogen for its strong link with lung cancer—putting it in the same class as tobacco smoking. Diesel also contributes hugely to tiny particles and rising NOx levels in the city. Diesel particulates are class I carcinogen according to the WHO for its strong link with lung cancer. Diesel emissions not only harm human health but also contribute towards global warming and climate change. According to the International Panel on Climate Change (IPCC), the warming potential of black carbon is 16 times higher than carbon dioxide.
Highestcarbonfootprintsbycarusers:A car user in Kolkata has 6.5 times higher per capita carbon emissions—that is more heat-trapping than a two wheeler and 10.6 times higher than a bus user. Even a two-wheeler user’s carbon footprint is 1.6 times higher than a bus user in Kolkata. This is serious. Car users are contributing disproportionately higher carbon per capita than the public transport users. With growing automobile dependence this trend will worsen. Kolkata will be well-advised to adopt a transport policy that will help lower toxic pollution as well as global warming gases and fuel guzzling.
Both cars and two-wheelers occupy the maximum road space but carry just about 12 per cent of the daily trips in Kolkata. In general, the average occupancy of a car in Kolkata is 1.5 people, whereas, for buses it is 50-60 people. Thus, it equates to less road space and more passenger trips. Share of cars in the traffic
Reducing Footprints. Kolkata report.indd 10 27/11/18 3:17 PM
11
REDUCING FOOTPRINTS: A GUIDANCE FRAMEWORK FOR CLEAN AND LOW CARBON TRANSPORT IN KOLKATA
volume on key roads can be as much as 40 per cent, whereas, they meet only 4 per cent of the travel needs. In fact more cars on road directly results in a higher per capita carbon foot print.
Global policy approaches are directed to enhance and strengthen the mass transit system. Effective pricing of personal vehicles, parking pricing and other vehicle restraining measures should be adopted and enforced to regulate the per capita rise of personal vehicles.
Congestioncrisis: Cities are paying a very high price for congestion. Traffic jams lead to fuel wastage, more pollution and serious economic losses. Usual commuting time has increased significantly during peak hours. On many arterial roads, traffic volume has exceeded the designed capacity and the service level of the road.
According to the comprehensive mobility plan for Kolkata, almost 100 per cent of the roads in the city remain choked throughout the day; and 72 per cent of the roads in Kolkata have travel speed less than 20 kmph. A study by Switch ON shows that cars cater to only 6 per cent of the passengers but occupy 29 per cent of the total road space while buses serve 76 per cent of the population and occupy only 32 per cent of the total road space in Kolkata.
More studies show that delay on different corridors in Kolkata range from 20 minutes to about 60 minutes. Centre for Urban Economic Studies, University of Calcutta, has estimated that Rs 74,077.66 is lost in only two peak hours on a few selected roads daily. The annual loss in monetary terms would be as high as Rs 2.7 crore. This is unacceptable. A study by Maparu and Pandit, in 2010 also states that delay on different corridors in Kolkata ranges from 20 minutes to as high as 60 minutes. To deal with the current traffic situation, traffic police have been continuously prescribing travel demand management strategies within the metropolitan area. The increased use of private transportation is a major consumer of energy and degradation of environmental quality.
CMP for Kolkata in 2008 reported that 89 per cent of the roads have undivided carriage way, of which 35 per cent have less than three-lane configuration, and 40 per cent have four-lane configuration. As per studies, 65 per cent of the road network has a service level-D i.e. volume/capacity ratio of 0.8 that indicates high congestion. Traffic composition on major roads consists of 44.7 per cent private vehicles — 38.7 per cent cars and 6 per cent two-wheelers, followed by 26 per cent buses, 12 per cent autos, 5.3 per cent taxis, 3 per cent trams, 5 per cent heavy vehicles, and 4 per cent other vehicles. Due to an increased travel demand and stagnant growth of roads, the network speed was recorded to be less than 20 kmph. To manage peak-hour traffic within Kolkata, directional traffic movement for certain roads is altered.
A congestion study conducted by CSE in September 2017 affirms the fact that almost 100 per cent of the roads in Kolkata remain congested for most of the time. On an average day, the mean vehicular speed during morning peak hours and evening peak hours was recorded to be 16 kmph and 13.9 kmph, respectively; whereas, off-peak vehicular speed was recorded at 14 kmph. It
Reducing Footprints. Kolkata report.indd 11 27/11/18 3:17 PM
12
GRAPH 2: VEHICULAR SPEED IN MAJOR STREETS OF KOLKATA
14.8
9.8 9.0
14.6 14.6
25.7
15.2 13.2
9.7
12.4
0.0
5.0
10.0
15.0
20.0
25.0
30.0
Park
Str
eet
Co
lleg
e St
reet
BB
Gan
du
ly r
oad
Ras
hb
ari A
ven
ue
AG
C
Bro
adw
ay S
altl
ake
GT
Ro
ad H
ow
rah
Stra
nd
Ro
ad
Shak
esp
eare
Sra
ani
Cen
tral
ave
nu
e
kmp
h
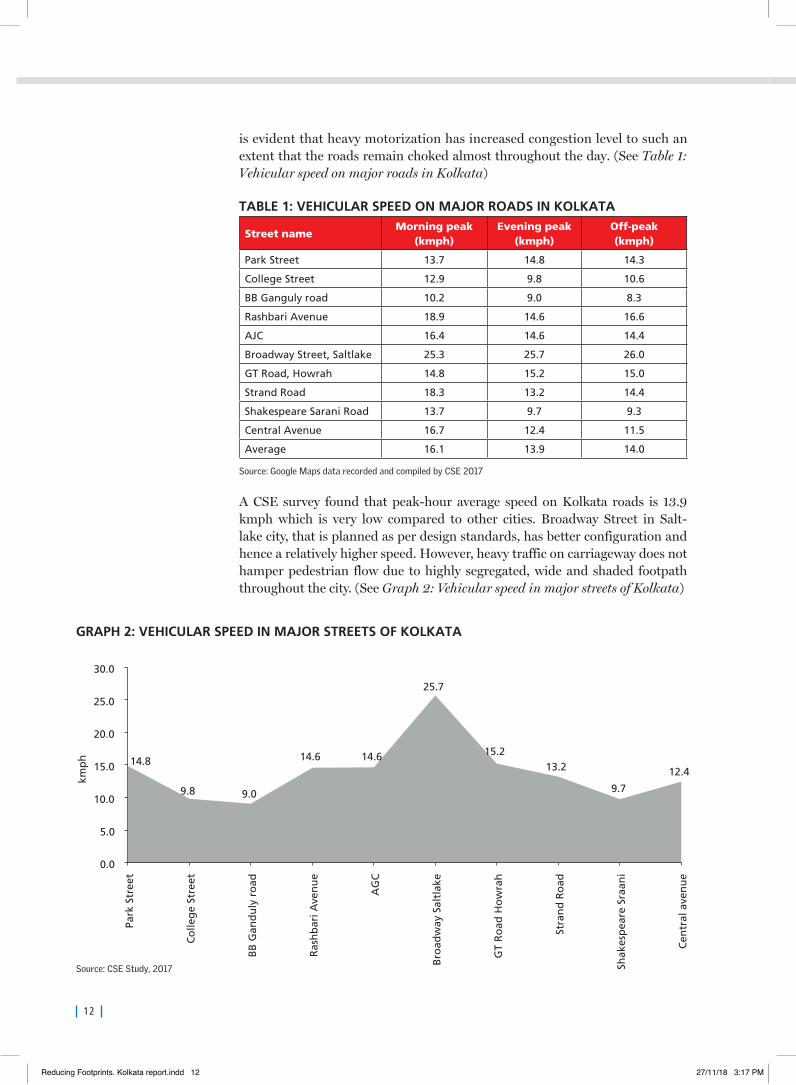
is evident that heavy motorization has increased congestion level to such an extent that the roads remain choked almost throughout the day. (See Table 1: Vehicular speed on major roads in Kolkata)
TABLE 1: VEHICULAR SPEED ON MAJOR ROADS IN KOLKATA
Street nameMorning peak
(kmph)Evening peak
(kmph)Off-peak (kmph)
Park Street 13.7 14.8 14.3
College Street 12.9 9.8 10.6
BB Ganguly road 10.2 9.0 8.3
Rashbari Avenue 18.9 14.6 16.6
AJC 16.4 14.6 14.4
Broadway Street, Saltlake 25.3 25.7 26.0
GT Road, Howrah 14.8 15.2 15.0
Strand Road 18.3 13.2 14.4
Shakespeare Sarani Road 13.7 9.7 9.3
Central Avenue 16.7 12.4 11.5
Average 16.1 13.9 14.0
Source: Google Maps data recorded and compiled by CSE 2017
A CSE survey found that peak-hour average speed on Kolkata roads is 13.9 kmph which is very low compared to other cities. Broadway Street in Salt-lake city, that is planned as per design standards, has better configuration and hence a relatively higher speed. However, heavy traffic on carriageway does not hamper pedestrian flow due to highly segregated, wide and shaded footpath throughout the city. (See Graph 2: Vehicular speed in major streets of Kolkata)
Source: CSE Study, 2017
Reducing Footprints. Kolkata report.indd 12 27/11/18 3:17 PM
13
REDUCING FOOTPRINTS: A GUIDANCE FRAMEWORK FOR CLEAN AND LOW CARBON TRANSPORT IN KOLKATA
Opportunities
COMPACT CITY DESIGN
While it is true that growing affluence increases automobile dependence, urban and road designs also help in keeping personal vehicle use lower. Among all key metro cities, Kolkata has one of the best urban forms—that is compact and close-knit with high street density. Kolkata has an organic structure that keeps the people in the center. Roads have been segregated with regard to their functionality and neighborhood. Kolkata roads have a dense street network with a different street hierarchy. The compact urban form of Kolkata keeps the length of the trips short and accessible on foot.
As much as 31 per cent of the trips are in the distance range of 2–5 km, 29 per cent in 6–10 km range, and 22 per cent of the trips fall in the range of 0–1 km that can be easily covered on foot. Thus, 60 per cent of the trips generated in Kolkata are within a distance of 3 km, and 85 per cent of the trips are less than 10 km. An effective walking and cycling infrastructure, supported by public transport, can transform the city and reduce pollution and energy guzzling.
IMPRESSIVE SHARE OF PUBLIC TRANSPORT, WALKING AND CYCLING
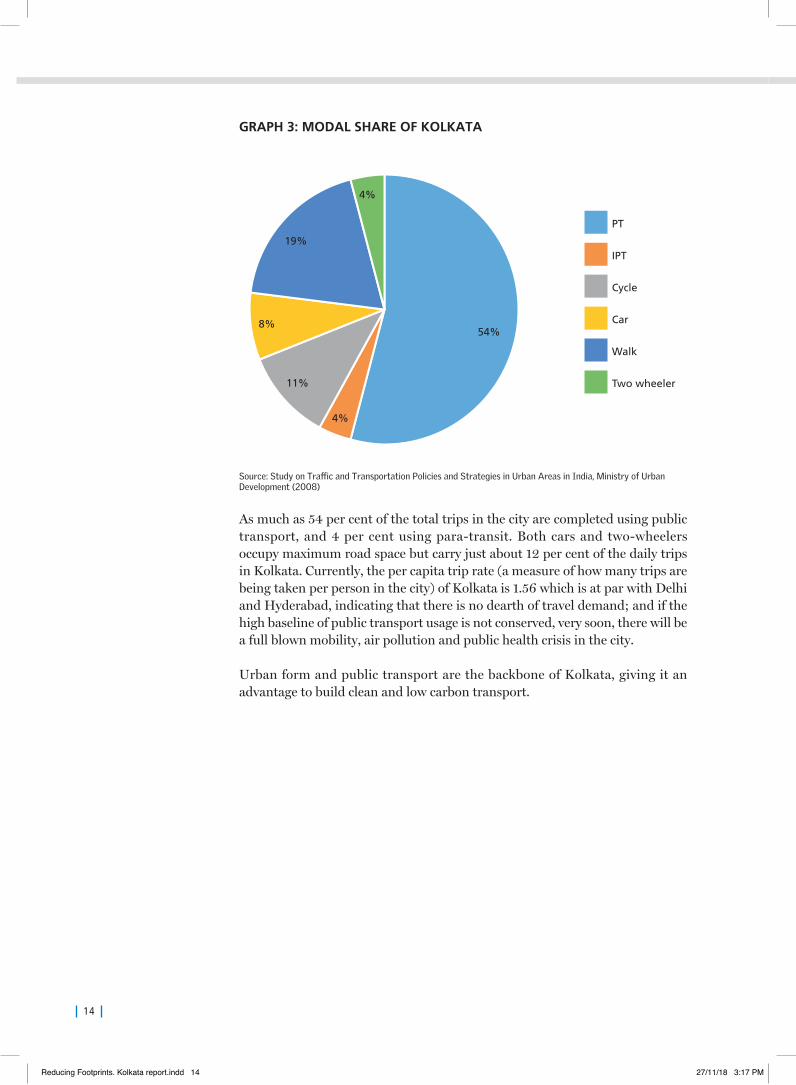
The share of people walking, cycling and using public transport in Kolkata, according to the Census 2011, is 89 per cent—highest among all metro cities in the country. This practice is considered good globally, and Kolkata needs to take pride in it. The walking, cycling and using public transport share is higher when compared with Delhi (70 per cent), Bengaluru (66 per cent) and Chennai (63 per cent). The mobility plan of Kolkata has set a target of 90 per cent share for public transport. With focused policy, Kolkata can meet this target easily. This city has the most diverse forms of public transport systems including metro, bus, tram, suburban rail and waterways. No other metro city has such diverse systems. But neglect and policy disdain are undermining this strength. The current declining trends will have to be reversed (see Graph 3: Modal share of Kolkata).
Evidently, Kolkata has the maximum share of walk trips—39 per cent, compared to other cities. More than one-fourth of the working population commutes on foot. Nearly half of the working population commutes by bus, bicycle, train and Intermediate Public Transport (IPT).
Share of trips by tram was 15 per cent in 1980, which reduced to less than 2 per cent by 2007. Trip share by government buses decreased from 15 per cent in 1980 to 11 per cent in 2007. Annual average growth rate of private buses has been at 11 per cent (in 2007), which indicates that the demand for public transport is being transferred to the private sector as the public sector is failing to step up and cater to the commuter’s demand.
Reducing Footprints. Kolkata report.indd 13 27/11/18 3:17 PM
14
GRAPH 3: MODAL SHARE OF KOLKATA
54%
4%
11%
8%
19%
4%
PT
IPT
Cycle
Car
Walk
Two wheeler
Source: Study on Traffic and Transportation Policies and Strategies in Urban Areas in India, Ministry of Urban Development (2008)
As much as 54 per cent of the total trips in the city are completed using public transport, and 4 per cent using para-transit. Both cars and two-wheelers occupy maximum road space but carry just about 12 per cent of the daily trips in Kolkata. Currently, the per capita trip rate (a measure of how many trips are being taken per person in the city) of Kolkata is 1.56 which is at par with Delhi and Hyderabad, indicating that there is no dearth of travel demand; and if the high baseline of public transport usage is not conserved, very soon, there will be a full blown mobility, air pollution and public health crisis in the city.
Urban form and public transport are the backbone of Kolkata, giving it an advantage to build clean and low carbon transport.
Reducing Footprints. Kolkata report.indd 14 27/11/18 3:17 PM
15
REDUCING FOOTPRINTS: A GUIDANCE FRAMEWORK FOR CLEAN AND LOW CARBON TRANSPORT IN KOLKATA
PUBLIC TRANSPORT
Kolkata has the most diverse range of public transport options encompassing road-, rail- and water-based transport systems such as buses, taxis, autos, ferry, metro rail, suburban rail, circular rail, rickshaw and man-pulled rickshaw. This substantial network now requires modernization, upgradation and system-integration. Currently, West Bengal Transport Corporation (WBTC) is largely responsible for the management of public transportation in the city, except the metro system which is managed by the Indian Railways.
The city mobility plan for Kolkata has set the goal of achieving public transport modal share of 90 per cent by 2025. Total ridership of all modes is expected to increase by 72 per cent. It is projected that even in 2025, among all prominent public transport modes like Metro, bus and ferry will meet more than half of all travel demand.
Busreforms:Buses that meet close to half of the travel demand are now under enormous pressure. Public transport strategy must aim for better frequency, reliability, and a speedy and comfortable service. Buses form the primary mode of public transport, even in areas where extensive rail systems exist. Buses are flexible and can reach closer to the residences and places of work, education, shopping and recreation.
Bus service in Kolkata is a hybrid system in which both state and private agencies provide the services. Private entities provide nearly 90 per cent of the bus transport services. Private buses are given license and permits by the Public Vehicles Department (PVD) to operate in specific areas and routes. A private bus service consists of a large number of passenger buses and minibus operators with a small fleet each (of one or two buses each) plying on routes as permitted by the PVD. The crawling speed in Kolkata’s congested roads affects the daily number of trips as buses lose time completing every trip.
Traditionally, different state transport undertakings provided bus services within different zones which were managed by the Calcutta State Transport Corporation (CSTC), Calcutta Tramways Company (CTC) and West Bengal Surface Transport Corporation (WBSTC). In the year 2016, all of them were merged under a single entity called the West Bengal Transport Corporation (WBTC). Along with the merger, the routes and services have also been rationalized and internal workings of the three organizations are being synchronized.
Bus system can be further reformed if service-level benchmark, with a clear regulatory framework and contract condition for service quality and performance for both state-run as well as privately-run systems, is adopted. The benchmark parameters related to service quality, frequency, headway, and load factor among others will have to be tracked regularly for monitoring and management.
The direction of change
Reducing Footprints. Kolkata report.indd 15 27/11/18 3:17 PM
16
Further reform of existing bus operations can provide significant benefits. Reforms can focus on (i) improvement in bus fleet and depots, (ii) planning of network and operation in a manner supported by scientific demand-based approach and projections, (iii) induction of central monitoring system for bus operations, (iv) Integrated Ticketing Scheme (ITS) systems can schedule, manage, operate and track bus services, (v) augmentation and construction of bus shelter as per standards instead of informal stops, (vi) further expansion of installation of Passenger Information System (PIS) boards at all bus shelters, and (vii) minimizing the number of transfers needed for most passengers.
According to the central guidelines on service-level benchmark, most bus stops, given the frequency of service, should have buses coming in at intervals of every 4–5 minutes.
Kolkata Transport Card is a single mobility card that integrates all buses of the corporation. This ticketing system will integrate all modes of transportation in Kolkata. The Kolkata Metro Rail has also agreed to join this initiative. The transport card was launched in March 2017, and currently includes only state-run transport buses operating in the city. Trams and ferries are also likely to join the ITS system by this year’s end.
The transport department also has plans of taking the ITS to the eastern and south-eastern railways providing commuters an option of non-cash payment across all transport systems. The ITS system has a tremendous potential to promote seamless travel, ensure transparency due to its electronic management, and generate enormous mobility data that can provide valuable inputs for further policy development related to transportation system. Having a single mobility card or smart card for all transport modes in the city will make it easier for the commuters to travel in public transport and make easy transfers.
Induction of ITS systems, for optimizing operations, is underway for overall WBTC. For now, CSTC is the only corporation using ITS systems to run bus scheduling, reporting and ticketing for its 1203 buses in 127 routes. Pathadisha, an app launched by the West Bengal government, provides information on the city bus system to the users.
Financingbustransport:Financing bus transport is emerging as one of the biggest barriers in the process of upscaling bus transport in all cities. A range of fiscal strategies are possible for gap financing as well as targeted subsidies for service-level improvement and affordability for all. Urban transport fund needs to be addressed immediately. Kolkata too needs a finance plan. This will require a multi-pronged strategy—including rationalization of the budgetary allocation, tax rationalization to reduce tax burden on buses, tapping revenues from advertisements and parkings etc., tax revenues from travel demand management measures (higher taxes on personal vehicles etc.), and cross subsidy from other sectors etc.
The city will also have to look at the non-conventional sources of revenue. These include tapping property rental along transit corridors, commercial
Reducing Footprints. Kolkata report.indd 16 27/11/18 3:17 PM
17
REDUCING FOOTPRINTS: A GUIDANCE FRAMEWORK FOR CLEAN AND LOW CARBON TRANSPORT IN KOLKATA
development in the terminals and depots, without compromising the core function of maintenance of bus fleet, parking of buses and workshops etc.
The finance model will have to lower the taxation burden on buses. Currently, the metro system enjoys tax concessions from both central and state governments. Comparatively, the buses pay a much higher share of taxes. Taxes can be a quarter of the bus operations and capital costs. These will have to be rationalized and lowered to reduce the overall costs. At the same time, subsidies will have to be made more target-linked to serve good quality and support low income groups, and not to cover operational inefficiencies.
There is a need for fare policy for public transport that is fair and transparent. Fares should be affordable and dynamic, and simultaneously fall in line with the market value. The fare policy must be same across all buses and must align with affordability and demand of other complimenting modes in order to boost multimodal fare integration. Electronic Ticketing Machines (ETMs) must be installed in all buses to ease fare collection, increase transparency, reduce fare leakage and maintain passenger revenue data of bus systems.
Developperformancemonitoringofbusoperationsandservices:Effective improvement in services will be possible only with a rigorous monitoring of service quality and assessment of user satisfaction. Periodic audits and surveys are needed to track performance. Transit agencies should be made responsible for generating and reporting this information and data. This will also need third party audits. A system will have to be devised for private bus operation.
Reorganizeprivatebusserviceproviders:The fuzzy part of the bus reform discussion in the city is the institutional reforms. While some initiatives have happened on reforming the state-run agencies, there is little clarity about the informal private sector that provides the bulk of the public transport services. There are references to cooperative model to reorganize the individual bus operators—but there is no roadmap yet.
Unplanned privatization is attracting small-time investors and leading to unproductive competition between state agencies and private operators. This reform will certainly be challenging, given the presence of such a huge number of bus operators. The state government will have to set strict regulations, performance standards, and overall coordination to ensure an integrated network of services. The small businesses will have to be reorganized on cooperative or corporate lines. The state government needs to set up a coordinating, regulatory body to immediately decide on the bus transport network structure, service quality criteria, pricing and fare structure, safeguards for the poor, and regulatory instrument to manage private operators.
Progressivesteptowardselectricbuses: Kolkata is among the few cities in the country that has taken the lead to procure ‘zero emissions’ electric bus fleet of 40 (under FAME India scheme) and has plans to expand the fleet for subsequent fleet renewal. This is an important step forward. Combining electric mobility with zero emissions vehicles can be a win-win strategy.
Reducing Footprints. Kolkata report.indd 17 27/11/18 3:17 PM
18
REINVENTING TRAM
Tram system has already given a heads up to Kolkata in road design that gives priority to public transport. But the sharp and progressive decline in trams due to lack of investments and modernization, and unreliable service is taking away from sustainable designs of road space. Trams will have to be an important part in the vision and solution for Kolkata.
Kolkata is the only Indian city to have a tram system. The tram is an articulated vehicle with a 2.1-metre width and 17.5-metre length. It has a seating capacity of 62 and a full load capacity of 200 passengers. The tram network consists of 269 vehicles and 25 routes (that expands along a 71-kilometre stretch) that are fixed on the carriage way.
There has been a 10-times drop in the number of passengers since 1970s. This heritage of extensive and dedicated public transport network in the core city area, that is also very well-integrated with at-grade pedestrian and other feeder systems, is the right model for any mass transit system that global cities are aspiring to achieve. This is also a unique example of integration of public transport with the city planning. The network penetrates deep into the compact city core and is within easy access from most residential and commercial areas. Tram system has already given a heads up to Kolkata in road design to keep the system unobstructed and out of congestion. This is exactly the principle that guides the bus rapid transit system.
There have been repeated attempts to dismantle the tram system over the years which now exist as a reminiscence of the heritage and operates only on two, out of the 25, scheduled tram routes. Tram operations in 23 routes are under suspension. The tram, once a popular mode of commuting, used to provide mobility to 6.8 lakh passengers that reduced to 2 lakh in the year 1993–94 and to approximately 20,000 passengers per day in August 2017.
Today, when global strategies and policies are directed to achieve a more dedicated space for public transport to meet the low carbon mobility need of the cities, revival of the tram system in Kolkata creates a necessary opportunity. This provides flexibility to operate along narrow lanes of the compact city of Kolkata. Tram works on the same principle that governs all public transport system i.e. dedicated right of way on road, at-grade access to the system, articulated vehicle with more capacity, and runs on zero carbon emission.
The tram system in Kolkata needs to be retrofitted with new planned network, structure and operations supported by new infrastructure and new technology on the basis of adequate demand management strategies. On the long term, tram has the capability to emerge as a successful public transport system that is modern, has high passenger capacity, at-grade, runs on dedicated ways, and can traverse through narrow lanes of Kolkata and fulfil low carbon needs of the city.
There is a need to rediscover opportunity in Tram operations in Kolkata. It is important to restructure the organization to operate, manage and augment tram services in the city. The prime objective of the organization should be to
Reducing Footprints. Kolkata report.indd 18 27/11/18 3:17 PM
19
REDUCING FOOTPRINTS: A GUIDANCE FRAMEWORK FOR CLEAN AND LOW CARBON TRANSPORT IN KOLKATA
lead other cities in India by example. Conduct SWOT analysis to identify gaps in the existing tram system, highlight strength and potential that would help tram emerge as a progressive reality for Kolkata. Conduct a public transport demand study and user perception study for tram operation and services. Augment existing tram infrastructure, services and operations with advanced technology and design. Fleet and network planning should align with the demand pattern and compliment other existing mobility options in the city. The organization should develop a central monitoring system to facilitate operations and management; and conduct timely training of crew members responsible for operating and managing tram services.
MULTIMODAL SYSTEM
MetrorailcorridorKolkata Metro operates as a zonal division for Eastern railways. Against the planned operation on three routes in the year 1972, the Kolkata metro still operates on a single route. It is a 27.22 kilometre corridor with 24 stations cutting across north and south Kolkata from Dum Dum to New Garia. The complete metro network consists of seven corridors, and the second corridor from east to west is expected to begin operations by 2019. The current fleet size of 27 trains and 5,404 coaches (2,744 AC and 2,660 non-AC coaches) operates on a single corridor network of 25 kilometres. The ridership has doubled since 2007 and carries around 6 lakh trips daily (till July 2017). Metro ridership has increased quite substantially in Kolkata—the Metro Rail has reported a 47.6 per cent increase in ridership in 2017.
Rail-basedpublictransportsystemKolkata is well-connected across other Indian cities with a well-linked railway network. The Eastern Railway division and South Eastern Railway division operates urban local suburban rail services and circular rail services to facilitate suburban passenger movement. Two major railway stations in Kolkata are Howrah and Sealdah. The rail lines are divided into the suburban railway (Eastern Railway line and South-Eastern Railway line) and circular railway line.
Suburbanrail:Kolkata suburban railway started in the year 1954. Suburban rail network is extensive with 12 corridors and 105 railway stations serving Kolkata metropolitan and few suburban areas. As of 2006, it carried around 17 lakh passengers on a regular weekday.
Chakrarail/circularrail:Circular rail, a division of the suburban railways, was built to ease road congestion that resulted with increasing population of the metropolis Kolkata. Till date, the circular rail is an urban transport in a loop rail network, meant to cater the central business districts (CBDs) of the twin cities of Howrah and Kolkata. It is a 21-kilometre loop with 13 stations and a terminal at Dum Dum junction. However, as of 2017, only partial loop is under operations with two-way services from Majerhat to Dum Dum, and vice versa. Currently, there are 16 trains running with a frequency of 40–50 minutes. As of 2017, suburban railway and circular railway ferries around 5.7 lakh passengers, contributing to 16 per cent of the passenger trips.
Reducing Footprints. Kolkata report.indd 19 27/11/18 3:17 PM
20
Ferryservice:The ferry service in Kolkata is operated by the Inland Water Transport Corporation (IWTC), a subsidiary of Transport Department, Government of West Bengal. It has a fleet size of 25, maintained by the West Bengal State Transport Corporation (WSBTC) and Hooghly Nadi Jalapath Paribahan Samabay Samity (HNJPSS). Currently, ferries are operated on nine routes from three depots. The ridership pattern has seen an increase from 4,5001 in 2009 to 8,7012 in 2017.
Integrate all modes of public transport Kolkata has an enormous advantage in its elaborate public transport infrastructure including, trams, suburban rail, bus system metro rail. An immediate multimodal integration of all these systems can be the permanent solution to its congestion and pollution.
Integrated multimodal system is needed to ensure seamless integration at the physical infrastructure, information and fare levels. It is essential to prioritize integration of public transport, para-transit, walking and cycling. This will require adoption of multimodal integration norms for station areas designed for physical integration of different systems.
Kolkata has started to take steps towards integration. A primary survey conducted by CSE has found that metro stations within the older line are well-integrated with bus stops along with an adequate supply of alternative modes like autos and cycle rickshaws to facilitate last-mile integration—a few stations also have taxi stands. However, a survey along the upcoming new metro line shows inadequate integration with bus stops, absence of planned IPT docking stands and unavailability of cycle rickshaws. This may lead to a chaotic situation in the future once operations begin. Multimodal integration is also observed at ferry docks on the Hooghly that can be easily accessed by suburban railway, bus stops and cycle rickshaws.
WALKABILITY
Kolkata’s compact structure makes it more walkable and cycle-friendly as 60 per cent of the city’s commuting trips are within 3–4 kilometres. Improved walkability is an opportunity to increase share of zero-emission trips as well as improve public transport usage. All public transport trips end and begin as walk trips. A perception survey conducted by Wilbur Smith as part of a study on ‘30 cities of India’ in 2008 shows that user opinion of pedestrian facilities in Kolkata is better than most other cities.
Walkability and safe access are critical aspects of urban mobility that is needed to scale up the use of sustainable modes of transport. CSE has carried out a rapid walkability survey of some of the major roads in Kolkata to understand the strength as well as see where further improvement is needed. These include about eight busy roads in Kolkata and one each in Howrah and Bidhannagar—Park Street, Rashbari Avenue, AJC Bose Road, Broadway Saltlake, GT Road Howrah, Strand Road, Central Avenue, College Street, BB Ganguly Road and Shakespeare Sarani. This ongoing audit has looked at the engineering design
Reducing Footprints. Kolkata report.indd 20 27/11/18 3:17 PM
21
REDUCING FOOTPRINTS: A GUIDANCE FRAMEWORK FOR CLEAN AND LOW CARBON TRANSPORT IN KOLKATA
and environmental features of the footpaths and crossings. All these roads have a very high footfall but they also face competing demand from vending and other street activities. But this also brings out the significance of active streets in Kolkata. The urban form has encouraged a strong walking culture.
Some of the preliminary findings show that in most of these streets it has been possible to maintain a minimum width of 1.8 metres for clear walking space and in many stretches the width can to 4–5 metres. These widths display good design features in terms of low curb height, gentle slope, and skid-resistant paving. It is encouraging that the width of the footpaths have been maintained and have not been chipped away to widen the carriageway. Typically, the footpaths on the streets in northern parts, including College Street and BB Ganguly Street, have the required width but have not been able to maintain clear walking space of 1.8 metres or more throughout their length. Across many stretches improved features are noticeable. Some stretches of Rashbari Avenue, AJC Bose Road, Broadway Saltlake and Central Park Street display improved features. These have pedestrian signals and adequate crossing facilities. But stretches in Strand road and Shakespeare Sarani do not always have adequate crossing facilities, pedestrian signals and well-designed transit stops.
Most of these roads have a guarded footpath with regular openings to carriageway at every 150–200 metres. Most intersections in Kolkata and Bidhannagar have zebra crossings at the intersections but not at midblock crossings. Streets in Howrah mostly lack designated pedestrian-crossing facilities. Pedestrian-crossing facilities need further improvement especially in terms of timer-based signals at intersections. At some signalized intersections, the time duration for timers is insufficient which leads to bunching of pedestrians at the signals. Mid-block crossings are mostly unavailable and leads to jay walking and bunching at signals which ultimately increases the risk of accidents.
At stretches that have both at-grade and grade-separated crossing facilities, it is clear that at-grade facilities and sub-level exclusive pedestrian underpass are better utilized than foot over-bridges. This also reconfirms that at-grade crossing facilities are always preferred and foot over-bridges discourage walking and impede access, as observed in most cities across the world.
Most streets lack in adequate provision of public convenience such as toilets, garbage containers, public information system, and traffic calming measures. Park Street has a beautifully curated 3-kilometre stretch which is well-illuminated and has adequate openings to facilitate crossing. Several stretches lack continuous tree cover but the stretch with kiosks provides some shading.
The unique advantage of Kolkata is that most buildings, that lineup the streets, do not have set-backs and opaque walls. They open out on the streets, making the street and the buildings highly visible and safe. This is an important building typology for transit-oriented development. Even new buildings in Kolkata are being designed using a similar typology. This active frontage is a very important design element that needs to be encouraged, along with mixed land-use and mixed income, and planned density development that is needed to promote the use of public transport and walking.
Reducing Footprints. Kolkata report.indd 21 27/11/18 3:17 PM
22
The audit has considered access to bus stops, quality of the bus stop, size of the bus shelter, display of route information on the panels of the bus stop, height clearance, access to convenience, connectivity of footpath to bus/metro and other modes of transport, availability of NMV ramp, and safety measures etc. It was found that in terms of accessibility to public transport, AJC Bose road and Broadway are positioned better. It is difficult to spot tram stops due to absence of adequate signage. Bus stops are more visible. Several stretches need more bus-queue shelters.
Illumination of streets and roads, shaded footpaths, and a high-activity level throughout the day are all signs of a pedestrian-friendly city. However there are certain infrastructure gaps with regard to universal accessibility for physically -disadvantaged commuters. This is evident in the absence of adequate ramp. Also, footpaths that have ramps do not always adhere to design standards. Tactile paving and auditory signals are required for vision-less guidance. Streets of Howrah are visibly unorganized in terms of street design elements; lack of pedestrian infrastructure that force people to walk on highly congested roads in high modal conflict. Way-finding signage to facilitate transit are available but needs to be made more uniformly available.
Streets within Kolkata and Bidhannagar Municipal Area are relatively better equipped and are more walkable compared to Howrah. Kolkata and Bidhannagar already have an extensive network of footpaths in several areas with good design. Further upgradation for safe access and movement can make this one of the most walkable cities in the country. This can also maintain sustainable mobility at a scale.
PARA-TRANSIT: AUTOS AND TAXIS
The ubiquitous auto rickshaws and taxis or the para-transit can move people quickly, flexibly and safely, and are part of the sustainable mobility strategies. A wide range of such para-transit transport system has evolved in the city to meet the travel needs of different income classes. These high-frequency and low-occupancy vehicles can effectively cut dependence on personal vehicles for short distance travel, as feeders to formal public transport systems, and for last-mile connectivity. These systems require due recognition in transportation planning. Their curtailment can lead to a serious deficit in public transport services and increase dependence on personal vehicles. Even though these are low-occupancy vehicles, compared to a bigger bus, they perform more trips, carry more people, and are efficient feeders.
Para transit is often seen as an informal response to fill the gap in formal public transport services. As a result, planning for formal transport is often seen as a means to curtail and reduce the provision of their services. But these systems play a complementary role to formal systems as well as in meeting enormous short-distance travel demand that bigger formal systems cannot substitute. The variety of intermediate modes that are still available for mobility needs in the city are three-wheelers (autos), yellow taxis, cycle rickshaws and battery-operated rickshaws commonly known as a toto or E-rickshaw.
Reducing Footprints. Kolkata report.indd 22 27/11/18 3:17 PM
23
REDUCING FOOTPRINTS: A GUIDANCE FRAMEWORK FOR CLEAN AND LOW CARBON TRANSPORT IN KOLKATA
The Centre for Policy Research and iTrans have carried out a study on para-transit transport system in Kolkata and have found that among all para-transit transport systems, the share of taxi trips is 17.1 per cent, 46.5 per cent for auto rickshaws, 34 per cent for cycle rickshaws, and 2.5 per cent for the rest.3 If these systems are destroyed, there will be an increased dependence on two-wheelers and cars. The study has further assessed that para-transit in Kolkata can help reduce carbon monoxide (CO) emissions by 71 per cent and carbon dioxide (CO2) emissions by 31 per cent, if two-wheelers are replaced by auto rickshaws.
Similarly, an 82 per cent reduction in CO emission and 83 per cent reduction in CO2 emissions is possible if cars are replaced by auto rickshaws. A huge reduction in traffic volume is also possible in terms of passenger car unit (PCU)—75,445 PCUs saved by two wheelers and 133,022 PCUs saved by four wheelers. These are enormous savings.
A new segment that has captured the mobility market in a span of two years is the recent trend of app-based cab service. Cab are basically the four-wheeler automobile that can operate well on motorable roads, compete with private vehicles, and act like a para-transit transport system providing door-to-door services. Due to a decrease in intermediate modes that facilitated door-to-door service, app-based services have gained popularity. Owing to the motorization, Kolkata has seen an increase of cab ownership by 35.2 per cent in the last two years compared to a 5–6 per cent growth in the past decade.
State policies and regulations focus largely on permit regulations, routes and fare-fixing and compliance is regulated with fines and challans.
Autorickshaws:Auto is the most popular para-transit mode. Kolkata has a very good network of auto rickshaws operated by private owners on routes permitted by the RTA. Unlike other Indian cities where auto rickshaws have a permit based on urban boundary and can operate on any roads within that, Kolkata has a list of specific routes. It operates on a stage carriage model on 127 routes, subject to approval by Public Vehicles Department. The auto generally carries 3–5 persons at a time. As of 2017, the total number of auto permits issued by the department was 11,315. The fare structure is usually flat fare which starts from Rs 10, based on the location.
Prior to 2009, Kolkata had non-LPG four-stroke auto rickshaws that were environmentally polluting. Based on an order on July 2008 by The Calcutta High Court, non-LPG four-stroke auto rickshaws became mandatory and were replaced by environment-friendly four-stroke LPG auto rickshaws. Today, 100 per cent of the autos plying within Kolkata metropolitan area (KMA) use LPG.
Yellowtaxi:Taxis are usually metered-cabs that ply within Greater Kolkata. The meters—though digital—are generally out-of-date. Usually, there is a conversion chart to refer to while converting the meter-reading to the actual fare. The minimum value is Rs 25 for first two kilometres. Dedicated taxi stands are currently found at transit stations. Today, around 3 lakh passengers are ferried daily by 3,500 taxis in Kolkata. Though, the yellow taxis operate on a Bengal permit, they mostly limit operations within the boundary of KMA.
Reducing Footprints. Kolkata report.indd 23 27/11/18 3:17 PM
24
The Calcutta High Court, that had ordered ban of non-LPG four-stroke autos, had also ordered a ban on all pre-1993 registered commercial vehicles, which included 100 per cent of the yellow taxis plying on the roads of Kolkata. However, only 85 per cent of the taxis had applied for a replacement of engines. These are diesel-driven vehicles and extremely polluting. There is an urgent requirement of an incentive mechanism for removal of such old and polluting vehicles from the streets of Kolkata.
Cycle rickshaw and e-rickshaws: The past decade has witnessed a drastic reduction in the number of non-motorized transport (NMT) vehicles. Plying of rickshaws in central Kolkata has been banned and its movement has been restricted to a few areas within Greater Kolkata. Currently, cycle rickshaws are mostly found in south Kolkata and Saltlake City, and most rickshaw pullers in Howrah have resorted to driving e-rickshaws, however, there is no record or registration maintained for the number of e-rickshaws in the city.
In the peripheral areas of Kolkata, battery-operated e-rickshaws or totos thrive due to low costs and negligible regulation. Presently, totos are not allowed in Kolkata Municipal Corporation (KMC) area. With the recent inclusion of e-rickshaws under the mandate of the Motor Vehicles Act, 1988 in 2015, totos are expected to become more accessible in Kolkata city under registration and other regulatory compliance. It is estimated that there are over 10,000 e-rickshaws operating within KMA, followed by 6,000 in Howrah, that were regulated by October 2017. According to the Beltala PVD, in 2017, there were 899 autos and 30,442 taxis in Kolkata, followed by 258 autos and 4,543 taxis in Bidhannagar.
There is a lack of para-transit infrastructure across the city, as there are no pro-visions for parking stands, shelters or pick-up and drop-off points for these ve-hicles. There are however, 293 parking areas for taxis with an equivalent car space (ECS) of 703 within Kolkata.
While the informal para-transit sector plays an important role in meeting the travel demand of the city, it also provides livelihood security to the low-income sector. This sector requires interventions to improve service quality as well as overall welfare of the service provider. This sector is partially regulated through a permit system, and will require stronger deployment strategy and monitoring.
All public transport nodes should include para-transit facilities. Intermodal integration of formal public transport, para-transit and cycle sharing should be within 50–200 metres from each other. Para-transit pick-up and drop off points should be planned within at least 50 metres from bus and metro/rail stations. Para-transit should be available to all residents within a reasonable walking distance.
This informal sector is vulnerable to the use of old and polluting vehicle technologies and dirty adulterated fuels. This demands special strategies to enable introduction of clean fuels such as LPG or CNG and phasing out of old and polluting technologies, especially diesel vehicles like the yellow taxis. If needed, an incentive programme may be worked out for quicker transition to clean and advanced technologies.
Reducing Footprints. Kolkata report.indd 24 27/11/18 3:17 PM
25
REDUCING FOOTPRINTS: A GUIDANCE FRAMEWORK FOR CLEAN AND LOW CARBON TRANSPORT IN KOLKATA
It is possible to bring para-transit under ITS monitoring through GPS systems to improve service quality. Developing an app-based ride share system for different types of para-transit transport systems is also a possibility.
The past decade has seen a drastic reduction in the number of non-motorized transport vehicles. In central Kolkata, rickshaw movement has been legally restricted to certain areas. No license has been issued to rickshaws since the last five years to ply within the city. However, the rickshaw pullers are not evicted and are allowed to operate. As of September 2017, Kolkata jurisdiction has around 500 rickshaws and Saltlake has 550. The fare structure is usually set by the rickshaw unions informally and maintains current practices.
Cycling across the KMC area is prohibited on the grounds of personal safety. In Kolkata, close to a quarter of households own bicycles—more than those who own cars. But its use is steadily declining. Policies are not encouraging bicycles. A notification in 2008 has banned bicycles on selected roads to provide safe, uninterrupted movement of vehicular traffic. Ranking of cities in terms of road safety by the Wilbur Smith Associates shows that Kolkata has the worst accident risks for pedestrians among other big cities—as high as 64 per cent. But instead of removing cyclists and pedestrians, it is possible to do at-grade accessibility improvement to enhance safety.
PROMOTE TRANSIT-ORIENTED DESIGN
Urban majority should access high quality public transport system within at least 10 minutes of walking distance.Network design for public transport systems should be detailed, so that at least 80 per cent of the residents lie within a distance of 400–800 metres (10-minute walking distance) of high-quality public transport stations. All public facilities (institutional, educational and cultural) should be accessible by public transport within a 400-metre walking distance. This is immensely possible in Kolkata if both bus- and rail-based networks are built and aligned to achieve this.
Other cities in the country are trying to adopt mixed land use and mixed income compact city design as per the transit-oriented development policy. The objective is to locate public transport stations, homes, workplace, locations, and services within walking distance of each other. Transit-oriented norms, emerging nationally, indicate that such access should be planned within a 400-metre radius of the station area. This is oriented towards maximizing public transport capacity and growth along the corridors. Kolkata already has this advantage. But this will have to be further enhanced by improving people-friendly, safe-walking and para-transit access in neighborhoods.
High population density and compact city designs are an opportunity for Kolkata to keep its average trip lengths short, allowing it to have high-level accessibility for walk and cycle trips. Other cities will require a deliberate adoption of the Transit Oriented Development policy that requires compact, mixed-use and mixed-income development near new or existing public transportation infrastructure. This provides for housing, jobs, recreation and civic functions within a walking distance of para-transit.
Reducing Footprints. Kolkata report.indd 25 27/11/18 3:17 PM
26
PARKING POLICY FOR TRAVEL DEMAND MANAGEMENT
Low carbon strategies require restraint on car usage to free up road and urban spaces and encourage alternatives. While, globally, a variety of tools are being applied to restrain demand for personal vehicles—including congestion pricing, higher taxes on personal vehicle usage, and ownership—the most common first generation travel demand management measure is parking policy.
The guiding principles shapes parking policies to recognize that unlimited parking supply leads to more dependence on automobiles; which further leads to congestion and pollution. Unlimited parking creates enormous pressure on land and diverts land from other important land uses. Parking encroachment erodes public spaces, green areas and footpaths, and compromises the use of sustainable modes. Parking pressure degrades the quality of life in residential neighborhoods and leads to law and order problems.
Normally, parking policies are heavily-biased towards augmenting parking supply by committing more land to parking, creating multi-level parking lots and augmenting parking requirement in buildings. Moreover, the general approach is to only target busy commercial areas for parking management. But this does not help. There is not enough attention towards framing of the parking policy to reduce demand for parking. The travel demand management principle has to get stronger as parking demand is insatiable and threatens to devour valuable and scarce urban spaces.
Kolkata is in a dire need to manage its parking demand. Similar to the case in Hong Kong and Tokyo, Kolkata too needs to innovate in terms of massive modernization of public transport systems, along with a very strong restraint on parking availability and effectively-priced parking. It is estimated that the demand for parking from the new registration of vehicles every year in Kolkata is equivalent to finding land area for 119 football fields.
Kolkata will be well advised to adopt the strategy of Parking Area Management Plan (PAMP) for all delineated neighborhoods across the city, and to identify the legal parking areas and demarcate that on ground along with off-street parking, along with enforcing a strong penalty for illegal parking.
At the same time, it is essential to introduce variable parking rates based on peak and non-peak hours, weekdays and week-ends etc., and enforce higher charges on on-street parking than off-street parking. Ensuring a shared use of public parking facilities and integrated management of on-street and off-street parking for optimal utilization of available parking spaces is also a important.
Kolkata should introduce residential parking permits for the use of public spaces in residential areas. In all PAMPs, at least one lane must be kept free from encroachment for easy movement of emergency vehicles. Parking on footpaths, green areas and neighborhood parks should not be allowed. Areas, within 20 metres, from any traffic intersection and nearby bus stops, should be parking free. Use part of the parking revenue for local area improvement or
Reducing Footprints. Kolkata report.indd 26 27/11/18 3:17 PM
27
REDUCING FOOTPRINTS: A GUIDANCE FRAMEWORK FOR CLEAN AND LOW CARBON TRANSPORT IN KOLKATA
public transport improvement. This will help to win confidence and support of the people for a parking policy.
Kolkata is already facing several challenges. The Comprehensive Mobility Plan (CMP) of Kolkata has put a spotlight on parking woes in the city.4 On-street parking has eroded carrying capacity of the road network. On roads that have on-street parking, the effective carriageway width has been reduced. Carriageways of about 9–12 metres width are effectively reduced to 6–7 metres. Often, 30–40 per cent of the road space is occupied with parking. In some areas, on 14-metre wide roads, 3 metres (on each side) are being used up for on-street parking—leaving only 8 metres for vehicular traffic. Surrounding Kolkata’s central business districts, roads such as AJC Bose road, APC road and KK Tagore road are most affected due to heavy traffic.
There are several stretches on some of the roads, including AJC Bose road, BB Ganguly Road, Howrah Station Road, Park Circus area and Strand Road, where on-street parking has reduced the carriageways significantly. Wherever the roads have been widened to accommodate more cars, extra lanes and footpaths are getting locked in for on-street parking.
Significant off-street parking accumulation is being observed near Vidyasagar Setu (towards Kolkata) followed by Howrah Railway Station, Jawaharlal Nehru and Curzon Park. The peak period of accumulation occurs between 9 AM–12 PM and 5 PM–8 PM. Most traffic violations—such as parking, traffic signals and prohibited U-turns—account for 70 per cent of the total traffic rules violations.5
Free and underpriced parking space, in many areas, is a hidden subsidy to car owners. Parking incentives induce more traffic.
KMC deals with the management and enforcement aspects of parking. There are 534 official parking zones in the city that can accommodate about 9,683 equivalent car spaces a day, according to an official statement issued by the KMC car parking department. Ward-wise geographical distribution of these parking spaces shows that central Kolkata has the maximum number of parking spaces — about 58.5 per cent followed by South Kolkata at 39 per cent and North Kolkata (2.6 per cent). This also reflects the land constraint of north Kolkata which was designed as a very compact urban form and at a human scale.
KMC has decided to open fresh areas for car parking.6 The parking department that is in charge of managing parking in the city provides identity cards to authorized collectors through their ‘fee car parking societies’. The official parking charges are mentioned in the rate charts that are put up at all locations. This includes day and night parking charges for different categories of vehicles.
If road and urban infrastructure is already so burdened with parking pressure, a rise in the parking demand in the future, from the ever burgeoning car numbers, will only exacerbate the crisis. Parking demand is insatiable. But urban space is limited. The city can never find enough land to meet the ever-growing parking demand. On the contrary, other more important use of urban space for larger public good can be seriously compromised if the city decides to lock up more space for parking. This demands a restraint policy.
Reducing Footprints. Kolkata report.indd 27 27/11/18 3:17 PM
28
Kolkataisreformingparkingpolicy: The blueprint has come from the City Mobility Plan and the new proposal that Kolkata Metropolitan Development Authority (KMDA) has framed. This seeks to generate parking facilities for all categories of vehicles in a sustainable manner, minimize traffic disruptions and congestions due to the on-street and uncontrolled parking of vehicles, and plan how to meet the parking problems in their respective areas.
The policy has outlined enforcement strategy for parking. In order to minimize disruptions and congestions, it seeks to regulate on-street parking with special attention to maximizing effective width of carriageway, selection of location of on-street parking lots on major arterial roads and transit corridors, demarcation of on-street parking lots with proper traffic signs and road markings, and provision of parking facilities for different categories of vehicles. Also commercial areas and market centers are to provide a minimum amount of parking facilities for goods vehicles.
To improve the management system of the off-street and on-street parking, it seeks to provide different parking zones for different categories of vehicles, proper parking guidance and information system, appropriate system for charging and collection of parking fees, proper controlling of traffic movements to and from the parking lots, and efficient monitoring and enforcement of regu-lation system. This enforcement strategy will be critical to deal with the parking and traffic chaos and should be implemented with all discipline.
The CMP states that the provision of parking facilities for transit and pa-ra-transit vehicles on a land owned by the government or local authority should be planned by the local authority at nodal locations. To ensure parking facility for para-transit vehicles, it proposes widening of adjoining roads at specified nodal locations.
The draft policy has taken on board demand management principles as it states that the present value of land in KMA varies between Rs 1,000–Rs 3,000 per square feet. But car parking that uses up such expensive land pays pittance for it. Increase in the parking fee is the right step to discourage car ownership. Considering the present value of land in KMC, and significantly low parking fees, KMC parking lots are the least fiscally productive of all other land uses. Thus, the opportunity costs of the parking lots in KMA are high and these lands can be brought under economic importance.
However, this principle has not yet led to further revision of parking rates. KMC has retained parking fee rates in 16 designated parking zones fixed by the previous board. In all classes of parking areas, a uniform rate of Rs 10 is charged every hour for cars. This effectively means that in Kolkata a car pays Rs 80 for eight hours. This can be further reformed and increased. The new draft parking policy also proposes that parking fee should be revised every three years.
For demand management there should be differential and variable rates according to the duration of parking for CBD and outer areas depending on peak hour and off-peak hour. The policy states that parking fee schedule should
Reducing Footprints. Kolkata report.indd 28 27/11/18 3:17 PM
29
REDUCING FOOTPRINTS: A GUIDANCE FRAMEWORK FOR CLEAN AND LOW CARBON TRANSPORT IN KOLKATA
be prepared by the ULBs in consultation with police authority. CMP for KMA has further recommended increase in parking fees from Rs 600–Rs 5,000 per month or more.
Given the land constraint, building bylaws are more generous in terms of the provision of parking requirements in buildings. For every one car park, the building management tends to give around 75 square metres of covered area.
The demand management principle needs to get stronger. The CMP hopes to provide for an ‘appropriate number of car parking facilities’ in a building. It wants to promote incentives for additional car parking facilities to be used as public car parking facility. It proposes introduction of incentive in a particular plot in the form of additional floor space with the provision of minimum 10–15 numbers. It provides for free gifting of the parking space to the ULBs/civic au-thorities. It should encourage the provision of parking facilities for long dura-tions in commercial, business and assembly buildings with the introduction of incentive in the form of additional floor space, and should be adopted with the concurrence of the ULBs.
The CMP proposes generation of off-street parking facilities in already built-up areas at locations of major vehicular and pedestrian concentrations with provision of underground parking in nearest parks/public open spaces and construction of multi-storied parking structures having commercial activities. It asks for mandatory provision of public parking facilities in the development control regulations in cases of redevelopment of existing structures and should be supplemented with the introduction of incentives in floor area ratio (FAR).
The CMP also asks for construction of additional building on existing plots, redevelopment of markets, suburban station areas etc, immediate provision of car parking facilities in the CBD areas of Kolkata and Howrah, provision of public parking facilities along highways/expressways at an interval of 3–4 kilometres—integrated with petrol pumps, if possible. There is also a provision of parking facilities in Kolkata port area and NSBC airport area.
There are mixed signals. At one level the CMP has taken on board the principle of user-pay principle and has asked for rationalization of parking charges as a demand-management tool. It has also stated that the low parking fee structure should be immediately dealt with and there should be substantial hike in the parking fee, to deter people from using personal vehicles, and to recover economic value of the parking lots. It has also said that on-street parking should not be encouraged and should be completely done away with.
But it has also put a lot of emphasis on parking supply. It states that the demand for parking space will go up exponentially, with just 6 per cent road space available to the city. KMDA has also proposed provision of adequate off-street parking facilities within the individual premises as well as in the off-street parking lots to meet the increasing demand of various categories of vehicular traffic. The CMP for KMA also recommends construction of 13 new off-street parking sites.7 It also advocates for adoption of appropriate development control measures with incentives in FAR to ensure and encourage the generation of
Reducing Footprints. Kolkata report.indd 29 27/11/18 3:17 PM
30
off-street parking facilities, among others. It has also proposed parking norms for different building types and parking rates for public lots, but has failed to realize the principle that parking policy is a demand-management strategy and not a demand-augmentation strategy.
Parking revenue is a subject of Municipal Corporation and traffic police within KMA. Revenue generated from legal parking is collected by the contracted third party; and, hence, there is no record maintained by the Municipal Corporation or traffic police. However, illegal parking and revenue generated from fining illegal parking is collected by the traffic police and is deposited in the government treasury.
As per the KMC budget report, there was an estimated collection of Rs 17.8 crore and 14 crore in the financial year 2017–18 and 2016–17, respectively. KMC targets to generate a revenue of Rs 18.70 crore in the financial year 2018–19 from parking. Good management of parking, based on demand-management principles, can further maximize the revenue potential of parking for the city government.
While organizing and augmenting parking supply, adequate attention needs to be given to demand management strategies of pricing and delimiting parking in public spaces, as per the local area parking plans, to reduce parking demand and personal vehicles use. In fact, the current restraint that operates on narrow roads in neighborhoods—where either night time parking is not possible or parking only on one side of the street restricts availability of parking space—has already led to priced rental parking where people take parking lots on rent. This has, thus, already spurred priced parking in residential areas. This is a good practice and should be encouraged.
Personalvehiclesshouldpaycostofusingroadspaceandcausingenvironmentaldamage: Globally, cities are taking initiatives through road and congestion pricing and parking policy to free–up road space from personal vehicles. They are making car parking prohibitive, adding high premium to car ownership, exacting dues for entering prime busy areas, only allowing a fraction of them on roads at a time, or just not allowing them in the city center. They are also giving people more transport options other than cars. But Indian cities charge a pittance for road usage and for parking. CSE’s rapid assessment, for instance, shows that a car pays road tax in its lifetime what a bus pays every year. Also big cars are taxed lower than small cars. Cities must reverse this.
It is important to enforce parking management and controls, rationalized taxes on personal vehicles, and make way for congestion charging. Cars cannot continue to enjoy direct and hidden subsidy and privileges on roads and need to pay the full cost of operations and for harming the environment and public health.
Rationalizetaxregimetolowerburdenonbuses:Analysis of many city-level taxation regime has shown that buses bear a huge tax burden. This trend will have to be reversed to stimulate investment in the bus transport sector and also discourage use of personal vehicles. Bus agencies pay property, excise,
Reducing Footprints. Kolkata report.indd 30 27/11/18 3:17 PM
31
REDUCING FOOTPRINTS: A GUIDANCE FRAMEWORK FOR CLEAN AND LOW CARBON TRANSPORT IN KOLKATA
customs, road tax, VAT, motor vehicle tax, advertisement tax, among others, unlike Metro rail. Bus operations are treated as commercial entities and are hence made to pay taxes as per ridership. This trend is regressive as compared to private vehicles which are made to pay tax once in 15 years. There is a need to waive-off or rationalize such tax burden.
However, the exact list of taxes and its details on Kolkata are not available. But a rapid assessment of road tax shows that in Kolkata a standard bus running as stage carriage pays Rs 31.25 per quarter for each seat and an additional tax of 10 per cent on this quarterly amount is also charged. This amounts to a total of Rs 7,000 per annum, considering there are 50 seats in a bus. In comparison to this, a car pays tax only once in five years as per the engine sizes ranging up to 900 cc to beyond 2,500 cc. The total tax ranges from Rs 14,550 to Rs 45,000 which effectively means that car owners end up paying a total tax of Rs 3,000 to Rs 9,000 per annum. This means a bus pays more than a small car every year. Globally, when cities are policing to free-up space from cars, such setback for operating a bus system should be removed.
Needstrategiestoreducereal–worldemissionsfromon-roadvehicles:To meet the objectives of clean and low carbon mobility strategies, policy action is need-ed to ensure that vehicles once out on the road remain low-emitting and fuel-ef-ficient throughout the useful life on the road. This will require a combination of strategies that include phasing out of old and polluting vehicles, especially diesel vehicles, robust emissions inspection programme and monitoring and substitution of dirty fuel with clean fuels and electric mobility.
India is poised to leapfrog to cleaner Bharat Stage VI emissions standards in 2020 when the emissions from new vehicles will reduce by 70–90 per cent. But systems are needed to ensure that the advanced emissions control systems in those new vehicles are monitored properly to prevent damage and deteriora-tion, and emissions from the older fleet will also have to be managed well.
Kolkata has faced a serious challenge with regard to the toxic fumes from old and ageing vehicles. A significant step was taken in 2009 when more than 15-year-old commercial vehicles were removed from the streets. Following the High Court order, all pre-1993 commercial vehicles were phased out by July in 2009 with some air quality benefits. This also led to the conversion of four-stroke auto rickshaws to LPG. The state government announced fiscal scheme to cushion the cost of the maker over. The government gave a subsidy of Rs 20,000. The rest had to come as a loan from the banks. The Hindustan Motors Limited also gave Rs 45,000 as scrap value. Bus replacement was linked with the Jawaharlal Nehru National Urban Renewal Mission (JNNURM) stimulus scheme for buses. Also the government provided 35 per cent of the bus price as subsidy. The bus owners had to bear 15 per cent of the costs while the rest of the amount was loaned.
In August, 2009 old two-stroke auto rickshaws were allowed to ply if they con-verted to LPG. Out of the 70,000 two-stroke autos, that were banned under the High Court order, an estimated 10,000-plus were registered after the conver-sion. There were reports about two-stroke autos infiltrating in south Kolkata
Reducing Footprints. Kolkata report.indd 31 27/11/18 3:17 PM
32
and the northern fringes, particularly on Shyambazar, Dunlop and Ariadaha and the Chetla-Behala routes.
The air quality data available from the State Pollution Control Board shows a drop in the air pollution levels immediately after the phase out. In August 2009, when the court order was implemented, the city recorded its lowest respirable particulate matter and NOx levels. The levels were lower than the previous year’s. According to a study done by Saviour and Friend of Environ-ment (SAFE), a city-based organization, the first four days of the month had the cleanest air the city had seen in decades.
The next challenge is to further clean up the existing old fleet, especially diesel fleet of taxis and other commercial vehicles. The ongoing PUC programme will require stringent quality control and compliance. At the national level, efforts are being made—as per the direction of the Supreme Court—that annual vehicle insurance be linked with valid PUC certificate to ensure all vehicles turn up for tests. This needs to be implemented at the city level as well. Simultaneously, it is essential to take steps for very strong quality control and assurance at the PUC centers for credible and authentic tests, and to avoid corruption and fraudulent tests. The transport department will have to carry out periodic audits of PUC centres.
However, PUC checks that were designed for the old generation vehicle technologies will not be adequate to address the new generation technologies of BS IV and BS VI vehicles that have more advanced emissions control systems. It is important to upgrade the tests by linking the inspection monitoring with on-board diagnostic (OBD) system that is a self policing technology that records all faults, problems and emissions anomalies as vehicles get driven. When there is any malfunction the malfunctioning light (MIL) lights up on the dash board to alert the driver that it requires repair.
The Ministry of Road Transport and Highways has already issued notification to all state transport departments that all PUC centres should turn back vehicles if MIL light is on. But in addition to this requirement, the PUC centres should also inspect if the OBD system is functioning properly or not. Often, drivers can disable the OBD system, which needs to be prevented. Detailed scanning of OBDs to read the nature of the problem can happen in the workshops. But PUC centres should be equipped to assess if OBD system is functioning or not. This is required in new generation vehicles that come with a very advanced emissions control system and requires electronic monitoring.
It is encouraging that Kolkata has already shown leadership in adopting remote sensing measurements for on-road vehicles. This is a global good practice that the Supreme Court of India has also directed to implement in Delhi. This system can be further scaled up for more efficient screening of vehicles across the city. This opens up a massive opportunity to screen the on-road fleet and characterize their emissions and take decisions accordingly.
Additionally, for better in-use emissions, the management should introduce sticker-based labelling systems for all vehicles to identify on road the fuel they
Reducing Footprints. Kolkata report.indd 32 27/11/18 3:17 PM
33
REDUCING FOOTPRINTS: A GUIDANCE FRAMEWORK FOR CLEAN AND LOW CARBON TRANSPORT IN KOLKATA
run on (diesel, petrol and LPG or electric) and also emissions standard of the vehicles. This can be applied for regulation of movement of very old and polluting vehicles in the low emissions zones of the city and also regulate inter-city movement of vehicles.
A robust and integrated system for in-use emissions management is thus an important priority area of intervention.
Scaleupelectricmobility: Kolkata has the unique advantage in scaling up zero emissions electric mobility for a paradigm shift and show leadership in this area. Its small distance range and high use of public transport and para-transit makes Kolkata an attractive candidate for large-scale transition for electric mobility.
Kolkata has already taken the strident step towards introducing and expanding the electric bus fleet. It is possible to come up with an incentive programme to introduce electric autos and taxis and other feeders systems to connect its public transport nodes. This can have a far-reaching impact on air pollution and low carbon development. This can also help to address the deadly diesel pollution in the city. This will require well planned grid and network of charging stations and changes in building bylaws to integrate charging requirements with the new construction and redevelopment. Even parking area requirements should integrate charging facilities. This can be rolled out along with the help of both public and private investments. Reliable charging infrastructure can encourage and stimulate market in favour of electric vehicles.
It may be noted that the simplicity of electric vehicle technology can be attractive when compared with the complexity of the advanced emissions control systems that will come with BS VI vehicles that are highly maintenance-sensitive. It will be cheaper to maintain and operate an electric vehicle. However, the city will have to be prepared for battery management including battery swapping systems as well as disposal and recycling. An early roadmap for electric mobility can be a game changer.
The experience and the emerging roadmap of Kolkata highlight important lessons for other cities of West Bengal and new developments around Kolkata. This needs to be leveraged to scale-up transition.
Reducing Footprints. Kolkata report.indd 33 27/11/18 3:17 PM
34
An assessment of transportation and mobility strategies in Kolkata has thrown up important lessons and learning curve for all cities of West Bengal. This requires a state-level urban transport policy with an adequate legal back up to guide action on sustainable transport.
Set time-bound targets for increasing share of public transport:The City Mobility Plan of Kolkata has set a target of 90 per cent public transport ridership (combined share of formal and informal public transport and non-motorized transport—excluding walk) by 2020. Well-designed systems and surveys need to be in place to assess the current trend in public transport ridership and monitor change over time. Only this can help to calibrate the effectiveness of the action plan to meet the target.
All action strategies require a detailed indicator to deliver on their intended objectives.
PUBLIC TRANSPORT AND MULTI-MODAL INTEGRATION
Operatingbustransport• Augment the number of buses in cities. There are no clear benchmark for
the number of buses that a city requires. Ministry of Urban development has followed a criterion for bus allocation—50 buses per lakh for popula-tion over 4 million and 40 buses per lakh for cities with population between 0.5 and 4 million. In 2010, the Ministry of Finance and the ADB tool kit stated that numbers should be assessed in relation to the overall system ef-ficiency to be guaranteed while following a broad criterion of about 60 bus-es per 1 lakh of the population. This needs to be linked with other criteria such as average waiting time of not less than 10 minutes for reliability, bus productivity to be 225–275 kilometres, trip efficiency, distance efficiency, punctuality with more than 95 per cent confidence, and unreliability to be less than 5 per cent and so on. In case of BRT, that can ensure reliable ser-vice with minimum waiting time and speed, it can reduce the requirement of number of buses.
• Improve availability by rationalizing routes and fleet enhancement with requisite modification.
• Modernize fleet and crew scheduling process of buses by installing GPS units on buses.
• Create a traffic control cell for monitoring bus movement and rationalize scheduling of buses.
• IT system in buses, bus-stops and control centre and passenger information systems for reliability of bus services, and service monitoring. Kolkata has started to implement passenger information system as well as app-based information dissemination. This can be implemented on a city-wide basis.
Guidance framework
Reducing Footprints. Kolkata report.indd 34 27/11/18 3:17 PM
35
REDUCING FOOTPRINTS: A GUIDANCE FRAMEWORK FOR CLEAN AND LOW CARBON TRANSPORT IN KOLKATA
• Bus parking should be made integral to urban planning. Multi-level bus parking to be provided in depots to more efficiently use available land area.
• Multi-modal, multi-use bus depots to be developed to provide high-class bus services and terminal experience to passengers. Should include well-equipped maintenance workshops.
• Enforce bus lanes and keep them free from obstruction and encroachment• Implementation of multi-modal integration plan for buses, Metro, IPT-
NMT at key/all interchange points.• Integrated passenger terminals to be created with mixed use and mul-
ti-modal facilities for passenger comfort, integrating regional and local public transit systems
• Implement electric bus programme through fleet renewal process and by implementing bus charging system network. Develop protocol for electric bus procurement system and deployment strategy. Kolkata has initiated the programme. This can be further expanded.
Pricingpublictransport• Need fare policy to ensure that it is affordable and remains competitive vis-
a-vis the operational cost of personal vehicles.• Fare integration and common ticketing; bring ETVMs into all buses.• Common mobility cards to be the mandatory access card for buses and oth-
er public transport. Kolkata has introduced this system for state buses. This will be further expanded to other public transport systems.
• Implement traffic impact assessment of infrastructure project for planning and management.
• Ensure city authorities create dedicated public transport (i.e. bus rapid transit) lanes on streets wherever possible. City authorities shall give other forms of priority to public transport (e.g. restricted access to private motor vehicles and traffic signal priority etc.)
Qualityandpricingofpublictransportservices• Public transport fares have to be fair, just, equitable and affordable for the
majority of the commuters. Globally, fiscal strategies are adopted to ensure that fares remain affordable.
• Encourage the provision of different levels of services—a basic service, with subsidized fares and a premium service, which is of high quality but charg-es high fares and involves no subsidy.
• To facilitate this, the government would offer support for improved service infrastructure such as improved bus stations and terminals, improved pas-senger information systems, use of intelligent transport systems for moni-toring and control, restructuring of State Transport Corporations, etc.
• To ensure that the fares charged are fair and reasonable, the Government would require that a regulatory authority be set up by the State Govern-ment to, inter-alia, regulate the prices to be charged by different types of public transport services.
Reinventtramways• Restructure organization to operate, manage and augment tram services in
the city. Enhance its heritage value.
Reducing Footprints. Kolkata report.indd 35 27/11/18 3:17 PM
36
• Plan fleet renewal and augmentation and modernisation of the tram infra-structure.
• Conduct SWOT analysis to identify gaps of existing tram system.• Conduct a public transport demand study and user perception study for
tram operation and services. Augment existing tram infrastructure, service and operation with advanced technology and design.
• Fleet and network planning should align with the demand pattern and compliment other existing mobility options in the city.
• Develop central monitoring system to facilitate operation and manage-ment. Conduct timely training of crew members responsible for operating and managing tram services.
MULTI-MODAL INTEGRATED MASS TRANSIT NETWORK
• All modes—bus, tram, metro, IPT, rail and waterways—should be integrated to provide seamless journey to the commuter. This will require physical integration so that all stations, terminals, pick up drop off of different modes will have to be physically integrated in a unified design. For this cities will have to adopt design specifications for multi-modal integration.
• Fare integration of different formal systems and common ticketing approach for seamless transfers. A commuter does not like having to change modes. Kolkata is already developing and enforcing this strategy.
• Encourage building of transport hubs through financial measures. These transport hubs should provide seamless inter-change between inter-city regional and suburban services, and the PT system of the city. These transport hubs should have adequate physical space and infrastructural facilities for NMT facilities.
Details of concept, principles, guidelines, norms & standards are given below
ContextIt is worth remembering that a single trip for an individual may comprise multiple modes. i.e when going to work, one may walk to the nearest auto-rickshaw stand to take an auto to the nearest metro station. On reaching the Metro Stop one wants to disembark on, one may walk or take a shuttle to his/her office. It is, therefore, essential that the city transport infrastructure and services are aligned and allow for convenient, safe, efficient, affordable and seamless transfers between modes ensuring greater well-being and productivity.
Multi-modal Integration is when two or more modes of transport are integrated for a single trip and used for convenient and efficient movement of passengers.
Reducing Footprints. Kolkata report.indd 36 27/11/18 3:17 PM
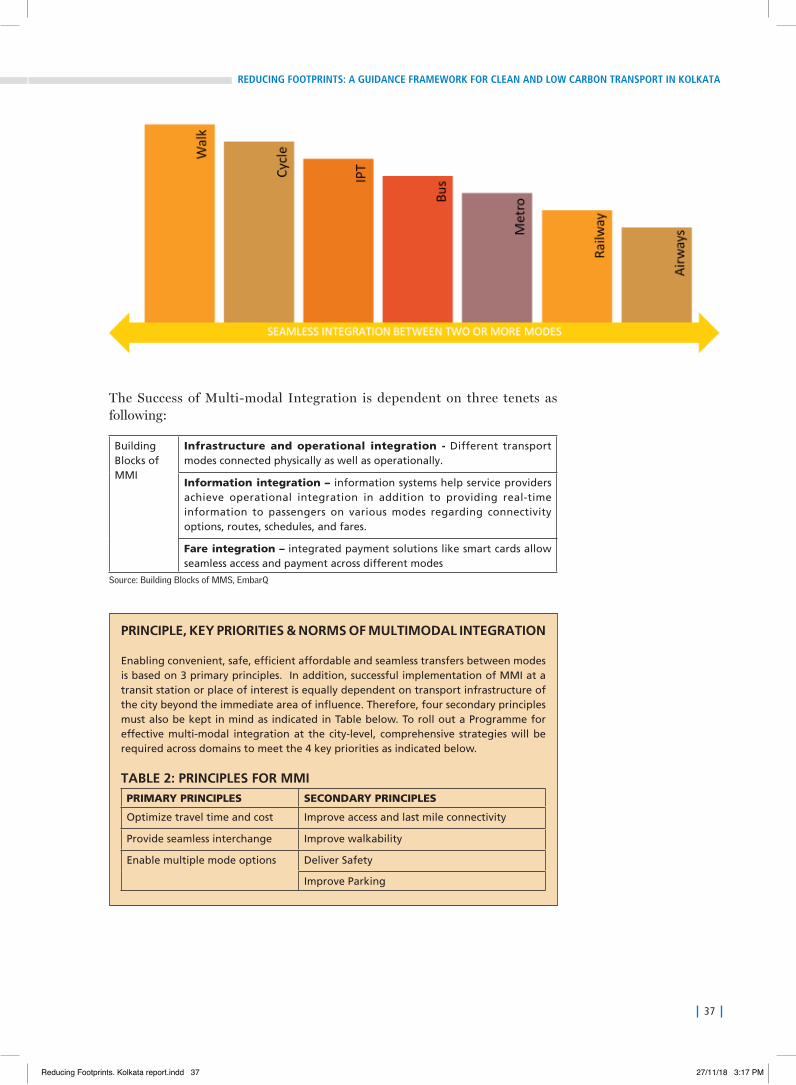
37
REDUCING FOOTPRINTS: A GUIDANCE FRAMEWORK FOR CLEAN AND LOW CARBON TRANSPORT IN KOLKATA
The Success of Multi-modal Integration is dependent on three tenets as following:
Building Blocks of MMI
Infrastructure and operational integration - Different transport modes connected physically as well as operationally.
Information integration – information systems help service providers achieve operational integration in addition to providing real-time information to passengers on various modes regarding connectivity options, routes, schedules, and fares.
Fare integration – integrated payment solutions like smart cards allow seamless access and payment across different modes
Source: Building Blocks of MMS, EmbarQ
PRINCIPLE, KEY PRIORITIES & NORMS OF MULTIMODAL INTEGRATION
Enabling convenient, safe, efficient affordable and seamless transfers between modes is based on 3 primary principles. In addition, successful implementation of MMI at a transit station or place of interest is equally dependent on transport infrastructure of the city beyond the immediate area of influence. Therefore, four secondary principles must also be kept in mind as indicated in Table below. To roll out a Programme for effective multi-modal integration at the city-level, comprehensive strategies will be required across domains to meet the 4 key priorities as indicated below.
TABLE 2: PRINCIPLES FOR MMIPRIMARY PRINCIPLES SECONDARY PRINCIPLES
Optimize travel time and cost Improve access and last mile connectivity
Provide seamless interchange Improve walkability
Enable multiple mode options Deliver Safety
Improve Parking
Reducing Footprints. Kolkata report.indd 37 27/11/18 3:17 PM
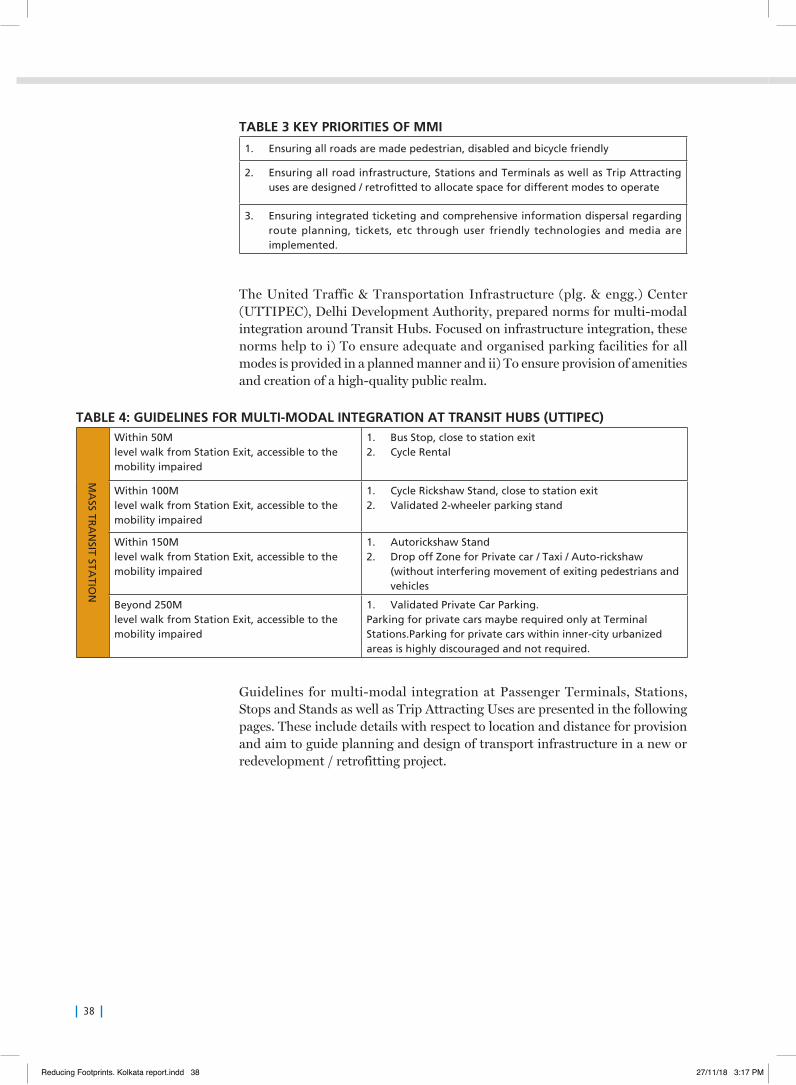
38
TABLE 3 KEY PRIORITIES OF MMI
1. Ensuring all roads are made pedestrian, disabled and bicycle friendly
2. Ensuring all road infrastructure, Stations and Terminals as well as Trip Attracting uses are designed / retrofitted to allocate space for different modes to operate
3. Ensuring integrated ticketing and comprehensive information dispersal regarding route planning, tickets, etc through user friendly technologies and media are implemented.
The United Traffic & Transportation Infrastructure (plg. & engg.) Center (UTTIPEC), Delhi Development Authority, prepared norms for multi-modal integration around Transit Hubs. Focused on infrastructure integration, these norms help to i) To ensure adequate and organised parking facilities for all modes is provided in a planned manner and ii) To ensure provision of amenities and creation of a high-quality public realm.
TABLE 4: GUIDELINES FOR MULTI-MODAL INTEGRATION AT TRANSIT HUBS (UTTIPEC)
MA
SS TRA
NSIT STA
TION
Within 50M level walk from Station Exit, accessible to the mobility impaired
1. Bus Stop, close to station exit2. Cycle Rental
Within 100Mlevel walk from Station Exit, accessible to the mobility impaired
1. Cycle Rickshaw Stand, close to station exit2. Validated 2-wheeler parking stand
Within 150Mlevel walk from Station Exit, accessible to the mobility impaired
1. Autorickshaw Stand2. Drop off Zone for Private car / Taxi / Auto-rickshaw
(without interfering movement of exiting pedestrians and vehicles
Beyond 250M level walk from Station Exit, accessible to the mobility impaired
1. Validated Private Car Parking. Parking for private cars maybe required only at Terminal Stations.Parking for private cars within inner-city urbanized areas is highly discouraged and not required.
Guidelines for multi-modal integration at Passenger Terminals, Stations, Stops and Stands as well as Trip Attracting Uses are presented in the following pages. These include details with respect to location and distance for provision and aim to guide planning and design of transport infrastructure in a new or redevelopment / retrofitting project.
Reducing Footprints. Kolkata report.indd 38 27/11/18 3:17 PM
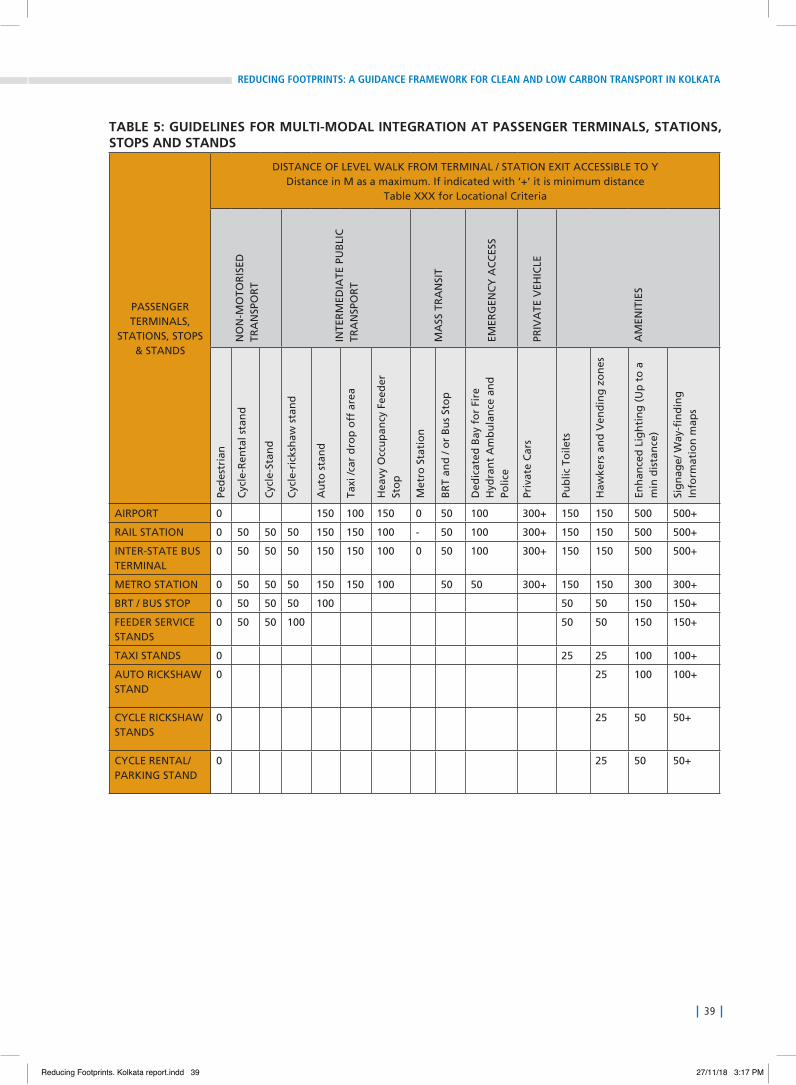
39
REDUCING FOOTPRINTS: A GUIDANCE FRAMEWORK FOR CLEAN AND LOW CARBON TRANSPORT IN KOLKATA
TABLE 5: GUIDELINES FOR MULTI-MODAL INTEGRATION AT PASSENGER TERMINALS, STATIONS, STOPS AND STANDS
PASSENGER TERMINALS,
STATIONS, STOPS & STANDS
DISTANCE OF LEVEL WALK FROM TERMINAL / STATION EXIT ACCESSIBLE TO YDistance in M as a maximum. If indicated with ‘+’ it is minimum distance
Table XXX for Locational Criteria
NO
N-M
OTO
RIS
ED
TRA
NSP
OR
T
INTE
RM
EDIA
TE P
UB
LIC
TR
AN
SPO
RT
MA
SS T
RA
NSI
T
EMER
GEN
CY
AC
CES
S
PRIV
ATE
VEH
ICLE
AM
ENIT
IES
Ped
estr
ian
Cyc
le-R
enta
l sta
nd
Cyc
le-S
tan
d
Cyc
le-r
icks
haw
sta
nd
Au
to s
tan
d
Taxi
/car
dro
p o
ff a
rea
Hea
vy O
ccu
pan
cy F
eed
er
Sto
p
Met
ro S
tati
on
BR
T an
d /
or
Bu
s St
op
Ded
icat
ed B
ay f
or
Fire
H
ydra
nt
Am
bu
lan
ce a
nd
Po
lice
Priv
ate
Car
s
Pub
lic T
oile
ts
Haw
kers
an
d V
end
ing
zo
nes
Enh
ance
d L
igh
tin
g (
Up
to
a
min
dis
tan
ce)
Sig
nag
e/ W
ay-fi
nd
ing
In
form
atio
n m
aps
AIRPORT 0 150 100 150 0 50 100 300+ 150 150 500 500+
RAIL STATION 0 50 50 50 150 150 100 - 50 100 300+ 150 150 500 500+
INTER-STATE BUS TERMINAL
0 50 50 50 150 150 100 0 50 100 300+ 150 150 500 500+
METRO STATION 0 50 50 50 150 150 100 50 50 300+ 150 150 300 300+
BRT / BUS STOP 0 50 50 50 100 50 50 150 150+
FEEDER SERVICE STANDS
0 50 50 100 50 50 150 150+
TAXI STANDS 0 25 25 100 100+
AUTO RICKSHAW STAND
0 25 100 100+
CYCLE RICKSHAW STANDS
0 25 50 50+
CYCLE RENTAL/ PARKING STAND
0 25 50 50+
Reducing Footprints. Kolkata report.indd 39 27/11/18 3:17 PM
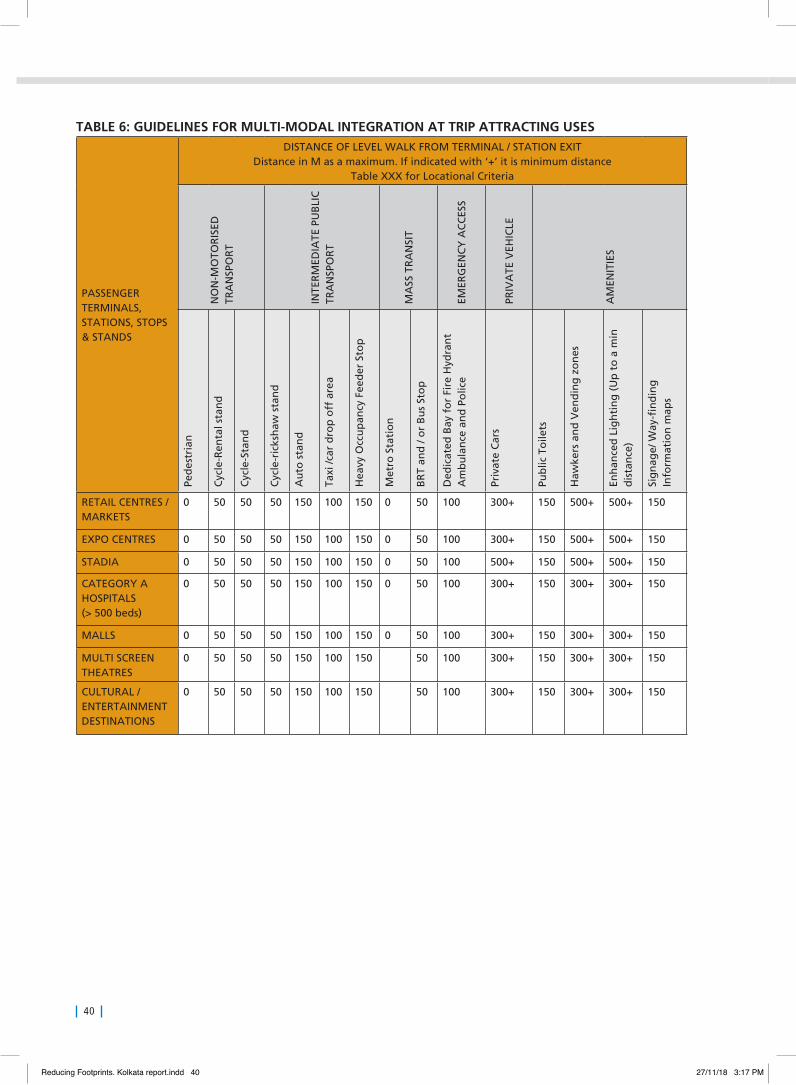
40
TABLE 6: GUIDELINES FOR MULTI-MODAL INTEGRATION AT TRIP ATTRACTING USES
PASSENGER TERMINALS, STATIONS, STOPS & STANDS
DISTANCE OF LEVEL WALK FROM TERMINAL / STATION EXIT Distance in M as a maximum. If indicated with ‘+’ it is minimum distance
Table XXX for Locational Criteria
NO
N-M
OTO
RIS
ED
TRA
NSP
OR
T
INTE
RM
EDIA
TE P
UB
LIC
TR
AN
SPO
RT
MA
SS T
RA
NSI
T
EMER
GEN
CY
AC
CES
S
PRIV
ATE
VEH
ICLE
AM
ENIT
IES
Ped
estr
ian
Cyc
le-R
enta
l sta
nd
Cyc
le-S
tan
d
Cyc
le-r
icks
haw
sta
nd
Au
to s
tan
d
Taxi
/car
dro
p o
ff a
rea
Hea
vy O
ccu
pan
cy F
eed
er S
top
Met
ro S
tati
on
BR
T an
d /
or
Bu
s St
op
Ded
icat
ed B
ay f
or
Fire
Hyd
ran
t A
mb
ula
nce
an
d P
olic
e
Priv
ate
Car
s
Pub
lic T
oile
ts
Haw
kers
an
d V
end
ing
zo
nes
Enh
ance
d L
igh
tin
g (
Up
to
a m
in
dis
tan
ce)
Sig
nag
e/ W
ay-fi
nd
ing
In
form
atio
n m
aps
RETAIL CENTRES / MARKETS
0 50 50 50 150 100 150 0 50 100 300+ 150 500+ 500+ 150
EXPO CENTRES 0 50 50 50 150 100 150 0 50 100 300+ 150 500+ 500+ 150
STADIA 0 50 50 50 150 100 150 0 50 100 500+ 150 500+ 500+ 150
CATEGORY A HOSPITALS (> 500 beds)
0 50 50 50 150 100 150 0 50 100 300+ 150 300+ 300+ 150
MALLS 0 50 50 50 150 100 150 0 50 100 300+ 150 300+ 300+ 150
MULTI SCREEN THEATRES
0 50 50 50 150 100 150 50 100 300+ 150 300+ 300+ 150
CULTURAL / ENTERTAINMENT DESTINATIONS
0 50 50 50 150 100 150 50 100 300+ 150 300+ 300+ 150
Reducing Footprints. Kolkata report.indd 40 27/11/18 3:17 PM
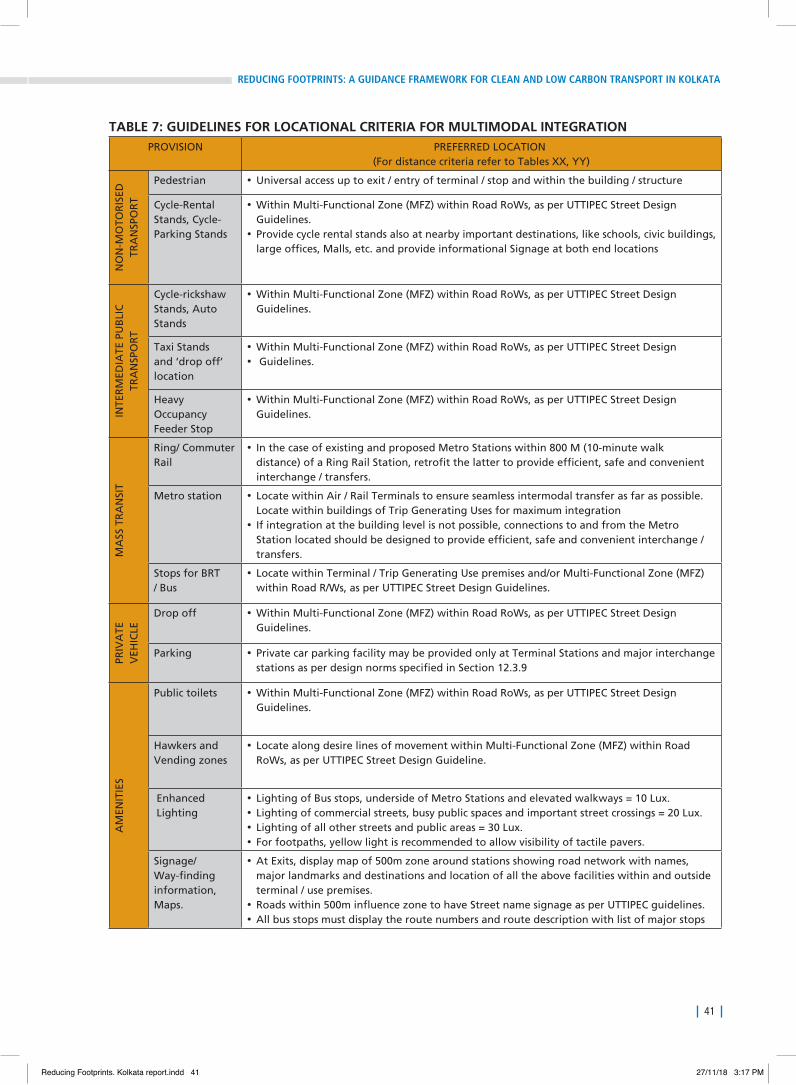
41
REDUCING FOOTPRINTS: A GUIDANCE FRAMEWORK FOR CLEAN AND LOW CARBON TRANSPORT IN KOLKATA
TABLE 7: GUIDELINES FOR LOCATIONAL CRITERIA FOR MULTIMODAL INTEGRATIONPROVISION PREFERRED LOCATION
(For distance criteria refer to Tables XX, YY)
NO
N-M
OTO
RIS
ED
TRA
NSP
OR
T
Pedestrian •Universal access up to exit / entry of terminal / stop and within the building / structure
Cycle-Rental Stands, Cycle-Parking Stands
•Within Multi-Functional Zone (MFZ) within Road RoWs, as per UTTIPEC Street Design Guidelines.
• Provide cycle rental stands also at nearby important destinations, like schools, civic buildings, large offices, Malls, etc. and provide informational Signage at both end locations
INTE
RM
EDIA
TE P
UB
LIC
TR
AN
SPO
RT
Cycle-rickshaw Stands, Auto Stands
•Within Multi-Functional Zone (MFZ) within Road RoWs, as per UTTIPEC Street Design Guidelines.
Taxi Stands and ‘drop off’ location
•Within Multi-Functional Zone (MFZ) within Road RoWs, as per UTTIPEC Street Design• Guidelines.
Heavy Occupancy Feeder Stop
•Within Multi-Functional Zone (MFZ) within Road RoWs, as per UTTIPEC Street Design Guidelines.
MA
SS T
RA
NSI
T
Ring/ Commuter Rail
• In the case of existing and proposed Metro Stations within 800 M (10-minute walk distance) of a Ring Rail Station, retrofit the latter to provide efficient, safe and convenient interchange / transfers.
Metro station • Locate within Air / Rail Terminals to ensure seamless intermodal transfer as far as possible. Locate within buildings of Trip Generating Uses for maximum integration
• If integration at the building level is not possible, connections to and from the Metro Station located should be designed to provide efficient, safe and convenient interchange / transfers.
Stops for BRT / Bus
• Locate within Terminal / Trip Generating Use premises and/or Multi-Functional Zone (MFZ) within Road R/Ws, as per UTTIPEC Street Design Guidelines.
PRIV
ATE
V
EHIC
LE
Drop off •Within Multi-Functional Zone (MFZ) within Road RoWs, as per UTTIPEC Street Design Guidelines.
Parking • Private car parking facility may be provided only at Terminal Stations and major interchange stations as per design norms specified in Section 12.3.9
AM
ENIT
IES
Public toilets •Within Multi-Functional Zone (MFZ) within Road RoWs, as per UTTIPEC Street Design Guidelines.
Hawkers and Vending zones
• Locate along desire lines of movement within Multi-Functional Zone (MFZ) within Road RoWs, as per UTTIPEC Street Design Guideline.
Enhanced Lighting
• Lighting of Bus stops, underside of Metro Stations and elevated walkways = 10 Lux.• Lighting of commercial streets, busy public spaces and important street crossings = 20 Lux.• Lighting of all other streets and public areas = 30 Lux.• For footpaths, yellow light is recommended to allow visibility of tactile pavers.
Signage/ Way-finding information, Maps.
•At Exits, display map of 500m zone around stations showing road network with names, major landmarks and destinations and location of all the above facilities within and outside terminal / use premises.
•Roads within 500m influence zone to have Street name signage as per UTTIPEC guidelines.•All bus stops must display the route numbers and route description with list of major stops
Reducing Footprints. Kolkata report.indd 41 27/11/18 3:17 PM
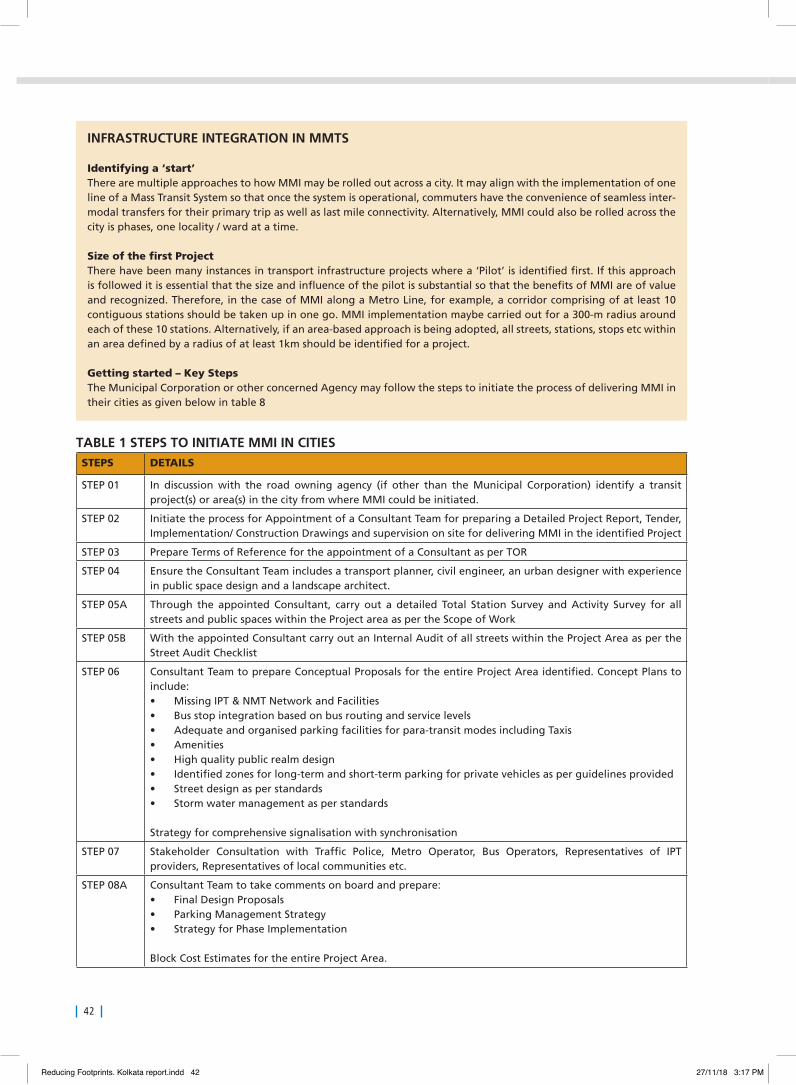
42
TABLE 1 STEPS TO INITIATE MMI IN CITIES
STEPS DETAILS
STEP 01 In discussion with the road owning agency (if other than the Municipal Corporation) identify a transit project(s) or area(s) in the city from where MMI could be initiated.
STEP 02 Initiate the process for Appointment of a Consultant Team for preparing a Detailed Project Report, Tender, Implementation/ Construction Drawings and supervision on site for delivering MMI in the identified Project
STEP 03 Prepare Terms of Reference for the appointment of a Consultant as per TOR
STEP 04 Ensure the Consultant Team includes a transport planner, civil engineer, an urban designer with experience in public space design and a landscape architect.
STEP 05A Through the appointed Consultant, carry out a detailed Total Station Survey and Activity Survey for all streets and public spaces within the Project area as per the Scope of Work
STEP 05B With the appointed Consultant carry out an Internal Audit of all streets within the Project Area as per the Street Audit Checklist
STEP 06 Consultant Team to prepare Conceptual Proposals for the entire Project Area identified. Concept Plans to include:• Missing IPT & NMT Network and Facilities• Bus stop integration based on bus routing and service levels• Adequate and organised parking facilities for para-transit modes including Taxis• Amenities• High quality public realm design• Identified zones for long-term and short-term parking for private vehicles as per guidelines provided• Street design as per standards • Storm water management as per standards
Strategy for comprehensive signalisation with synchronisation
STEP 07 Stakeholder Consultation with Traffic Police, Metro Operator, Bus Operators, Representatives of IPT providers, Representatives of local communities etc.
STEP 08A Consultant Team to take comments on board and prepare:• Final Design Proposals• Parking Management Strategy• Strategy for Phase Implementation
Block Cost Estimates for the entire Project Area.
INFRASTRUCTURE INTEGRATION IN MMTS
Identifying a ‘start’There are multiple approaches to how MMI may be rolled out across a city. It may align with the implementation of one line of a Mass Transit System so that once the system is operational, commuters have the convenience of seamless inter-modal transfers for their primary trip as well as last mile connectivity. Alternatively, MMI could also be rolled across the city is phases, one locality / ward at a time.
Size of the first Project There have been many instances in transport infrastructure projects where a ‘Pilot’ is identified first. If this approach is followed it is essential that the size and influence of the pilot is substantial so that the benefits of MMI are of value and recognized. Therefore, in the case of MMI along a Metro Line, for example, a corridor comprising of at least 10 contiguous stations should be taken up in one go. MMI implementation maybe carried out for a 300-m radius around each of these 10 stations. Alternatively, if an area-based approach is being adopted, all streets, stations, stops etc within an area defined by a radius of at least 1km should be identified for a project.
Getting started – Key StepsThe Municipal Corporation or other concerned Agency may follow the steps to initiate the process of delivering MMI in their cities as given below in table 8
Reducing Footprints. Kolkata report.indd 42 27/11/18 3:17 PM
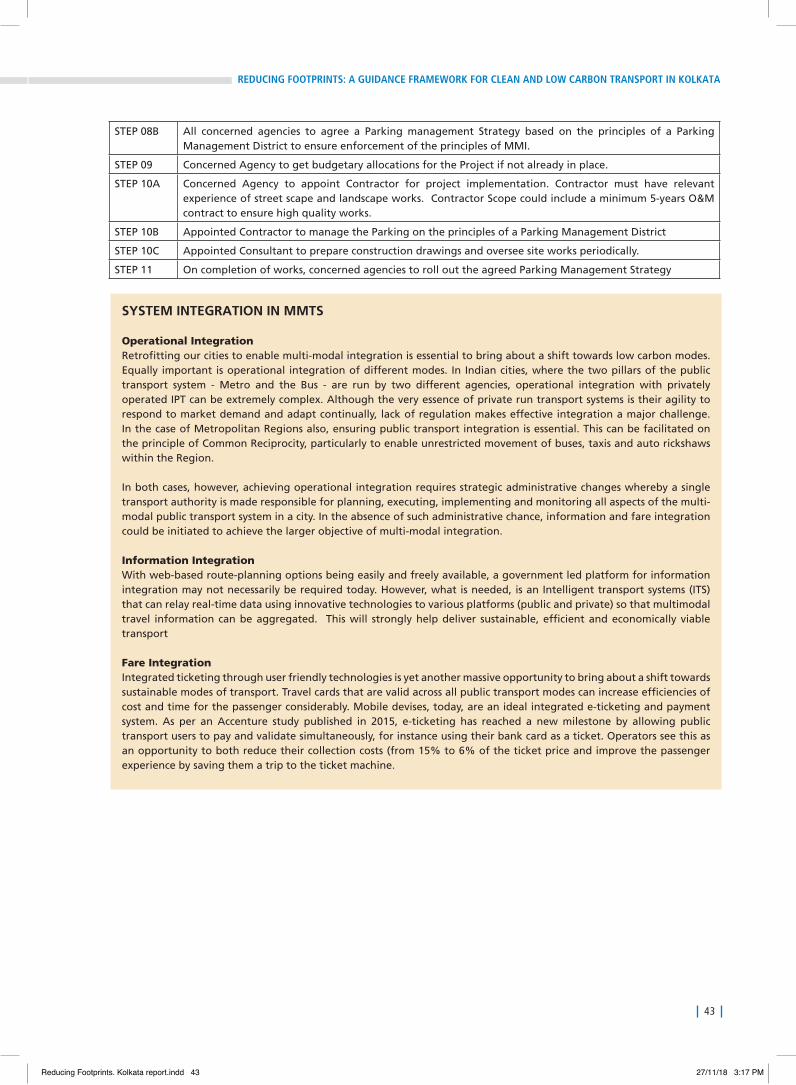
43
REDUCING FOOTPRINTS: A GUIDANCE FRAMEWORK FOR CLEAN AND LOW CARBON TRANSPORT IN KOLKATA
STEP 08B All concerned agencies to agree a Parking management Strategy based on the principles of a Parking Management District to ensure enforcement of the principles of MMI.
STEP 09 Concerned Agency to get budgetary allocations for the Project if not already in place.
STEP 10A Concerned Agency to appoint Contractor for project implementation. Contractor must have relevant experience of street scape and landscape works. Contractor Scope could include a minimum 5-years O&M contract to ensure high quality works.
STEP 10B Appointed Contractor to manage the Parking on the principles of a Parking Management District
STEP 10C Appointed Consultant to prepare construction drawings and oversee site works periodically.
STEP 11 On completion of works, concerned agencies to roll out the agreed Parking Management Strategy
SYSTEM INTEGRATION IN MMTS
Operational Integration Retrofitting our cities to enable multi-modal integration is essential to bring about a shift towards low carbon modes. Equally important is operational integration of different modes. In Indian cities, where the two pillars of the public transport system - Metro and the Bus - are run by two different agencies, operational integration with privately operated IPT can be extremely complex. Although the very essence of private run transport systems is their agility to respond to market demand and adapt continually, lack of regulation makes effective integration a major challenge. In the case of Metropolitan Regions also, ensuring public transport integration is essential. This can be facilitated on the principle of Common Reciprocity, particularly to enable unrestricted movement of buses, taxis and auto rickshaws within the Region.
In both cases, however, achieving operational integration requires strategic administrative changes whereby a single transport authority is made responsible for planning, executing, implementing and monitoring all aspects of the multi-modal public transport system in a city. In the absence of such administrative chance, information and fare integration could be initiated to achieve the larger objective of multi-modal integration.
Information Integration With web-based route-planning options being easily and freely available, a government led platform for information integration may not necessarily be required today. However, what is needed, is an Intelligent transport systems (ITS) that can relay real-time data using innovative technologies to various platforms (public and private) so that multimodal travel information can be aggregated. This will strongly help deliver sustainable, efficient and economically viable transport
Fare Integration Integrated ticketing through user friendly technologies is yet another massive opportunity to bring about a shift towards sustainable modes of transport. Travel cards that are valid across all public transport modes can increase efficiencies of cost and time for the passenger considerably. Mobile devises, today, are an ideal integrated e-ticketing and payment system. As per an Accenture study published in 2015, e-ticketing has reached a new milestone by allowing public transport users to pay and validate simultaneously, for instance using their bank card as a ticket. Operators see this as an opportunity to both reduce their collection costs (from 15% to 6% of the ticket price and improve the passenger experience by saving them a trip to the ticket machine.
Reducing Footprints. Kolkata report.indd 43 27/11/18 3:17 PM
44
NON-MOTORIZED TRANSPORT AND SAFE ACCESS
• Develop and implement non-motorized transport policy and plan in all cit-ies. This should include infrastructure planning for walking and cycling, street design guidelines with priority attached to keeping people at-grade, and network plans for implementation. This will require monitoring for time bound implementation. o Planning for road building, public transport infrastructure and non
motorized transport planning need to converge to ensure that people oriented design are integrated all across and with the right of way.
o Urban street design guidelines will be adopted that will prioritise de-sign for public transport access, walking and cycling infrastructure, safe and universal access, street furniture, facilities for parking, in-ter-modal transfer hubs, road markings, signages and traffic signals, pick up and drop off points for taxi, auto, three-wheelers stands, spaces for street vending and service lanes. Roads will provide access to resi-dential areas, activity centres and social services.
o Provide pedestrian traffic light and signages.o Provide street network has safe pedestrian spaces that are universally
accessible, improve roadway aesthetics and encourage traffic calmingo Prepare and implement zonal plans for developing an NMT network.
This should include the following action points with appropriate time-lines for implementation:Implement network plan for footpaths on all roadsTarget-specific stretches of footpaths and cycle tracks to be com-
pleted in a phased manner and cover the entire city Implement a network plan for more secondary street networks
and non-gated streets to provide direct shortest routes for pedes-trians and cyclists.
Vehicular traffic can also be redistributed from major junctions through multiple routes to decongest. Signal-free corridors should be avoided as more road-space only attracts more traffic and im-pedes people’s movement
Plan and upgrade pedestrian / NMT crossings at least every 250 m, with pedestrian signals and signages. These should preferably be at-grade. Reduce block sizes to reduce walking and cycling dis-tances
Synchronization of signals should be implemented on a priority basis with an integrated IT-based traffic management system so that in spite of having frequent at-grade pedestrian crossings, traf-fic can move swiftly across signals. Cycle sharing systems to be in-troduced and expand as feeders to public transport
Identify and notify key commercial areas with high footfalls and good public transport connectivity to create pedestrian plazas
Make safety and walkability audits of walking and cycling infra-structure mandatory
Encroachment of NMT lanes to be made punishable offence under the current provision of law
• Principles of street design and management: Guide street design and man-
Reducing Footprints. Kolkata report.indd 44 27/11/18 3:17 PM
45
REDUCING FOOTPRINTS: A GUIDANCE FRAMEWORK FOR CLEAN AND LOW CARBON TRANSPORT IN KOLKATA
agement that support and invite multiple uses, including safe, active, and ample space for pedestrians, cycles, and public transport, are more condu-cive to the public life of an urban neighbourhood and efficient movement of people and goods than streets designed primarily to move personal motor vehicles.
• Collaborate with stakeholders to identify and develop select streets as spe-cial streets that limit access to personal motor vehicles.
• Walking facilities: Government will create shared spaces or footpaths where there are none; and where footpaths exist, widths will be increased depending on pedestrian volumes in order to prevent pedestrian overflow onto the carriageway and to ensure continuity.
• Provide design streets and public spaces that are integrated with and sup-portive of public transport services.
• Provide street furniture, such as benches, waste bins, tables, public way-finding signage, shelter, water taps, and other amenities to make streets an attractive place to spend time, promote sanitary conditions, serve a traffic calming function, and avoid unnecessary clutter.
• Set up a repair and maintenance programme to keep all footpaths and cycle tracks in a good state of repair and cleanliness.
• Funding: Ensure that at least 60 per cent of its street infrastructure budget is allocated to NMT infrastructure.
• Design streets and drainage to provide co-benefit of capturing run-off and prevent flooding
First-andlast-mileconnectivity• Improved and safe accessibility of stations/stops or the last mile connectiv-
ity should be a vital feature of public transport planning. It would involve seven main steps: o Network planning for footpaths and cycle tracks connecting neigh-
bourhoods and key destination points. o Footpaths for walk and cycle lanes within about 500 metres of all sta-
tions/stops of public transport nodeso Extensive network of feeder service linking neighbourhoods with pub-
lic transport nodeso Drop off & pick up facilities at public transport stations/stopso Park and ride facilities at terminal stations o Land use control around stations/stops to avoid congestion at entry/
exit o Design principles that improve pedestrian access to public transport
systems for all users should include safety, accessibility, reliability and affordability.
o Plan deployment of para-transit services to improve last mile connec-tivity
Regionalandsuburbanconnectivity• Regional/suburban transport services should be integrated with the city
network for easy dispersal. Institutional mechanisms should be put in place to enable this integration.
Reducing Footprints. Kolkata report.indd 45 27/11/18 3:17 PM
46
In the Indian context, non-motorised transportation primarily includes walking, cycling, cycle-rickshaws and cycle-pulled carts used for goods. These modes are especially relevant for local trips and last mile connectivity. Please note cycle-rickshaws are covered in Section 5 Intermediate Public Transport.
Principles and key priorities for NMTPedestrian: The right to walk safely is a non–negotiable condition. The transport infrastructure will need to re-affirm the importance of walking as a meaningful, non-motorized choice of transportation, particularly to enhance the pro-poor mobility systems and support walking as a year-round mode of transportation that is connected, convenient and obstruction-free, and accessible regardless of age, gender, income, culture or ability. The following is necessary:
• Create a fine network of streets to ensure choice of direct, safe and comfortable routes that encourage walkability, in particular build missing links at a grid of 80 – 100M. All redevelopment/development plans must avoid gated designs that impede permeability of the street network and walkability.
• Design for pedestrian safety, comfort and convenience on all streets as per UTTIPEC Street Design Guidelines. Develop new and retrofit existing street infrastructure for the same.
• All pedestrian facilities should be barrier free for universal access by all persons with reduced mobility including those with hearing and visual impairments.
• All impediments/encroachments shall be removed from footpaths all over the city to create safe walking environment in all colonies, office /shopping areas, terminal areas etc which will encourage more people to walk.
• As mentioned in the NMSH Parameters (MOUD), 2011, at least five safe street-level crossing opportunities per kilometre of road with approximately 250m being maximum spacing between two crossings should be provided. Depending on context, these crossings may be signalized and/or traffic calmed to reduce vehicular speed and increase safety.
• Create street-level activity and well-watched streets through mixed-use areas to ensure a safe environment for pedestrians. This could be done by retrofitting boundary walls to allow for greater transparency, locating Hawker Zones along inactive frontages etc.
• Prioritise planning, design, implementation and maintenance of pedestrian routes and facilities.
• Strict action must be taken against encroachments of any kind on footpaths including extension of private gardens of the adjacent houses.
Cycle: Bicycle is an important mode of travel, particularly with reference to short and medium trip lengths. It is important to re-affirm the importance of cycling as a meaningful, non-motorized choice of transportation and support cycling as a year-round mode of transportation. Therefore, the following is essential:• Prepare a Cycling Masterplan for the city that creates a network of routes
integrating Eco-mobility corridors along existing Nallahas, heritage routes as well as other recreational routes. Include Safe routes to school.
• Create of a finer NMT network and provide of fully segregated tracks for shared use with cycle-rickshaws with safe NMT parking facilities and at-grade crossings on all roads. To facilitate the primary user group (i,e those making their primary journey on cycle), routes linking employment centers with residential areas must be implemented on priority.
• Provide cycle parking facilities at all terminals / trip attracting uses etc as well as all developments for residents, employees, visitors etc.
• Plan and implement a city wide, affordable and accessible bike sharing / rental schemes.
Context, principles and Key priorities of NMT are given below
Reducing Footprints. Kolkata report.indd 46 27/11/18 3:17 PM
47
REDUCING FOOTPRINTS: A GUIDANCE FRAMEWORK FOR CLEAN AND LOW CARBON TRANSPORT IN KOLKATA
TransitOrientedDevelopment(TOD)• Create high density, mixed-use, mixed-income development near public
transport stations especially in new developments.• In low density areas as well as new development and urban sprawl maxi-
mize densities within TOD, in order to facilitate maximum number of peo-ple walking or cycling, or use NMT or feeder services easily to access public transit facility.
• Enable a balanced mix of jobs and housing along MRTS corridors coupled with caps on parking supply, higher housing affordability through design and technology options, and improved efficiency and equity in the resulting developments. Design these spaces with adequate green spaces and high density street network.
Concept of TODTransit Oriented Development is a model that enables landuse – transport integration. TOD is any development – macro or micro – that is focused around a Mass Transit Hub / Stop and maximizes the provision of residential, business and leisure activities within walking distance of it. With the aim to promote the use of public transport by reducing dependency on private cars and promoting sustainable urban growth, a TOD is characterized by:1. High-density mixed-use development providing housing, employment, recreation
and social amenities close to a transit station.2. Walkable neighbourhoods with a high density of streets and intersections (i.e.
smaller size of urban blocks) providing route choices.3. Accessible and comfortable mass transport.4. Seamless and convenient intermodal transfers for last mile connectivity through
comfortable and affordable Intermediate Public Transport and Non-motorized Transport options.
5. Resultantly, lower levels of energy consumption contributing to a cleaner and healthier environment and a more sustainable lifestyle
NORMS, STANDARDS AND GUIDELINES
Higher FSI, a misnomer in TODTODs are almost always affiliated with higher FSI or FAR i.e. the quantum of development permissible on a given piece of land. However, higher FSI alone can never deliver the 5 principles of TOD mentioned above. Instead, higher FSI is only an incentivizing mechanism to attract development along a mass transit corridor instead of other parts of a city.
Therefore, as an extension, it is also possible to achieve the principles of TOD in existing and new developments without the higher FSI incentive. The focus, therefore, remains on street infrastructure and retrofitting immediate surroundings and the interface with private property to enable a shift towards more sustainable modes such as walking, cycling, IPT etc. This is true for neighbourhoods that may not even have a mass transit system within 500m
Detailed concept, norms and guidelines for implementing TOD in cities are given below
Reducing Footprints. Kolkata report.indd 47 27/11/18 3:17 PM
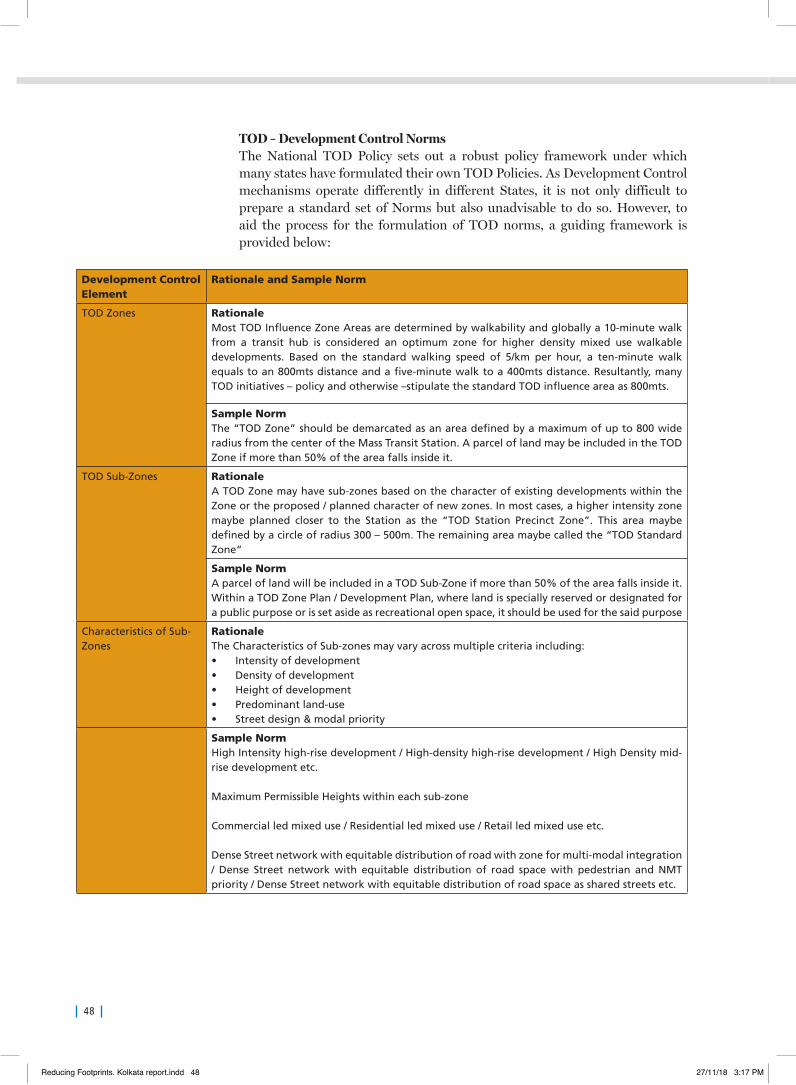
48
TOD–DevelopmentControlNormsThe National TOD Policy sets out a robust policy framework under which many states have formulated their own TOD Policies. As Development Control mechanisms operate differently in different States, it is not only difficult to prepare a standard set of Norms but also unadvisable to do so. However, to aid the process for the formulation of TOD norms, a guiding framework is provided below:
Development Control Element
Rationale and Sample Norm
TOD Zones RationaleMost TOD Influence Zone Areas are determined by walkability and globally a 10-minute walk from a transit hub is considered an optimum zone for higher density mixed use walkable developments. Based on the standard walking speed of 5/km per hour, a ten-minute walk equals to an 800mts distance and a five-minute walk to a 400mts distance. Resultantly, many TOD initiatives – policy and otherwise –stipulate the standard TOD influence area as 800mts.
Sample NormThe “TOD Zone” should be demarcated as an area defined by a maximum of up to 800 wide radius from the center of the Mass Transit Station. A parcel of land may be included in the TOD Zone if more than 50% of the area falls inside it.
TOD Sub-Zones RationaleA TOD Zone may have sub-zones based on the character of existing developments within the Zone or the proposed / planned character of new zones. In most cases, a higher intensity zone maybe planned closer to the Station as the “TOD Station Precinct Zone”. This area maybe defined by a circle of radius 300 – 500m. The remaining area maybe called the “TOD Standard Zone”
Sample NormA parcel of land will be included in a TOD Sub-Zone if more than 50% of the area falls inside it. Within a TOD Zone Plan / Development Plan, where land is specially reserved or designated for a public purpose or is set aside as recreational open space, it should be used for the said purpose
Characteristics of Sub-Zones
RationaleThe Characteristics of Sub-zones may vary across multiple criteria including:• Intensity of development • Density of development • Height of development • Predominant land-use• Street design & modal priority
Sample NormHigh Intensity high-rise development / High-density high-rise development / High Density mid-rise development etc.
Maximum Permissible Heights within each sub-zone
Commercial led mixed use / Residential led mixed use / Retail led mixed use etc.
Dense Street network with equitable distribution of road with zone for multi-modal integration / Dense Street network with equitable distribution of road space with pedestrian and NMT priority / Dense Street network with equitable distribution of road space as shared streets etc.
Reducing Footprints. Kolkata report.indd 48 27/11/18 3:17 PM
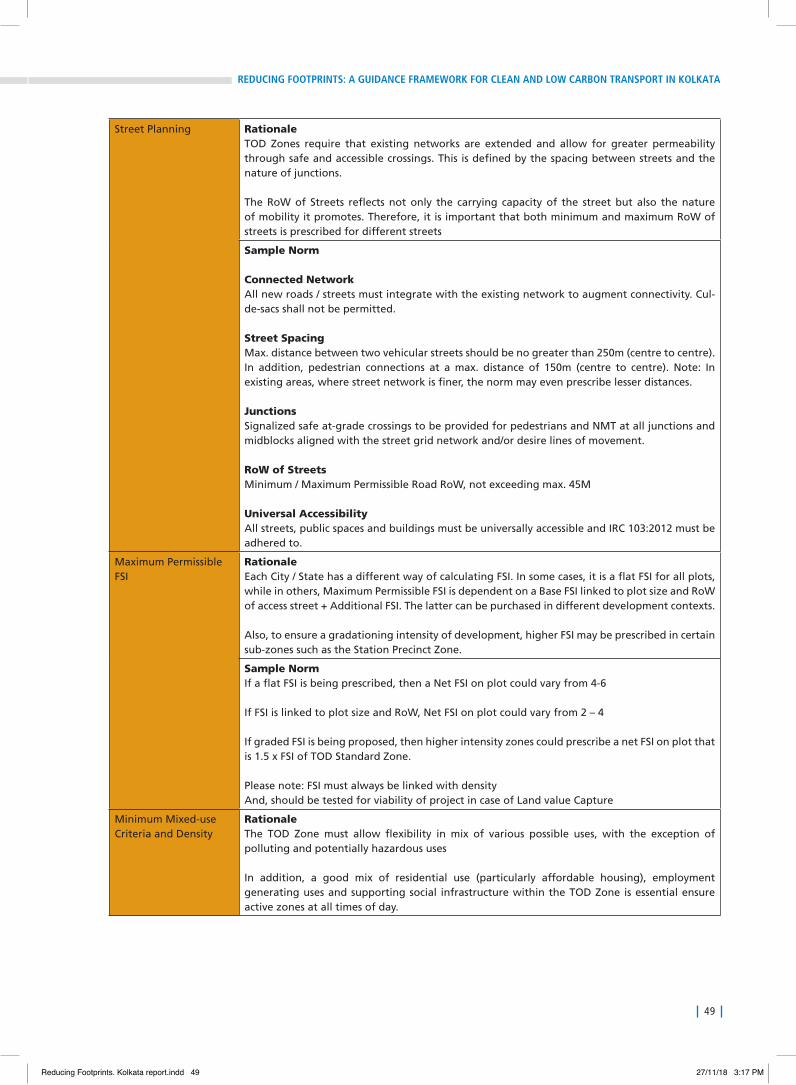
49
REDUCING FOOTPRINTS: A GUIDANCE FRAMEWORK FOR CLEAN AND LOW CARBON TRANSPORT IN KOLKATA
Street Planning RationaleTOD Zones require that existing networks are extended and allow for greater permeability through safe and accessible crossings. This is defined by the spacing between streets and the nature of junctions.
The RoW of Streets reflects not only the carrying capacity of the street but also the nature of mobility it promotes. Therefore, it is important that both minimum and maximum RoW of streets is prescribed for different streets
Sample Norm
Connected Network All new roads / streets must integrate with the existing network to augment connectivity. Cul-de-sacs shall not be permitted.
Street Spacing Max. distance between two vehicular streets should be no greater than 250m (centre to centre). In addition, pedestrian connections at a max. distance of 150m (centre to centre). Note: In existing areas, where street network is finer, the norm may even prescribe lesser distances.
JunctionsSignalized safe at-grade crossings to be provided for pedestrians and NMT at all junctions and midblocks aligned with the street grid network and/or desire lines of movement.
RoW of StreetsMinimum / Maximum Permissible Road RoW, not exceeding max. 45M
Universal Accessibility All streets, public spaces and buildings must be universally accessible and IRC 103:2012 must be adhered to.
Maximum Permissible FSI
RationaleEach City / State has a different way of calculating FSI. In some cases, it is a flat FSI for all plots, while in others, Maximum Permissible FSI is dependent on a Base FSI linked to plot size and RoW of access street + Additional FSI. The latter can be purchased in different development contexts.
Also, to ensure a gradationing intensity of development, higher FSI may be prescribed in certain sub-zones such as the Station Precinct Zone.
Sample NormIf a flat FSI is being prescribed, then a Net FSI on plot could vary from 4-6
If FSI is linked to plot size and RoW, Net FSI on plot could vary from 2 – 4
If graded FSI is being proposed, then higher intensity zones could prescribe a net FSI on plot that is 1.5 x FSI of TOD Standard Zone.
Please note: FSI must always be linked with densityAnd, should be tested for viability of project in case of Land value Capture
Minimum Mixed-use Criteria and Density
RationaleThe TOD Zone must allow flexibility in mix of various possible uses, with the exception of polluting and potentially hazardous uses
In addition, a good mix of residential use (particularly affordable housing), employment generating uses and supporting social infrastructure within the TOD Zone is essential ensure active zones at all times of day.
Reducing Footprints. Kolkata report.indd 49 27/11/18 3:17 PM
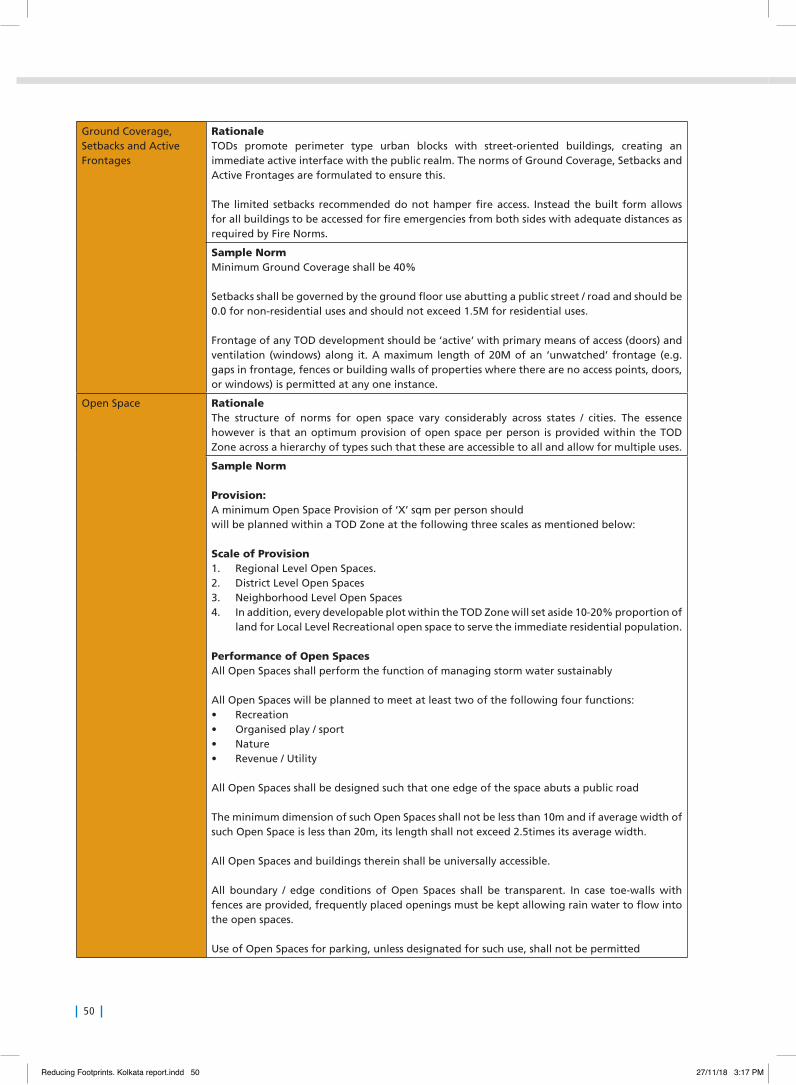
50
Ground Coverage, Setbacks and Active Frontages
RationaleTODs promote perimeter type urban blocks with street-oriented buildings, creating an immediate active interface with the public realm. The norms of Ground Coverage, Setbacks and Active Frontages are formulated to ensure this.
The limited setbacks recommended do not hamper fire access. Instead the built form allows for all buildings to be accessed for fire emergencies from both sides with adequate distances as required by Fire Norms.
Sample NormMinimum Ground Coverage shall be 40%
Setbacks shall be governed by the ground floor use abutting a public street / road and should be 0.0 for non-residential uses and should not exceed 1.5M for residential uses.
Frontage of any TOD development should be ‘active’ with primary means of access (doors) and ventilation (windows) along it. A maximum length of 20M of an ‘unwatched’ frontage (e.g. gaps in frontage, fences or building walls of properties where there are no access points, doors, or windows) is permitted at any one instance.
Open Space RationaleThe structure of norms for open space vary considerably across states / cities. The essence however is that an optimum provision of open space per person is provided within the TOD Zone across a hierarchy of types such that these are accessible to all and allow for multiple uses.
Sample Norm
Provision:A minimum Open Space Provision of ‘X’ sqm per person should will be planned within a TOD Zone at the following three scales as mentioned below:
Scale of Provision 1. Regional Level Open Spaces. 2. District Level Open Spaces 3. Neighborhood Level Open Spaces 4. In addition, every developable plot within the TOD Zone will set aside 10-20% proportion of
land for Local Level Recreational open space to serve the immediate residential population.
Performance of Open SpacesAll Open Spaces shall perform the function of managing storm water sustainably
All Open Spaces will be planned to meet at least two of the following four functions:• Recreation • Organised play / sport • Nature • Revenue / Utility
All Open Spaces shall be designed such that one edge of the space abuts a public road
The minimum dimension of such Open Spaces shall not be less than 10m and if average width of such Open Space is less than 20m, its length shall not exceed 2.5times its average width.
All Open Spaces and buildings therein shall be universally accessible.
All boundary / edge conditions of Open Spaces shall be transparent. In case toe-walls with fences are provided, frequently placed openings must be kept allowing rain water to flow into the open spaces.
Use of Open Spaces for parking, unless designated for such use, shall not be permitted
Reducing Footprints. Kolkata report.indd 50 27/11/18 3:17 PM
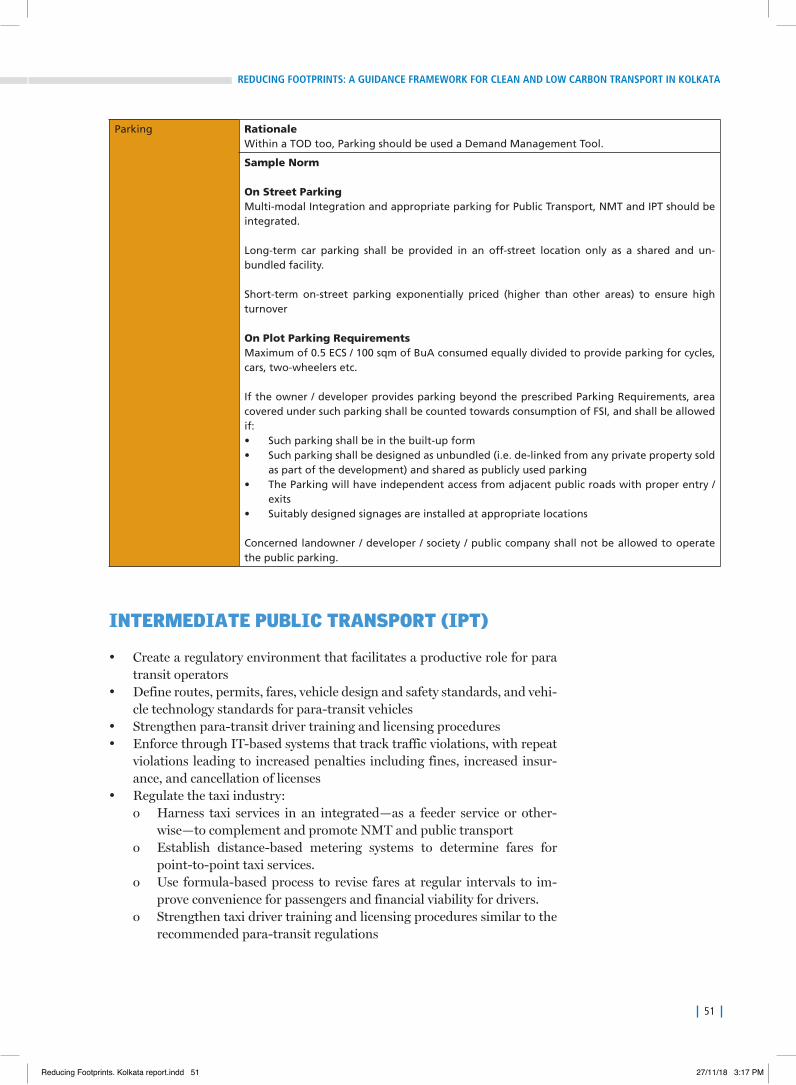
51
REDUCING FOOTPRINTS: A GUIDANCE FRAMEWORK FOR CLEAN AND LOW CARBON TRANSPORT IN KOLKATA
Parking RationaleWithin a TOD too, Parking should be used a Demand Management Tool.
Sample Norm
On Street ParkingMulti-modal Integration and appropriate parking for Public Transport, NMT and IPT should be integrated.
Long-term car parking shall be provided in an off-street location only as a shared and un-bundled facility.
Short-term on-street parking exponentially priced (higher than other areas) to ensure high turnover
On Plot Parking RequirementsMaximum of 0.5 ECS / 100 sqm of BuA consumed equally divided to provide parking for cycles, cars, two-wheelers etc.
If the owner / developer provides parking beyond the prescribed Parking Requirements, area covered under such parking shall be counted towards consumption of FSI, and shall be allowed if:• Such parking shall be in the built-up form • Such parking shall be designed as unbundled (i.e. de-linked from any private property sold
as part of the development) and shared as publicly used parking • The Parking will have independent access from adjacent public roads with proper entry /
exits• Suitably designed signages are installed at appropriate locations
Concerned landowner / developer / society / public company shall not be allowed to operate the public parking.
INTERMEDIATE PUBLIC TRANSPORT (IPT)
• Create a regulatory environment that facilitates a productive role for para transit operators
• Define routes, permits, fares, vehicle design and safety standards, and vehi-cle technology standards for para-transit vehicles
• Strengthen para-transit driver training and licensing procedures• Enforce through IT-based systems that track traffic violations, with repeat
violations leading to increased penalties including fines, increased insur-ance, and cancellation of licenses
• Regulate the taxi industry:o Harness taxi services in an integrated—as a feeder service or other-
wise—to complement and promote NMT and public transporto Establish distance-based metering systems to determine fares for
point-to-point taxi services.o Use formula-based process to revise fares at regular intervals to im-
prove convenience for passengers and financial viability for drivers.o Strengthen taxi driver training and licensing procedures similar to the
recommended para-transit regulations
Reducing Footprints. Kolkata report.indd 51 27/11/18 3:17 PM
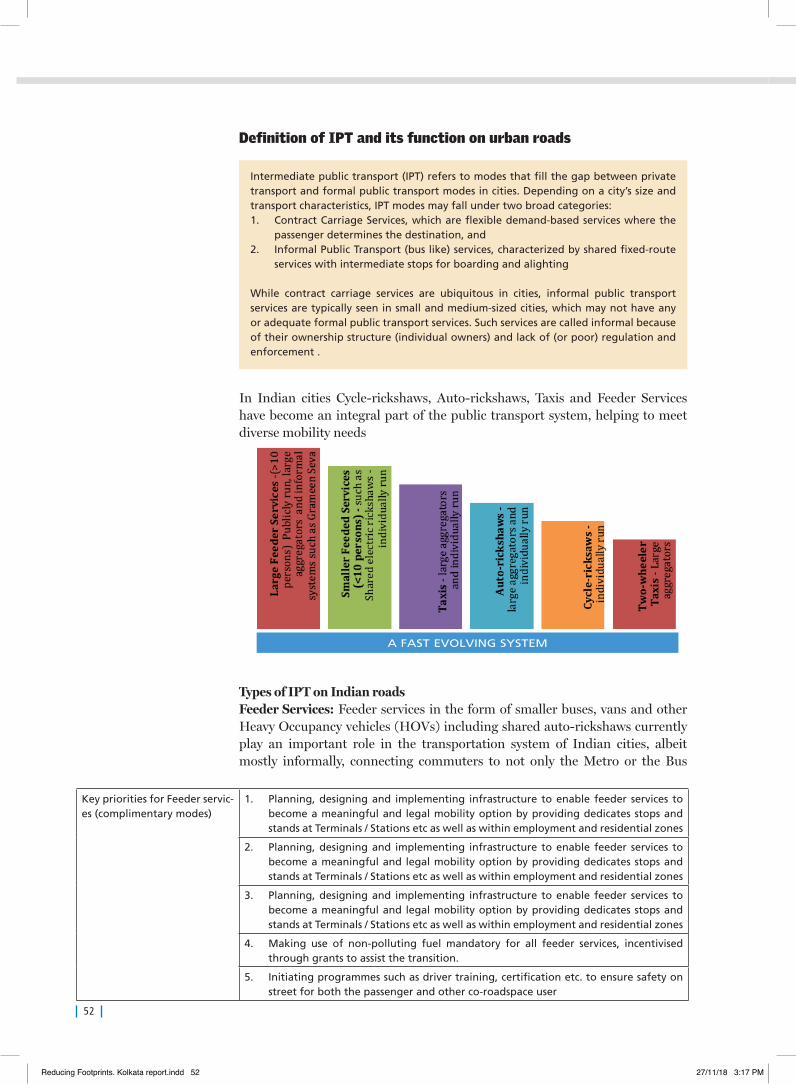
52
In Indian cities Cycle-rickshaws, Auto-rickshaws, Taxis and Feeder Services have become an integral part of the public transport system, helping to meet diverse mobility needs
TypesofIPTonIndianroadsFeederServices: Feeder services in the form of smaller buses, vans and other Heavy Occupancy vehicles (HOVs) including shared auto-rickshaws currently play an important role in the transportation system of Indian cities, albeit mostly informally, connecting commuters to not only the Metro or the Bus
Intermediate public transport (IPT) refers to modes that fill the gap between private transport and formal public transport modes in cities. Depending on a city’s size and transport characteristics, IPT modes may fall under two broad categories:1. Contract Carriage Services, which are flexible demand-based services where the
passenger determines the destination, and 2. Informal Public Transport (bus like) services, characterized by shared fixed-route
services with intermediate stops for boarding and alighting
While contract carriage services are ubiquitous in cities, informal public transport services are typically seen in small and medium-sized cities, which may not have any or adequate formal public transport services. Such services are called informal because of their ownership structure (individual owners) and lack of (or poor) regulation and enforcement .
Definition of IPT and its function on urban roads
A FAST EVOLVING SYSTEM
Key priorities for Feeder servic-es (complimentary modes)
1. Planning, designing and implementing infrastructure to enable feeder services to become a meaningful and legal mobility option by providing dedicates stops and stands at Terminals / Stations etc as well as within employment and residential zones
2. Planning, designing and implementing infrastructure to enable feeder services to become a meaningful and legal mobility option by providing dedicates stops and stands at Terminals / Stations etc as well as within employment and residential zones
3. Planning, designing and implementing infrastructure to enable feeder services to become a meaningful and legal mobility option by providing dedicates stops and stands at Terminals / Stations etc as well as within employment and residential zones
4. Making use of non-polluting fuel mandatory for all feeder services, incentivised through grants to assist the transition.
5. Initiating programmes such as driver training, certification etc. to ensure safety on street for both the passenger and other co-roadspace user
Reducing Footprints. Kolkata report.indd 52 27/11/18 3:17 PM
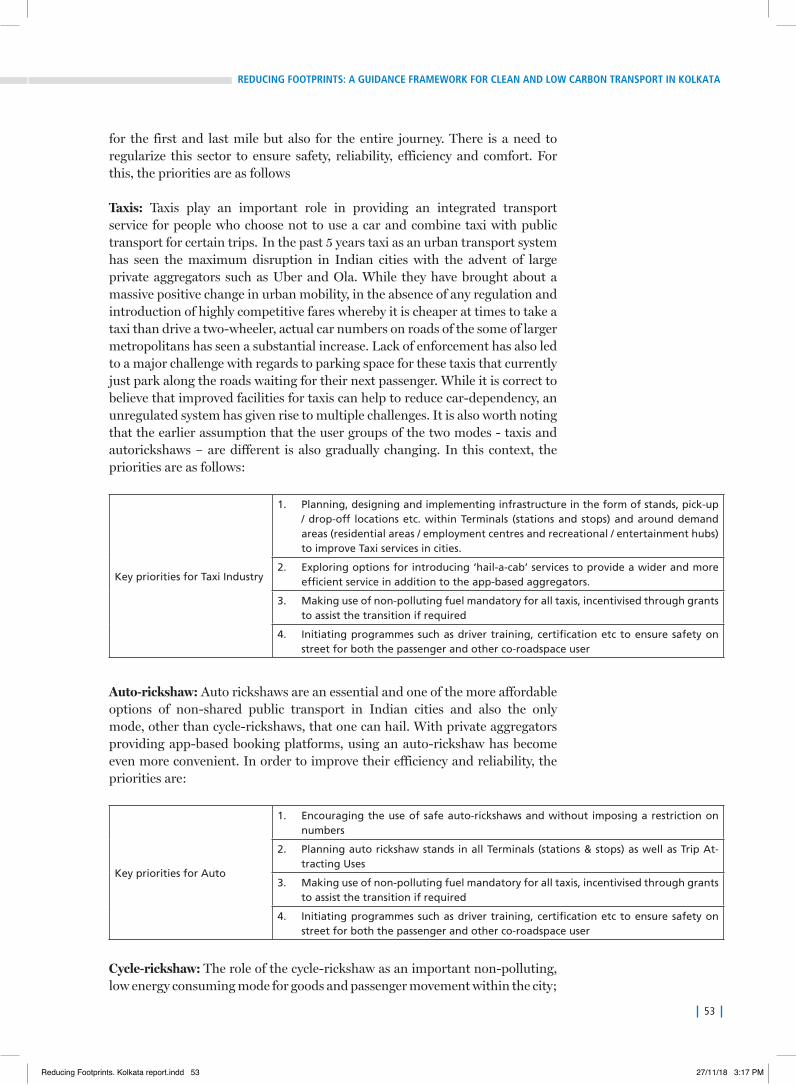
53
REDUCING FOOTPRINTS: A GUIDANCE FRAMEWORK FOR CLEAN AND LOW CARBON TRANSPORT IN KOLKATA
for the first and last mile but also for the entire journey. There is a need to regularize this sector to ensure safety, reliability, efficiency and comfort. For this, the priorities are as follows
Taxis: Taxis play an important role in providing an integrated transport service for people who choose not to use a car and combine taxi with public transport for certain trips. In the past 5 years taxi as an urban transport system has seen the maximum disruption in Indian cities with the advent of large private aggregators such as Uber and Ola. While they have brought about a massive positive change in urban mobility, in the absence of any regulation and introduction of highly competitive fares whereby it is cheaper at times to take a taxi than drive a two-wheeler, actual car numbers on roads of the some of larger metropolitans has seen a substantial increase. Lack of enforcement has also led to a major challenge with regards to parking space for these taxis that currently just park along the roads waiting for their next passenger. While it is correct to believe that improved facilities for taxis can help to reduce car-dependency, an unregulated system has given rise to multiple challenges. It is also worth noting that the earlier assumption that the user groups of the two modes - taxis and autorickshaws – are different is also gradually changing. In this context, the priorities are as follows:
Key priorities for Taxi Industry
1. Planning, designing and implementing infrastructure in the form of stands, pick-up / drop-off locations etc. within Terminals (stations and stops) and around demand areas (residential areas / employment centres and recreational / entertainment hubs) to improve Taxi services in cities.
2. Exploring options for introducing ‘hail-a-cab’ services to provide a wider and more efficient service in addition to the app-based aggregators.
3. Making use of non-polluting fuel mandatory for all taxis, incentivised through grants to assist the transition if required
4. Initiating programmes such as driver training, certification etc to ensure safety on street for both the passenger and other co-roadspace user
Auto-rickshaw: Auto rickshaws are an essential and one of the more affordable options of non-shared public transport in Indian cities and also the only mode, other than cycle-rickshaws, that one can hail. With private aggregators providing app-based booking platforms, using an auto-rickshaw has become even more convenient. In order to improve their efficiency and reliability, the priorities are:
Key priorities for Auto
1. Encouraging the use of safe auto-rickshaws and without imposing a restriction on numbers
2. Planning auto rickshaw stands in all Terminals (stations & stops) as well as Trip At-tracting Uses
3. Making use of non-polluting fuel mandatory for all taxis, incentivised through grants to assist the transition if required
4. Initiating programmes such as driver training, certification etc to ensure safety on street for both the passenger and other co-roadspace user
Cycle-rickshaw:The role of the cycle-rickshaw as an important non-polluting, low energy consuming mode for goods and passenger movement within the city;
Reducing Footprints. Kolkata report.indd 53 27/11/18 3:17 PM
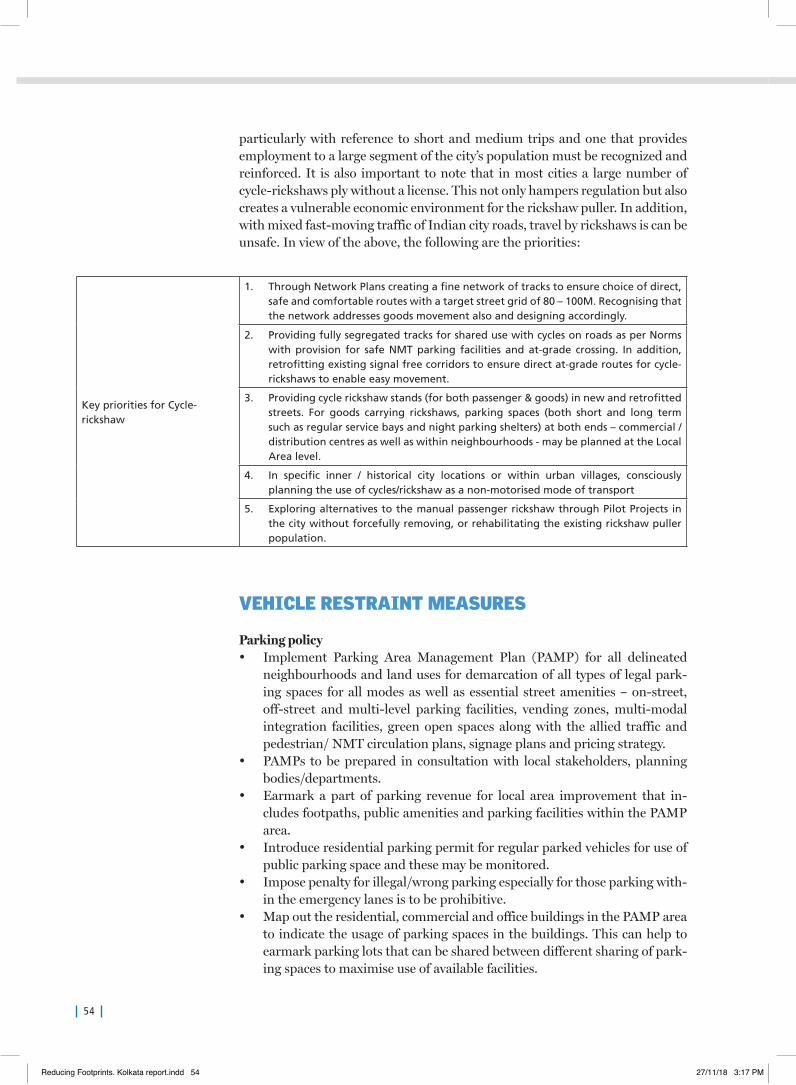
54
particularly with reference to short and medium trips and one that provides employment to a large segment of the city’s population must be recognized and reinforced. It is also important to note that in most cities a large number of cycle-rickshaws ply without a license. This not only hampers regulation but also creates a vulnerable economic environment for the rickshaw puller. In addition, with mixed fast-moving traffic of Indian city roads, travel by rickshaws is can be unsafe. In view of the above, the following are the priorities:
Key priorities for Cycle-rickshaw
1. Through Network Plans creating a fine network of tracks to ensure choice of direct, safe and comfortable routes with a target street grid of 80 – 100M. Recognising that the network addresses goods movement also and designing accordingly.
2. Providing fully segregated tracks for shared use with cycles on roads as per Norms with provision for safe NMT parking facilities and at-grade crossing. In addition, retrofitting existing signal free corridors to ensure direct at-grade routes for cycle-rickshaws to enable easy movement.
3. Providing cycle rickshaw stands (for both passenger & goods) in new and retrofitted streets. For goods carrying rickshaws, parking spaces (both short and long term such as regular service bays and night parking shelters) at both ends – commercial / distribution centres as well as within neighbourhoods - may be planned at the Local Area level.
4. In specific inner / historical city locations or within urban villages, consciously planning the use of cycles/rickshaw as a non-motorised mode of transport
5. Exploring alternatives to the manual passenger rickshaw through Pilot Projects in the city without forcefully removing, or rehabilitating the existing rickshaw puller population.
VEHICLE RESTRAINT MEASURES
Parkingpolicy• Implement Parking Area Management Plan (PAMP) for all delineated
neighbourhoods and land uses for demarcation of all types of legal park-ing spaces for all modes as well as essential street amenities – on-street, off-street and multi-level parking facilities, vending zones, multi-modal integration facilities, green open spaces along with the allied traffic and pedestrian/ NMT circulation plans, signage plans and pricing strategy.
• PAMPs to be prepared in consultation with local stakeholders, planning bodies/departments.
• Earmark a part of parking revenue for local area improvement that in-cludes footpaths, public amenities and parking facilities within the PAMP area.
• Introduce residential parking permit for regular parked vehicles for use of public parking space and these may be monitored.
• Impose penalty for illegal/wrong parking especially for those parking with-in the emergency lanes is to be prohibitive.
• Map out the residential, commercial and office buildings in the PAMP area to indicate the usage of parking spaces in the buildings. This can help to earmark parking lots that can be shared between different sharing of park-ing spaces to maximise use of available facilities.
Reducing Footprints. Kolkata report.indd 54 27/11/18 3:17 PM
55
REDUCING FOOTPRINTS: A GUIDANCE FRAMEWORK FOR CLEAN AND LOW CARBON TRANSPORT IN KOLKATA
• Demarcate the emergency vehicle route on all public roads within the neighbourhood; which would be physically demarcated in thermoplastic paint;
• No parks and green areas to be converted to parking • After provision of adequate footpaths as per codes, prioritize facilities; De-
marcate remaining space for on-street parking• Where shared Multilevel Parking facility is provided demarcate in-
gress-egress plan and ensuring that no major disruption occurs on main thoroughfare traffic. Also indicate pedestrian circulation plan.
• Within the PAMP boundary locate any uses which are empty/under-uti-lized at night time and negotiate with relevant stakeholders to make it available as a paid parking facility for residents during night/ weekends.
• To ensure most efficient utilization of land, it is recommended that in all new projects—commercial, institutional or housing—at least 50 per cent of the available parking space should be made available for shared parking facility.
• The parking contractual agreement must ensure that the revenue sharing model is dynamic and flexible, allowing for flexibility in charging and var-ied usage and rates of the parking spaces; should specify the investment that Contractor will have to make for upgradation of the PAMP area in-cluding metering, ITS application for commuter information, signages.
• Set management rules; Signage and pricing meters; IT systems for infor-mation and enforcement; penalty for illegal parking; Parking monitoring; Parking data collection and analysis for policy feed back; Street design and management of queues; Street reconstruction services; Carry out proper surveys to know the expected revenue etc.
• Penalty for illegal/wrong parking must be enough to be a deterrent. Also ensure enforcement through surprise checks.
Parkingenforcementandmanagement• Physically demarcate legal parking areas. Equip them with metering sys-
tems, proper signage, IT for information on parking availability to reduce cruising time and on-street management.
• Existing / planned public parking facilities and on-street and off-street parking (including multi-level) facilities should be bundled for manage-ment by a single agency/ operator. New stand-alone parking only sites are mostly not required since parking is permitted in all use zones.
• Parking facilities within developments (e.g. commercial/residential/insti-tutional) should be shared and priced for use by different users during dif-ferent times of the day, thus bringing down total parking space demand.
• Plan and implement parking provision for buses, commercial vehicles and IPT-NMT modes, and for the differently-abled.
Reducing Footprints. Kolkata report.indd 55 27/11/18 3:17 PM
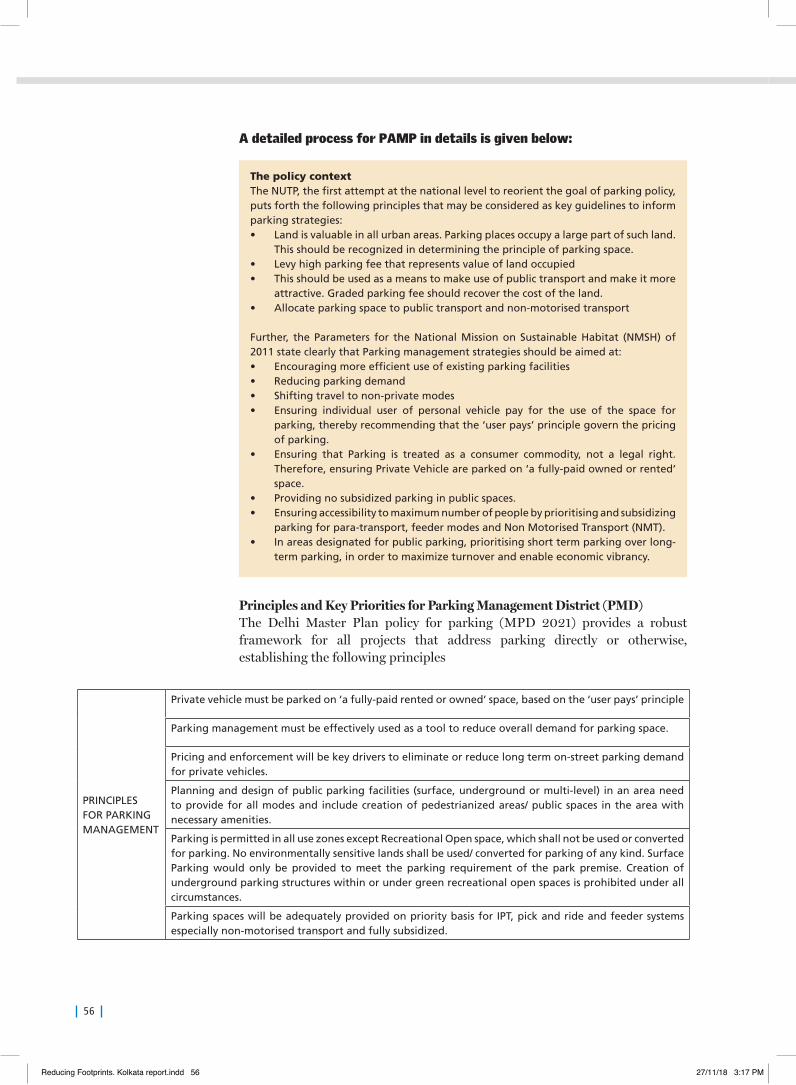
56
PrinciplesandKeyPrioritiesforParkingManagementDistrict(PMD)The Delhi Master Plan policy for parking (MPD 2021) provides a robust framework for all projects that address parking directly or otherwise, establishing the following principles
The policy contextThe NUTP, the first attempt at the national level to reorient the goal of parking policy, puts forth the following principles that may be considered as key guidelines to inform parking strategies:• Land is valuable in all urban areas. Parking places occupy a large part of such land.
This should be recognized in determining the principle of parking space. • Levy high parking fee that represents value of land occupied • This should be used as a means to make use of public transport and make it more
attractive. Graded parking fee should recover the cost of the land. • Allocate parking space to public transport and non-motorised transport
Further, the Parameters for the National Mission on Sustainable Habitat (NMSH) of 2011 state clearly that Parking management strategies should be aimed at:• Encouraging more efficient use of existing parking facilities• Reducing parking demand• Shifting travel to non-private modes• Ensuring individual user of personal vehicle pay for the use of the space for
parking, thereby recommending that the ‘user pays’ principle govern the pricing of parking.
• Ensuring that Parking is treated as a consumer commodity, not a legal right. Therefore, ensuring Private Vehicle are parked on ‘a fully-paid owned or rented’ space.
• Providing no subsidized parking in public spaces. • Ensuring accessibility to maximum number of people by prioritising and subsidizing
parking for para-transport, feeder modes and Non Motorised Transport (NMT). • In areas designated for public parking, prioritising short term parking over long-
term parking, in order to maximize turnover and enable economic vibrancy.
A detailed process for PAMP in details is given below:
PRINCIPLES FOR PARKING MANAGEMENT
Private vehicle must be parked on ‘a fully-paid rented or owned’ space, based on the ‘user pays’ principle
Parking management must be effectively used as a tool to reduce overall demand for parking space.
Pricing and enforcement will be key drivers to eliminate or reduce long term on-street parking demand for private vehicles.
Planning and design of public parking facilities (surface, underground or multi-level) in an area need to provide for all modes and include creation of pedestrianized areas/ public spaces in the area with necessary amenities.
Parking is permitted in all use zones except Recreational Open space, which shall not be used or converted for parking. No environmentally sensitive lands shall be used/ converted for parking of any kind. Surface Parking would only be provided to meet the parking requirement of the park premise. Creation of underground parking structures within or under green recreational open spaces is prohibited under all circumstances.
Parking spaces will be adequately provided on priority basis for IPT, pick and ride and feeder systems especially non-motorised transport and fully subsidized.
Reducing Footprints. Kolkata report.indd 56 27/11/18 3:17 PM
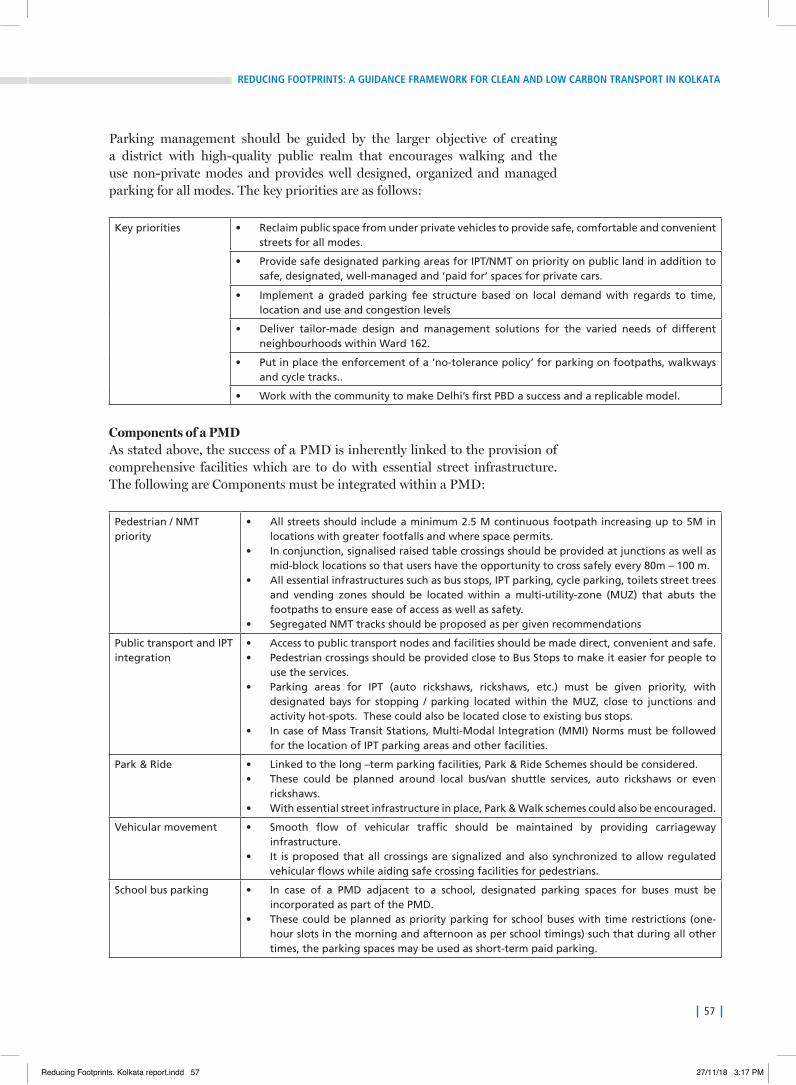
57
REDUCING FOOTPRINTS: A GUIDANCE FRAMEWORK FOR CLEAN AND LOW CARBON TRANSPORT IN KOLKATA
Parking management should be guided by the larger objective of creating a district with high-quality public realm that encourages walking and the use non-private modes and provides well designed, organized and managed parking for all modes. The key priorities are as follows:
Key priorities • Reclaim public space from under private vehicles to provide safe, comfortable and convenient streets for all modes.
• Provide safe designated parking areas for IPT/NMT on priority on public land in addition to safe, designated, well-managed and ‘paid for’ spaces for private cars.
• Implement a graded parking fee structure based on local demand with regards to time, location and use and congestion levels
• Deliver tailor-made design and management solutions for the varied needs of different neighbourhoods within Ward 162.
• Put in place the enforcement of a ‘no-tolerance policy’ for parking on footpaths, walkways and cycle tracks..
• Work with the community to make Delhi’s first PBD a success and a replicable model.
ComponentsofaPMDAs stated above, the success of a PMD is inherently linked to the provision of comprehensive facilities which are to do with essential street infrastructure. The following are Components must be integrated within a PMD:
Pedestrian / NMT priority
• All streets should include a minimum 2.5 M continuous footpath increasing up to 5M in locations with greater footfalls and where space permits.
• In conjunction, signalised raised table crossings should be provided at junctions as well as mid-block locations so that users have the opportunity to cross safely every 80m – 100 m.
• All essential infrastructures such as bus stops, IPT parking, cycle parking, toilets street trees and vending zones should be located within a multi-utility-zone (MUZ) that abuts the footpaths to ensure ease of access as well as safety.
• Segregated NMT tracks should be proposed as per given recommendations
Public transport and IPT integration
• Access to public transport nodes and facilities should be made direct, convenient and safe. • Pedestrian crossings should be provided close to Bus Stops to make it easier for people to
use the services. • Parking areas for IPT (auto rickshaws, rickshaws, etc.) must be given priority, with
designated bays for stopping / parking located within the MUZ, close to junctions and activity hot-spots. These could also be located close to existing bus stops.
• In case of Mass Transit Stations, Multi-Modal Integration (MMI) Norms must be followed for the location of IPT parking areas and other facilities.
Park & Ride • Linked to the long –term parking facilities, Park & Ride Schemes should be considered. • These could be planned around local bus/van shuttle services, auto rickshaws or even
rickshaws. • With essential street infrastructure in place, Park & Walk schemes could also be encouraged.
Vehicular movement • Smooth flow of vehicular traffic should be maintained by providing carriageway infrastructure.
• It is proposed that all crossings are signalized and also synchronized to allow regulated vehicular flows while aiding safe crossing facilities for pedestrians.
School bus parking • In case of a PMD adjacent to a school, designated parking spaces for buses must be incorporated as part of the PMD.
• These could be planned as priority parking for school buses with time restrictions (one-hour slots in the morning and afternoon as per school timings) such that during all other times, the parking spaces may be used as short-term paid parking.
Reducing Footprints. Kolkata report.indd 57 27/11/18 3:17 PM
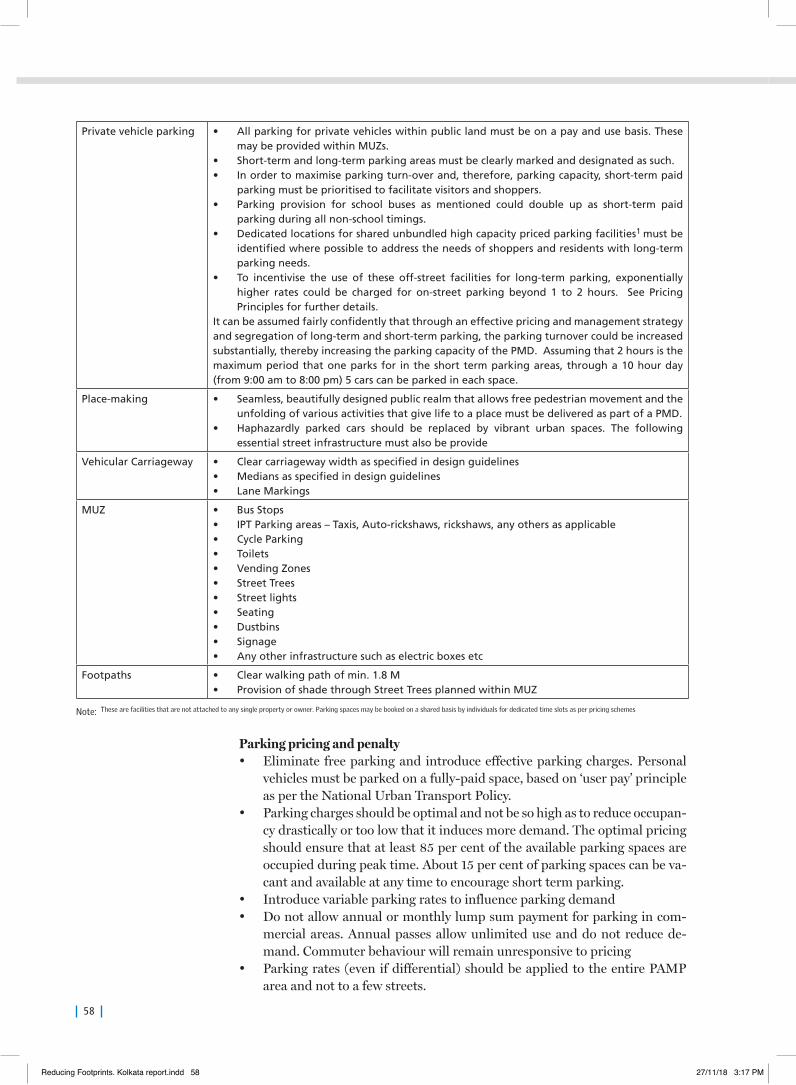
58
Private vehicle parking • All parking for private vehicles within public land must be on a pay and use basis. These may be provided within MUZs.
• Short-term and long-term parking areas must be clearly marked and designated as such. • In order to maximise parking turn-over and, therefore, parking capacity, short-term paid
parking must be prioritised to facilitate visitors and shoppers. • Parking provision for school buses as mentioned could double up as short-term paid
parking during all non-school timings. • Dedicated locations for shared unbundled high capacity priced parking facilities1 must be
identified where possible to address the needs of shoppers and residents with long-term parking needs.
• To incentivise the use of these off-street facilities for long-term parking, exponentially higher rates could be charged for on-street parking beyond 1 to 2 hours. See Pricing Principles for further details.
It can be assumed fairly confidently that through an effective pricing and management strategy and segregation of long-term and short-term parking, the parking turnover could be increased substantially, thereby increasing the parking capacity of the PMD. Assuming that 2 hours is the maximum period that one parks for in the short term parking areas, through a 10 hour day (from 9:00 am to 8:00 pm) 5 cars can be parked in each space.
Place-making • Seamless, beautifully designed public realm that allows free pedestrian movement and the unfolding of various activities that give life to a place must be delivered as part of a PMD.
• Haphazardly parked cars should be replaced by vibrant urban spaces. The following essential street infrastructure must also be provide
Vehicular Carriageway • Clear carriageway width as specified in design guidelines• Medians as specified in design guidelines• Lane Markings
MUZ • Bus Stops• IPT Parking areas – Taxis, Auto-rickshaws, rickshaws, any others as applicable• Cycle Parking • Toilets• Vending Zones• Street Trees• Street lights• Seating• Dustbins• Signage• Any other infrastructure such as electric boxes etc
Footpaths • Clear walking path of min. 1.8 M• Provision of shade through Street Trees planned within MUZ
Note: These are facilities that are not attached to any single property or owner. Parking spaces may be booked on a shared basis by individuals for dedicated time slots as per pricing schemes
Parkingpricingandpenalty• Eliminate free parking and introduce effective parking charges. Personal
vehicles must be parked on a fully-paid space, based on ‘user pay’ principle as per the National Urban Transport Policy.
• Parking charges should be optimal and not be so high as to reduce occupan-cy drastically or too low that it induces more demand. The optimal pricing should ensure that at least 85 per cent of the available parking spaces are occupied during peak time. About 15 per cent of parking spaces can be va-cant and available at any time to encourage short term parking.
• Introduce variable parking rates to influence parking demand• Do not allow annual or monthly lump sum payment for parking in com-
mercial areas. Annual passes allow unlimited use and do not reduce de-mand. Commuter behaviour will remain unresponsive to pricing
• Parking rates (even if differential) should be applied to the entire PAMP area and not to a few streets.
Reducing Footprints. Kolkata report.indd 58 27/11/18 3:17 PM
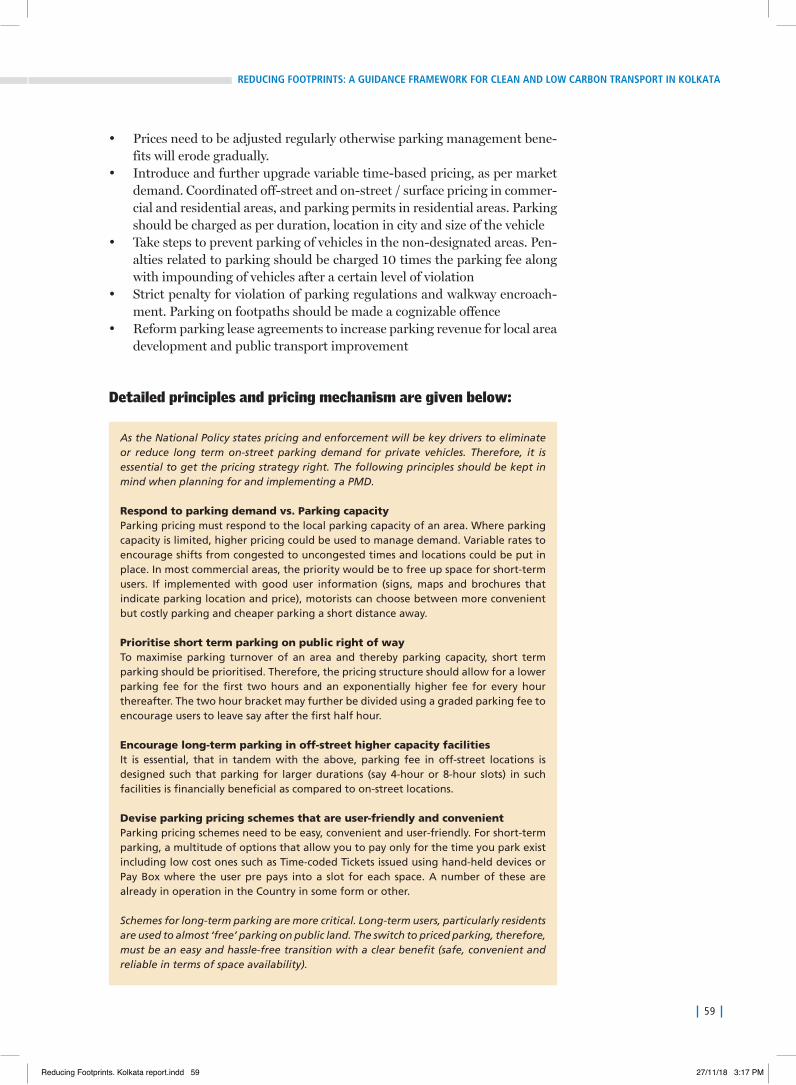
59
REDUCING FOOTPRINTS: A GUIDANCE FRAMEWORK FOR CLEAN AND LOW CARBON TRANSPORT IN KOLKATA
• Prices need to be adjusted regularly otherwise parking management bene-fits will erode gradually.
• Introduce and further upgrade variable time-based pricing, as per market demand. Coordinated off-street and on-street / surface pricing in commer-cial and residential areas, and parking permits in residential areas. Parking should be charged as per duration, location in city and size of the vehicle
• Take steps to prevent parking of vehicles in the non-designated areas. Pen-alties related to parking should be charged 10 times the parking fee along with impounding of vehicles after a certain level of violation
• Strict penalty for violation of parking regulations and walkway encroach-ment. Parking on footpaths should be made a cognizable offence
• Reform parking lease agreements to increase parking revenue for local area development and public transport improvement
Detailed principles and pricing mechanism are given below:
As the National Policy states pricing and enforcement will be key drivers to eliminate or reduce long term on-street parking demand for private vehicles. Therefore, it is essential to get the pricing strategy right. The following principles should be kept in mind when planning for and implementing a PMD.
Respond to parking demand vs. Parking capacityParking pricing must respond to the local parking capacity of an area. Where parking capacity is limited, higher pricing could be used to manage demand. Variable rates to encourage shifts from congested to uncongested times and locations could be put in place. In most commercial areas, the priority would be to free up space for short-term users. If implemented with good user information (signs, maps and brochures that indicate parking location and price), motorists can choose between more convenient but costly parking and cheaper parking a short distance away. Prioritise short term parking on public right of wayTo maximise parking turnover of an area and thereby parking capacity, short term parking should be prioritised. Therefore, the pricing structure should allow for a lower parking fee for the first two hours and an exponentially higher fee for every hour thereafter. The two hour bracket may further be divided using a graded parking fee to encourage users to leave say after the first half hour.
Encourage long-term parking in off-street higher capacity facilitiesIt is essential, that in tandem with the above, parking fee in off-street locations is designed such that parking for larger durations (say 4-hour or 8-hour slots) in such facilities is financially beneficial as compared to on-street locations.
Devise parking pricing schemes that are user-friendly and convenient Parking pricing schemes need to be easy, convenient and user-friendly. For short-term parking, a multitude of options that allow you to pay only for the time you park exist including low cost ones such as Time-coded Tickets issued using hand-held devices or Pay Box where the user pre pays into a slot for each space. A number of these are already in operation in the Country in some form or other.
Schemes for long-term parking are more critical. Long-term users, particularly residents are used to almost ‘free’ parking on public land. The switch to priced parking, therefore, must be an easy and hassle-free transition with a clear benefit (safe, convenient and reliable in terms of space availability).
Reducing Footprints. Kolkata report.indd 59 27/11/18 3:17 PM
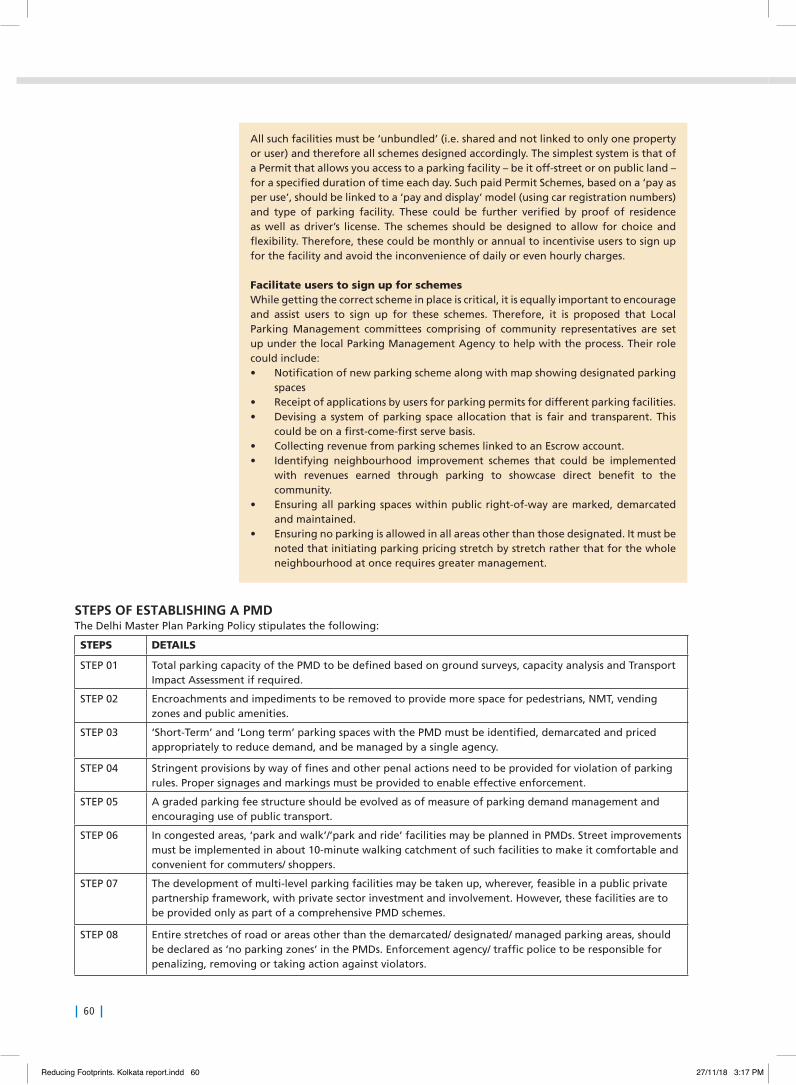
60
All such facilities must be ‘unbundled’ (i.e. shared and not linked to only one property or user) and therefore all schemes designed accordingly. The simplest system is that of a Permit that allows you access to a parking facility – be it off-street or on public land – for a specified duration of time each day. Such paid Permit Schemes, based on a ‘pay as per use’, should be linked to a ‘pay and display’ model (using car registration numbers) and type of parking facility. These could be further verified by proof of residence as well as driver’s license. The schemes should be designed to allow for choice and flexibility. Therefore, these could be monthly or annual to incentivise users to sign up for the facility and avoid the inconvenience of daily or even hourly charges.
Facilitate users to sign up for schemes While getting the correct scheme in place is critical, it is equally important to encourage and assist users to sign up for these schemes. Therefore, it is proposed that Local Parking Management committees comprising of community representatives are set up under the local Parking Management Agency to help with the process. Their role could include:• Notification of new parking scheme along with map showing designated parking
spaces• Receipt of applications by users for parking permits for different parking facilities.• Devising a system of parking space allocation that is fair and transparent. This
could be on a first-come-first serve basis.• Collecting revenue from parking schemes linked to an Escrow account.• Identifying neighbourhood improvement schemes that could be implemented
with revenues earned through parking to showcase direct benefit to the community.
• Ensuring all parking spaces within public right-of-way are marked, demarcated and maintained.
• Ensuring no parking is allowed in all areas other than those designated. It must be noted that initiating parking pricing stretch by stretch rather that for the whole neighbourhood at once requires greater management.
STEPS OF ESTABLISHING A PMDThe Delhi Master Plan Parking Policy stipulates the following:
STEPS DETAILS
STEP 01 Total parking capacity of the PMD to be defined based on ground surveys, capacity analysis and Transport Impact Assessment if required.
STEP 02 Encroachments and impediments to be removed to provide more space for pedestrians, NMT, vending zones and public amenities.
STEP 03 ‘Short-Term’ and ‘Long term’ parking spaces with the PMD must be identified, demarcated and priced appropriately to reduce demand, and be managed by a single agency.
STEP 04 Stringent provisions by way of fines and other penal actions need to be provided for violation of parking rules. Proper signages and markings must be provided to enable effective enforcement.
STEP 05 A graded parking fee structure should be evolved as of measure of parking demand management and encouraging use of public transport.
STEP 06 In congested areas, ‘park and walk’/’park and ride’ facilities may be planned in PMDs. Street improvements must be implemented in about 10-minute walking catchment of such facilities to make it comfortable and convenient for commuters/ shoppers.
STEP 07 The development of multi-level parking facilities may be taken up, wherever, feasible in a public private partnership framework, with private sector investment and involvement. However, these facilities are to be provided only as part of a comprehensive PMD schemes.
STEP 08 Entire stretches of road or areas other than the demarcated/ designated/ managed parking areas, should be declared as ‘no parking zones’ in the PMDs. Enforcement agency/ traffic police to be responsible for penalizing, removing or taking action against violators.
Reducing Footprints. Kolkata report.indd 60 27/11/18 3:17 PM
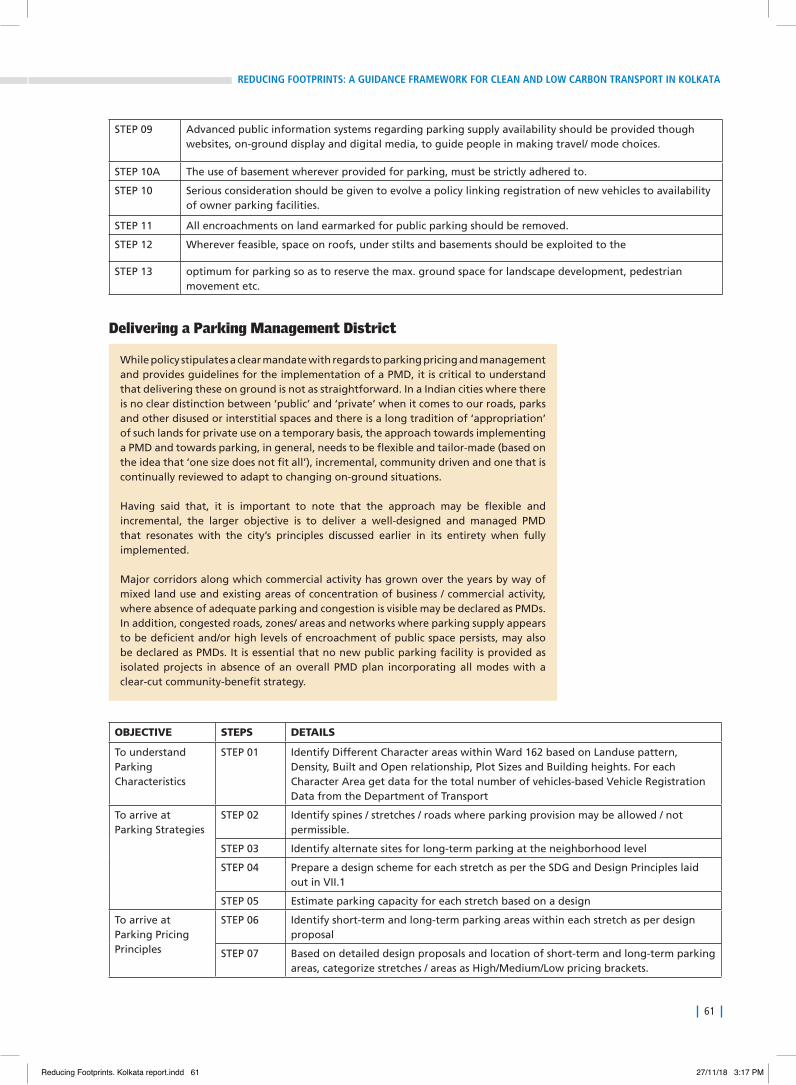
61
REDUCING FOOTPRINTS: A GUIDANCE FRAMEWORK FOR CLEAN AND LOW CARBON TRANSPORT IN KOLKATA
While policy stipulates a clear mandate with regards to parking pricing and management and provides guidelines for the implementation of a PMD, it is critical to understand that delivering these on ground is not as straightforward. In a Indian cities where there is no clear distinction between ‘public’ and ‘private’ when it comes to our roads, parks and other disused or interstitial spaces and there is a long tradition of ‘appropriation’ of such lands for private use on a temporary basis, the approach towards implementing a PMD and towards parking, in general, needs to be flexible and tailor-made (based on the idea that ‘one size does not fit all’), incremental, community driven and one that is continually reviewed to adapt to changing on-ground situations.
Having said that, it is important to note that the approach may be flexible and incremental, the larger objective is to deliver a well-designed and managed PMD that resonates with the city’s principles discussed earlier in its entirety when fully implemented.
Major corridors along which commercial activity has grown over the years by way of mixed land use and existing areas of concentration of business / commercial activity, where absence of adequate parking and congestion is visible may be declared as PMDs. In addition, congested roads, zones/ areas and networks where parking supply appears to be deficient and/or high levels of encroachment of public space persists, may also be declared as PMDs. It is essential that no new public parking facility is provided as isolated projects in absence of an overall PMD plan incorporating all modes with a clear-cut community-benefit strategy.
STEP 09 Advanced public information systems regarding parking supply availability should be provided though websites, on-ground display and digital media, to guide people in making travel/ mode choices.
STEP 10A The use of basement wherever provided for parking, must be strictly adhered to.
STEP 10 Serious consideration should be given to evolve a policy linking registration of new vehicles to availability of owner parking facilities.
STEP 11 All encroachments on land earmarked for public parking should be removed.
STEP 12 Wherever feasible, space on roofs, under stilts and basements should be exploited to the
STEP 13 optimum for parking so as to reserve the max. ground space for landscape development, pedestrian movement etc.
OBJECTIVE STEPS DETAILS
To understand Parking Characteristics
STEP 01 Identify Different Character areas within Ward 162 based on Landuse pattern, Density, Built and Open relationship, Plot Sizes and Building heights. For each Character Area get data for the total number of vehicles-based Vehicle Registration Data from the Department of Transport
To arrive at Parking Strategies
STEP 02 Identify spines / stretches / roads where parking provision may be allowed / not permissible.
STEP 03 Identify alternate sites for long-term parking at the neighborhood level
STEP 04 Prepare a design scheme for each stretch as per the SDG and Design Principles laid out in VII.1
STEP 05 Estimate parking capacity for each stretch based on a design
To arrive at Parking Pricing Principles
STEP 06 Identify short-term and long-term parking areas within each stretch as per design proposal
STEP 07 Based on detailed design proposals and location of short-term and long-term parking areas, categorize stretches / areas as High/Medium/Low pricing brackets.
Delivering a Parking Management District
Reducing Footprints. Kolkata report.indd 61 27/11/18 3:17 PM
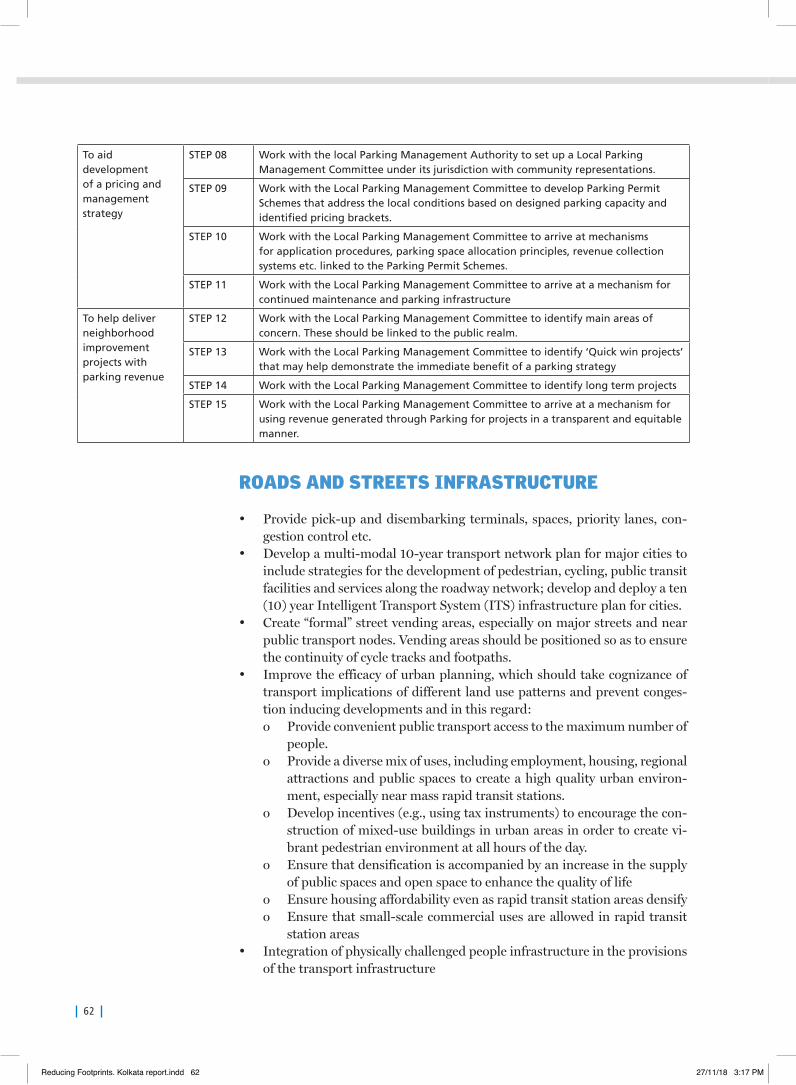
62
To aid development of a pricing and management strategy
STEP 08 Work with the local Parking Management Authority to set up a Local Parking Management Committee under its jurisdiction with community representations.
STEP 09 Work with the Local Parking Management Committee to develop Parking Permit Schemes that address the local conditions based on designed parking capacity and identified pricing brackets.
STEP 10 Work with the Local Parking Management Committee to arrive at mechanisms for application procedures, parking space allocation principles, revenue collection systems etc. linked to the Parking Permit Schemes.
STEP 11 Work with the Local Parking Management Committee to arrive at a mechanism for continued maintenance and parking infrastructure
To help deliver neighborhood improvement projects with parking revenue
STEP 12 Work with the Local Parking Management Committee to identify main areas of concern. These should be linked to the public realm.
STEP 13 Work with the Local Parking Management Committee to identify ‘Quick win projects’ that may help demonstrate the immediate benefit of a parking strategy
STEP 14 Work with the Local Parking Management Committee to identify long term projects
STEP 15 Work with the Local Parking Management Committee to arrive at a mechanism for using revenue generated through Parking for projects in a transparent and equitable manner.
ROADS AND STREETS INFRASTRUCTURE
• Provide pick-up and disembarking terminals, spaces, priority lanes, con-gestion control etc.
• Develop a multi-modal 10-year transport network plan for major cities to include strategies for the development of pedestrian, cycling, public transit facilities and services along the roadway network; develop and deploy a ten (10) year Intelligent Transport System (ITS) infrastructure plan for cities.
• Create “formal” street vending areas, especially on major streets and near public transport nodes. Vending areas should be positioned so as to ensure the continuity of cycle tracks and footpaths.
• Improve the efficacy of urban planning, which should take cognizance of transport implications of different land use patterns and prevent conges-tion inducing developments and in this regard:o Provide convenient public transport access to the maximum number of
people.o Provide a diverse mix of uses, including employment, housing, regional
attractions and public spaces to create a high quality urban environ-ment, especially near mass rapid transit stations.
o Develop incentives (e.g., using tax instruments) to encourage the con-struction of mixed-use buildings in urban areas in order to create vi-brant pedestrian environment at all hours of the day.
o Ensure that densification is accompanied by an increase in the supply of public spaces and open space to enhance the quality of life
o Ensure housing affordability even as rapid transit station areas densifyo Ensure that small-scale commercial uses are allowed in rapid transit
station areas• Integration of physically challenged people infrastructure in the provisions
of the transport infrastructure
Reducing Footprints. Kolkata report.indd 62 27/11/18 3:17 PM
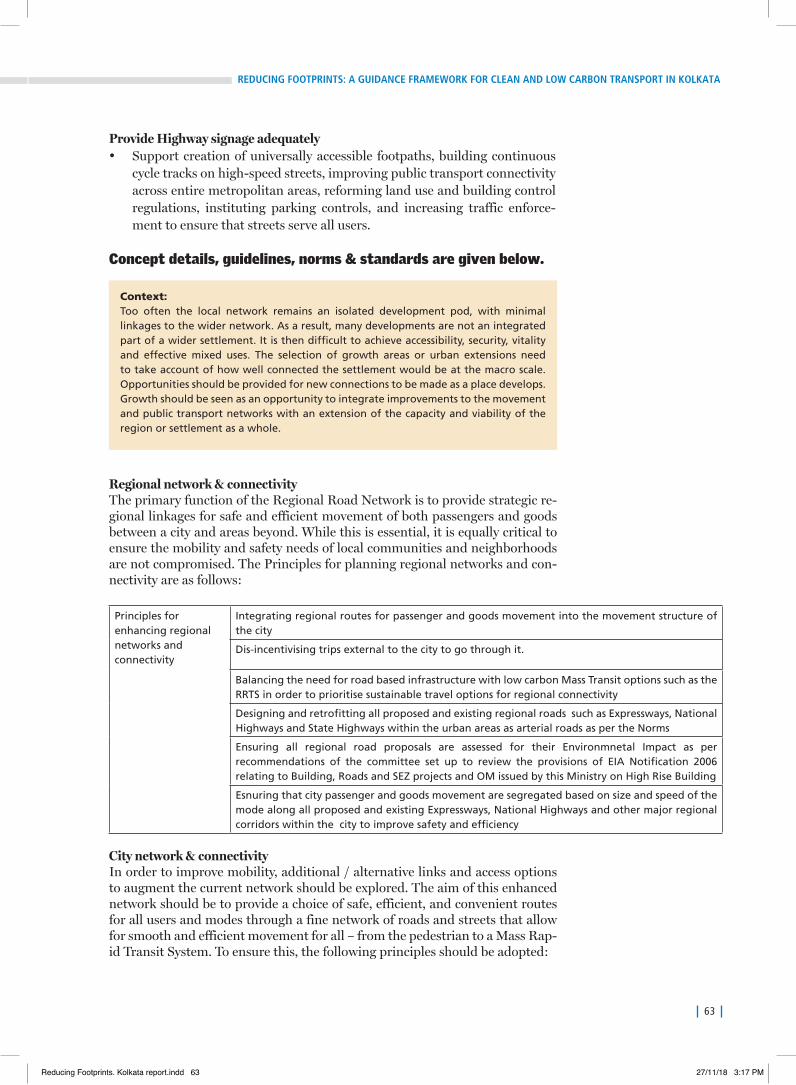
63
REDUCING FOOTPRINTS: A GUIDANCE FRAMEWORK FOR CLEAN AND LOW CARBON TRANSPORT IN KOLKATA
ProvideHighwaysignageadequately• Support creation of universally accessible footpaths, building continuous
cycle tracks on high-speed streets, improving public transport connectivity across entire metropolitan areas, reforming land use and building control regulations, instituting parking controls, and increasing traffic enforce-ment to ensure that streets serve all users.
Context:Too often the local network remains an isolated development pod, with minimal linkages to the wider network. As a result, many developments are not an integrated part of a wider settlement. It is then difficult to achieve accessibility, security, vitality and effective mixed uses. The selection of growth areas or urban extensions need to take account of how well connected the settlement would be at the macro scale. Opportunities should be provided for new connections to be made as a place develops. Growth should be seen as an opportunity to integrate improvements to the movement and public transport networks with an extension of the capacity and viability of the region or settlement as a whole.
Concept details, guidelines, norms & standards are given below.
Regionalnetwork&connectivityThe primary function of the Regional Road Network is to provide strategic re-gional linkages for safe and efficient movement of both passengers and goods between a city and areas beyond. While this is essential, it is equally critical to ensure the mobility and safety needs of local communities and neighborhoods are not compromised. The Principles for planning regional networks and con-nectivity are as follows:
Principles for enhancing regional networks and connectivity
Integrating regional routes for passenger and goods movement into the movement structure of the city
Dis-incentivising trips external to the city to go through it.
Balancing the need for road based infrastructure with low carbon Mass Transit options such as the RRTS in order to prioritise sustainable travel options for regional connectivity
Designing and retrofitting all proposed and existing regional roads such as Expressways, National Highways and State Highways within the urban areas as arterial roads as per the Norms
Ensuring all regional road proposals are assessed for their Environmnetal Impact as per recommendations of the committee set up to review the provisions of EIA Notification 2006 relating to Building, Roads and SEZ projects and OM issued by this Ministry on High Rise Building
Esnuring that city passenger and goods movement are segregated based on size and speed of the mode along all proposed and existing Expressways, National Highways and other major regional corridors within the city to improve safety and efficiency
Citynetwork&connectivityIn order to improve mobility, additional / alternative links and access options to augment the current network should be explored. The aim of this enhanced network should be to provide a choice of safe, efficient, and convenient routes for all users and modes through a fine network of roads and streets that allow for smooth and efficient movement for all – from the pedestrian to a Mass Rap-id Transit System. To ensure this, the following principles should be adopted:
Reducing Footprints. Kolkata report.indd 63 27/11/18 3:17 PM
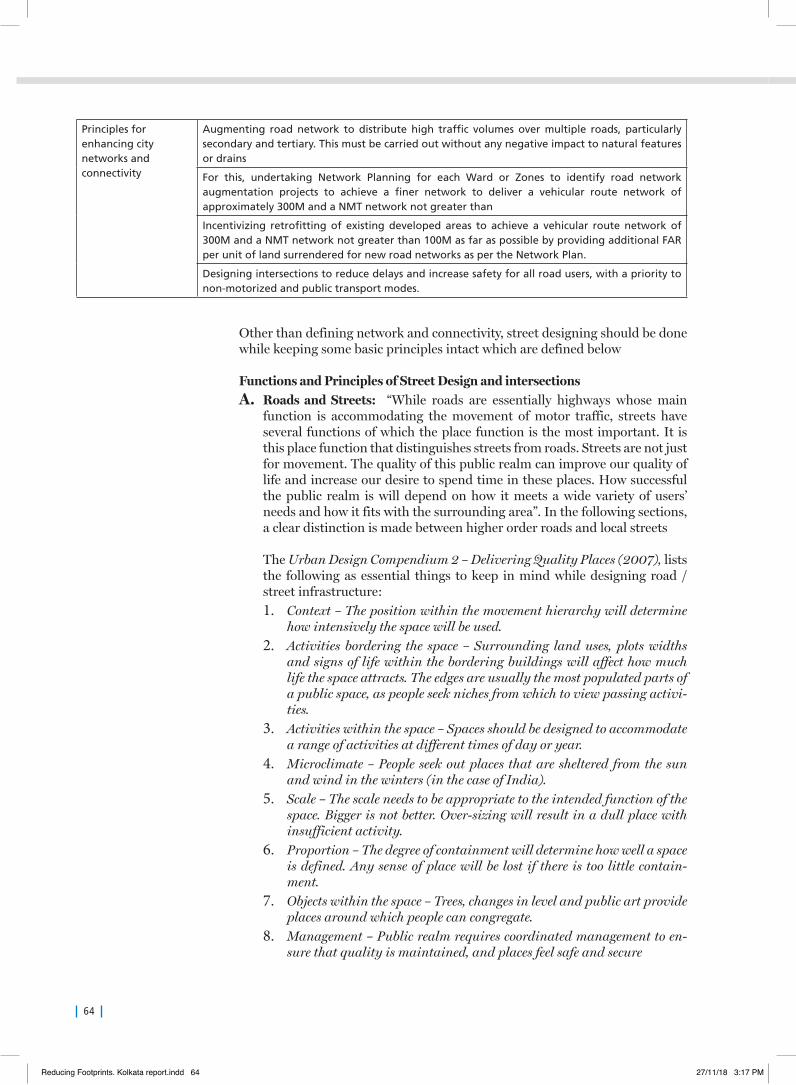
64
Other than defining network and connectivity, street designing should be done while keeping some basic principles intact which are defined below
FunctionsandPrinciplesofStreetDesignandintersectionsA. Roads and Streets: “While roads are essentially highways whose main
function is accommodating the movement of motor traffic, streets have several functions of which the place function is the most important. It is this place function that distinguishes streets from roads. Streets are not just for movement. The quality of this public realm can improve our quality of life and increase our desire to spend time in these places. How successful the public realm is will depend on how it meets a wide variety of users’ needs and how it fits with the surrounding area”. In the following sections, a clear distinction is made between higher order roads and local streets
The Urban Design Compendium 2 – Delivering Quality Places (2007), lists the following as essential things to keep in mind while designing road / street infrastructure: 1. Context – The position within the movement hierarchy will determine
how intensively the space will be used. 2. Activities bordering the space – Surrounding land uses, plots widths
and signs of life within the bordering buildings will affect how much life the space attracts. The edges are usually the most populated parts of a public space, as people seek niches from which to view passing activi-ties.
3. Activities within the space – Spaces should be designed to accommodate a range of activities at different times of day or year.
4. Microclimate – People seek out places that are sheltered from the sun and wind in the winters (in the case of India).
5. Scale – The scale needs to be appropriate to the intended function of the space. Bigger is not better. Over-sizing will result in a dull place with insufficient activity.
6. Proportion – The degree of containment will determine how well a space is defined. Any sense of place will be lost if there is too little contain-ment.
7. Objects within the space – Trees, changes in level and public art provide places around which people can congregate.
8. Management – Public realm requires coordinated management to en-sure that quality is maintained, and places feel safe and secure
Principles for enhancing city networks and connectivity
Augmenting road network to distribute high traffic volumes over multiple roads, particularly secondary and tertiary. This must be carried out without any negative impact to natural features or drains
For this, undertaking Network Planning for each Ward or Zones to identify road network augmentation projects to achieve a finer network to deliver a vehicular route network of approximately 300M and a NMT network not greater than
Incentivizing retrofitting of existing developed areas to achieve a vehicular route network of 300M and a NMT network not greater than 100M as far as possible by providing additional FAR per unit of land surrendered for new road networks as per the Network Plan.
Designing intersections to reduce delays and increase safety for all road users, with a priority to non-motorized and public transport modes.
Reducing Footprints. Kolkata report.indd 64 27/11/18 3:17 PM
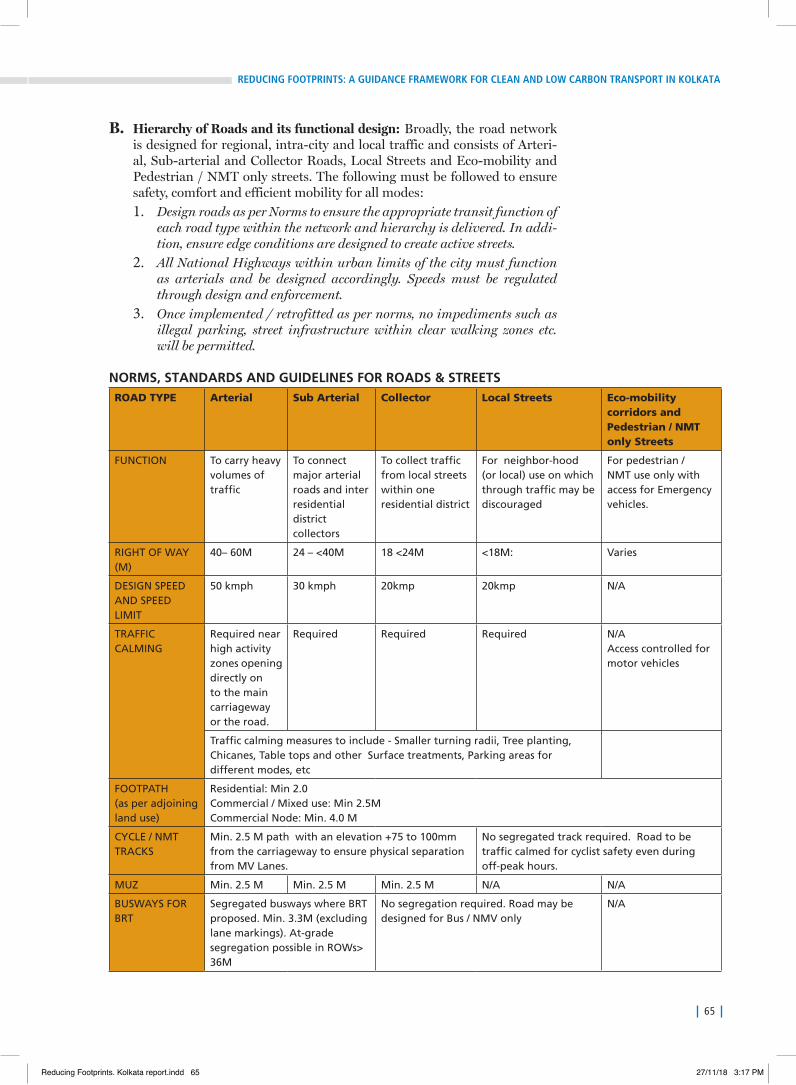
65
REDUCING FOOTPRINTS: A GUIDANCE FRAMEWORK FOR CLEAN AND LOW CARBON TRANSPORT IN KOLKATA
B. HierarchyofRoadsanditsfunctionaldesign: Broadly, the road network is designed for regional, intra-city and local traffic and consists of Arteri-al, Sub-arterial and Collector Roads, Local Streets and Eco-mobility and Pedestrian / NMT only streets. The following must be followed to ensure safety, comfort and efficient mobility for all modes:1. Design roads as per Norms to ensure the appropriate transit function of
each road type within the network and hierarchy is delivered. In addi-tion, ensure edge conditions are designed to create active streets.
2. All National Highways within urban limits of the city must function as arterials and be designed accordingly. Speeds must be regulated through design and enforcement.
3. Once implemented / retrofitted as per norms, no impediments such as illegal parking, street infrastructure within clear walking zones etc. will be permitted.
NORMS, STANDARDS AND GUIDELINES FOR ROADS & STREETSROAD TYPE Arterial Sub Arterial Collector Local Streets Eco-mobility
corridors and Pedestrian / NMT only Streets
FUNCTION To carry heavy volumes of traffic
To connect major arterial roads and inter residential district collectors
To collect traffic from local streets within one residential district
For neighbor-hood (or local) use on which through traffic may be discouraged
For pedestrian / NMT use only with access for Emergency vehicles.
RIGHT OF WAY (M)
40– 60M 24 – <40M 18 <24M <18M: Varies
DESIGN SPEED AND SPEED LIMIT
50 kmph 30 kmph 20kmp 20kmp N/A
TRAFFIC CALMING
Required near high activity zones opening directly on to the main carriageway or the road.
Required Required Required N/AAccess controlled for motor vehicles
Traffic calming measures to include - Smaller turning radii, Tree planting, Chicanes, Table tops and other Surface treatments, Parking areas for different modes, etc
FOOTPATH(as per adjoining land use)
Residential: Min 2.0Commercial / Mixed use: Min 2.5MCommercial Node: Min. 4.0 M
CYCLE / NMT TRACKS
Min. 2.5 M path with an elevation +75 to 100mm from the carriageway to ensure physical separation from MV Lanes.
No segregated track required. Road to be traffic calmed for cyclist safety even during off-peak hours.
MUZ Min. 2.5 M Min. 2.5 M Min. 2.5 M N/A N/A
BUSWAYS FOR BRT
Segregated busways where BRT proposed. Min. 3.3M (excluding lane markings). At-grade segregation possible in ROWs> 36M
No segregation required. Road may be designed for Bus / NMV only
N/A
Reducing Footprints. Kolkata report.indd 65 27/11/18 3:17 PM
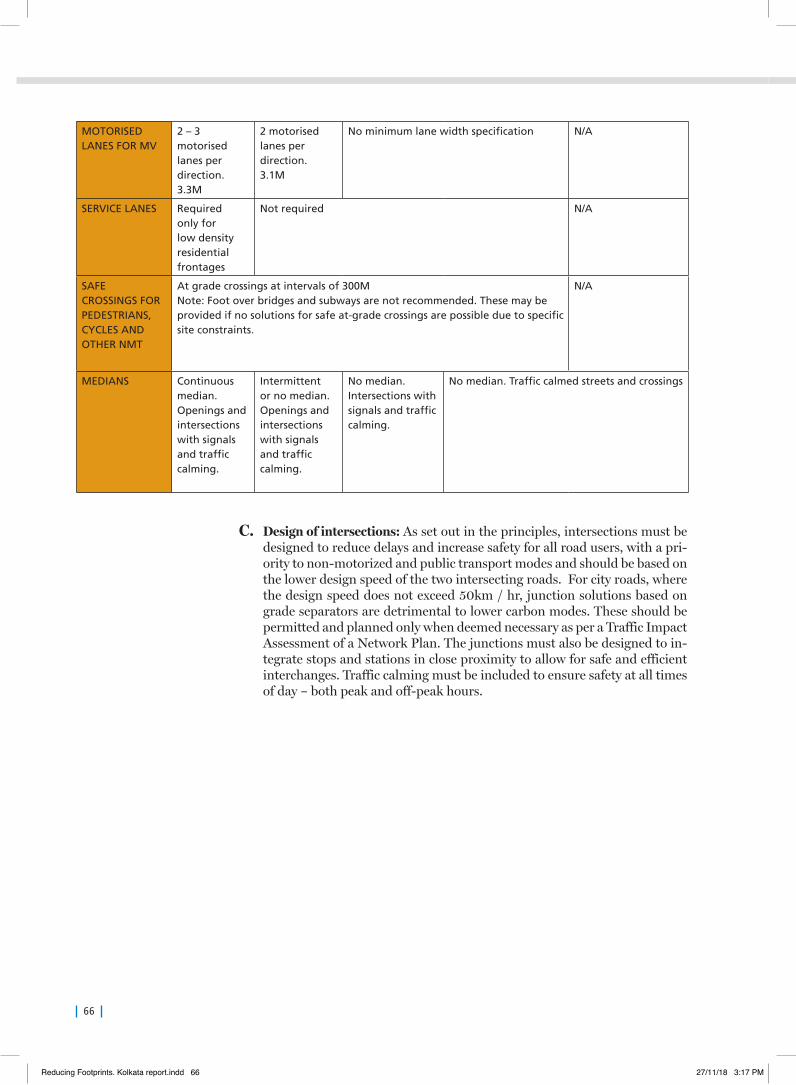
66
C. Designofintersections:As set out in the principles, intersections must be designed to reduce delays and increase safety for all road users, with a pri-ority to non-motorized and public transport modes and should be based on the lower design speed of the two intersecting roads. For city roads, where the design speed does not exceed 50km / hr, junction solutions based on grade separators are detrimental to lower carbon modes. These should be permitted and planned only when deemed necessary as per a Traffic Impact Assessment of a Network Plan. The junctions must also be designed to in-tegrate stops and stations in close proximity to allow for safe and efficient interchanges. Traffic calming must be included to ensure safety at all times of day – both peak and off-peak hours.
MOTORISED LANES FOR MV
2 – 3 motorised lanes per direction. 3.3M
2 motorised lanes per direction. 3.1M
No minimum lane width specification N/A
SERVICE LANES Required only for low density residential frontages
Not required N/A
SAFE CROSSINGS FOR PEDESTRIANS, CYCLES AND OTHER NMT
At grade crossings at intervals of 300MNote: Foot over bridges and subways are not recommended. These may be provided if no solutions for safe at-grade crossings are possible due to specific site constraints.
N/A
MEDIANS Continuous median. Openings and intersections with signals and traffic calming.
Intermittent or no median. Openings and intersections with signals and traffic calming.
No median. Intersections with signals and traffic calming.
No median. Traffic calmed streets and crossings
Reducing Footprints. Kolkata report.indd 66 27/11/18 3:17 PM
67
REDUCING FOOTPRINTS: A GUIDANCE FRAMEWORK FOR CLEAN AND LOW CARBON TRANSPORT IN KOLKATA
FREIGHT TRANSPORTATION
• Developing Urban freight centres in relation to location of warehouses rel-ative to suburban areas
• Provide truck rest areas/parks along national and international highways across the country to facilitate haulage of goods and carriage of persons
• Use off-peak passenger travel times to move freight and restriction of the entry of heavy vehicles into cities during the day will be pursued
• Creating management systems for loading and unloading of goods in city areas
• Weigh bridges and monitoring equipments to ensure better quality and more efficient vehicles would be installed at strategic locations with per-sonnel to manage its operations
• Develop a Safe-to-Load programme to ensure fitness of trucks and compli-ance to set standards would be adopted and enforced
• Ensure road worthiness and fitness test for all commercial vehicles• Implement Euro IV engine as the minimum standard for vehicle emission
PASSENGER TRANSPORTATION
• Implement Euro IV engine as the minimum standard for vehicle emission• Creating congestion charges in high traffic urban centres to decongest
roads• Creation of Road Authority to regulate all road related activities• Instituting Passenger transit insurance policy• National Urban Transport Policy will require synergy with the Nation-
al Auto Fuel Policy to ensure clean vehicle technology and clean fuels are adopted by all public transport modes as well as personal modes along with linking of electric mobility with public transport strategy.
• This should be supported by robust emissions and road-worthiness inspec-tion and check on import of old and used vehicles.
MANAGEMENT OF IN-USE EMISSIONS FROM ON-ROAD VEHICLES
• Regular Auditing of Pollution under Control (PUC) certification centres.• Implement an on-board diagnostic system fitted in new vehicles for vehicle
inspection. Improve facilities for its implementation.• Link PUC certificates with annual vehicle insurance to ensure 100 per cent
compliance.• Enforcement of law against visibly polluting vehicles: impose penalty,
launch extensive awareness drive against polluting vehicles. • Upgrade inspection system for new generation vehicles. • Expand remote sensing monitoring • Label and tag all vehicles according to their emissions standards and fuels
that they use. Older and polluting vehicles may be discouraged in city cen-tres or earmarked low emissions zones.
Reducing Footprints. Kolkata report.indd 67 27/11/18 3:17 PM
68
TRAFFIC MANAGEMENT
• The Government would encourage cities to prepare traffic management plan for the city and to continuously update it and monitor its performance.
• Introduce early alarm system during traffic congestion for the benefit of commuters on major routes, to facilitate route diversion
• Consider introducing plan for flexi/staggered timings to minimize peak movement of vehicles on roads
• Synchronize traffic movements / introduce intelligent traffic systems for lane-driving. Kolkata has taken significant steps in this direction.
• Formulate action plan for controlling decongestion of fuel stations includ-ing increasing the number of dispensing machines
• Electronic monitoring of traffic violations• Examine existing framework for removing broken down buses / trucks
from roads and create a system for speedy removal and ensuring minimal disruption to traffic from such buses/trucks
• Conduct audit of traffic intersections and install functional traffic signals at all major intersections
• Conduct review of traffic signalling system at all intersections• Enforce lane driving through heavy fining
NEED FOR TRAFFIC IMPACT ASSESSMENT FOR ALL INFRASTRUCTURE AND DEVELOPMENTS
• Permit new developments based on the impact of traffic on the surround-ing transport infrastructure
• Make necessary infrastructure augmentations based on traffic impact as-sessments and levy costs to the developer, if needed and possible.
WATER TRANSPORT
The three basic steps to be taken by cities to develop waterways would be: • To identify, plan and develop fairway or navigational channel with desired
width and depth. • Navigational aids for safe navigation and • Augment capacity of terminals for berthing of vessels, loading/unloading of
cargo and for providing interface with road and other public transit modes.
FINANCING OF PUBLIC TRANSPORT
• Create dedicated and ring fenced urban transport fund for meeting Urban Transport needs by adopting innovative financial instruments to mobilise local resources including land value capture and polluter pay principle
• Extent of resources likely from private participation • Willingness to divert funds from projects that add to road capacity towards
public transit systems Encourage involvement of the private sector in activities such as operation
and maintenance of road infrastructure, parking facilities, vehicle testing and certification facilities, repair facilities, construction and management of terminal facilities among others. Regulatory monitoring will be required
Reducing Footprints. Kolkata report.indd 68 27/11/18 3:17 PM
69
REDUCING FOOTPRINTS: A GUIDANCE FRAMEWORK FOR CLEAN AND LOW CARBON TRANSPORT IN KOLKATA
for quality control, quality assurance and performance guarantee. The private sector will be involved in providing public transport services,
but under well-structured procurement contracts along with strong super-vision of their service level and compliance strategy.
IMPROVE CAPACITY
• Capacity Building - Training and skill development will be required of public officials and other public functionaries for urban transport planning and management of city transport. This will also require capacity building for urban inclusive road design, and infrastructure planning.
• Database - Regular update of the database and information would be one of the important tasks. This will require standardization of database for recording of travel and transport related activities to be able to assess travel activities and trips, nature of travel demand, and changes in modal share.
RESEARCH, DEVELOPMENT AND TECHNOLOGY UPGRADE
• Initiate new schemes for innovation, research and development in urban transport to promote indigenization and development of low-cost tech-nologies, pilot projects, public bicycle scheme to connect public transport nodes, improvement of para-transit through Intelligent Transport Systems and setting up of a research, and design cell for rail transit.
NEED FOR PUBLIC AWARENESS AND COOPERATION
• Organizing deeper public engagement and forums for pubic consultation for public understanding of the nature of solutions needed to address the complex problem of sustainable mobility.
• Intensive awareness campaigns to educate people about the adverse effects of growing urban transport problems in urban areas, especially on their health and well-being.
Reducing Footprints. Kolkata report.indd 69 27/11/18 3:17 PM
70
REFERENCES1. Comprehensive Mobility Plan for Kolkata, 20092. Implementation plan for electrification of public transportation in Kolka-
ta, ISGF, 20173. Centre for Policy Research and iTrans, 2016, Draft report on Integrating
intermediate public transport within transport regulation in a megacity re-gion, New Delhi
4. Comprehensive Mobility Plan for Kolkata5. Ibid.6. Parking touts take city for ride - The Times of India http://timesofindia.
indiatimes.com/city/kolkata-/Parking-touts-take-city-for-ride/article-show/7471782.cms#ixzz1EyQi6uwl, Feb 11, 2011
7. Comprehensive Mobility Plan for Kolkata
Reducing Footprints. Kolkata report.indd 70 27/11/18 3:17 PM

Reducing Footprints. Kolkata report.indd 71 27/11/18 3:17 PM
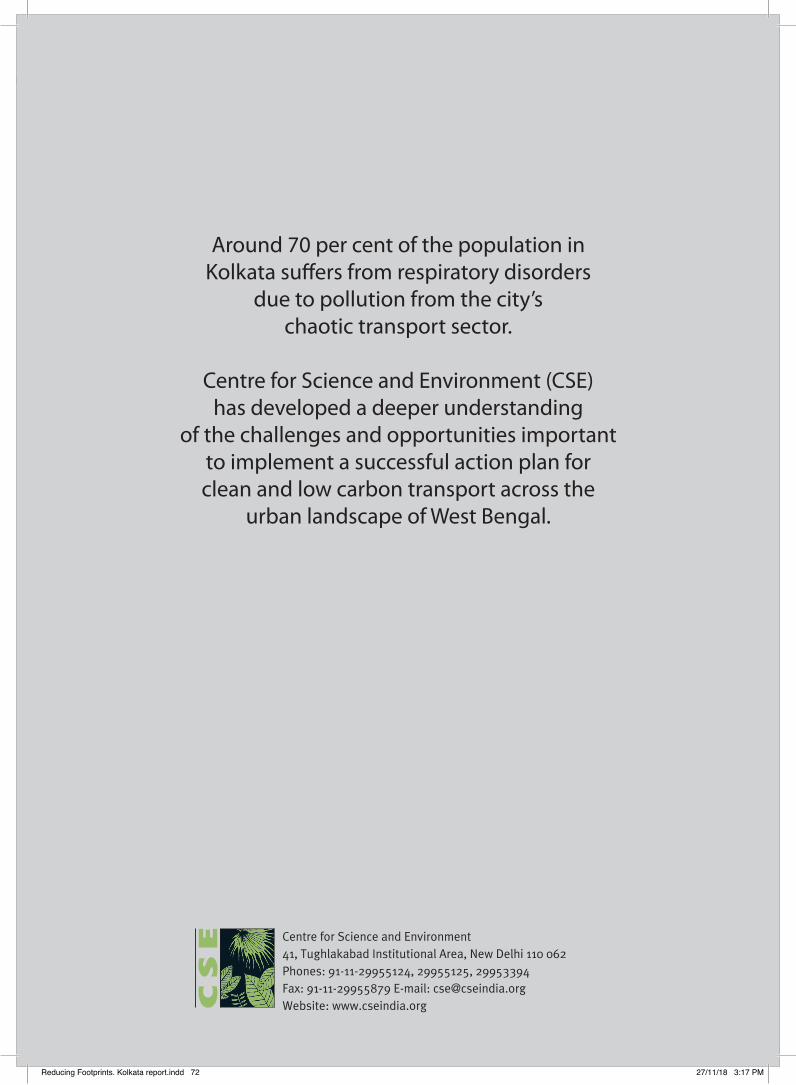
72
Centre for Science and Environment41, Tughlakabad Institutional Area, New Delhi 110 062Phones: 91-11-29955124, 29955125, 29953394Fax: 91-11-29955879 E-mail: [email protected] Website: www.cseindia.org
Around 70 per cent of the population in Kolkata suffers from respiratory disorders
due to pollution from the city’s chaotic transport sector.
Centre for Science and Environment (CSE) has developed a deeper understanding
of the challenges and opportunities important to implement a successful action plan for clean and low carbon transport across the
urban landscape of West Bengal.
Reducing Footprints. Kolkata report.indd 72 27/11/18 3:17 PM